
Abstract
Today, most of the databases used for drug information mining are derived from the collection of many treatments under a single disease, and some special drug compatibility rules can be found from them. However, researchers’ exploration of medical data is not limited to this. The comparative analysis of drugs for different diseases has become a new research point. In this paper, the drug is used as a node, the relationship is the edge connecting the two nodes, the co-occurrence frequency of the drug is used as the weight of the edge to establish a network graph. We use the clustering algorithm of the weighted network graph center diffusion method combining the network topology and the edge weights to divide the network graph into communities. Then we proposed the Structural Clustering Algorithm on Weighted Networks (SCW), it helps to study the prescription of medical prescriptions and provides more scientific recommendations for auxiliary prescriptions. In the experiment, SCW is compared with the classic community discovery algorithm CPM, the network function modular analysis algorithm MCODE and the hierarchical network graph structure analysis algorithm BGLL. We analyze the results according to NMI, ARI and F-Measure. Finally, a case study of real data was conducted to ensure the correctness and effectiveness of the algorithm, and to obtain the potential drug combination in the medical prescription.
Introduction
Traditional association rule mining has some drawbacks in the process of exploring drug compatibility. It can only analyze the medication rules for a disease based on a large number of medical prescriptions for a certain disease, 1 and cannot take into account the use of drugs between related diseases. 2 Exploring the common use of medicines between different diseases helps experimental researchers to explore the core medicines prescribed,3,4 and also provides clues and goals for clinical researchers to explore further. In this way, not only can we more objectively confirm and reproduce the existing disease medication laws,5,6 but also discover new knowledge and clues, and make more contributions to the research of medical data.
The development of the times has not only caused a sharp increase in the number of data, but also showed a diversified trend in the storage form, 7 which includes text data, traditional relational data and network graph data. 8 Compared with relational databases, graph databases have obvious advantages in performance, flexibility, and excavability. These advantages are mainly reflected in 9 : (1) Performance. When the number and depth of the graph database increase, the query time is basically unchanged. But the data of the relational database is stored in a two-dimensional table structure in the form of records. When the number and depth of the relationships between the data increase, the time used by the relational database to query the relationship increases sharply, or even collapses. For example, in the communication network, querying the combination of two points whose maximum depth is a specified value. (2) Flexibility. The graph database data is extensible, and new nodes can be added at any time according to the needs. This will not affect current functionality. However, the relational database needs to consider the existing table structure when adding relationships, and the scalability is relatively lower. (3) Excavability. The graph database focuses on the correlation between the stored data, which helps to discover and mine the potential relationship between nodes in the huge and complex relationship network. These relationships are difficult to find in traditional relational databases.
In recent years, research on various complex networks is one of the hotspots in many fields. For example, biological networks, 10 social networks, 11 e-mail networks, citation networks, etc. have become the main research objects of many scholars. 12 Among them, medical data mining has always been a hot issue in the field of complex network graph data research. Cluster analysis is a commonly used data mining method that can extract unknown but potentially valid information from a huge database. However, the explosion of data volume makes network graph data extremely complicated. A series of nodes and edges are connected to each other to form a dense or sparse community structure. The nodes within these communities are closely related, while the nodes between communities are relatively sparsely related. 13 Designing a reasonable algorithm to classify the nodes in the complex network graph according to the close relationship between the nodes helps us to better discover and utilize the potential functions and values in the network graph. 14 Therefore, it is of great theoretical significance and application value to classify communities in complex networks.
At present, the research on complex networks is more oriented to undirected and unweighted networks. Saito et al. 15 use k-dense algorithm to divide community networks. Newman et al. 16 divided clusters based on graphs so that closely connected nodes were assigned to the same group. Then use spectral analysis clustering to express the relationship between the nodes as a distance. The closer the distance is, the higher the similarity between two nodes. When cutting graphs, cut the points that are closer to the same subgraph as much as possible, and ensure that the distance between different subgraphs is as far as possible. Lin et al. 17 used hierarchical clustering. First treat each node as a cluster, then merge the two clusters with the closest distance into a new cluster, and repeat this process to form a dendrogram. Through this dendrogram, clusters can be quickly divided according to demand. Bai et al. 18 and Ren et al. 19 use the DBSCAN density clustering algorithm to classify clustering categories according to the closeness of node distribution.
But in the real application background, the structure of the nodes in the network graph can be used as the prior information of clustering, and the edges between the vertices also have important information that characterizes the clustering of the network graph. For example, in the social network graph, the edges between objects are used to indicate the closeness between two nodes 11 ; in the protein interaction network, confidence 20 is used as the weight of protein edges. These show that we have an urgent need for the clustering method of network graphs with edge weights. The hierarchical greedy discovery algorithm proposed by Blondel et al. 21 : fast modularity optimization (BGLL) algorithm. Each node is regarded as a cluster, and the merger of clusters is judged by the criterion of maximizing modularity increment. This process is iterated until the modularity no longer increases. Liu et al. 22 used the CMC algorithm to search for maximal groups in all knowledge network graphs and calculated the weighted density as the basis for judging the closeness between clusters. However, these methods only refer to edge weights or topological structure, do not comprehensively consider the edge weights and topological structure.
Edge weights and topological characteristics of the network graphs are both important reference factors for community classification of complex network graphs. If only one factor is considered, the result of the community classification will be unsatisfactory and deviate from the actual situation, which is not conducive to people’s accurate understanding and analysis of the actual situation. 14 Therefore, clustering of edge-weighted network graphs combined with topology is an important research direction today. In this paper, we used medicine as the node, and the relationship between medicines is used as the edge to build a network graph. The processed drug co-occurrence frequency is used as the edge weight of the network graph, and then the network graph is used to divide the communities by the clustering algorithm of the weighted network graph center diffusion method combining the network topology and the network graph edge weight. To improve and optimize the idea of high-quality clustering algorithm, considering edge weights and topological characteristics of the network graphs, comparative experiments are performed on multiple data sets, and the experimental results are analyzed according to the evaluation indicators. After ensuring the correctness and effectiveness of the algorithm, we applied the algorithm to the analysis of medical prescriptions. It is helpful for us to study the medication rules of diseases in medical prescriptions and discover new knowledge and clues, so as to provide more scientific auxiliary prescription recommendations.
Related definitions
The clustering algorithm refers to dividing the data set into several subgraphs according to certain rules, so that the data with lower similarity is allocated to different subgraphs, and the data with higher similarity are collected into the same subgraph.
Jaccard defines structural similarity as shown in formula (1):
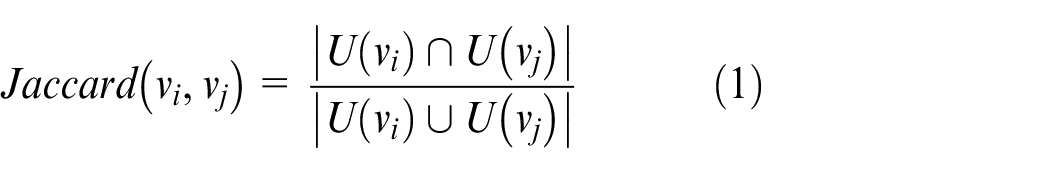
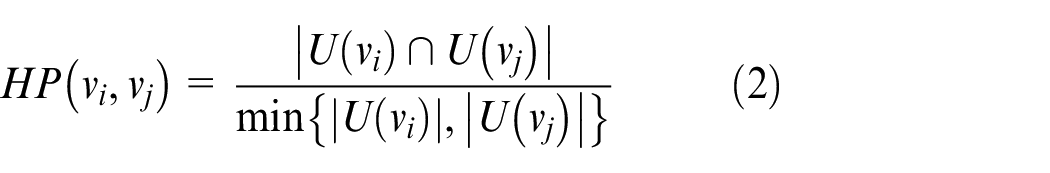
Jaccard’s definition of similarity is based on the structure of the network graph only, however, in the actual application background, there will be other parameters to characterize the network graph, such as the weight or confidence of edges. Many descriptions of the network graph parameters make Jaccard’s definition of the similarity of network nodes have certain limitations. Therefore, Hub Promoted and Hub Depressed 25 considered the influence of the edge weight of connected nodes on the similarity, and proposed the definitions of formulas (2) and (3):

Structural clustering algorithm on weighted networks
Center-diffusion strategy
In complex data network graphs, there are usually several clusters of specific function types that are related to each other. Among them, the functions of the nodes in the cluster are highly similar and closely related, so as to ensure the synergy of different types of clusters between graph data networks. 26 For the analysis of the topological characteristics and weights of network nodes, and then excavating the cluster structure in the network, it is beneficial to explore the characteristics of clusters of different functional types in the network graph in a deeper level. Because the nodes in the cluster have a stronger correlation than other nodes, when we initially determine the cluster, we first determine several nodes with weaker association relationships as different initial clusters according to the characteristics of the node. Then take the initial cluster as the center, use the “center-diffusion” strategy to divide the closely related nodes into clusters, and iterate this process to form cluster sets with similar functional characteristics. Therefore, we propose a weighted network graph structure center diffusion clustering algorithm to realize the classification of different clusters.
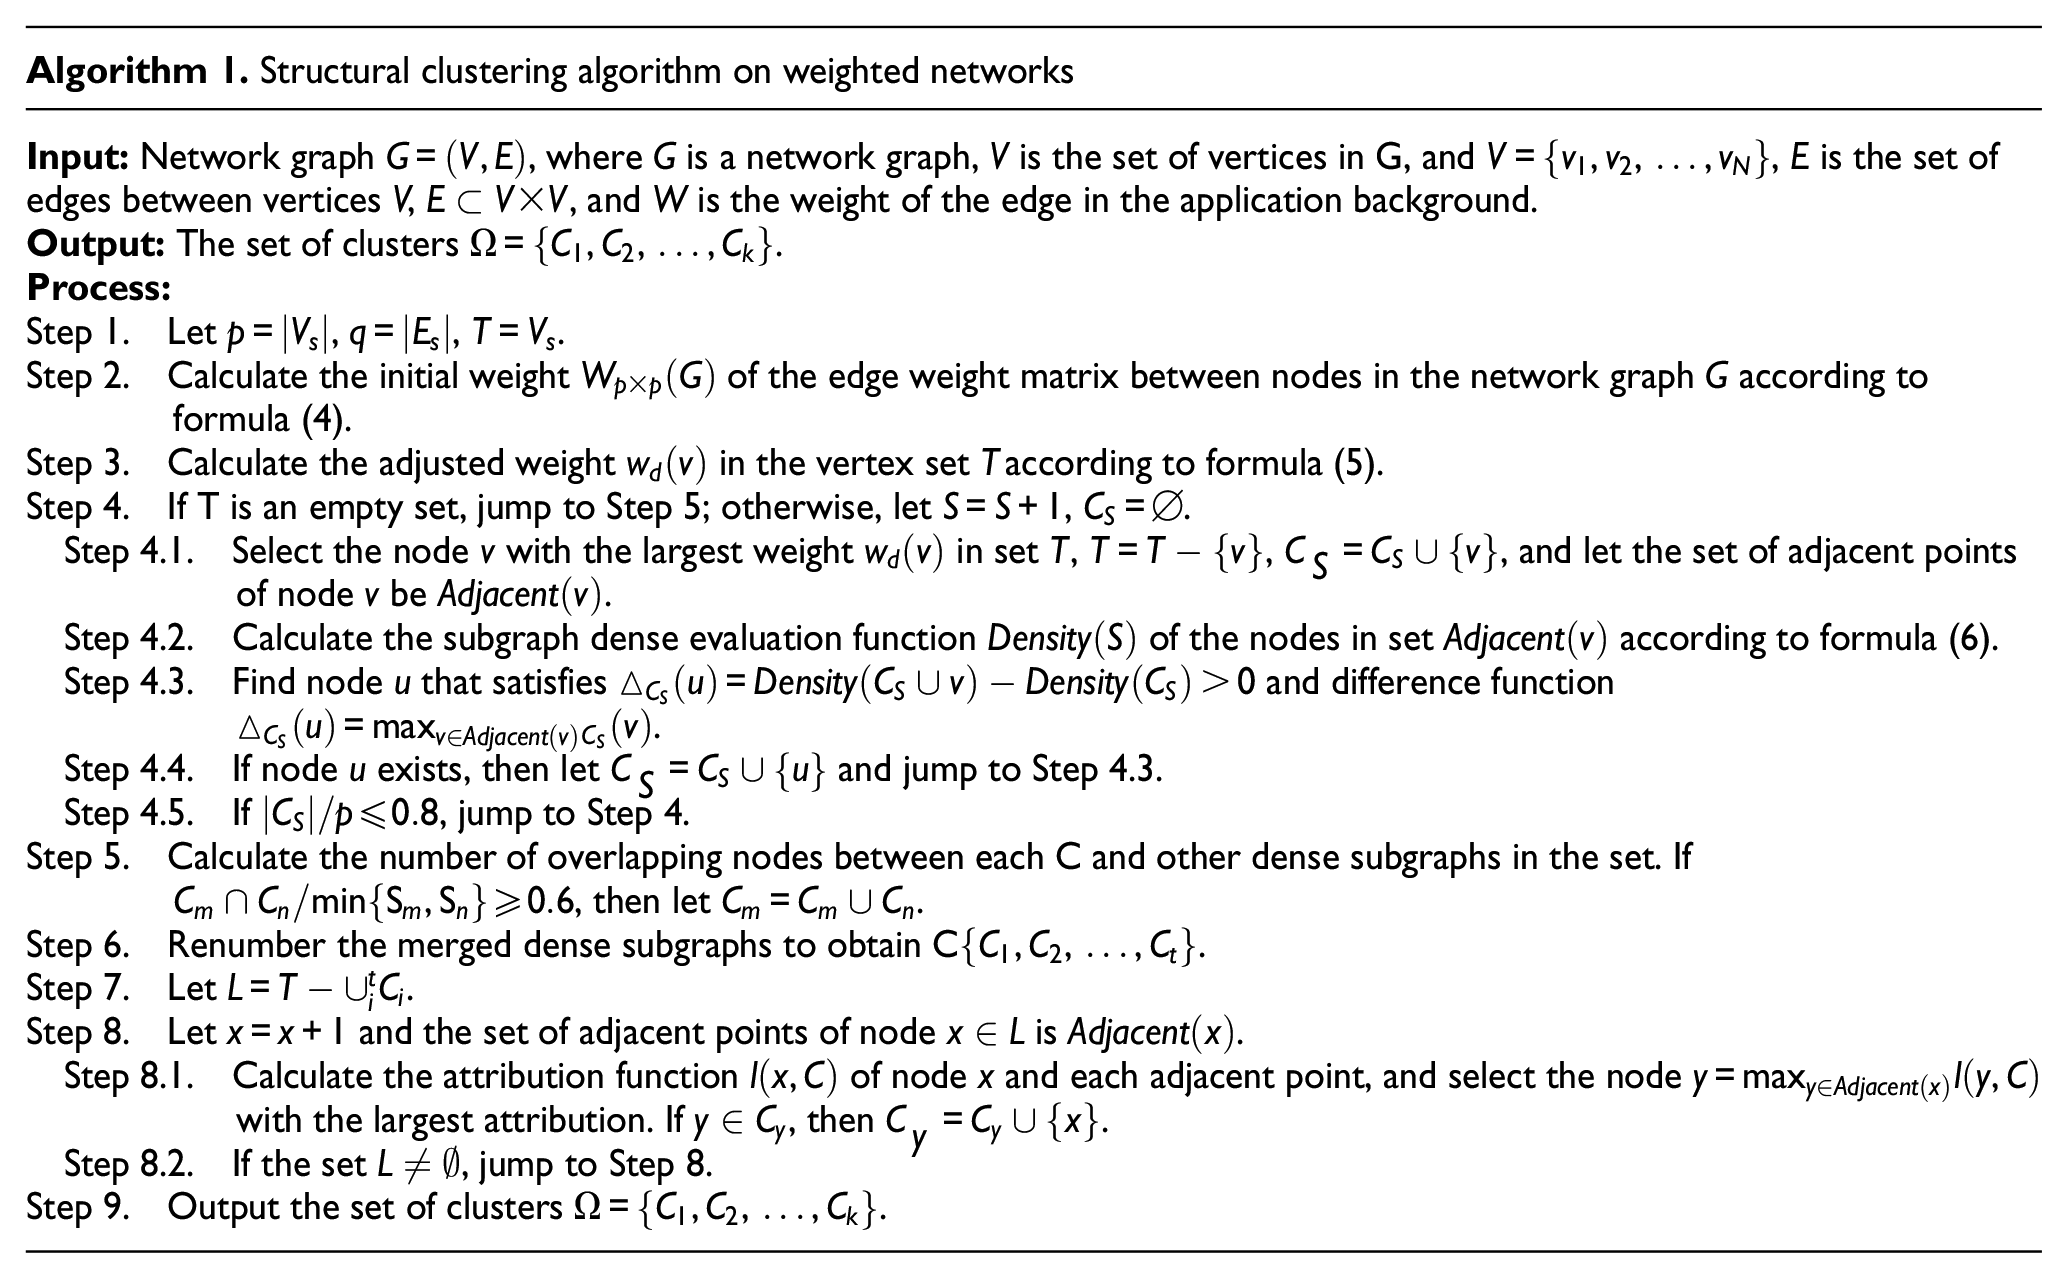
The Structural Clustering Algorithm on Weighted Networks (SCW) combines the graph data network topology and the construction process of Kruskal’s minimum spanning tree. SCW first selects the data node with the largest weight as the initial cluster, and then uses the diffusion method of the predefined cluster evaluation function to iteratively update the weights to obtain a weighted dense subgraph. Finally, the weighted dense subgraph with higher repetition rate is fused, and the nodes that are not divided into the dense subgraph are assigned to the weighted dense subgraph by using the node’s degree of belonging to the cluster
The first step is to give the definition of the edge weight in the network graph based on the application background of the data graph;
In the second step, the node with the larger weight is selected as the central node according to the value of the edge weight in the network graph, the weight of the nodes with the same area and higher density of the central node is reduced. Iteratively this method selects the most suitable central node in turn;
The third step is to diffuse the initial central node into multiple dense subgraphs in accordance with the evaluation criteria of the subgraph density evaluation function and the difference degree function;
In the fourth step, the dense subgraphs with high coincidence degree are fused, and the unassigned nodes are allocated to the existing dense subgraphs according to the attribution function.
Definition of graph data node weights
The properties of edges in graph data networks can be expressed using edge weights. Edge weight is an important factor for describing the degree of association between nodes, and it has a very important influence on the effect of later graph clustering. The accurate description of the edge weights helps us to assign nodes to the correct cluster. The weight of the edge in the social network represents the frequency of contact and interaction between each individual node. In protein interaction networks, edge weights are often used to express the credibility of node interaction edges. When constructing a graph data network, its practical significance needs to be considered, and the edge weights are defined in conjunction with the network topology and other special factors.
In order to more accurately define the correlation between nodes, we refer to the definition of node similarity proposed by Jaccard, and combine Hub Promoted and Hub Depressed to improve Jaccard’s method, using the similarity of network graph structure judgment and the initial definition of edge weights. We define the weight of the network, as shown in formula (4):
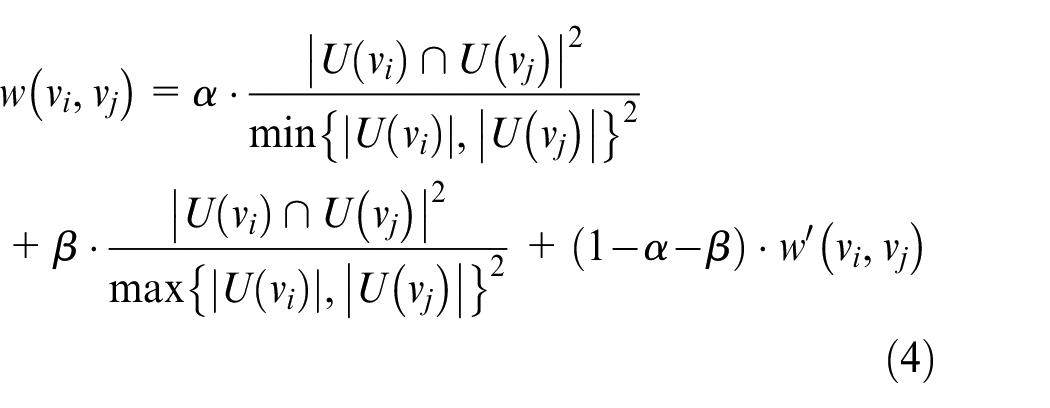
where
Central node selection
For complex network graphs, the central node of the subgraph is crucial. It is the topological center of the subgraph, has a degree higher than other nodes, and is in a dense area. In order to refer to the characteristics of its network topology, most of the nodes in the network graph are included in the subgraph diffused by the central node through as few iterations as possible. When selecting the central node, we should consider the size of the node degree and the degree of association with other surrounding nodes. The greater the node degree of node
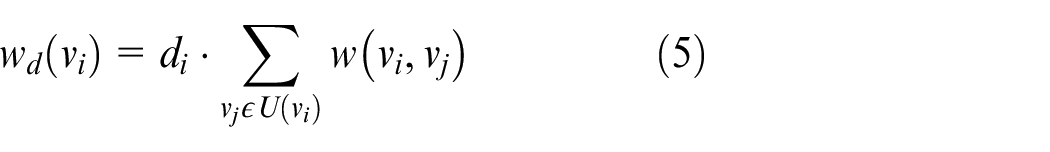
where
According to the calculation method above, we select the node with the largest value of
The central diffusion rule of the initial cluster
In the process of expanding the subgraphs of other surrounding nodes to the central node, not all nodes with associated weights can be divided into the central node. If we do not formulate the boundary in advance, it may cause the nodes with lower correlation to be allocated to unrelated subgraphs, and it may also cause multiple subgraphs of different types to be considered as the same cluster, which will make the classification of clusters unclear. Therefore, we need a subgraph evaluation function as the evaluation metric, and the evaluation function of the density of the subgraph is shown in formula (6). This function could help us to determine whether the new node can be extended to the node in the subgraph.
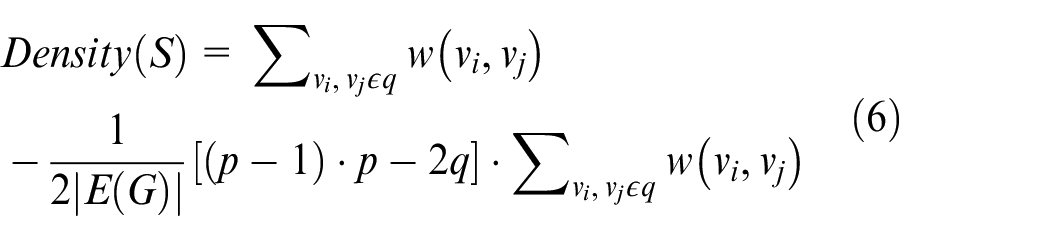
where S is the connected subgraph of graph G,
When we judge whether the node
Optimization of cluster partition
The SCW algorithm we proposed optimizes subgraphs in two aspects:
On the one hand, according to the algorithm of node assignment to subgraphs shown in the last chapter, we can get a larger number of dense subgraphs. However, these dense subgraphs may have the phenomenon that the number of common nodes in the subgraph is too repetitive, which means that the divided subgraph types are too similar. For this phenomenon, we need to merge the subgraphs with a large number of overlapping nodes, so that the resulting clusters satisfy the principles that internal nodes are tightly connected and nodes between clusters are relatively distant. When (7),
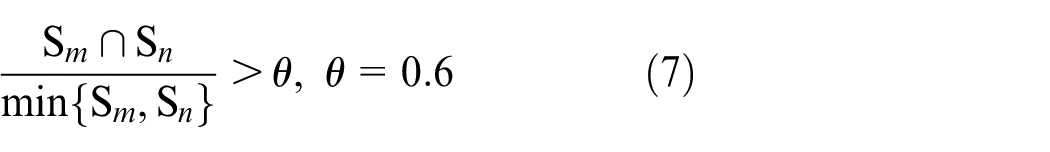
we consider these two subgraphs as the subgraphs with high coincidence rate, and merge the two dense subgraphs to form a cluster. On the other hand, the nodes need to satisfy the difference function before they can be considered to have a close relationship with the subgraph, so there must be a distributed situation in which the association between some nodes and each subgraph is scattered. Follow the principle that the resulting cluster should contain as many nodes as possible, we need to define the attribution function
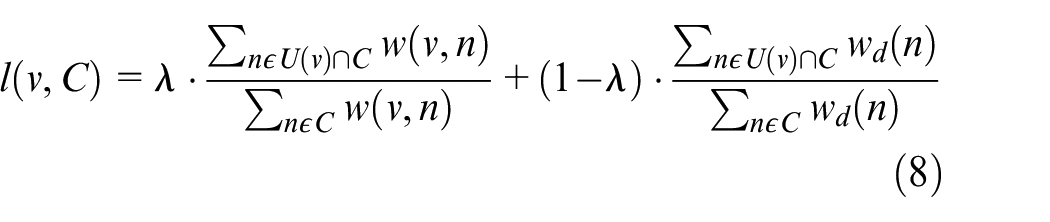
where,
Experiments
Dataset
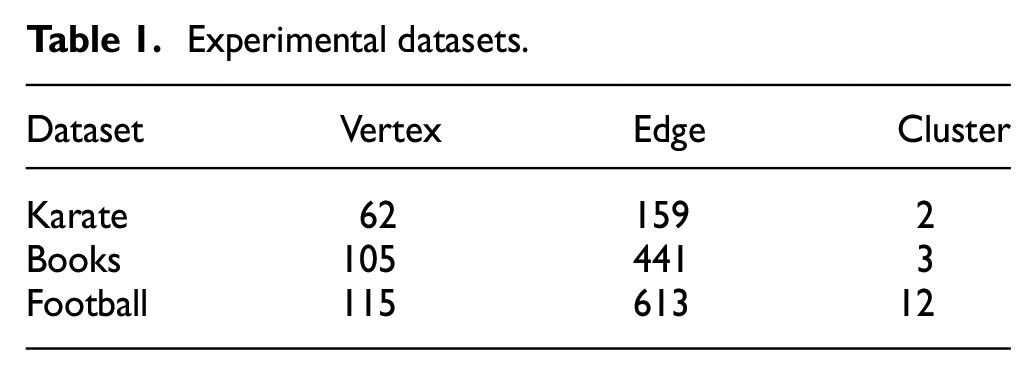
In order to verify the performance of our clustering algorithm, we experiment on three classic real-world datasets with labels, which are the American college football network, 27 Zachary’s karate club, 28 and Books about US politics(http://www.orgnet.com/). The relevant information of our experimental datasets is shown in Table 1.
Experimental datasets.
Evaluation metrics
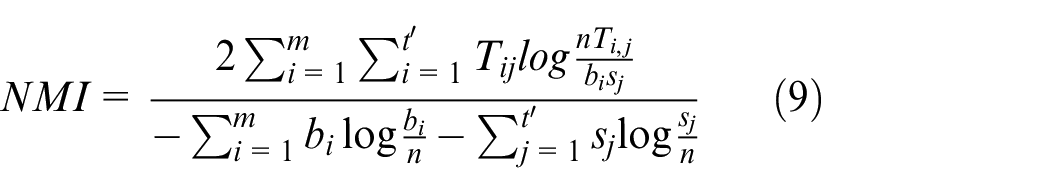
In order to evaluate the performance of the clustering algorithm effect, we need to use some evaluation metrics such as Normalized Mutual Information (NMI)
29
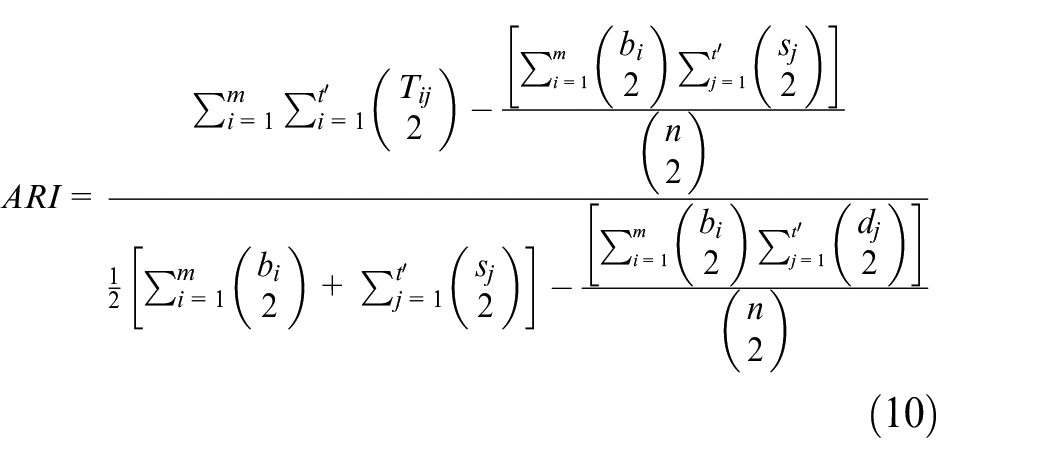
and Adjusted Rand Index (ARI)
30
to describe the clustering effect. We use these metrics to perform numerical calculations on the clustering results to obtain a score. A higher score indicates that the clustering result of our algorithm is more accurate, otherwise, a low score indicates that we need to improve our algorithm. First, we represent the verification label results on the original dataset as
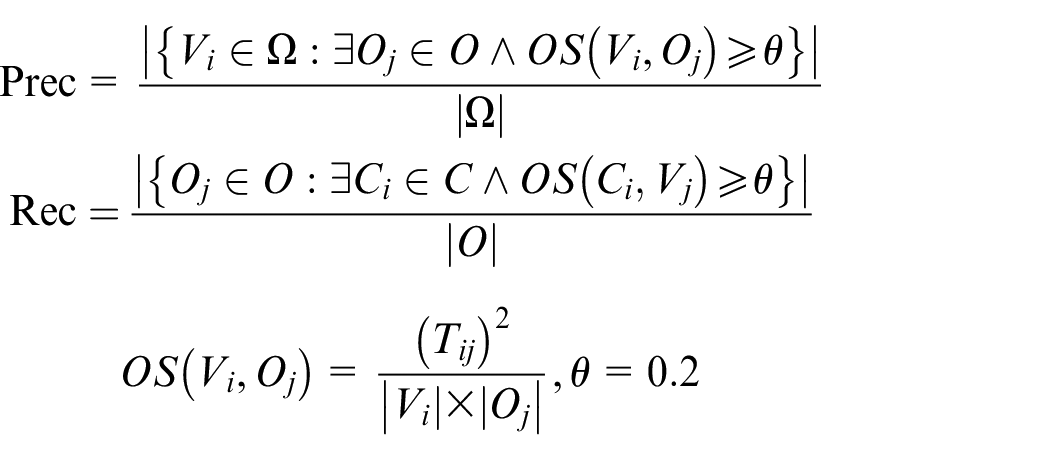
We can also use the F-measure defined by the average of Precision and Recall as the evaluation metric to evaluate the similarity between the clustering results and the original dataset labels. 31
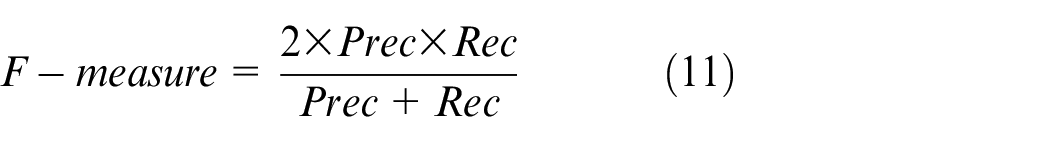
where
Analysis of results
In the experiment, we compare our SCW algorithm with the classic community discovery algorithm CPM, MCODE, and BGLL. According to the evaluation metrics of the clustering algorithm, we can make a correct evaluation of the clustering results. To evaluate the performance of the clustering effect, we use the previously mentioned NMI, ARI, and F-measure as metrics to evaluate the similarity between the clustering results and the original dataset labels. The comparison of clustering results of various experimental algorithms is shown in Table 2:
Comparison of clustering results of various experimental algorithms.
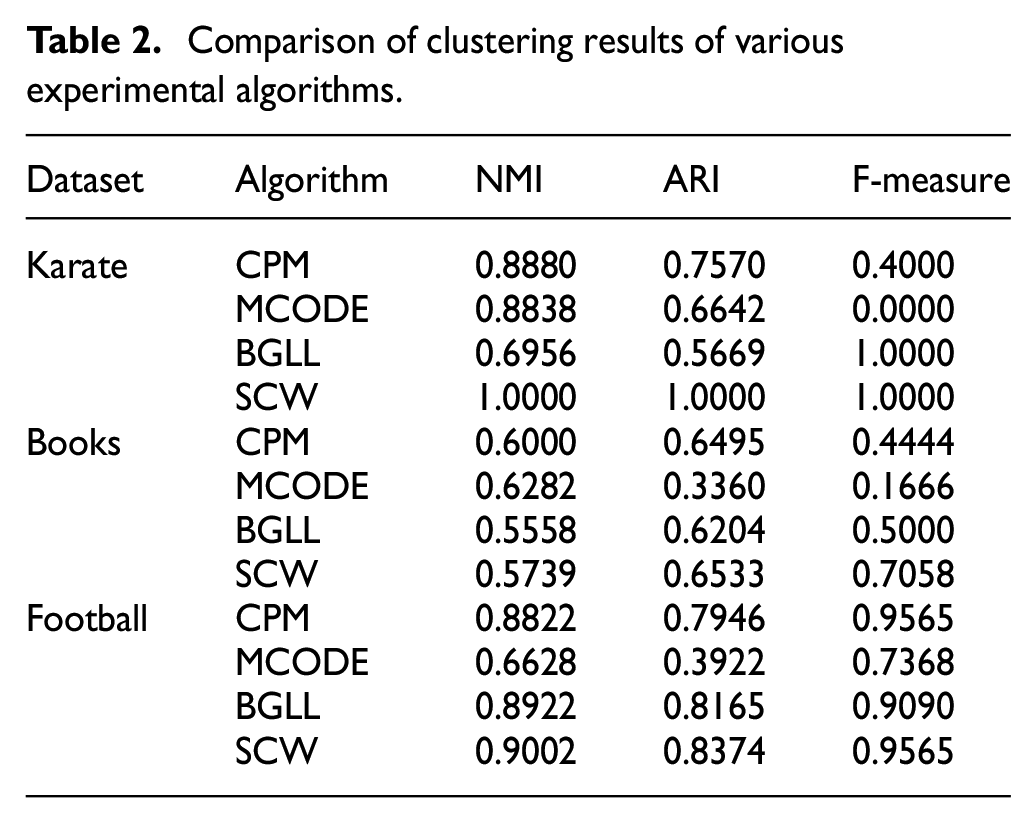
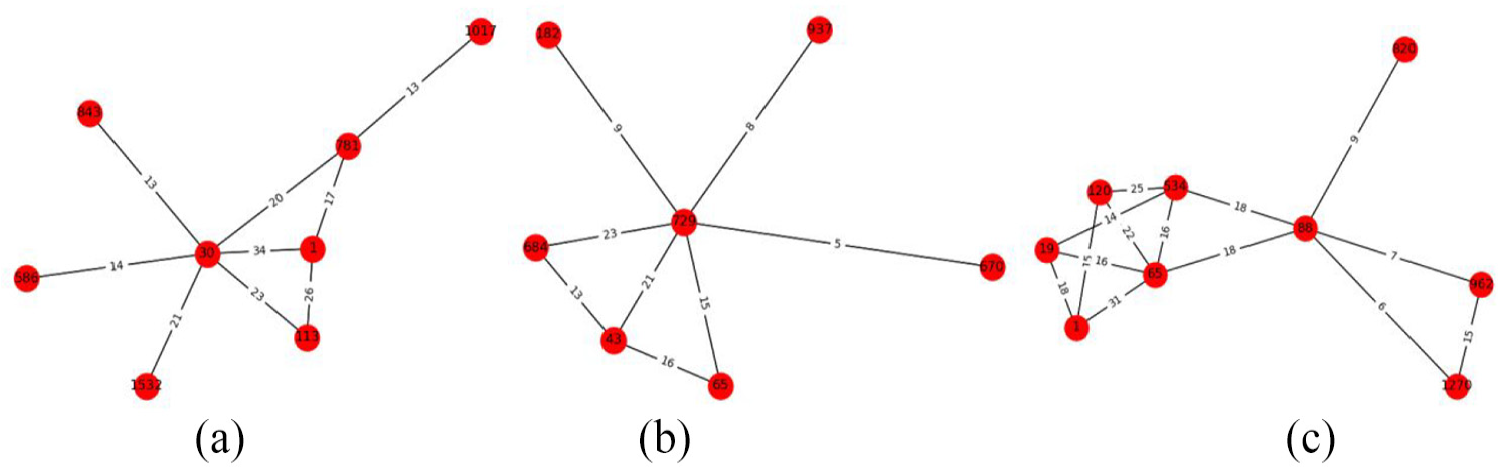
In order to verify the effectiveness of our SCW clustering algorithm for weighted network graphs, we also use the classic algorithms CPM, MCODE, and BGLL on the three datasets of Karate, Books, and Football to experiment and compare the performance. And we use NMI, ARI and F-measure as metrics to evaluate clustering results. From the comparison in Figure 1, we can see that our proposed SCW algorithm performs well in the comparison experiment of community division effect.
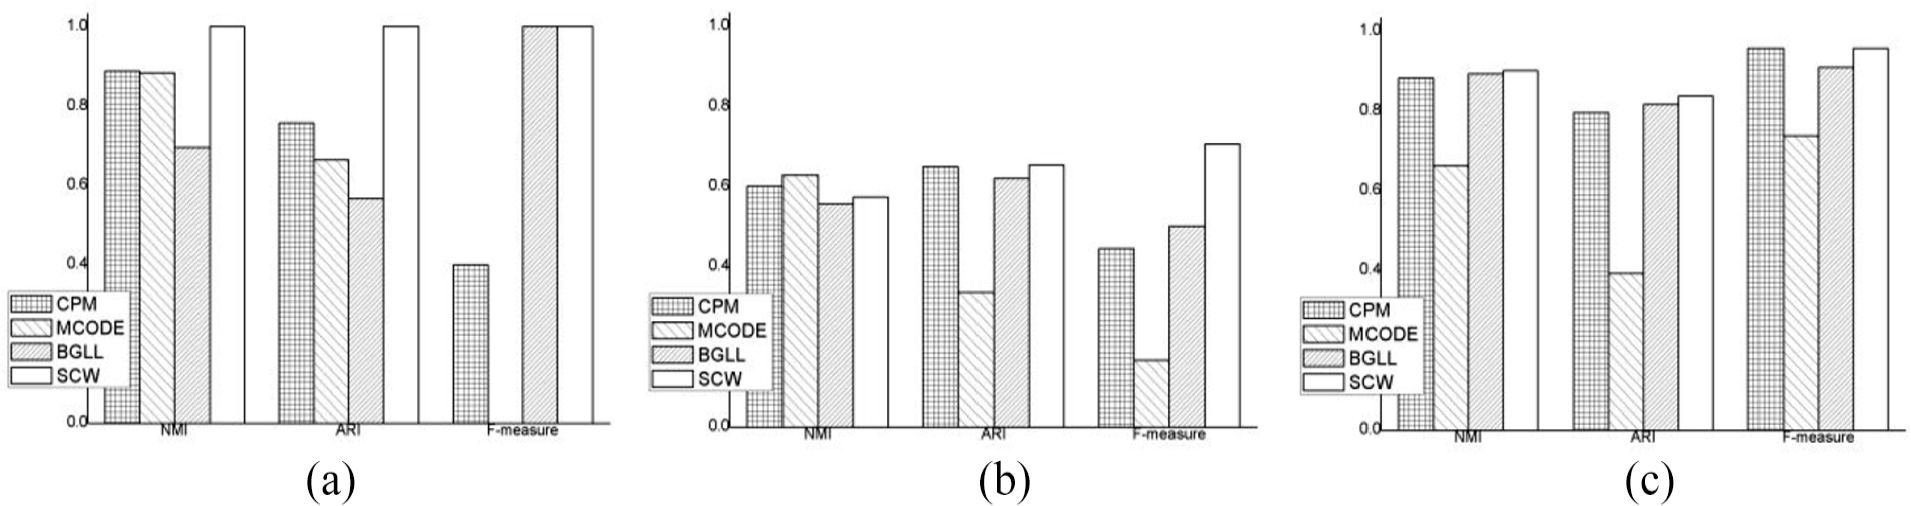
Performance comparison of CPM, MCODE, BGLL, and SCW algorithms on real-world datasets. (a) Karate, (b) Books, and (c) Football.
Medical case analysis
In order to verify the effectiveness and correctness of the SCW algorithm, the effect of the dense subgraph classification method combining edge weights and topology in real weighted network graphs. In the experiment, we use the medicines and diseases in the Compendium of Materia Medica as nodes, and use the relationship as an edge to construct a network graph, and the contribution rate of the drug as the weight of the edge. All formulas are constructed and connected according to the same rules, so as to obtain the network graph of medicines relationship.
Compendium of Materia Medica classifies crude medicines into three categories: plant medicines, mineral medicines, and animal medicines. The plant medicines include grass part, grain part, vegetable part, fruit part, and wood part; The mineral medicines include gold part, jade part, stone part, and halogen part. The animal medicines include insect part, scale part, bird part, beast part, and human part. Among them, the type, smell and treatment of each medicinal material are structured in a fixed format, while the name of the disease, the use of medicines, dosage and processing methods are piled together in the form of text, the format is relatively scattered and inconsistent. For the traditional Chinese medicine Glycyrrhiza uralensis, its type, smell and treatment have fixed forms. In the “treatment” column, information such as drugs, dosage, and processing in the corresponding treatment methods for typhoid fever, sore throat, pulmonary heat sore throat and lung atrophy are all mixed together. In order to facilitate the in-depth exploration of the prescription law, it is necessary to extract the disease and medicine names, dosage units and processing methods contained in the string, and convert it into structured data to model its ontology, attributes and relationships. Specific steps are as follows:
In the first step, we build a Chinese medicine noun database.
In the second step, we use the JIEBA word segmentation tool for word segmentation, and repeated corrections to separate the disease names, medicine names, dosage units, and processing methods.
In the third step, we create a structured traditional Chinese medicine prescription and disease database, and get the medicine table, disease table, and treatment table.
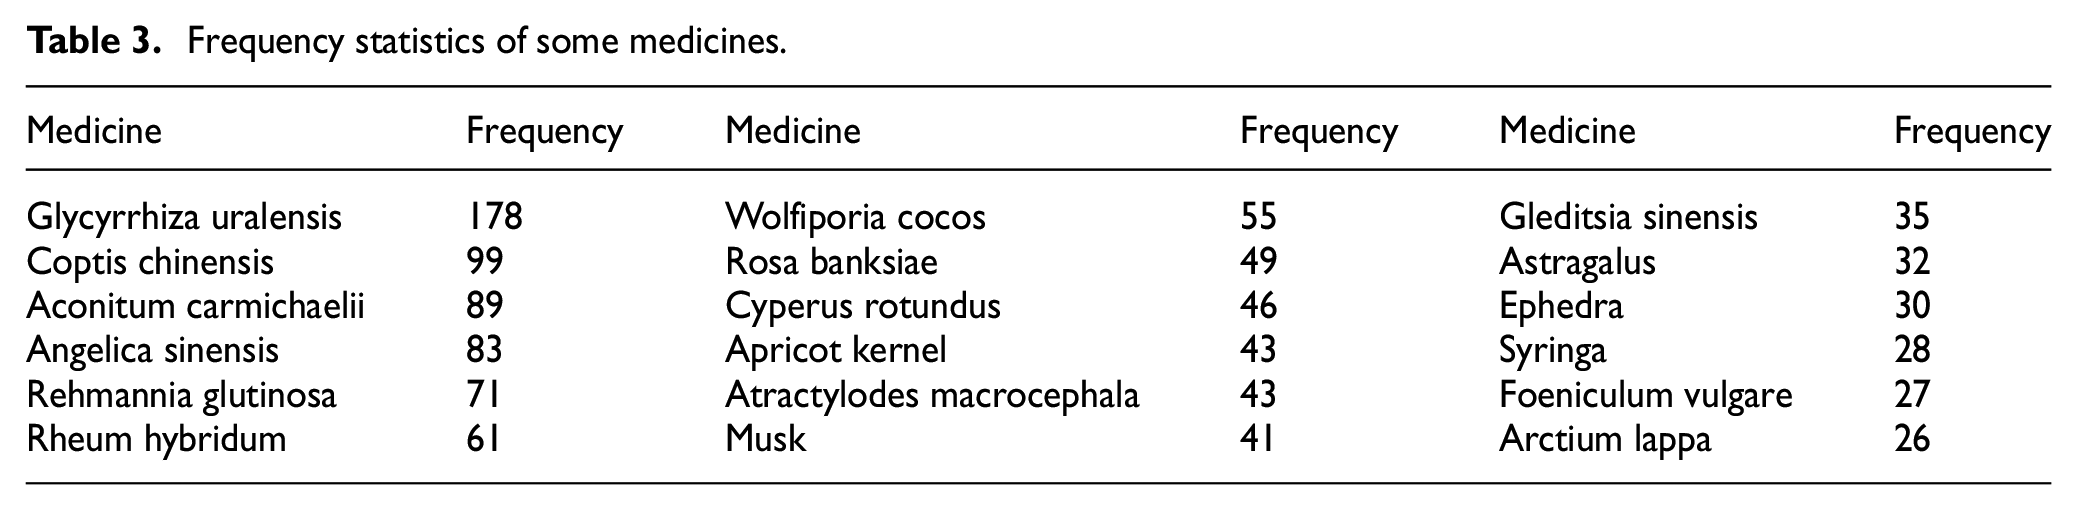
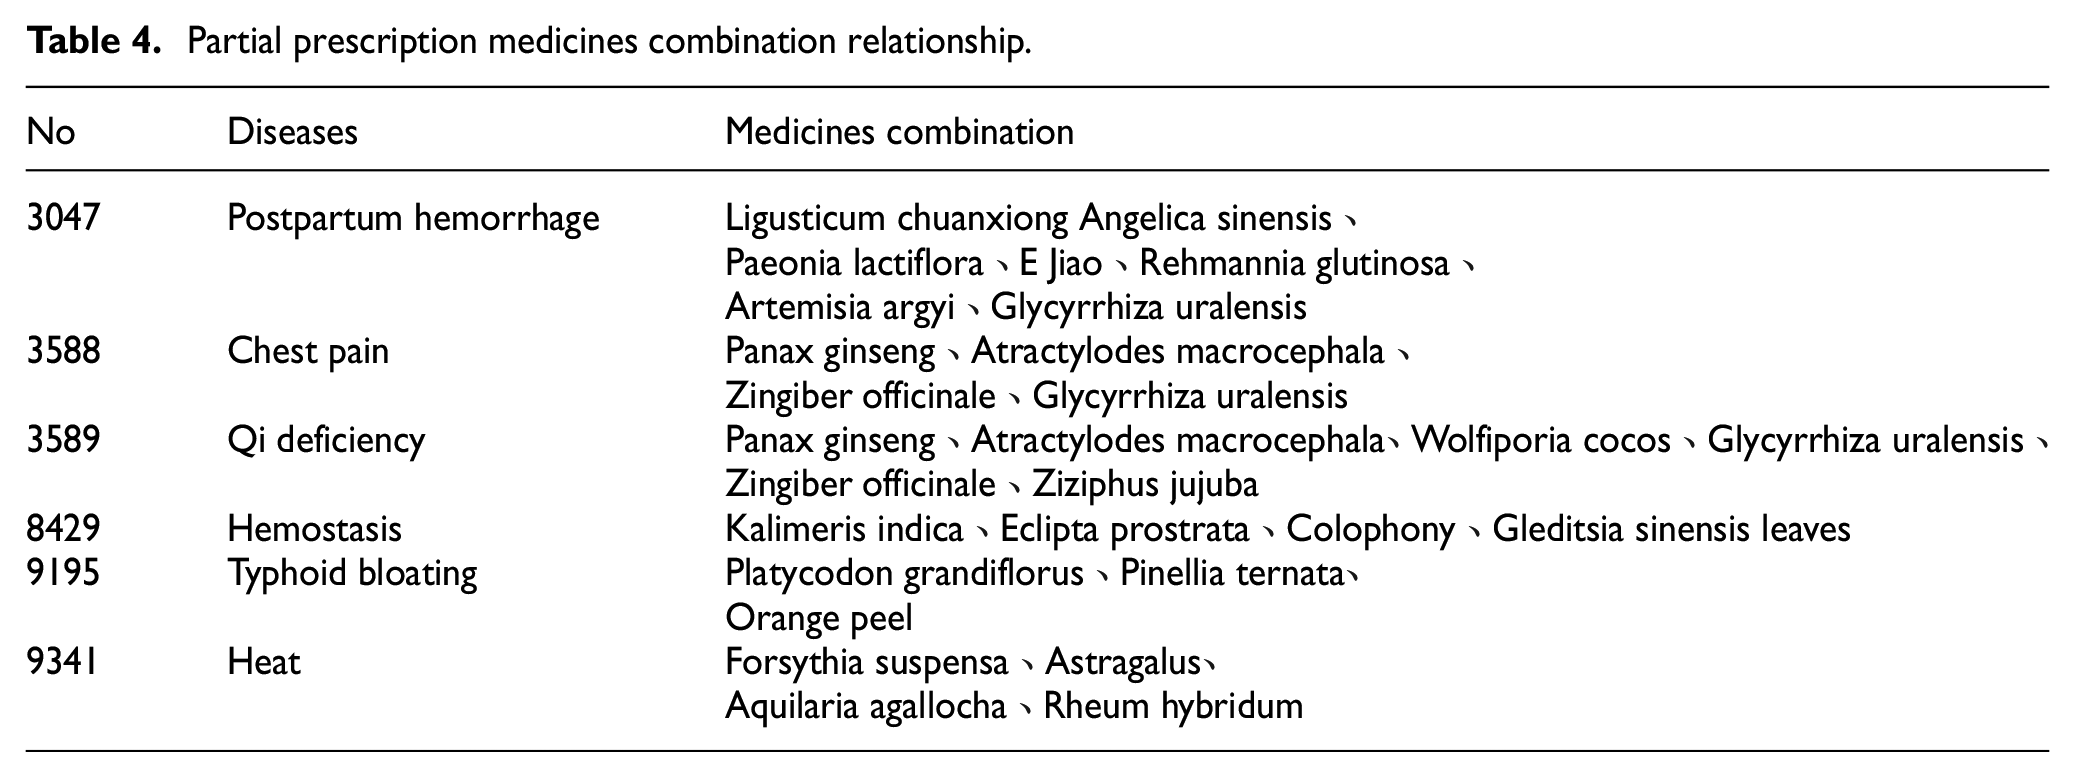
Under the real background, the medicinal materials contained in the separated medical formulas were sorted out, and a total of 1892 medicinal materials and 11,096 cases of formulas were obtained to verify the effect of community division. Table 3 shows the list of the most frequent medicines. Table 4 shows partial prescription combination relationships.
Frequency statistics of some medicines.
Partial prescription medicines combination relationship.
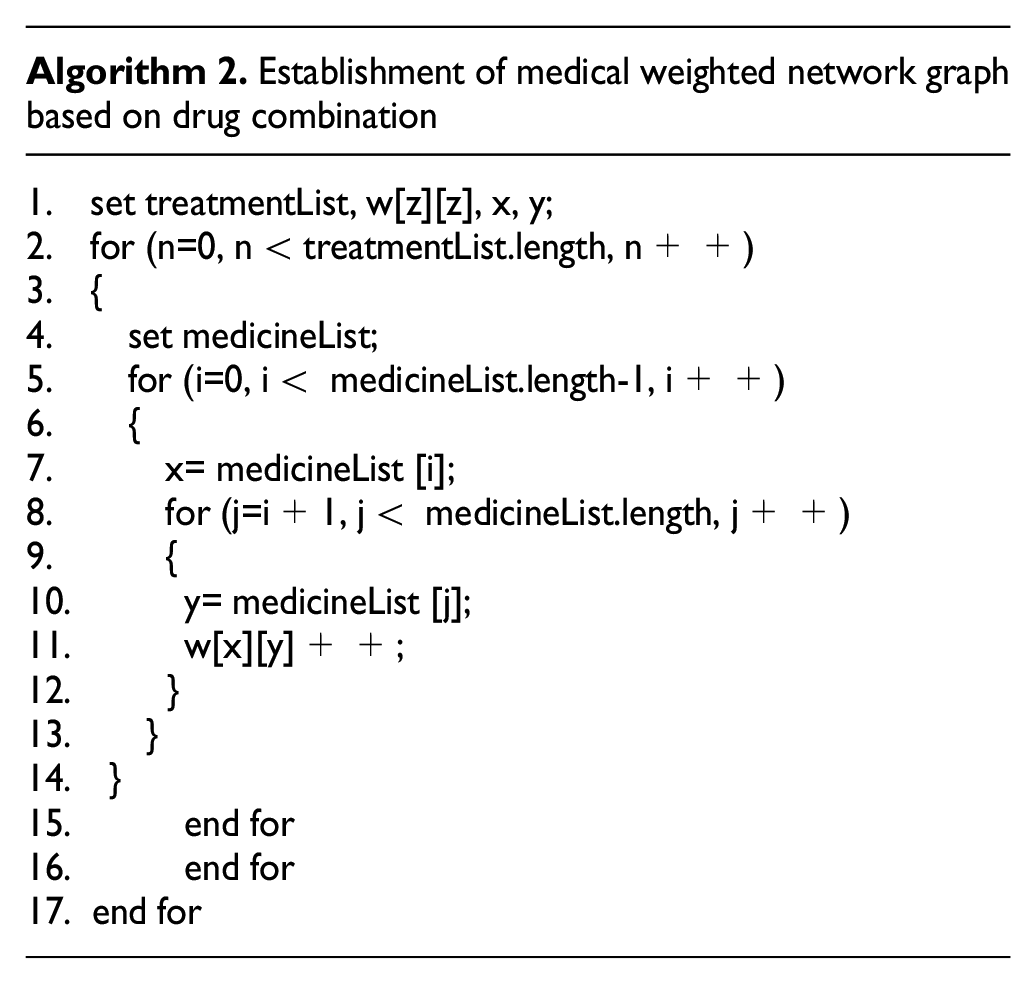
The first step in community classification is to build a complete medical network graph based on the drug combination relationship of medical prescriptions, which helps us analyze drug data and association relationships. We use algorithms to build medical weighted network diagrams, and each medicinal material has a corresponding overview and weight. The weight comes from the combination of drugs contained in the medical formula, which represents the closeness of the association between the two medicinal materials. The core idea of the algorithm is as follows: we use the drug combination contained in these formulas as data, and associate the drug nodes in the formula two by two in the network graph to ensure that there are edges between any two nodes. If there is already an edge between the two drug nodes, the weight is increased by one. The core code is shown in Algorithm 2, which contains the entire process of establishing a medical weighted network graph.
Similarly, we define the initial weight
Network combination of high-frequency drugs in community centers.
Figure 2(a) shows that Ephedra, Pinellia ternata, Glycyrrhiza uralensis, Apricot kernel, Asarum, Belamcanda and Pheretima are the main drugs for the treatment of asthma, where ephedra is the core drug. These drugs have the effect of purging lung qi and reducing phlegm and activating blood, which is consistent with the actual clinical medicine.
Figure 2(b) shows that we can conclude that Cuscuta is the core medicinal material for high-frequency renal diseases through community classification. Cuscuta can be combined with Rehmannia glutinosa, Fructus lycii, Angelica sinensis, Cistanche deserticola, Salvia miltiorrhiza, Atractylodes macrocephala, where the Salvia miltiorrhiza is a medicine for promoting blood circulation and the rest are all tonic medicines. It is consistent with the clinical medicine.
Figure 2(c) shows that Angelica sinensis, Astragalus, Glycyrrhiza uralensis, Ligusticum chuanxiong, Cynanchum otophyllum, Cinnamomum cassia, Commiphora myrrha, Boswellia carterii, and Saposhnikovia divaricate are divided into the same community, where Angelica sinensis is the core medicinal material, Angelica sinensis, Astragalus, Glycyrrhiza uralensis, Ligusticum chuanxiong are tonics and drugs for invigorating blood circulation and eliminating stasis, Cinnamomum cassia, Commiphora myrrha, and Boswellia carterii are drugs for invigorating blood circulation and eliminating stasis, Cinnamomum cassia and Saposhnikovia divaricate are wind-cold-dispersing medicinal, which are consistent with the clinical medicine.
Conclusion
In existing network graph clustering methods, many researchers have realized the importance of graph topology and node attributes. They proposed some graph clustering methods based on graph structure and attributes, but these methods have some shortcomings such as inaccurate graph model or unsatisfactory clustering effect. In this paper, we briefly describe the reasons for the poor community classification results only considering the network graph edge weights or network graph topology on real datasets. And we propose the Structural Clustering Algorithm on Weighted Networks (SCW) combining network topology and network graph edge weights. The clustering algorithm draws on the idea of Kruskal’s algorithm, and first determines several nodes with weaker association relationships as different initial clusters according to the characteristics. Then we take the initial cluster as the center and use the “center-diffusion” strategy to divide closely related nodes into clusters. Iterating this process will eventually form cluster sets with dissimilar functional characteristics. The experiment compared SCW with CPM, MCODE, and BGLL. After analysis on three real network data sets, the results show that the algorithm SCW shows good performance in the evaluation indicators such as NMI, ARI, and F-measure. Finally, the SCW community classification algorithm is used to analyze the association relationship between treatment and medicine on medical case data. We get the commonly used medicine combination rules which are conducive to assisting medical diagnosis.
Footnotes
Declaration of conflicting interests
The author(s) declared no potential conflicts of interest with respect to the research, authorship, and/or publication of this article.
Funding
The author(s) received no financial support for the research, authorship, and/or publication of this article.