
Abstract
The problem of vibration in turnout zones caused by passing trains has become increasingly serious due to the complexity of the structure and force of metro turnouts. However, there are only a few studies focusing on the vibration transmission characteristics in turnout zones. In this paper, three typical turnouts in a city were studied to test the vibration responses of track slabs and a tunnel wall in the switch zone and the crossing zone when a train was passing a turnout. First, the short-time Fourier transform, wavelet transform, and constant-Q nonstationary Gabor transform (CQ-NSGT) were applied to the typical time-domain signal of tunnel wall respectively. The comparison results showed that CQ-NSGT delivered a higher time resolution and a higher frequency resolution. Based on this, the CQ-NSGT was used to analyze the vibration signal of the track slabs and specifically study the vertical vibration characteristics of the track slabs in the turnout zone toward the tunnel at the time when a train was passing. The result showed the vibration signal transmitted to the tunnel wall from the track slabs in both the switch and crossing zones will experience high-frequency vibration attenuation. It was noted that different train types have no effects on the vibration signal transmission rule, but an increase in the train speed will increase the vibration energy and expand the frequency band when the signal was transmitted to the tunnel wall.
Keywords
Introduction
In urban rail transit, turnouts play an important role in bearing and transmitting various types of load of metro vehicles, and due to the low speed of subway vehicles, light axle weight and high traffic density, it is required that the turnouts have good wear resistance.The continuous and rapid changes in the direction of the vehicles passing a turnout will have a wheel–rail impact, which may result in fatigue damage to the steel rails. 1 The steel rails in the turnout zone will experience severe wave-shaped wear as the service time of the railway line increases. 2 This structural irregularity would lead to a greater impact when the vehicles are passing a turnout, which would worsen the problem of environmental vibration in the turnout zone. 3 Controlling the vibration at the vibration source is the most efficient vibration reduction measure. The vibration transmission characteristics of the vibration source can be analyzed to guide vibration and noise reduction in a turnout zone.
The dynamic wheel-rail contact relationship must be considered to accurately calculate the vibration response of the wheel–rail interactions in a turnout zone. 4 REN Z et al. calculated the contact and impact between the wheel–rail and the corresponding railway line in the switch and crossing zones by means of simulation, 5 established a detailed vehicle-turnout space coupling vibration model.He found that the entire system would produce a great vibration in the horizontal direction when the vehicle was passing a turnout. 6 Bruni S et al. proposed two methods for simulating the interactions between train turnouts. The first one is a simplified model of a multi-rigid-body vehicle passing turnouts, while the other is a three-dimensional (3D) finite element model for refining turnouts. Furthermore, they verified the correctness of the two models by actual measurement. The two modeling methods are now widely used to achieve vibration and noise reduction in turnout zones. 7 The vibration transmission in a turnout structure is influenced by many factors. The performance of turnouts will directly influence the strength, stability, and carrying capacity of the track structure. As a result, its vibration characteristics must be studied. Xi S et al. found that the vertical vibration of the track is mainly transmitted downward in the low-frequency band and longitudinally transmitted along the track in the high-frequency band. 8 Mouzakis C et al. used the vibrational diffusion function to describe the law of metro vibration transmitted to adjacent buildings via the tunnel wall. 9 At present, few studies on the vibration transmission characteristics of the vibration source in a turnout zone are conducted by means of field tests. It is necessary to analyze the transmission of the vibration signal when the measured subway vehicle passes through the turnout. 10 At the same time, due to the complexity of the structure of the turnout area, it is necessary to measure the vibration data of different positions in the turnout area and to study the transmission characteristics of vibration signals from the track bed slab to the tunnel wall in different positions of the turnout area.
Analyzing the time-frequency relationship of signals is a method for studying nonlinear vibration signals, and, currently, many tools for the time-frequency analysis can be used. 11 At present, the time-frequency methods widely used in vibration signal processing caused by rail transit include short-time Fourier transform and wavelet transform, etc. The wavelet transform is a function selected to constitute a set of basic wavelets that can be stretched and translated. These wavelets can expand the signal to obtain information on the time–frequency plane. The time window can automatically increase as the frequency increases, leading to a high time-frequency resolution. The short-time Fourier transform (STFT) is based on a window function. A short window can provide a higher time-domain resolution, while a long window can provide a higher frequency-domain resolution, thereby making it impossible to simultaneously guarantee a high time-domain resolution and a high frequency-domain resolution. When the window function of the short-time Fourier transform is a Gaussian function, it is called a Gabor transform; however, we should note that the method still has the disadvantages of the STFT. Such a constant-Q Gabor transform (CQT) has not well solved this problem until Brown 12 introduced a variable length window function. Velasco, Schörkhuber, and Klapuri et al.13–15 later proposed a constant-Q nonstationary Gabor transform (CQ-NSGT) algorithm, which not only has a higher computational power, but also provides adaptive time and frequency resolutions. Subsequently, Liu T et al. 16 took the signal obtained by force hammer test as an example, and adopted short-time Fourier transform, Wigner-Ville distribution, Hilbert-Huang transform and CQ-NSGT processing. The results show that only by using CQNS GT can the time resolution and frequency resolution be improved at the same time. Perhaps this conclusion is also applicable to the processing of bifurcation vibration signals.
The determination of the vibration source intensity in a turnout zone is the key to ensuring an accurate evaluation of the environmental vibration in an urban rail transit turnout zone,vibration source intensity is the strength of the vibration pollution source, which is a characteristic index reflecting the acceleration, velocity or displacement of the vibration source intensity. At present, data on the vibration source intensity of the underground lines are primarily derived from the “Concise Manual for Controlling Vibration and Noise of Urban Rail Transit,” 17 where data on the vibration source intensity in turnout zones are rare. The “Technical Guidelines for Assessing Environmental Impact of Urban Rail Transit” (HJ 453-2018) 18 stipulate that the Class I evaluation of the vibration source intensity in the evaluation of environmental vibration impact is supposed to use the analogy measurement method.
In this study, three turnouts on the metro lines in a city were tested on site. The transmission characteristics of the source intensities in the metro turnout zones were studied. The vibration signal transmissions generated by the wheel–rail interactions from the track slabs to the tunnel wall within different frequencies were analyzed. The research results may serve as guidelines for reducing vibration and noise in turnout zones at the vibration sources. Section 2 mainly presents basic information on the field test and layout of measuring points. Section 3 shows a set of tunnel wall vibration signals of the No. 2 turnout as the objects for the time–frequency analysis performed by means of the STFT, wavelet transform, and CQ-NSGT. A comparison showed that CQ-NSGT delivered higher time and frequency resolutions than the other two methods. In Section 4, CQ-NSGT was used to qualitatively analyze the vibration characteristics of the track slabs in three sets of turnouts and comparatively analyze the law of propagation of vertical vibration of the track slabs in the three sets of turnouts to the tunnel wall.
Field testing
Basic information
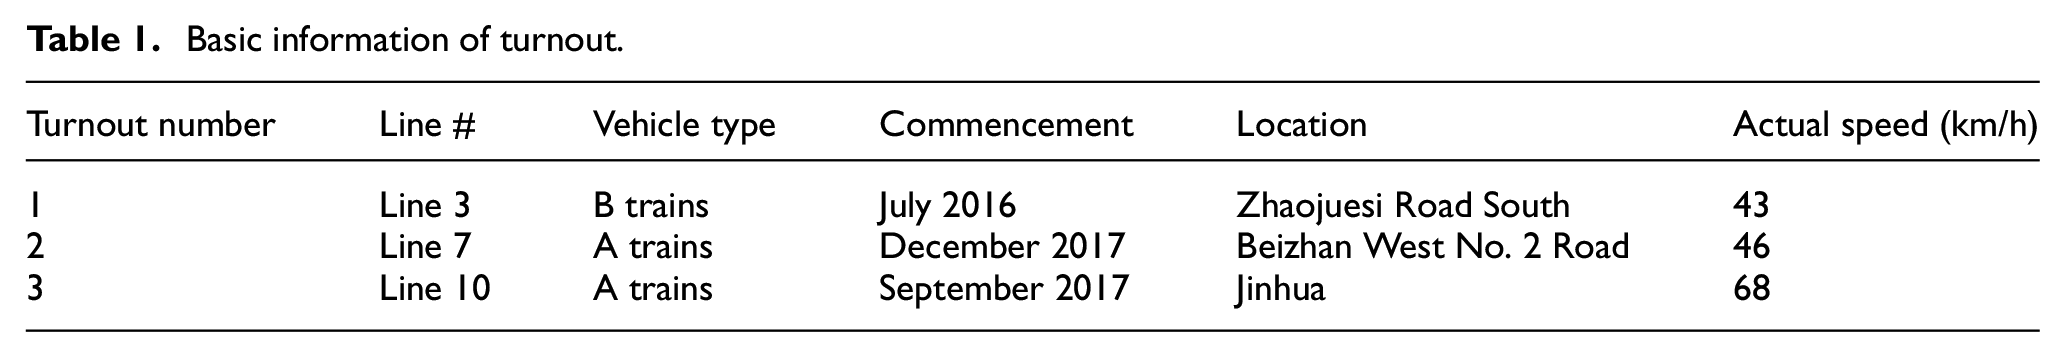
Three typical turnouts from three different lines were selected for field testing. The three turnouts were all No. 9 simple turnouts, which are the most commonly used and typical turnout types in urban rail transit. The track structure was an integral track bed without vibration reduction measures. Table 1 shows the details of the measuring points.
Basic information of turnout.
Test instruments and layout of the measuring points
Figure 1(a) illustrates the layout of the measuring points. The #1 and #2 test sections were located in the switch and crossing zones, respectively. Each test section was equipped with two acceleration sensors, with one mounted on the track slab and the other on the tunnel wall. Figure 1(b) shows a Model INV9828 acceleration sensor mounted on the track slab with an available frequency range of 0.2 Hz–2.5 kHz. Figure 1(c) shows a Model LC0115TA IC piezoelectric acceleration sensor mounted on the tunnel wall with an available frequency range of 0.1 Hz–1500 Hz. A Model INV3060s collector was used as the data collector that can be controlled off-line and powered by a battery [Figures 1(d) and (e)]. Refer to ISO10815-2016 for general measurement of the vibration acceleration of the tunnel wall under the load of the train, as a basis for judging the impact of the line on the surrounding environment vibration. The tunnel wall measurement point is 1.9 m from the rail surface level, and the measurement points on the track bed are The same section as the tunnel wall side.
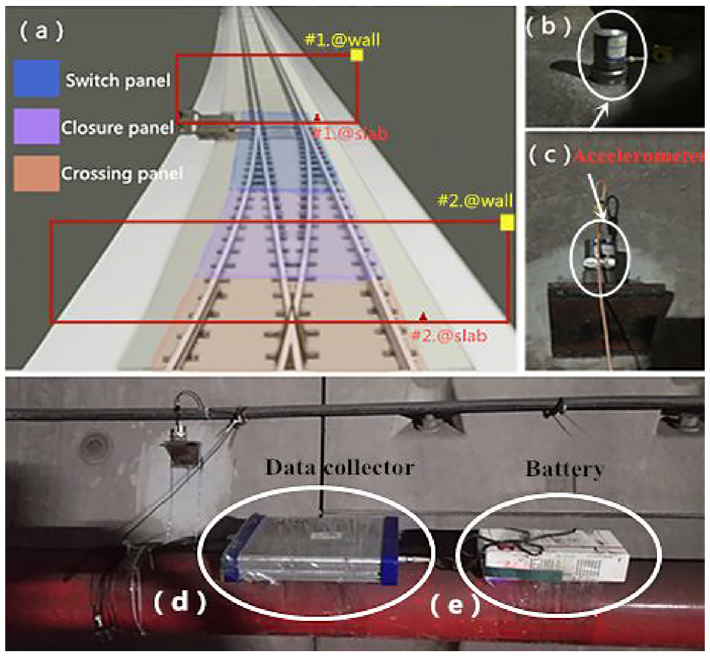
(a) Schematic diagram of the measuring points, (b) measuring points on the track slab, (c) measuring points on the tunnel wall, (d) data collector, and (e) battery.
Comparison of the time-frequency methods
In analyzing the transmission characteristics of the vibration source intensity in a turnout zone, its time-domain signal should be converted into a frequency-domain signal. Among the commonly used methods are the STFT and the wavelet transform, but both have some defects. The STFT cannot ensure both a high time resolution and a high-frequency resolution. The wavelet transform has a lower time resolution and a higher frequency resolution at low frequencies and a higher time resolution and a lower frequency resolution at high frequencies. Choosing an appropriate wavelet basis for different signals is very difficult. The same vibration signal was analyzed herein by using the CQ-NSGT method. Consequently, this method could overcome the shortcomings of the two previously mentioned methods.
The vertical vibration signals at the four measuring points on the No. 2 turnout were observed when the train was passing straight to compare the three time-frequency methods (Figure 2). The vertical vibration accelerations at the measuring points on the track slab in the switch zone and the tunnel wall were all slightly greater than those at the measuring points in the crossing zone, but their amplitude differences were not significant. Therefore, the vibration signal of #1.@wall was selected as an exemplary signal for comparing the three time-frequency methods.
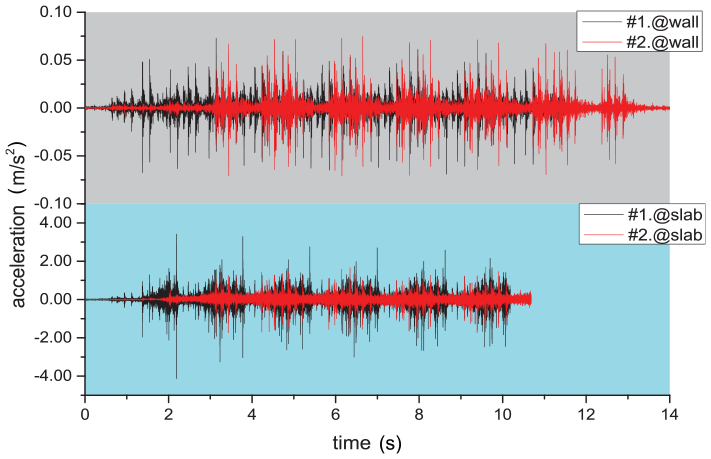
Vibration time-domain signal of the No. 2 turnout measuring point.
STFT
The measured vibration signal of the tunnel wall is a discrete-time signal, and the following formula can be proved for the discrete time signal according to the transformation of short-time Fourier transform
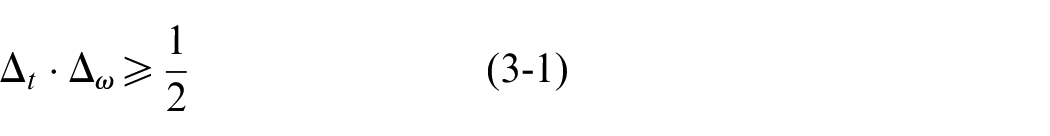
Where
Equation (3-1) shows that in the case of the STFT, the time resolution and the frequency resolution are always contradictory. Both a high time resolution and a high-frequency resolution can be achieved in the time–frequency spectrum of the signal. The other one decreases when one increases. In other words, a higher frequency resolution can only be achieved at the sacrifice of the time resolution, or vice versa.
Figure 3 shows the time-frequency spectrum for analyzing the example signal by using the STFT. The 3D diagram shows that the peak amplitudes were concentrated in 60–75 Hz, with maximum amplitude at 70 Hz. When six vehicles passed the measuring point, the vibration produced by the interactions between the bogie wheel sets and the rails was transmitted to the measuring point. The two-dimensional (2D) diagram illustrates this observation, but Figure 3(b) clearly depicts that the frequency resolution of the STFT-based time–frequency spectrum was higher than its time resolution. When the parameters of STFT are changed, the maximum amplitude is still 70 Hz, which achieves better time resolution, shown in Figure 4(b). While comparing Figure 3(a) with Figure 4(a), it can be found that a certain smoothness is lost in the horizontal axis direction, and the frequency resolution is sacrificed.
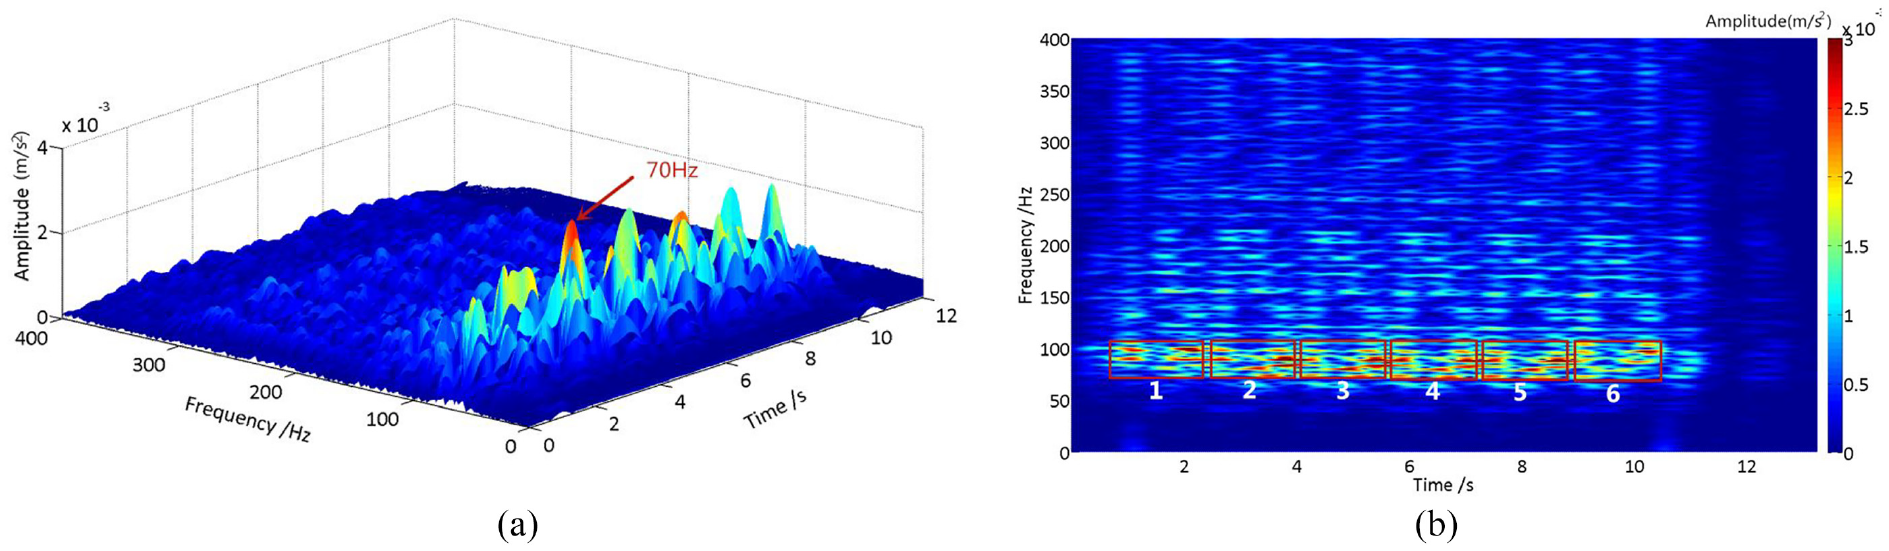
Time–frequency distribution of the example signal by using the STFT: (a) 3D figure, (b) 2D figure.
Time–frequency distribution of the example signal by using the STFT when changing Time window radius and frequency window radius: (a) 3D figure, (b) 2D figure.
Wavelet transform
Wavelet transform is similar to short-time Fourier transform and will give the time window and frequency window of the signal, 23 as shown in Equations (3-2) and (3-3).

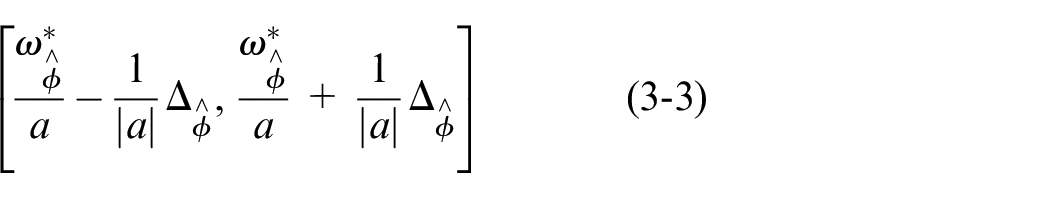
where a is the stretching factor or scale factor,
The time window transformed from the wavelet narrows for small a values and widens for large a values. The value of a is small, and the window automatically narrows when the frequency window is at a high-frequency band. 20 The value of a is large, and the window automatically widens when it is at a low-frequency band. Therefore, the wavelet transform is suitable for analyzing the nonstationary signals containing both high- and low-frequency information.
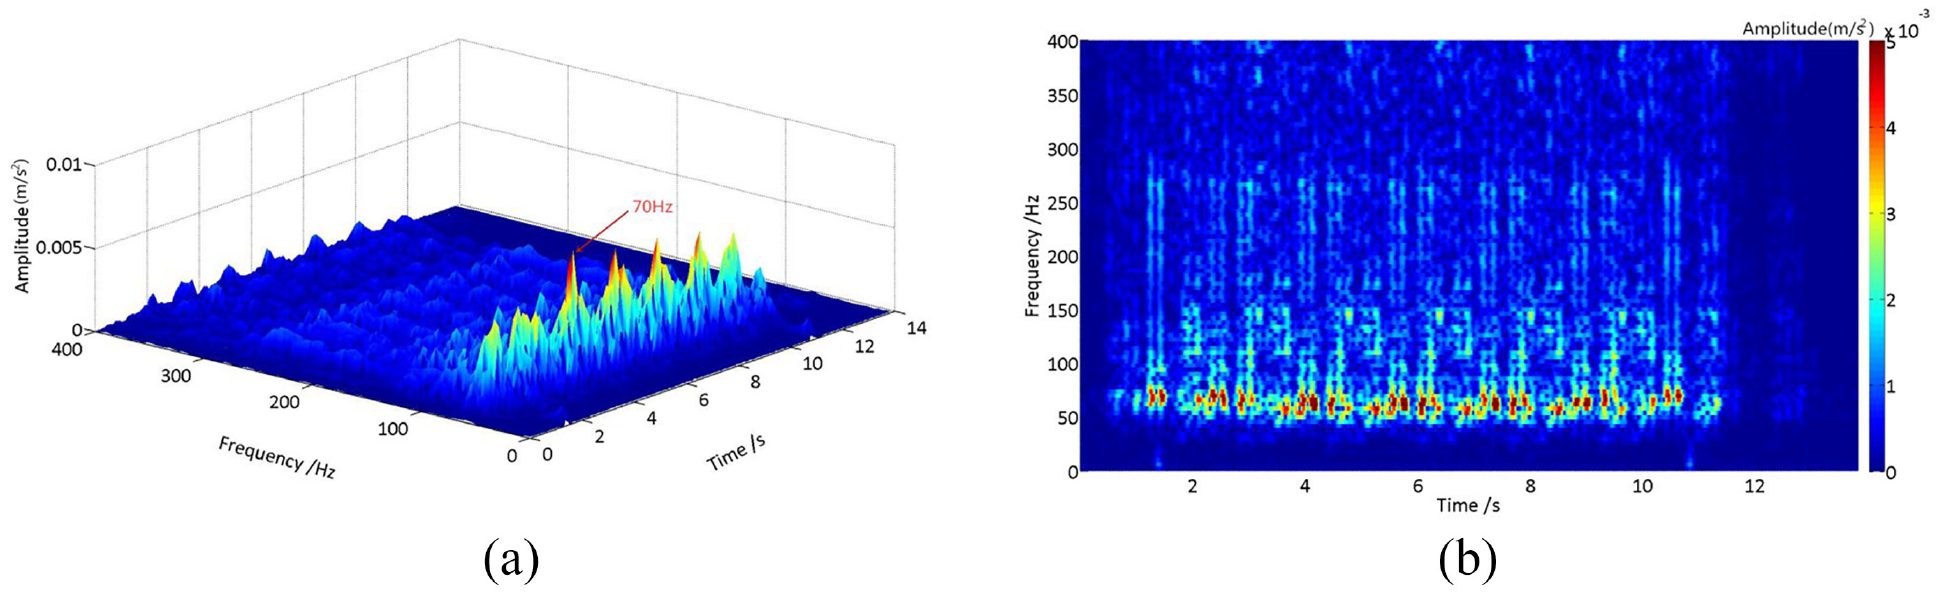
Figure 5 shows a time–frequency spectrum for analyzing the example signal by using the wavelet transform. The 3D diagram illustrates that the peak amplitudes were concentrated in 60–70 Hz, with the maximum amplitude at 67 Hz. Figure 5(b) also presents the vibration signal produced by each wheel set when the train was passing. The vibration signal in the low-frequency region had a higher frequency resolution, which caused the time-frequency spectrum to identify the interference signal at a low-frequency band. High amplitudes were particularly found in the low-frequency region below 10 Hz, which were the vibration signals in the tunnel produced when the train passed. In contrast, the wavelet transform in the high-frequency band had a higher time resolution.
Time–frequency distribution of the example signal by using the wavelet transform: (a) 3D figure, (b) 2D figure.
CQ-NSGT
When it comes to the nonstationary Gabor transform of constant quality factor Q, we may first think of the wavelet transform because its quality factor Q is also constant. However, its quality factor Q is low, which will affect its vibration signal-processing resolution. In contrast, the nonstationary Gabor transform of the constant Q has a higher Q factor. 19
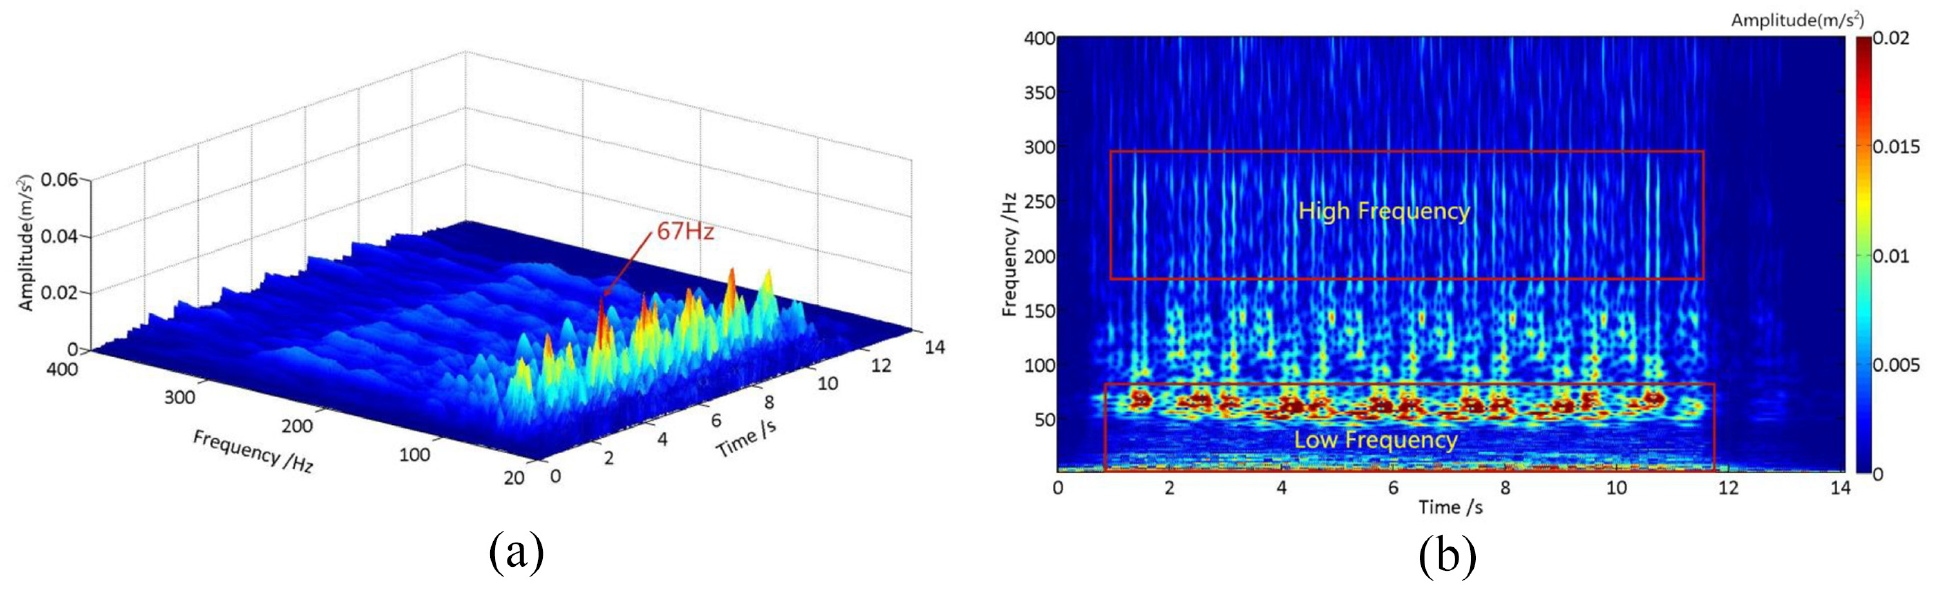
Figure 6 is a time spectrum of an example signal analyzed by CQ-NSGT. CQ-NSGT uses the concept of Hilbert space frame, so its y axis is a logarithmic growth rule in pairs, but the frequency range of 0–400 Hz is still taken for analysis and comparison, which can be shown in the time–frequency spectrum for analyzing the example signal by using CQ-NSGT. The 3D time spectrum diagram shows that the peak amplitudes were concentrated in 65–80 Hz, with a maximum amplitude at 72 Hz. The 2D time–frequency spectrum illustrates that the CQ-NSGT had a high time resolution and a high-frequency resolution in the frequency band below 200 Hz. Even the vibration signals of the two wheel sets (i.e. front and rear) of each bogie can be observed in the time domain when the train passed the measuring points [Figure 6(b)].
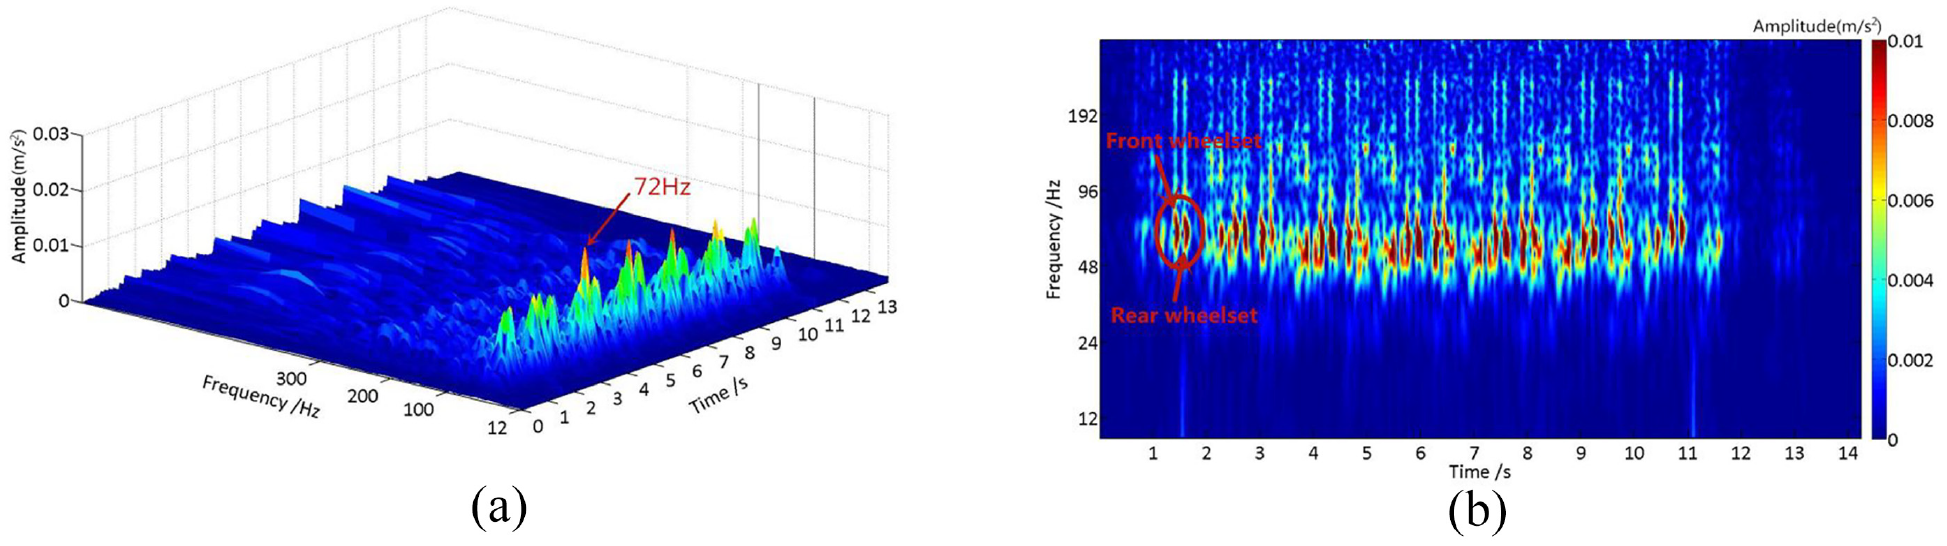
Time–frequency distribution of the example signal by using CQ-NSGT: (a) 3D figure, (b) 2D figure.
Brief summary
We reach a conclusion by comparing and analyzing the time-frequency spectra of the example signal using the three abovementioned time-frequency analysis methods.
According to Table 2, the amplitude peak concentrated frequency bands of the time-frequency diagrams obtained by the three methods are similar, and the difference between the maximum amplitude values is very small, which shows that CQ-NSGT method is reliable for analyzing the vibration signals of vehicle crossings.
Comparison of three time-frequency analysis methods.
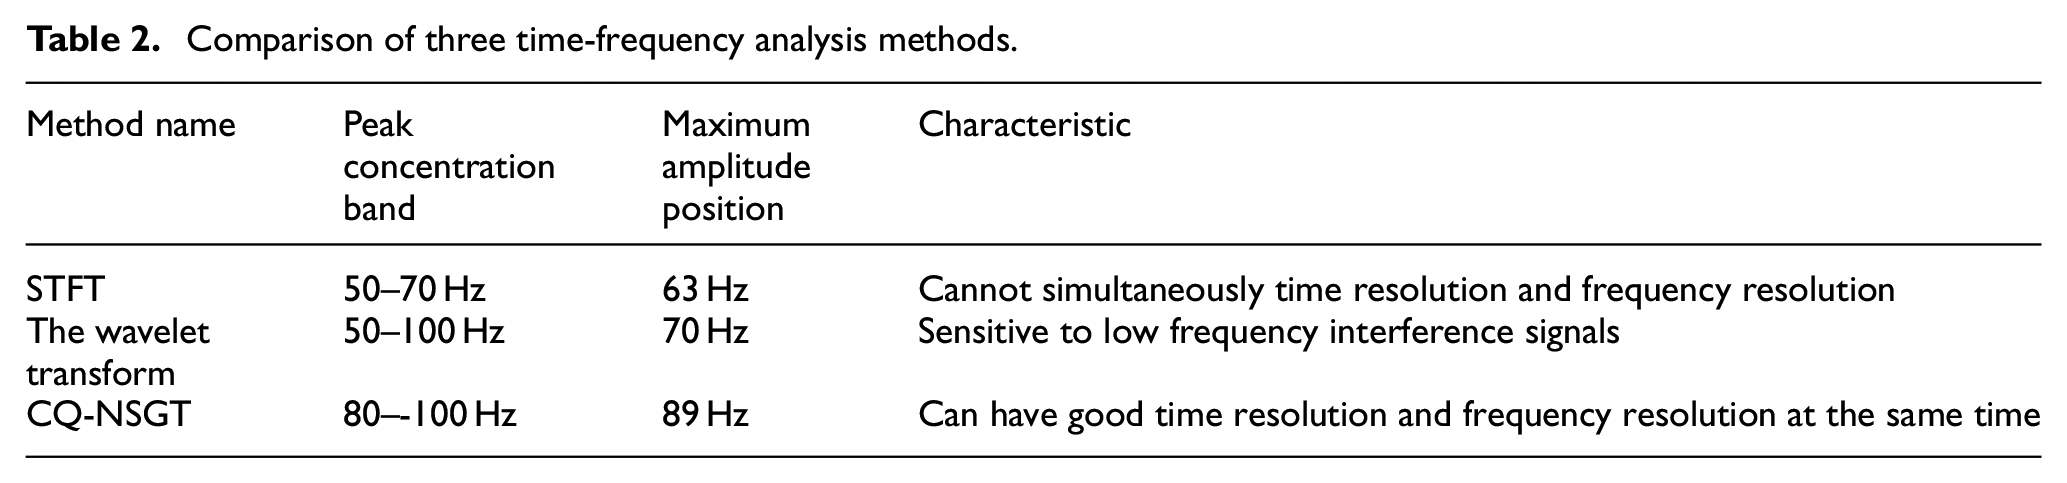
The window function of the STFT was fixed; hence, the STFT had a higher frequency resolution, but a lower time resolution for analyzing the example signal. It was not suitable for analyzing the characteristics of the vibration signals. The wavelet transform was highly adaptive to the nonstationary vibration signals. It had a higher time resolution at a high-frequency band and a higher frequency resolution at a low-frequency band. However, it was sensitive to the interference signals at a low-frequency band, and cannot accurately analyze the complex vibration signals in the turnout zones. CQ-NSGT had a high time resolution and a high-frequency resolution within the range of the frequency bands being analyzed. Furthermore, it can accurately identify the amplitude changes in a specified frequency range. In summary, the CQ-NSGT time–frequency analysis method is better than the STFT and the wavelet transform when studying the transmission characteristics of the vibration signals from the track slab to the tunnel wall.
Analysis of the transmission characteristics
In this section, the CQ-NSGT method was employed to compare and analyze the vertical transmission characteristics of the vibration signals in three turnout crossing and switch zones on three different lines.
First of all, select three groups of turnout data in 10 trips. The single trip data is the time domain waveform that intercepts the position of the front of the train passing through the measuring point more than 3m to the position of the rear of the train passing through the measuring point section more than 3 m. The time length is uniformly controlled to be 15 s. In order to analyze whether the data of different trains have certain accuracy, the variance value of the frequency division vibration level of 1–200 Hz for each train data of each turnout in each group is analyzed. As shown in Figure 7, the variance value of each frequency at the same measuring point is small, and when the frequency is higher than 50 Hz, the variance value of the train data in the three turnout groups is less than 1. Therefore, in the analysis of this section, only one representative train data is selected to analyze each turnout of each group. The average speeds of trains passing through the three sets of turnouts are 43.12 km/h, 45.87 km/h and 67.74 km/h respectively, ensuring that the single train speed of the selected data is not much different from the actual measured running speed.
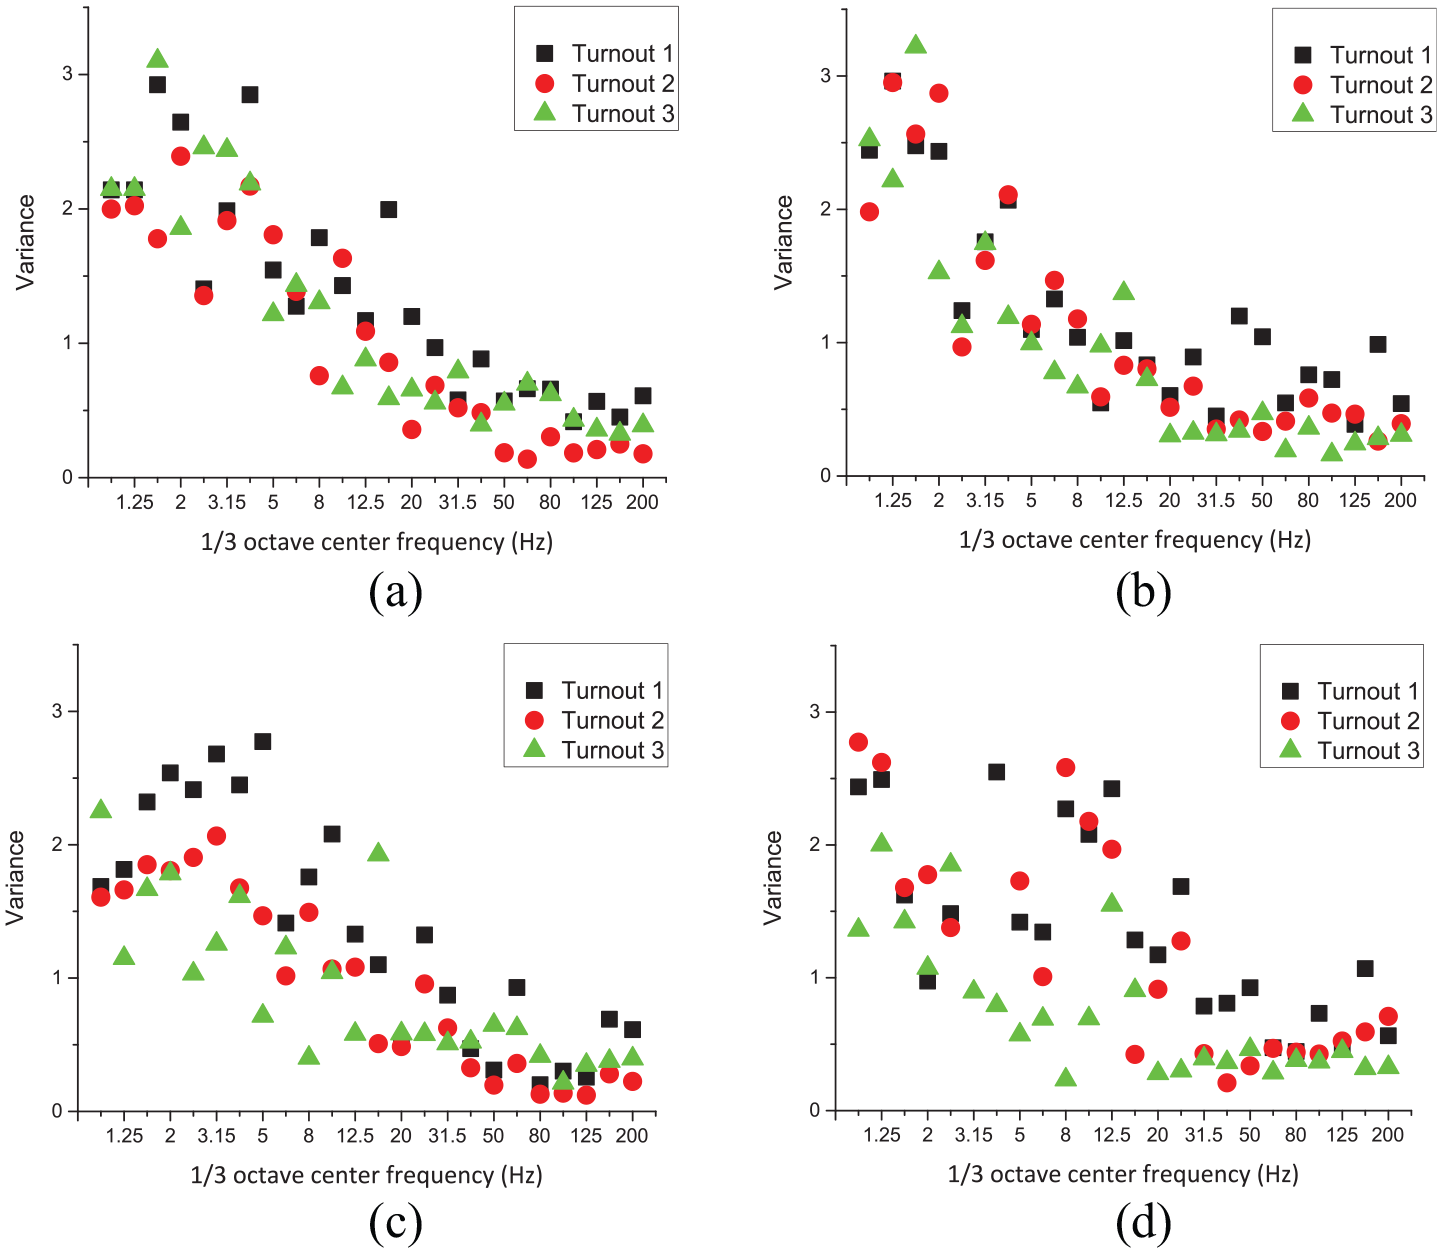
Square difference of frequency division vibration level at each measuring point: (a) Track slab in the switch zone, (b) Tunnel wall in the switch zone, (c) Track slab in the crossing zone, and (d) Tunnel wall in the crossing zone.
Table 1 shows that no significant differences existed in the service times of the three turnouts. The speeds of the train passing the No. 1 and 2 turnouts were 43 km/h and 46 km/h, respectively. The speeds at which the train passes the turnouts were substantially the same. The No. 1 and 2 turnouts handle Type B and A vehicles, respectively. Both No. 2 and 3 turnouts handle Type A vehicles. The actual speed at which the train passes the No. 3 turnout was 68 km/h, which is significantly higher than the actual speed at which the train passes the No. 2 turnout.
With the No. 2 turnout as the research object, we will analyze herein the differences between the transmission characteristics of the source intensity from the track slab to the tunnel wall both in the turnout switch zone and in the turnout crossing zone. We will also compare the differences in the characteristics of the vertical vibration transmission from the track slab to the tunnel wall between different types of vehicles passing the turnout at the same speed by analyzing the characteristics of the vertical vibration transmission from the track slab to the tunnel wall in the No. 1 and 2 turnouts. Furthermore, the differences in the characteristics of the vertical vibration transmission from the track slab to the tunnel wall of the same type of trains passing the turnout at different speeds will be compared analyzing the characteristics of the vertical vibration transmission from the track slab to the tunnel wall at the No. 2 and 3 turnouts.
Regionality of the transmission characteristics of the turnout source intensity
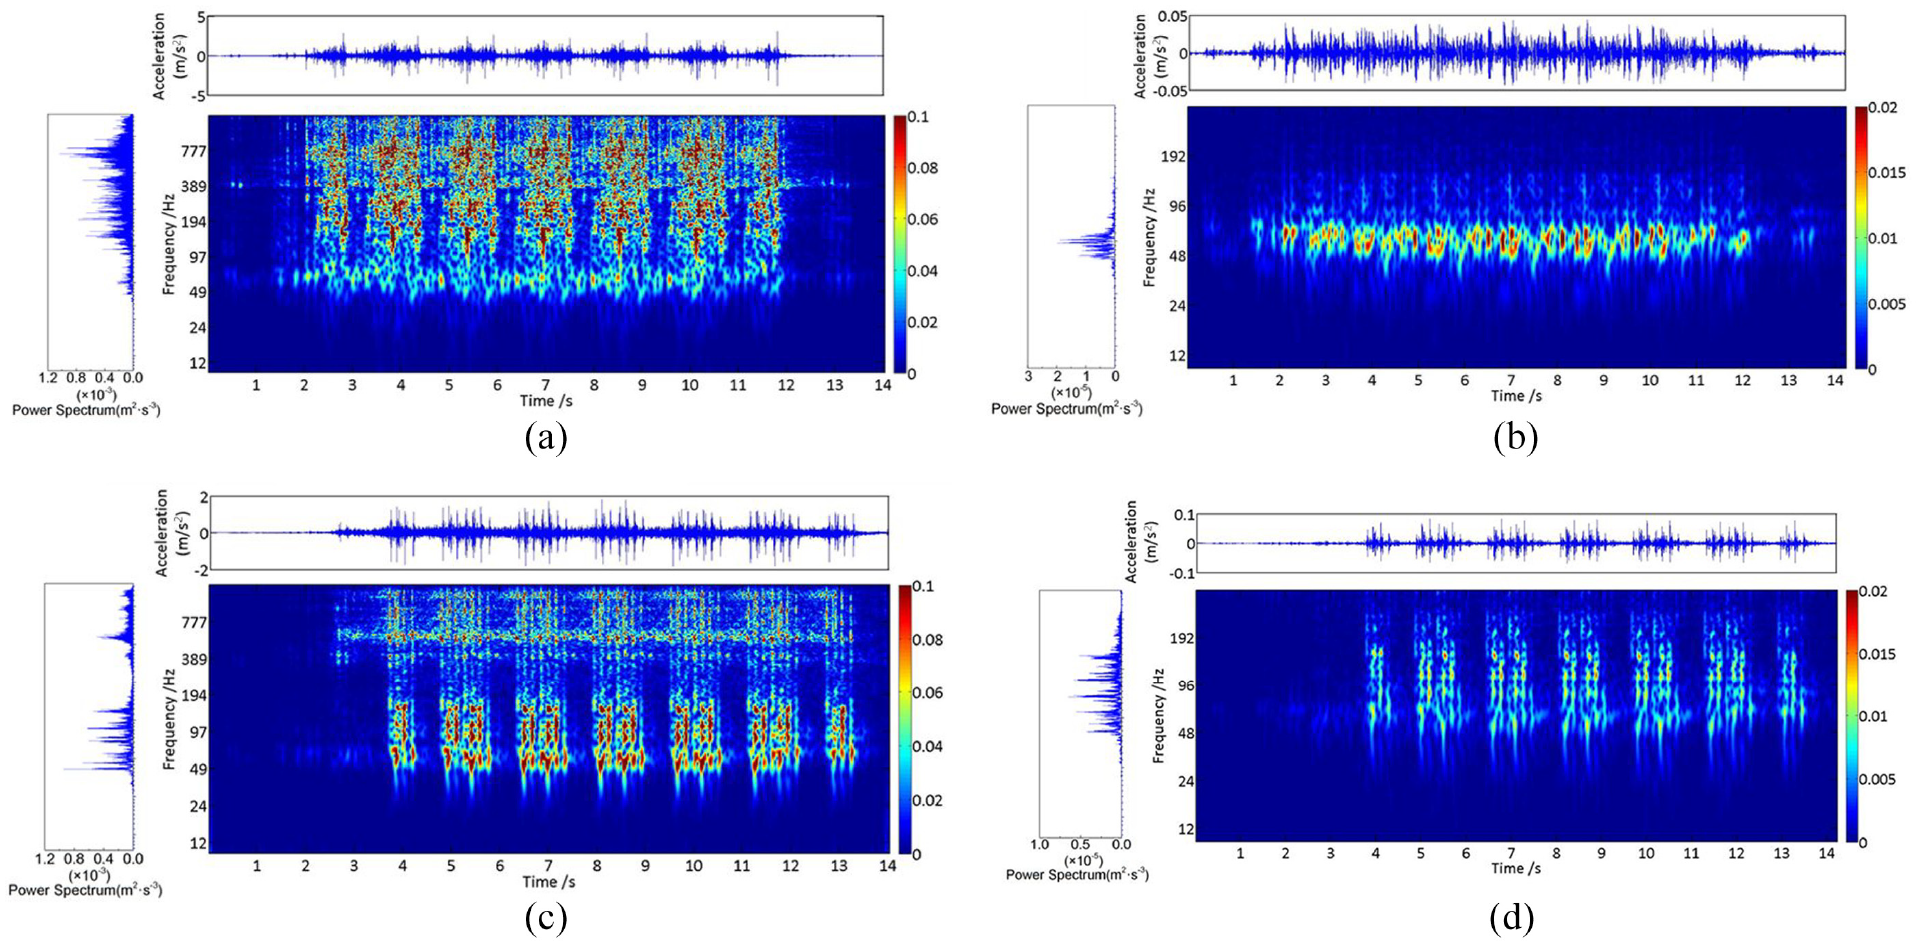
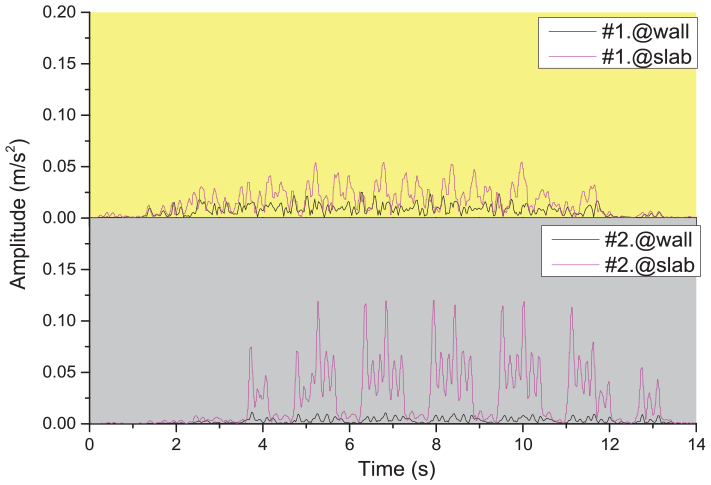
Figure 8 shows the spectrogram of the source intensity of the track slab and the tunnel wall in the switch and crossing zones at the time when the train passed the No. 2 turnout, in this figure as well as Figures 9 and 10, the right axis label represents amplitude and the unit is m/s2. The vibration and background vibration signals produced when the train passes can be clearly distinguished based on the spectrogram. The vibration response time of each of the four measuring points was approximately 10.5 s. A single vehicle of a Type A train was 22.5 m long. The six-vehicle train passing the turnout at 46 km/h was 10.6 s. The frequency spectrum of the track slab and the tunnel wall in the crossing zone showed 12 vibration peaks, which corresponded to the vibration responses caused by each wheel set of the six-vehicle train.
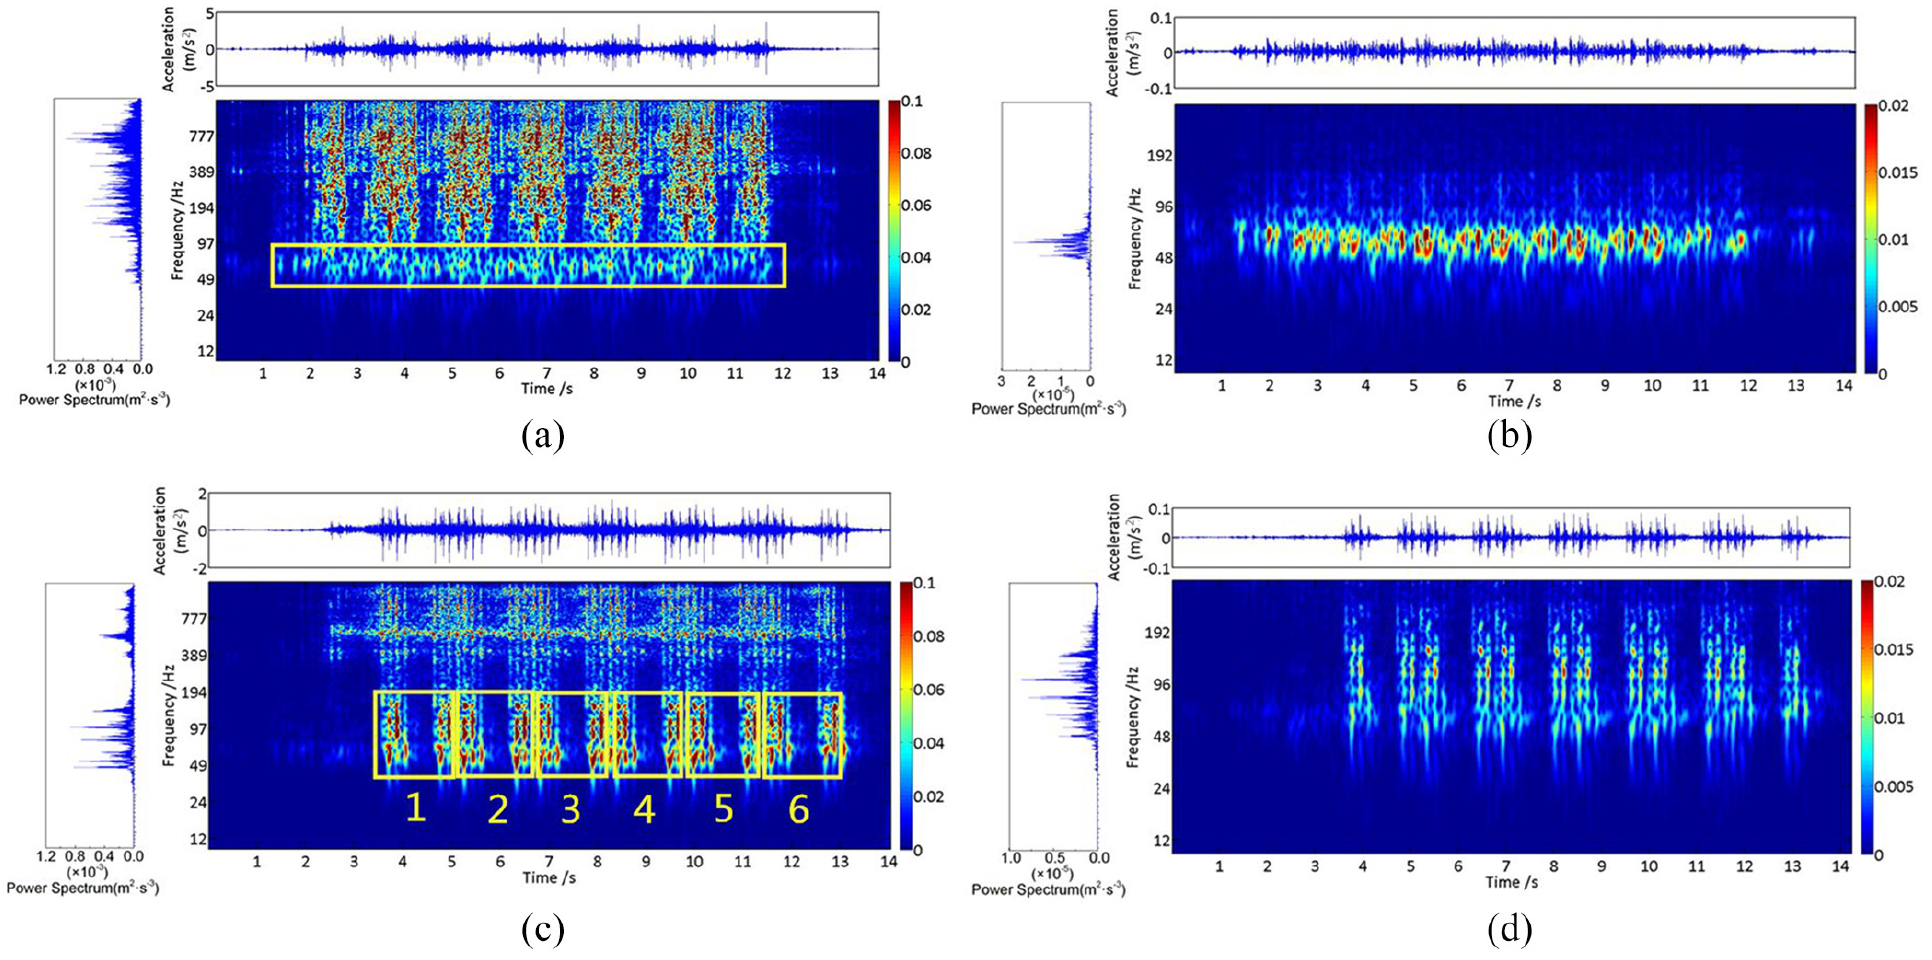
Spectrum diagram of four measuring points of turnout 2: (a) Track slab in the switch zone, (b) Tunnel wall in the switch zone, (c) Track slab in the crossing zone, and (d) Tunnel wall in the crossing zone.
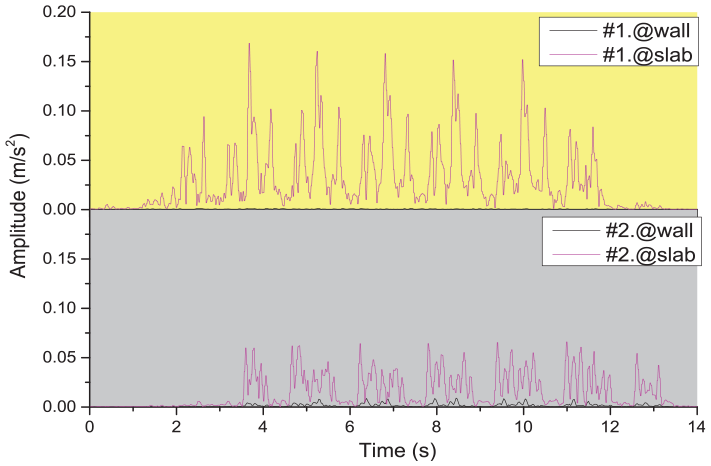
Spectrum diagram of four measuring points of turnout 1: (a) Track slab in the switch zone, (b) Tunnel wall in the switch zone, (c) Track slab in the crossing zone, and (d) Tunnel wall in the crossing zone.
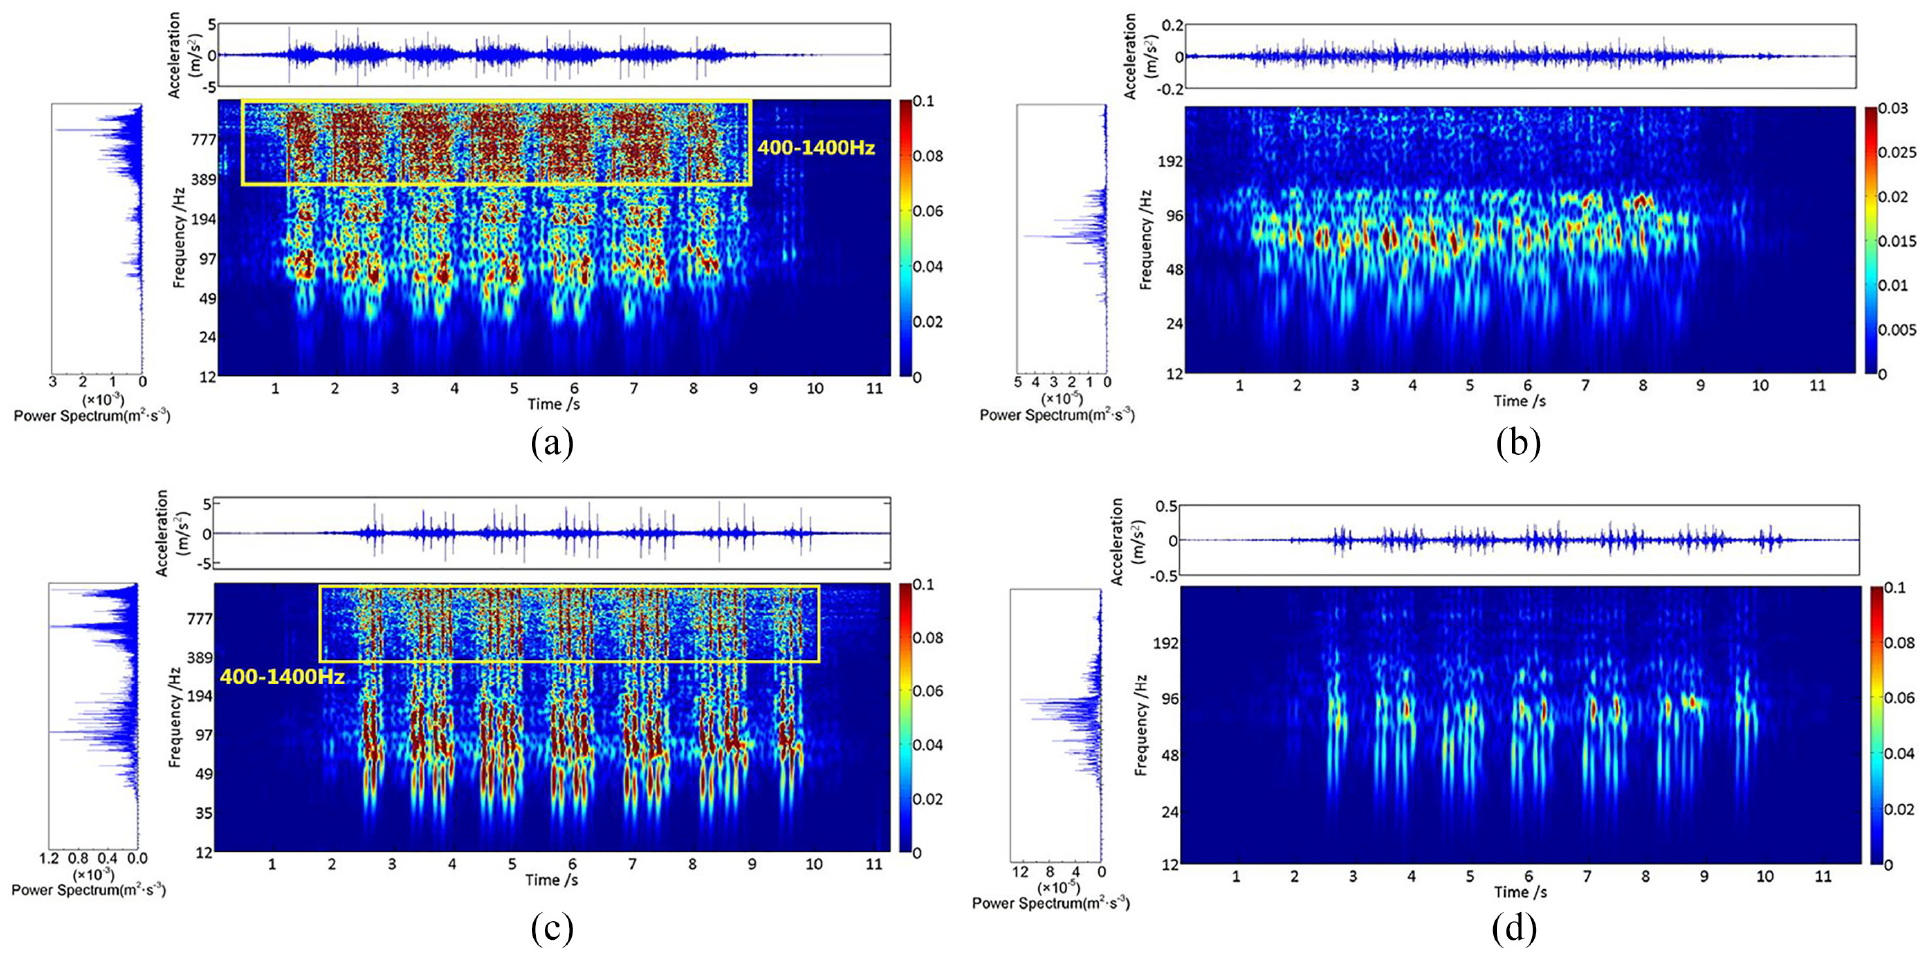
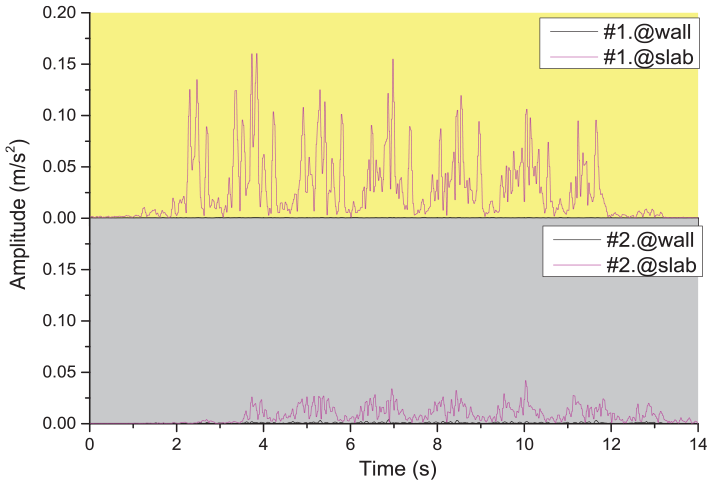
Spectrum diagram of four measuring points of turnout 3: (a) Track slab in the switch zone, (b) Tunnel wall in the switch zone, (c) Tunnel in the crossing zone, and (d) Tunnel wall in the crossing zone.
The vibration energy of the track slab in the switch zone was mainly concentrated in 100 Hz–800 Hz. The vibration energy of the tunnel wall was concentrated in 50 Hz–75 Hz. The vibration energy transmitted from the track slab to the tunnel wall was not the main frequency band of the track slab, but Figure 8(a) shows that a frequency band still existed, where the vibration signal was transmitted to the tunnel wall from the track slab. The results in the crossing zone were, however, different. Figure 8(c) and (d) depict that the energy of the slab bed in the crossing zone was mainly concentrated in 50 Hz–160 Hz. Compared with the switch zone, the crossing zone had a hazardous space; as a result, the vibration response generated by the wheel–rail impact in this zone differed from that in the switch zone. However, the frequency band, where the energy of the track slab in the crossing zone was concentrated, was consistent with that of the tunnel wall, indicating that the track slab in the crossing zone transmitted the main vibrational energy to the tunnel wall. The main energy of the track slabs in the switch and crossing zone plate was concentrated in different frequency bands because the track slabs in the switch zone had a shorter slab length, a smaller mass of vibration, and a higher vibration response frequency under the same wheel–rail excitation.
The spectrogram shows that the high-frequency vibration of the track slabs transmitted to the tunnel wall in the switch and crossing zones was almost filtered out, indicating that the vibration response will attenuate at a high-frequency band when transmitting from the track slab to the tunnel wall in both the switch and crossing zones.
Impact of different vehicle types on the source intensity transmission in the turnout zone
The unsprung mass, track mass, and stiffness of the vehicle are important factors influencing the P2 resonance of the wheel-rail system. 21 With the same track structure, similar service time, and similar speeds at which the train was passing, the No. 1 and 2 turnouts may have the similar track masses and stiffness.It is distinguishable that the Type B vehicles passed the No. 1 Turnout, while the Type A vehicles passed the No. 2 turnout, and their unsprung masses were different. The part below the first stage suspension system was called the unsprung mass, including the mass of the wheel set, axle box, partial driving devices, and first stage suspension. No significant differences were found between the Type A and B vehicles in the mass of the axle boxes, partial driving mechanisms, and first stage suspension. The mass of the wheel set of a Type A vehicle was 1654 kg, which is greater than that of a Type B vehicle (i.e. 1420 kg). Therefore, the unsprung mass of a Type A vehicle was greater than that of a Type B vehicle.
The difference in the unsprung mass between the two types of vehicles was not significant; therefore, the vibration energy of the track slab in the switch zone of the No. 1 Turnout caused by the P2 resonance of the wheel-rail system was still concentrated in 100 Hz–800 Hz, and the vibration energy of the track slab in the crossing zone was still concentrated in 50 Hz–160 Hz. A comparison of the four time-frequency diagrams in Figures 8 and 9 showed no significant difference between the No. 1 and 2 turnouts. The secondary frequency bands were transmitted to the tunnel wall in the switch zone, while the primary frequency bands were transmitted to the tunnel wall in the crossing zone. The transmission results were the same, indicating that a Type A vehicle and a Type B vehicle had similar vibration transmission characteristics when they pass the turnout. This result suggests that the difference in the track state between the No. 1 and 2 turnouts is not significant. Furthermore, it demonstrates the effectiveness of such a control variable comparative analysis method.
Impact of different speeds on the source intensity transmission in the turnout zone
The vibration frequency generated by the wheel-rail impact when the train passes a turnout will change with the traveling speed. The cosine function hypothesis
22
proposed by Zhai Wanming describes
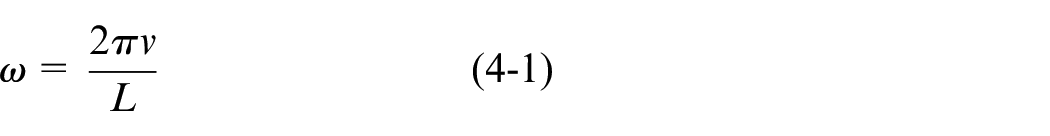
where L is the irregular wavelength of the track itself. The relationship exhibits the following: the greater the speed at which the train passes a turnout, the higher the disturbance frequency generated.
The speed at which the train passes the No. 3 Turnout increases to 68 km/h, and it takes 7.1 s for the train to pass it, which is consistent with the duration of the vibration energy in the spectrogram. A comparison of (a) and (c) in Figures 8 and 10 demonstrated that the energy of the No. 2 and 3 turnouts significantly increased at 800 Hz–1400 Hz in the switch and crossing zones and increased by various amplitudes at 400 Hz–800 Hz. This phenomenon can be found in the power spectral density diagram.
The vibration signals at 25 Hz–50 Hz appeared at the measuring points on the two track slabs, which was not the case at the previous two turnouts, because of the increase in the speed at which the train passes the turnout. Moreover, the vibration signals at this frequency band were transmitted to the tunnel wall. In contrast, the vibration energy was increased at the high-frequency band, but still not transmitted to the tunnel wall, particularly indicating that the vibration signals will attenuate at the high-frequency bands when being transmitted from the track slab to the tunnel wall. Compared with the No. 2 turnout in the crossing zone, the track slabs at the No. 3 turnout added 400 Hz–1400 Hz as its main frequency band, but still transmitted the vibration at 25 Hz–160 Hz to the tunnel wall. The low-frequency bandwidth in the switch zone was expanded from 50 Hz–75 Hz to 25 Hz–125 Hz. The power spectral density diagram shows that this frequency band was still a secondary frequency band, and it was this frequency band that was transmitted to the tunnel wall in the switch zone.
In summary, the increase in the speed at which the train passes the turnout strengthened the vibration signal of the high-frequency bands of the track slab, but the vibration signal still experienced a high-frequency attenuation while being transmitted from the track slab to the tunnel wall. The bandwidth of the measurement points of the track slabs in the low-frequency bands in both the switch and crossing zones somewhat increased with the increase in the speed at which the train passes the turnout. The secondary band of low frequency in the switch zone was still transmitted to the tunnel wall. The primary band of high frequency in the crossing zone was increased, but the low-frequency band was still transmitted to the tunnel wall as the primary frequency band. The energy generated by the wheel–rail impact vibration increased to a certain extent because of the increase in the speed at which the train passes the turnout. The vibration energy of the tunnel wall at both cross-sections somewhat increased, and the amplitude of increase in the crossing zone was higher than that in the switch zone, which is attributed to the existence of a hazardous space.
Attenuation law of individual frequencies
The earlier discussion indicated that both measuring points on the track slabs and the tunnel walls at the three turnouts had a primary frequency band of 50 Hz–75 Hz. For the analysis of the attenuation characteristics of the dominant frequencies, these frequencies and their time durations were used to describe the time-frequency characteristics of the frequency spectrum, thereby making it easier to position the important frequency components in the signal. To this end, the data of the No. 2 turnout were selected. The total matrix of the CQ-NSGT time-frequency diagram was used to generate the corresponding frequency-domain sections and amplitudes of the frequency components as a function of time (Figures 11–15).
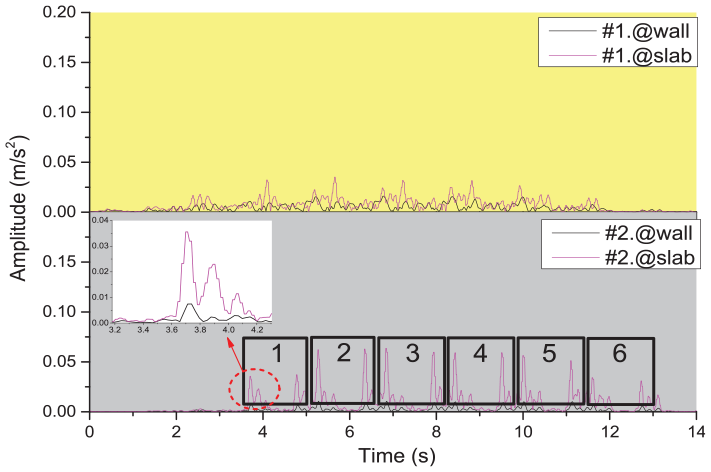
Time duration of the frequency component of 50 Hz.
Time duration of the frequency component of 60 Hz.
Time duration of the frequency component of 70 Hz.

Time duration of the frequency component of 200 Hz.
Time duration of the frequency component of 300 Hz.
Here, three dominant frequencies of 50 Hz, 60 Hz, and 70 Hz were selected from the primary frequency band. For comparison purposes, two non-dominant frequencies of 200 Hz and 300 Hz were selected at the same time. The #2.@slab measuring point in Figure 11 clearly presents that the vibration peak was caused by each wheel set when the six-vehicle train passed the test section. The phenomenon was not obvious in the duration diagram for the other frequency components, but obvious peak values were still present in the corresponding time durations.
The figure depicts that the amplitude of the tunnel wall was very small when the frequency was not in the main frequency band, which is consistent with the law reflected in the time-frequency diagram in Figure 8. A peak would be triggered when each wheel pair of the vehicle passes the measuring point. The peaks at the measuring points of the two test sections were not the same because of the complexity of the turnout structure; however, the duration of the amplitude attenuation at each measuring point was substantially consistent at approximately 0.1 s. Figure 15 also shows that the attenuation times of the source intensity at the measuring points of the tunnel wall and the track slab were consistent.
The maximum vibration amplitude of the track slab in the switch zone was concentrated at 70 Hz, but Figure 13 shows that this frequency component was not transmitted to the tunnel wall. Most of the amplitudes in the switch zone at 50 Hz and 60 Hz, although less than the amplitude at 70 Hz, were transmitted to the tunnel wall. The frequency component of the maximum amplitude of the track slab in the crossing zone was 60 Hz, but the amplitudes of the three frequencies transmitted to the tunnel wall slightly differed. As shown in Figures 14 and 15, compared with the dominant frequency band, the individual frequencies in the non-dominant frequency band were irregular, especially 300 Hz, which was basically not present on the tunnel wall.
Discussion
CQ-NSGT time–frequency analysis method allows for an in-depth analysis of the transmission characteristics of the vibration signal, and can improve our ability to identify the main source responsible for the excessive vibration and the law of transmission thereof. Such an identification ability provides theoretical support for the design of the novel turnout vibration reduction technique with respect to the steel spring floating slab track bed for turnouts, and can verify its vibration reduction effect by analyzing the transmission characteristics of the vibration signal in the turnout zone.
The vibration caused by the wheel-rail interactions is a nonstationary signal type. The traditional Fourier transform cannot deliver the signal spectrum as a function of time, and a time–frequency analysis may be conducted to process the complex vibration signal caused by the metro vehicle at the time when it passes the turnout and further understand the distribution of signal over the time-frequency. This research presents the vertical vibration transmission characteristics of three No. 9 single turnouts on three different lines, which may serve as guidelines for subsequent research and optimized designs of metro turnouts. However, the lateral vibration transmission characteristics of the turnout zone are far more complicated than the vertical vibration transmission characteristics. Hence, further research is required to analyze the lateral transmission characteristics of the vibration signal caused by the metro vehicle passing the turnout by using the time-frequency analysis method.
Conclusion
Focusing on the vibration signals in the turnout zones, we analyzed herein the vibration characteristics of the track slabs in the switch and crossing zones of the three turnouts and the characteristics of the vibration signal transmission from the track slabs to the tunnel wall by using the optimal time-frequency analysis method. The following are conclusions:
By comparing the vibration signals processed by the three types of time-frequency transforms, we conclude that CQ-NSGTis a more visualized and reasonable time-frequency representation method with a higher time-frequency resolution. Using this method to process the vibration signals produced by a train passing a turnout can enable researchers to obtain more detailed and accurate vibration information. This high-precision time–frequency analysis method may also be leveraged for the early detection of damages to the turnout structures and provide a theoretical basis for their maintenance.
By analyzing the vibration signals at the four measuring points of the No. 2 turnout by using the CQ-NSGT method, we have found that the vibration response in the turnout zone experiences a high-frequency vibration attenuation when being transmitted from the track slab to the tunnel wall. The track slab in the switch zone transmits its vibration signal in the secondary 50–75 Hz frequency band to the tunnel wall. The frequency band of 50 Hz–160 Hz generated by the wheel-rail impact is used as the primary frequency band of the track slab transmitted to the tunnel wall because of the existence of a hazardous space and wider track slabs in the crossing zone. And through the analysis of the change law of single frequency component with time, it is found that the frequency component in the dominant frequency band is transmitted to the tunnel wall regularly, which is obviously superior to the non-dominant frequency band. It should be pointed out that by comparing the analysis results of No. 1 turnout and No. 2 turnout, the difference in vehicle types has no effect on the transmission of vibration signals, and by comparing the analysis results of No. 3 turnout and No. 2 turnout, in the two test sections of the No. 3 turnout, the vibration energy of the track slab within the high-frequency band significantly increases, especially in the switch zone, as the speed increases. However, the vibration signal still experiences a high-frequency attenuation, and the bandwidth of the low-frequency band transmitted to the tunnel wall is widened.
Footnotes
Declaration of conflicting interests
The author(s) declared no potential conflicts of interest with respect to the research, authorship, and/or publication of this article.
Funding
The author(s) received no financial support for the research, authorship, and/or publication of this article.