
Abstract
The recognition of partial discharge mode is an important indicator of the insulation condition in transformers, based on which maintenance can be arranged. Discharge feature extraction is the key to recognize discharge mode. To solve the problem of poor stability and low recognition rate of partial discharge mode, this paper proposes a feature extraction method based on synchrosqueezed windowed Fourier transform and multi-scale dispersion entropy. First, the four partial discharge signals collected under laboratory conditions are decomposed by synchrosqueezed windowed Fourier transform, then a number of band-limited intrinsic mode type functions are obtained, and the original feature quantities of partial discharge signals are obtained by calculating the multi-scale dispersion entropies of each intrinsic mode type function. Based on that, original feature quantity is optimized by using the maximum relevance and minimum redundancy criteria. Finally, the classification is implemented by the support vector machine. Experimental results show that in the case of noise interference, the proposed synchrosqueezed windowed Fourier transform–multi-scale dispersion entropy method can still accurately describe the feature of different discharge signals and has a higher recognition rate than both the empirical mode decomposition–multi-scale dispersion entropy method and the direct multi-scale dispersion entropy method.
Keywords
Introduction
The operation status of power transformers is directly related to the safe operation of the entire power system, and partial discharge (PD) is an important symptom and manifestation of transformer insulation degradation. 1 The feature extraction of the PD signal is a key step of transformer fault diagnosis.1,2 Since the electromagnetic environment in the substation field has a great influence on the recognition accuracy, the focus of research has been to find more effective methods for feature extraction of the PD signal, which can effectively eliminate noise interference, while fully reflecting the essential information of signals. The traditional phase statistics methods based on atlas analysis are widely used, but the time-domain information is not fully utilized.3–6 The joint time–frequency analysis methods of the PD signal compensate for the deficiency of the atlas method to a certain extent but is still in the stage of research.7,8
At present, the commonly used methods for feature extraction of PD signals include the statistical feature extraction method,3,7 fractal feature extraction method, 8 waveform feature extraction method, 9 wavelet feature method, 10 empirical mode decomposition (EMD) method,11,12 and so forth. Although to some extent the above feature extraction method can extract the characteristics of PD signal well, there are still some shortcomings. The statistical feature extraction method needs a large number of samples, and the dimension of extracted feature is high, which will lead to information redundancy and make subsequent recognition difficult. The fractal dimension calculation of the fractal feature extraction method is affected by the signal length and the number of effective discharge signal points, and the extracted feature dimension is relatively high. The waveform feature extraction method requires a high accuracy of signal acquisition, and it is difficult to accurately extract the characteristic representing the non-stationary dynamic PD signal. It is very hard to choose the proper wavelet basis and decomposition layer when extracting the feature of the PD signal by the wavelet feature method. EMD can decompose the PD signal adaptively, but the decomposition results are heavily affected by noise, and also, there is serious modal aliasing. Synchrosqueezed windowed Fourier Transform (SSWFT) is a new non-recursive time–frequency analysis method. 13 On the basis of windowed Fourier transform, SSWFT minimizes the sum of bandwidth of each mode by ridge extraction and synchrosqueezing and achieves adaptive signal decomposition. SSWFT solves the mode aliasing of EMD, and the components with similar frequencies can be separated correctly. SSWFT uses the optimal filter to process the coefficients during the synchronous extrusion process, so it has better noise robustness. 14
Entropy is a method to measure the complexity of time series and has been widely used in feature extraction and fault diagnosis. 15 In the literature,16,17 multi-scale sample entropy (MSE) is applied to the fault diagnosis of rolling bearings. Studies in the literature18,19 have applied multi-scale permutation entropy (MPE) to feature extraction of electroencephalogram signals and system mutation detection and achieved good results. Nevertheless, these methods have their own shortcomings. For example, MSE is slow in processing long data, poor in real-time performance, and prone to mutation in similarity measurement. Although the calculation speed of MPE is high, the difference between the average amplitude and the amplitude value is not considered. 20
In order to overcome the inherent defects of the above two methods, in 2017, Azami et al. 21 proposed a new irregular index multi-scale dispersion entropy (MDE). The calculation speed of MDE is high and is less affected by an abrupt signal. It takes into account the relationship between the amplitudes and overcomes the shortcomings of MSE and MPE to a certain extent. Compared with MSE and MPE, the results show that MDE has better stability, higher calculation speed, and more advantages in error and feature extraction. 21
In view of the advantages of MDE in extracting features of non-linear dynamic complexity, this manuscript introduces MDE into the field of PD feature extraction. However, due to the large randomness of PD and the noise in the discharge signal, if only MDE is used to process the PD signal, it will not be enough to represent the multi-scale complex characteristic of the PD signal, 22 which will affect the accuracy of the characteristic quantity. SSWFT can decompose a complex multi-component into a series intrinsic mode type functions (IMTFs), that is, it can realize the multi-scale decomposition of the PD signal adaptively. Based on this, by combining SSWFT with MDE, a new feature extraction and quantitative description method of the PD signal is proposed based on SSWFT and MDE (SSWFT–MDE).
First, the PD signal is decomposed into a series of IMTFs by SSWFT. Then, the MDE values of each IMTF are calculated, and the obtained MDE values are taken as the characteristic vectors of PD signals. Finally, a classifier based on support vector machine (SVM) is established to recognize the characteristic vectors of the PD signal, realizing the intelligent diagnosis of PD types. The proposed method is applied to the pattern recognition of PD signals in substations and compared with the MDE method and EMD–MDE method. The results show that the proposed method can recognize the types of PD faults more accurately than EMD–MDE and MDE.
Synchrosqueezed windowed Fourier transform
The PD signal
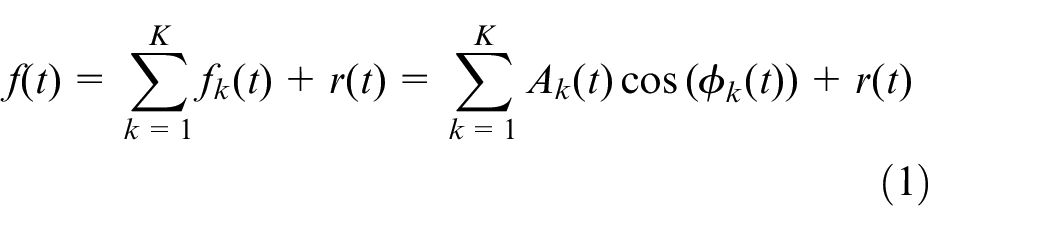
where
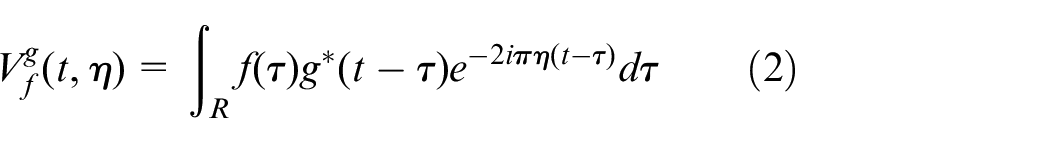
Existing studies have shown that13,14 in the time–frequency diagram of windowed Fourier transform, the spectral distribution of the signal is wide and the boundary is blurred. For more complex multi-component signals, there is often serious spectrum aliasing between the WFT spectrum of the components.
SSWFT is a new time–frequency analysis method based on windowed Fourier transform.
13
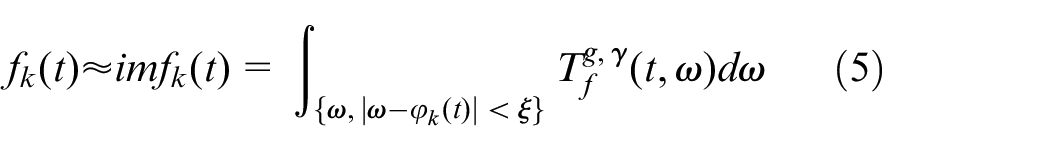
By refining the time–frequency curve of WFT, SSWFT can effectively calculate the amplitude
The instantaneous frequency any point
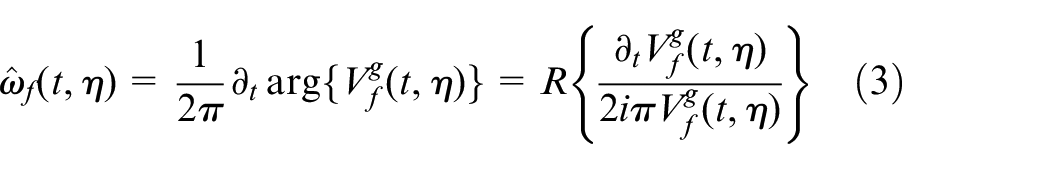
where
Let
The
For multi-component signals
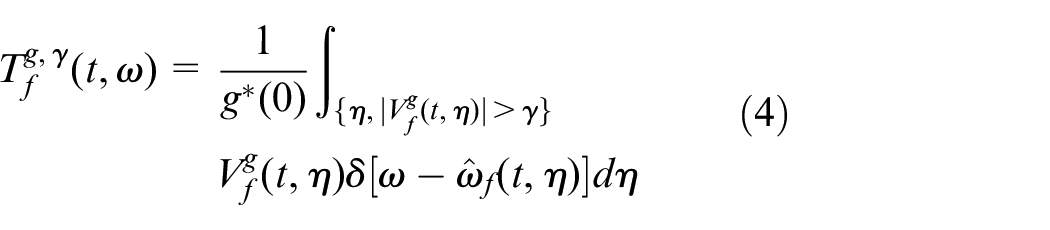
where
where
MDE theory
DE is an algorithm for measuring the complexity or irregularity of a time series. For a given time series
The time series x is mapped to
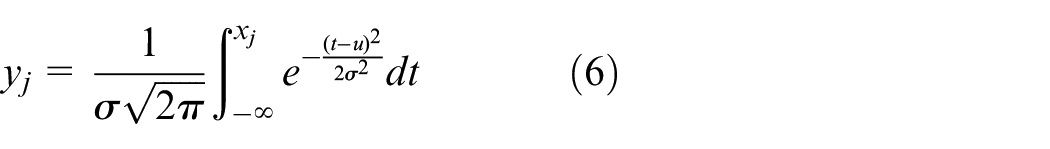
where u and
y is mapped to the range of

where R is the rounding function, and c is the number of categories. In fact, steps 1 and 2 map each element in the time series x to
The embedded vector
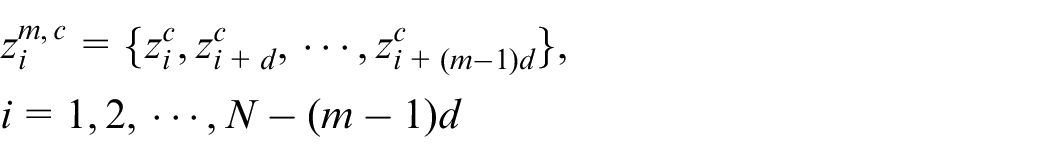
where m and d are embedding dimensions and delays, respectively.
The scatter pattern
The probability
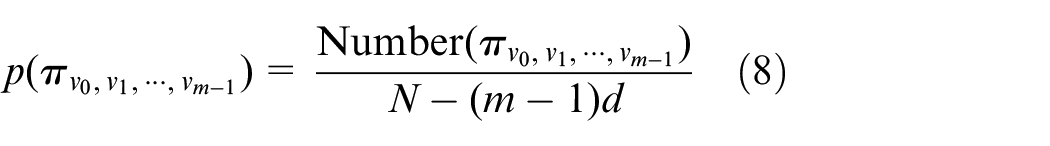
where
According to the definition of Shannon entropy, the DE of the original signal x is defined as
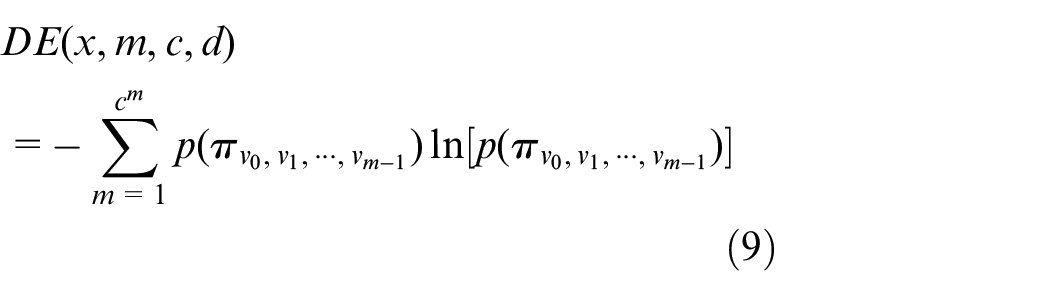
Similar to sample entropy and permutation entropy, DE is also a way to characterize the irregularity of time series. The larger the DE value, the higher the degree of irregularity; the smaller the DE, the lower the degree of irregularity. It can be seen from the DE algorithm that when all the scattering modes have the same probability, DE takes the maximum value
MDE is defined as the dispersion entropy of a sequence after multi-scale coarse granulation. The original sequence is
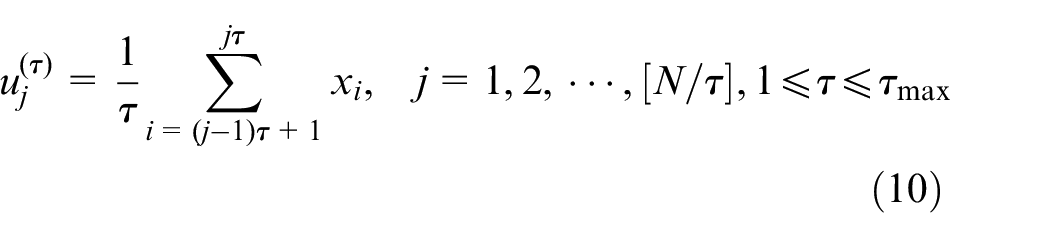
where the scale factor is
Feature extraction process based on SSWFT–MDE
The ability of MDE to characterize signal complexity depends on the selection of embedding dimension m, category number c, delay time d, and scale factor
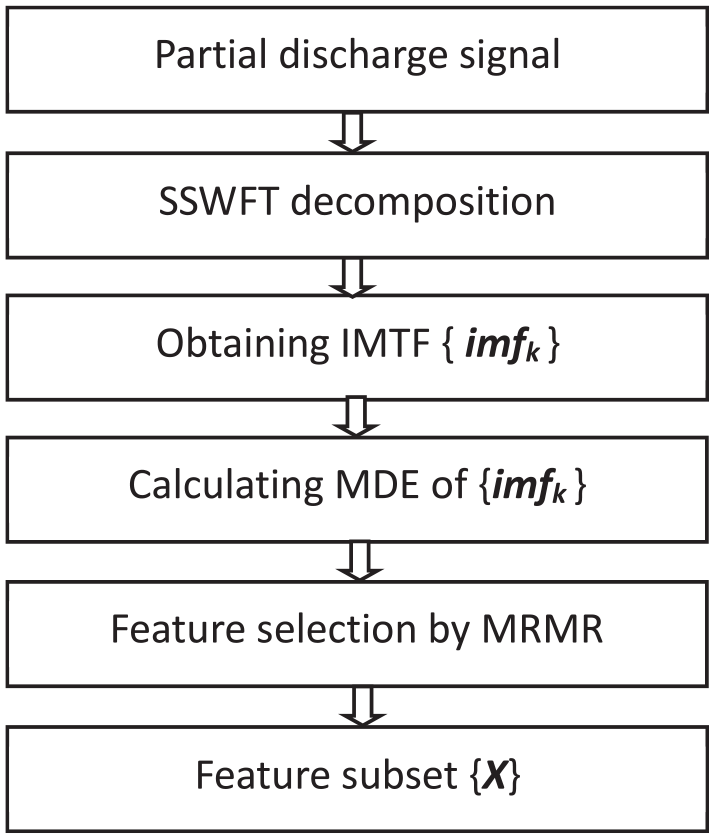
Flow-chart of synchrosqueezed windowed Fourier transform–multi-scale dispersion entropy features extraction of partial discharge.
In this paper, the scale factor of MDE is set to 14, and if the MPEs of all modals are directly composed into feature vectors, the dimensions of the feature vector will be as high as 84, which will cause a “dimension disaster” for subsequent pattern recognition. In order to reduce the redundant information in the feature vector and improve the computational efficiency, the optimal feature vectors are selected according to the criterion of maximum relevance and minimum redundancy (MRMR). 24
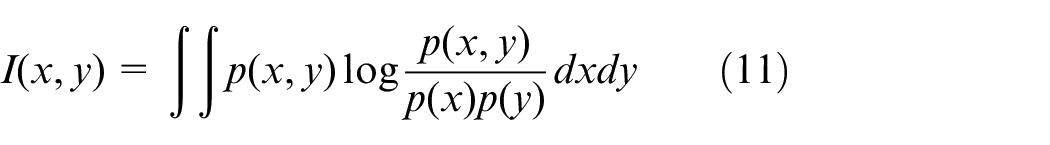
For a given two random variables x and y, supposing that
In order to analyze the relevance and redundancy of features, D and R are respectively used to represent the correlation and redundancy indexes of the feature subset. Supposing C is the target category,
The minimum redundancy can be given as
According to the formula of MRMR, the formula of the MRMR criterion is as follows

The three scale factors with MRMR are selected from 14 scale factors and composed of a 18-dimensional feature subset.
PD pattern recognition based onSSWFT–MDE
Experimental model
According to the form and characteristics of the PD of the transformer, four discharge models are constructed in the laboratory. In order to make the collected discharge signals more representative, discharge models of various sizes and parameters are designed, including floating discharge (FD), needle-plate discharge (ND), surface discharge (SD), and corona discharge (CD).
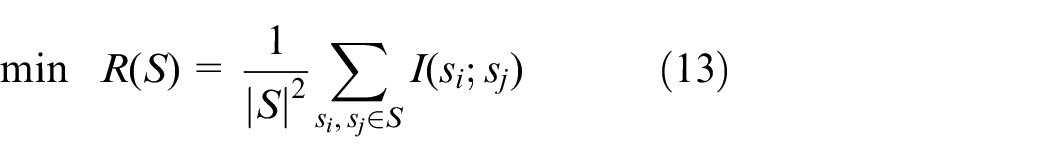
PD models are shown in Figure 2. The diameter and thickness of all circular plate electrodes are 80 mm and 10 mm, the thickness of all cardboards is 0.5 mm. Figure 2(a) shows the electrode structure for simulating the FD in oil, and a metal particle with diameter of 0.3 mm is placed at the edge of the epoxy plate. Figure 2(b) shows a needle plate structure for simulating the CD in the oil. The diameter of the needle neck is 0.2 mm, the thickness of the epoxy plate between the needle and the plate electrode is 0.5 mm, and the diameter is 1 mm. Figure 2(c) shows the simulation of the discharge along the surface of oil. Figure 2(d) simulates the model structure of CD in insulation. The corona consists of three layers of epoxy plates with a diameter of 60 mm and a thickness of 0.5 mm, and the diameter of the center circular hole is 20 mm.
Partial discharge (PD) models: (a) floating discharge (FD); (b) needle-plate discharge (ND); (c) surface discharge (SD); and (d) corona discharge (CD).
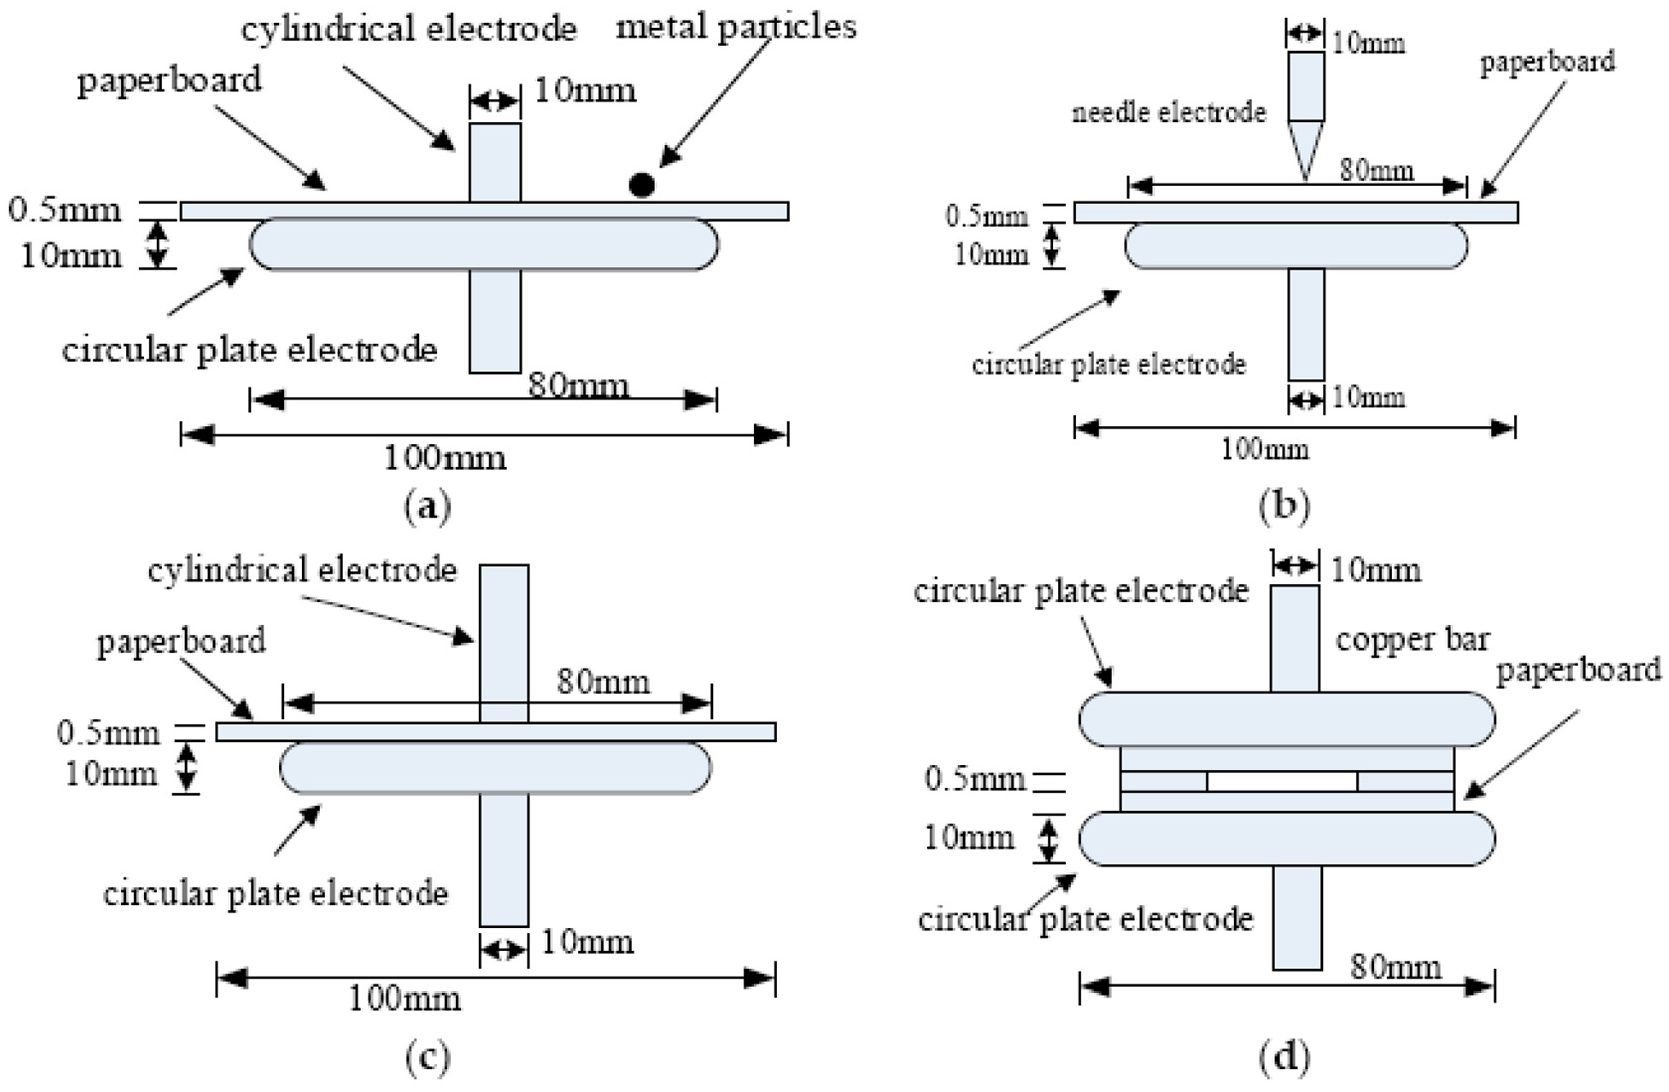
The experimental setup is shown in Figure 3. All the models are placed in the fuel tank filled with transformer oil. The PD signal is detected in the simulated transformer tank in the laboratory. The test standard is IEC 60270-2000, and the test circuit is a parallel test circuit based on the pulse current method. The discharge signal was collected using a TWPD -2 F PD analyzer with an acquisition frequency of 20 MHz and a sensor bandwidth of 40 to 300 kHz. The high pressure test platform model is TWI5133 -10 /100 am. PD signals are extracted under different voltage conditions, the experimental conditions are shown in Table 1. For each discharge model, 300 experimental samples were taken at each test voltage, and a discharge signal of one power frequency cycle was taken as one sample.
Test setup in the laboratory.
Test conditions of the partial discharge model.
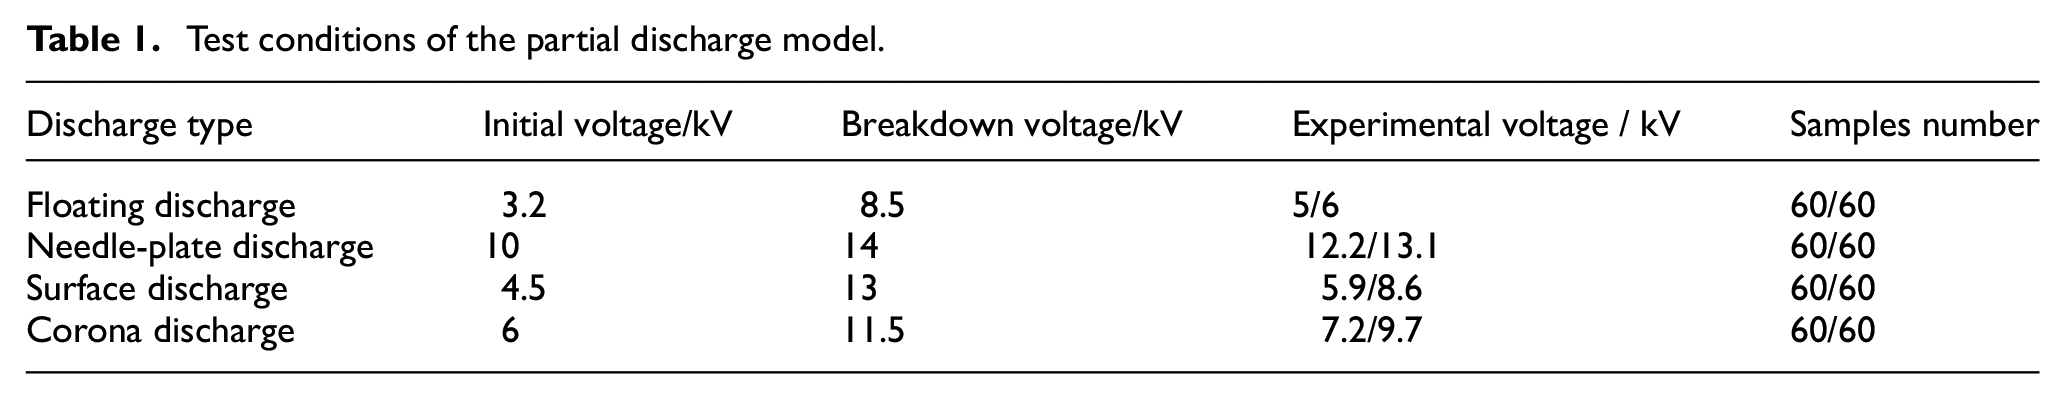
One set of simulation results is shown in Figure 4. Figure 4(a) shows the waveform of the FD collected in the experiment, Figure 4(b) shows the waveform of the ND, Figure 4(c) shows the waveform of the SD, and Figure 4(d) shows the waveform of the CD.
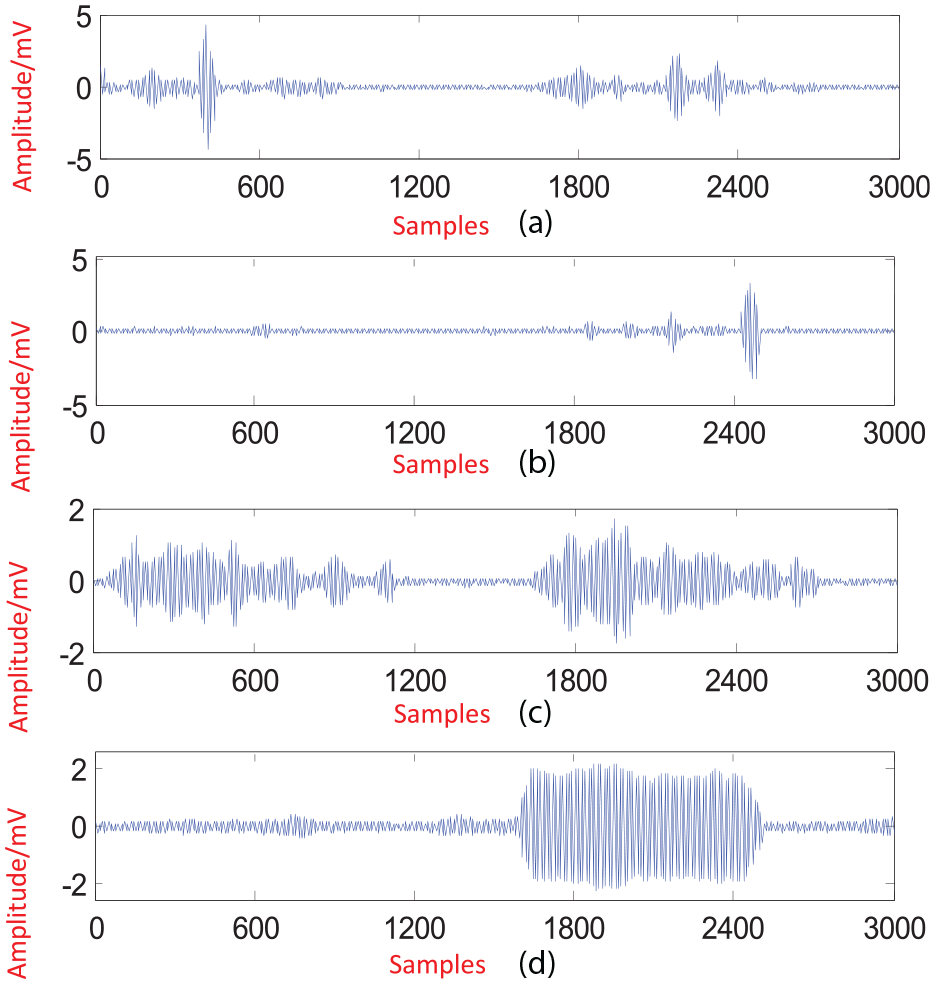
Measured signal waveform of simulation partial discharge: (a) Waveform of the simulation floating discharge signal. (b) Waveform of the simulation needle-plate discharge signal. (c) Waveform of the simulation surface discharge signal. (d)Waveform of the simulation corona discharge signal.
Feature extraction comparison
In this paper, we choose the number of decomposition layers of SSWFT to be 6. In order to verify the effectiveness of the SSWFT–MDE method, 400 PD samples (100 for each type) were randomly selected, then the feature extraction of PD signals was performed by MDE, EMD–MDE, and SSWFT–MDE. In the MDE method, the number of scale factor is 18. In the EMD method, the first five IMFs are reserved, and the rest are merged as the sixth component. In SSWFT, the Blackman window is selected as the window function and the width of the window is set to 30. All experiments are carried out in Matlab 2016a.
Figures 5–7 show feature extraction results based on MDE, EMD–MDE, and SSWFT–MDE, respectively. It can be seen from Figure 5 that the MDEs of four kinds of PD signals have a significant deviation on some large scales (the scale after 14), but there are crossing and overlapping on most scales, which will inevitably affect the recognition accuracy of PD types. So, it is difficult to distinguish the types of PD by MDE alone. It can be seen from Figures 6 and 7 that the SSWFT–MDE features of each discharge type have obvious differences, showing a high recognition rate. However, except for FD, the EMD–MDE features of the other three discharges are very similar in trend and steepness, and the intervals of features are overlapping with each other, which makes it difficult to distinguish between them.
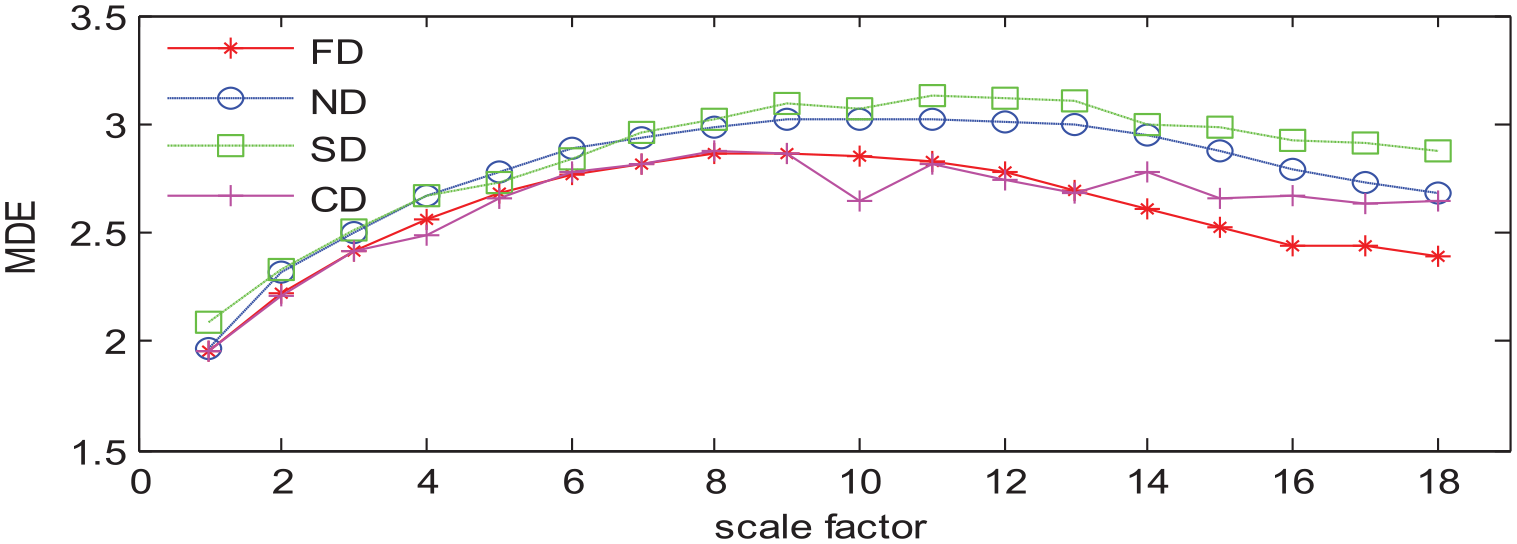
The feature extraction results based on multi-scale dispersion entropy.
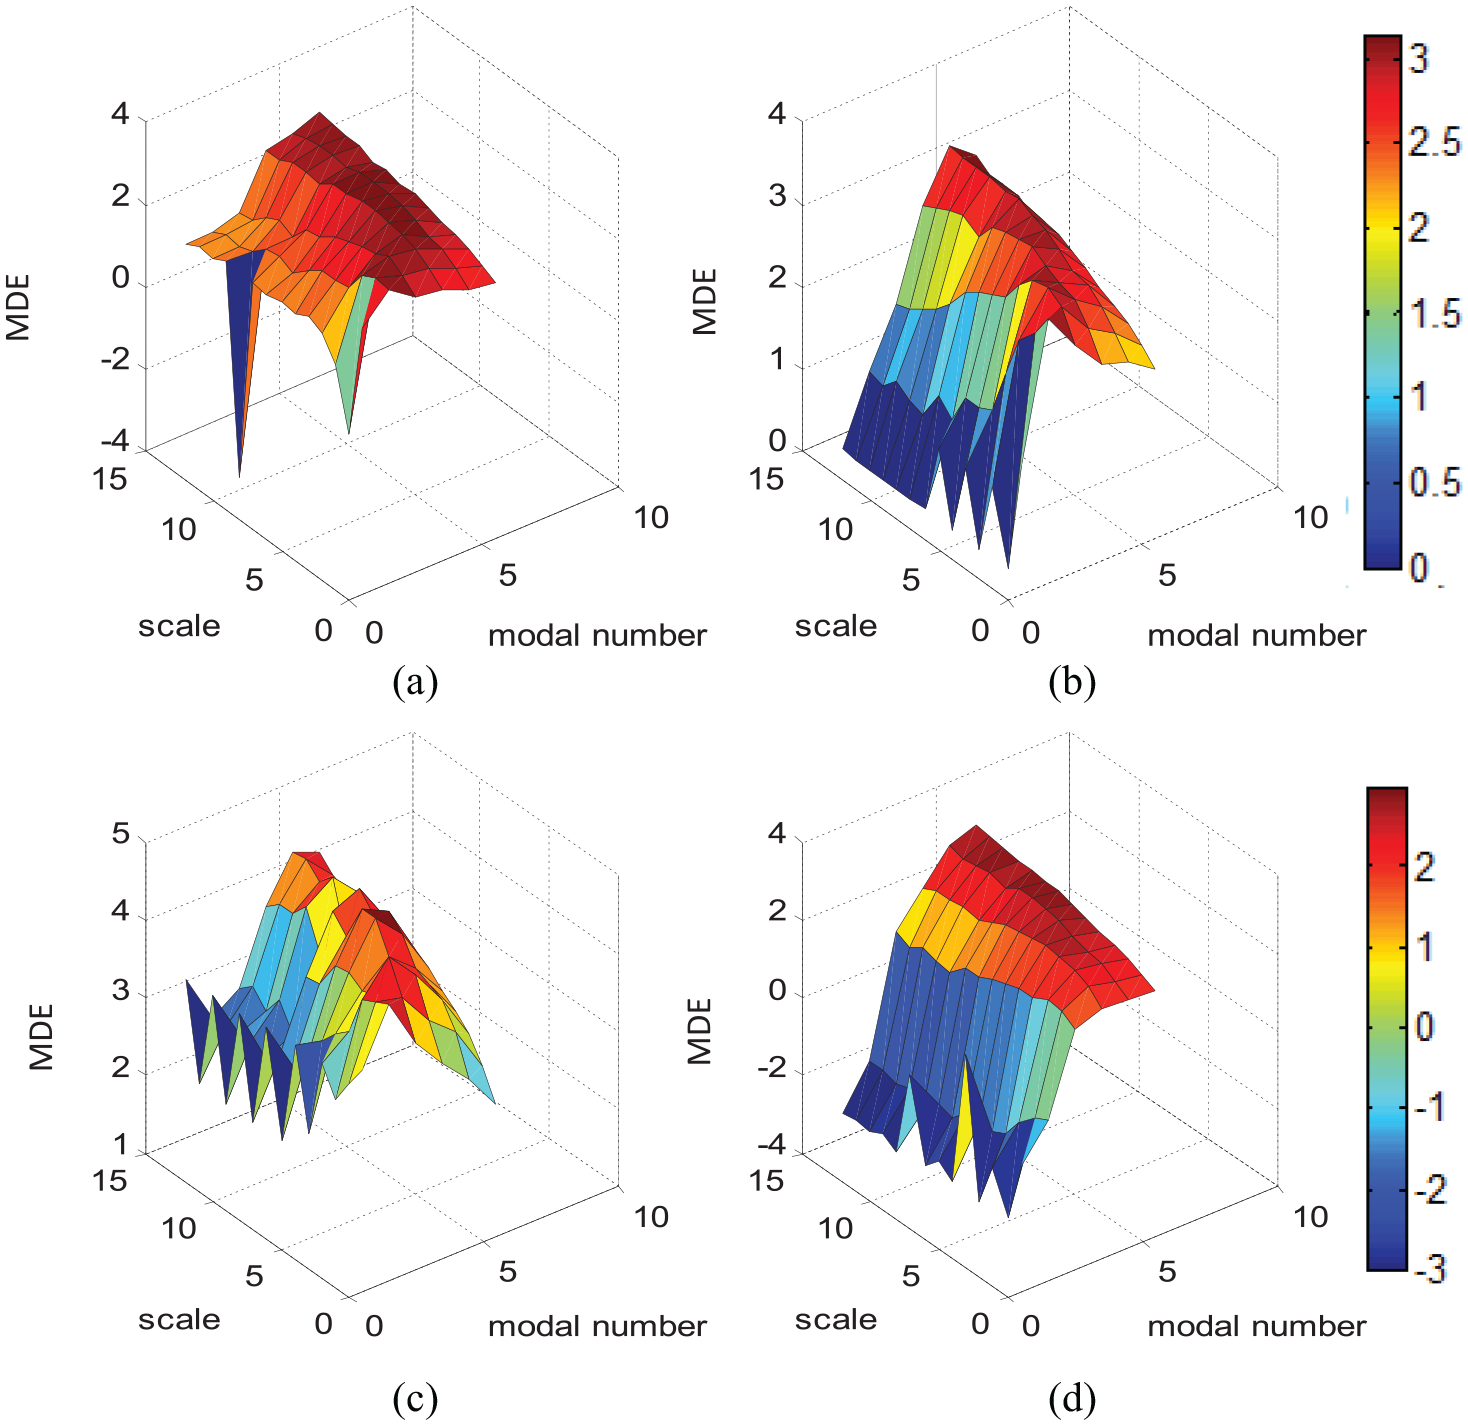
The feature extraction results based on empirical mode decomposition–multi-scale dispersion entropy: (a) Floating discharge. (b) Needle-plate discharge. (c) Surface discharge. (d) Corona discharge.
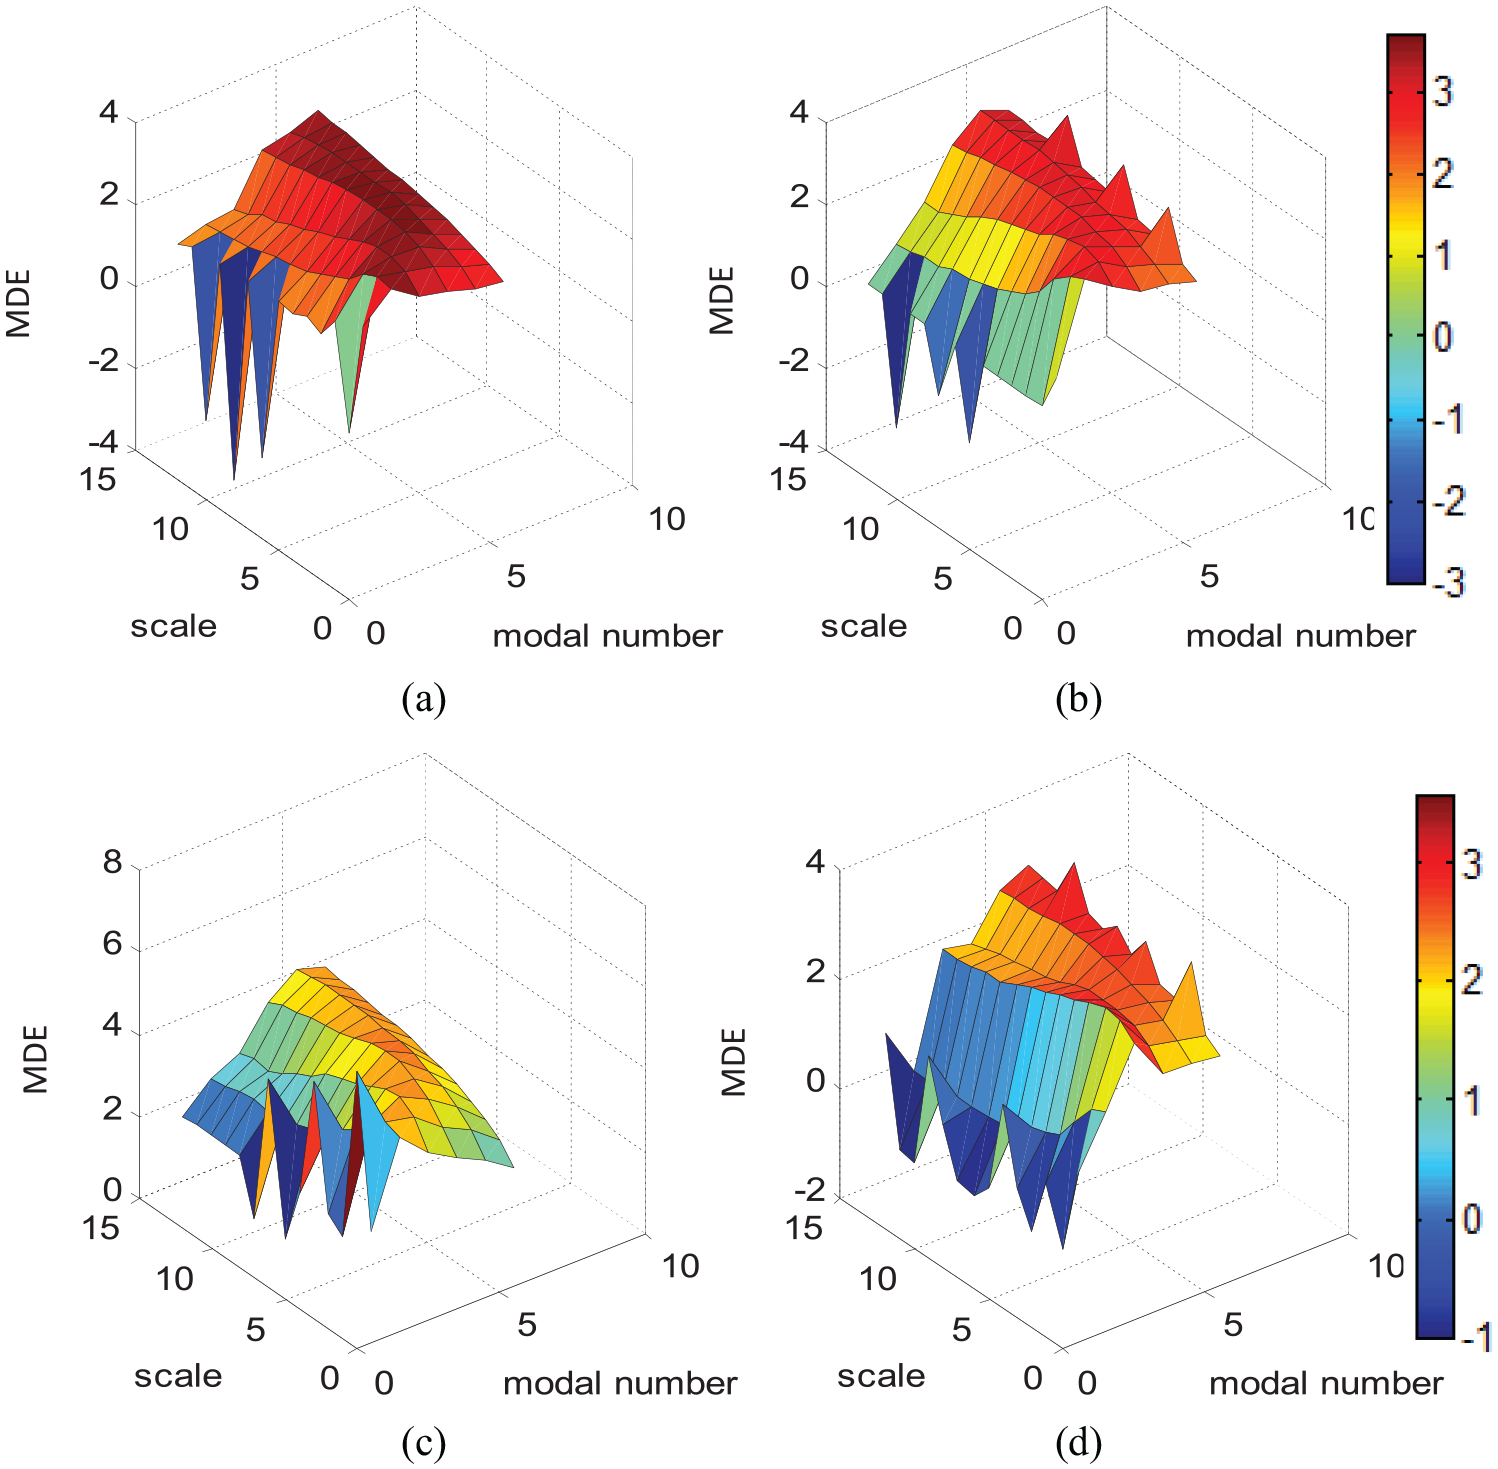
The feature extraction results based on synchrosqueezed windowed Fourier Transform–multi-scale dispersion entropy: (a) Floating discharge. (b) Needle-plate discharge. (c) Surface discharge. (d) Corona discharge.
Also, as shown in Figure 6, when the scale is lower than 4, there are different features between EMD–MDE, but when the scale is higher than 4, the differences between MDEs of the IMFs of EMD reduce gradually. It shows that the modal components obtained by EMD are simple and only few IMFs with small scale contain the discharge information. As can be seen from Figure 7, SSWFT overcomes the disadvantages of mode aliasing in EMD, and the modal components with different scales of SSWFT contain more detailed information of PD. Therefore, SSWFT–MDE features have better discrimination.
MDE reflects the intrinsic characteristics of the signal from the aspects of uncertainties and complexity. By observing the MDE of different discharge types, it can be seen that whether it is the SSWFT method or EMD method, the entropy of CD is the smallest and that of FD is the largest on most scales. According to the discharge process of different discharge types, the floating particulate matter during floating discharge has many states, such as static state, moving state, and so on. Therefore, the discharge process of FD has great randomness.
In SD and ND, the position of the initial discharge channel is not fixed. After many discharges, the discharge location mostly appears in the carbonization of the insulated cardboard. Compared with the other three discharge types, the CD pulses mostly appear near 270 degrees of the power frequency cycle, showing obvious polarity effect and strong regularity.
Pattern recognition of different discharge types
In order to analyze the influence of noise on the proposed method, 5 dB and 10 dB Gaussian white noise are added to the collected PD signals. The experiment selected 400 samples (100 randomly selected for each type of discharge), and the SSWFT–MDE, EMD–MDE, and 14-dimensional MDE of the signal itself are taken as feature vectors. Then, the SVM classifier was used to recognize PD signals based on the three feature vectors.
In PD recognition based on multi-scale entropy, the recognition process has the following characteristics: 1) PD recognition is a small sample recognition problem. 2) PD signal is nonlinear and multi-scale entropy feature is high-dimensional. 3) In practical application, it is usually expected that the faster the PD signal is recognized, the better. Although the artificial neural network has strong self-learning ability and nonlinear mapping ability, it is sensitive to the selection of initial weights and thresholds and needs a large number of training samples. So, it is easy to fall into local minima, especially, when the number of samples of the PD signal is not enough, it is difficult to obtain high-precision classification results by the artificial neural network. As a machine learning method with complete statistical basis, SVM avoids the shortcomings of the artificial neural network such as network structure selection, under-learning, and over-learning. SVM can not only deal with nonlinear data effectively, but also limit over learning, and so, it is especially suitable for solving small sample, nonlinear, and high-dimension pattern recognition and regression analysis problems.
25
Considering that only limited sample data can be obtained when dealing with practical PD problems, the number of samples is extremely limited; therefore, in this paper, SVM is chosen as the classifier. In the experiments, the kernel function of SVM is the Gauss radial kernel function. The width parameter of the kernel function is
Table 2 shows that the recognition accuracy of the SWFT–MDE method is higher than those of the EMD–MPE method and direct MDE method, whether the signal contains noise or not. Since SSWFT is essentially an optimal threshold filter when selecting modal components, it is more robust to noise. Also, there is no spectrum aliasing and energy leakage between the modal components obtained by SSWFT decomposition, so the extracted multi-scale features can describe the time and frequency characteristics of the PD signal more accurately than the EMD–MDE method and direct MDE method.
The recognition accuracy of the PD signal.
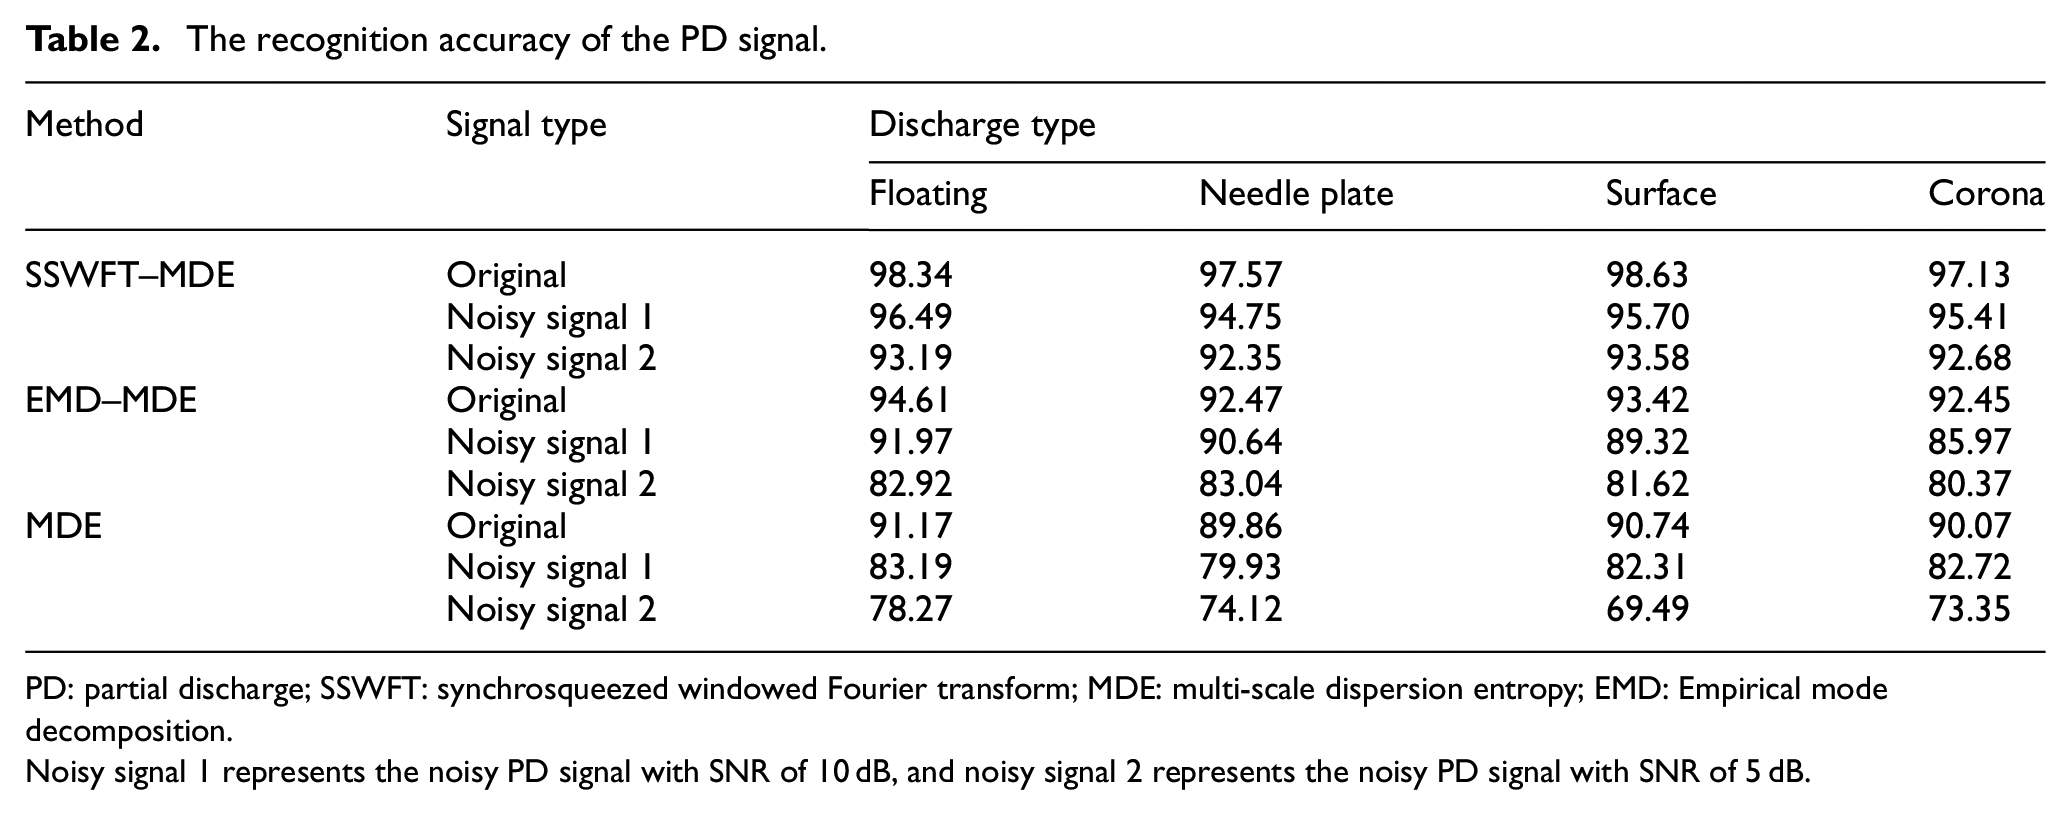
PD: partial discharge; SSWFT: synchrosqueezed windowed Fourier transform; MDE: multi-scale dispersion entropy; EMD: Empirical mode decomposition.
Noisy signal 1 represents the noisy PD signal with SNR of 10 dB, and noisy signal 2 represents the noisy PD signal with SNR of 5 dB.
With the increase of the noise level, the recognition accuracy of the EMD–MDE method decreases obviously. The SWFT–MDE method shows good stability and a higher recognition rate before and after mixing with noise. Compared with the direct MDE method, the SSWFT–MDE method can more accurately describe the complexity information of the discharge signal at different resolutions and has better noise robustness. It can be seen from Table 2 that the average recognition rate of the SSWFT–MDE method is higher than 92%, and when compared with MDE and EMD–MDE, the recognition accuracy of SSWFT–MDE is improved about 4% and 5%, respectively. From the experimental results, it can also be seen that in the case of small samples, SVM can still effectively identify the type of the PD signal. It shows that SVM can be used for PD-type recognition and has a good application prospect.
Conclusion
In this paper, a method of PD feature extraction based on SSWFT and MDE is proposed for recognition of transformer PD type. The features extracted by the proposed method can effectively characterize the uncertainty and complexity of PD signals in different frequency bands and have strong robustness to noise. The experimental results show that the SSWFT–MDE feature can effectively identify four types of discharge in the presence of noise. The average correct rate is over 92%, which is better than those of the EMD–MDE method and direct MDE method. However, there are still some drawbacks in the SSWFT–MDE method of PD feature extraction, such as parameter selection relying on prior knowledge and slow calculation speed, which need to be further improved.
Footnotes
Declaration of conflicting interests
The author(s) declared no potential conflicts of interest with respect to the research, authorship, and/or publication of this article.
Funding
The author(s) disclosed receipt of the following financial support for the research, authorship, and/or publication of this article: This research was financially supported by National Natural Science Fund (No.61671338, 51877161), fund of Open Research Fund Program of Key Laboratory of Digital Mapping and Land Information Application Engineering, NASG (No. GCWD201805), National Engineering Research Center for Water Transport Safety (No. A2019009), Hubei Key Laboratory of Transportation Internet of Things (NO.2018IOT006), the Natural Science Foundation of Guangdong Province (2016A030313710, 2015A030313624); the Science and Technology Program of Guangzhou (201607010170).