
Abstract
This paper presents the multi-objective optimization of the hard milling process of AISI H13 steel under minimum quality lubricant with graphite nanoparticle. The cutting speed, feed per tooth, depth of cut, and hardness of workpiece were taken as the process parameters, while surface roughness, cutting energy, cutting temperature, and material removal rate were considered as technological responses. Response surface or Kriging approximate models were applied to generate the mathematical regression models showing the relationship between machining inputs and outputs obtained by physical experiments. Then, multi-objective particle swarm optimization algorithm in conjunction with the Pareto approach and engineering data mining was adopted to figure out the feasible solutions. The research results show that cutting energy can be reduced up to around 14% compared to the worst case. Based on the Pareto plot, the appropriate selection of machining parameters can help the machine tool operator to increase machining productivity and energy efficiency.
Introduction
Hard machining is a method of machining materials with a hardness of 40–70 HRC, using a tool with cutter blades which are geometrically shaped defined.1,2 Traditionally, harden steel is often machined by grinding process in which a large amount of emulsifiable cutting fluids must be used in flushing conditions. These cutting fluids can harm the environment when disposing of them after use. Hard milling is considered as an alternative to substitute the grinding process which is time-consuming, costly, and highly damaging to the environment. 3 So, the environmental issue in hard milling is of particular concern to the manufacturing industry.
When machining, coolant must be used to remove the heat caused by cutting. Using nanofluid minimum quantity lubrication (MQL) in machining is an appropriate solution for building eco-friendly industries. Today, the application of less fluid in the metal cutting process is necessary than ever because of its beneficial properties such as diminishing the environmental impact, reducing the cutting temperature, and increasing tool life. MQL is considered to be a cooling technique that replaces conventional lubrication methods with a very small quantity of fluid at a flow rate of 50–500 mL.4–6 The selection of ideal MQL-assisted milling condition with vegetable oil synergy improves specific cutting energy and surface roughness.7,8 Bashir et al. 3 tried to find the best flow rate of pulse jet MQL that was used for surface milling of hardened AISI 4140 steel of hardness 40 HRC. To increase the cooling efficiency, nanofluids with the additive of a tiny amount of nanoparticle enhance the thermal conductivity up to two times. 9 Furthermore, nanofluids also can improve the surface roughness, reduce the cutting force, lower friction, and increase tool wear resistance.10–16 However, the research on the machining performance of hardened steel with different hardness with application of nanofluids MQL has not been addressed intensively. Therefore, we focus the study on the hard milling process with nanofluid MQL condition.
Being an ecologically desirable manufacturing industry, saving cutting energy is an important criterion. Energy consumption with regard to machine tool can be divided into three main approaches: machine tools, spindle, and process levels.17,18 At the machine perspective, the whole energy efficiency of the machine is considered. However, saving energy at this level is not practical. The same problem occurs with the spindle level, in which the energy consumption saving is subordinate on a particular motor. For the process level, the reduction in energy consumption depends on material removal or chip formation and surface generation. It can be seen that, cutting velocity (vc), feed per tooth (fz), depth of cut (ap), and hardness of material are some of the process parameters that affect process level. However, it is not easy to select these proper process parameters for the operators to increase the energy efficiency.
Process parameter optimization in terms of energy savings always draws the great attention of researchers in the field of metal cutting. 19 Some authors have studied process optimization to save energy during the milling process. Jang et al. 20 employed the artificial neural network (ANN) model and particle swarm optimization (PSO) algorithm during the milling process at a different flow rate of coolant in MQL condition to optimize cutting parameters to minimize the specific cutting energy when machining SM45C structural steel. Nguyen et al. 19 considered the optimization of power factor and energy consumption when using radial basis function models in combination with the Grey relational analysis (GRA), principal component analysis, and desirability approach. The results of the study revealed that energy consumption decreased by 34.8% and the power factor enhanced by 28.8% compared to the original parameters. The other study of Nguyen 21 also optimized multiple objectives for lower specific cutting energy, better surface quality, and higher material removal rate using the Kriging model and the archive-based micro genetic algorithm (AMGA). Park et al. 22 adopted a combination of response surface methodology (RSM) method with the non-dominated sorting genetic algorithm–II (NSGA–II) to solve the multi-objective optimization of energy efficiency and specific cutting energy of hard turning process of AISI 4140 steel. Selaimia et al. 23 used the RSM method and desirability approach to model and optimize cutting conditions that maximize material removal rate and minimize surface roughness when machining austenitic stainless steel in dry condition. Khan et al. 16 optimized the energy consumption and surface quality with nanofluid MQL-assisted face milling. The results indicated that energy consumption was reduced by 20.7% compared to conventional optimization methods. It can be seen that the modeling and process parameter optimization for cutting energy reduction in the MQL machining process is still of interest.
Before solving the optimization of machining process, it is common to model the relation between process parameters and machining performances (or output responses). The most common approaches are RSM and second-order polynomial model which were used in the literature because of its simple for utilization.6,23–27 However, RSM or second-order polynomial model is not suitable for a highly nonlinear relationship between inputs and outputs. Some other models related to ANN that can render the correlation with highly nonlinear are ANN6,20,28 and adaptive neuro-fuzzy inference system (ANFIS)29,30 compared with traditional polynomial or RSM method. Another model, Kriging model, can perform the highly nonlinear relationship between input parameters and output parameters.21,31
To solve the optimization problem, there are several methods that are commonly used in engineering. Some general optimization techniques are employed in metal cutting engineering such as Taguchi32–35 and GRA;36–38 however, these techniques cannot give optimal results with a “real optimal” solution because they only optimize according to the level of design variables. A simultaneous multi-response optimization that is frequently used in practice by Mia and co-authors is desirability function approach.8,26 They employed desirability function approach to multi-objective optimization of different cutting conditions as dry, wet, cryogenic cooling, and MQL condition. Recently, researchers have gradually adopted revolution optimization algorithms to solve the multi-objective optimization due to their efficient, flexible, convenient, and convincing. Those optimization algorithms are AMGA, 21 genetic algorithm (GA), PSO,20,39–42 and NSGA–II.22,43,44 Prakash and colleagues34,41,42,44 reported that newly evolutional and bio-inspired multi-optimization techniques such as NSGA–II, PSO, and hybrid optimization algorithms are robust tool of optimization. GA and PSO are the biological inspired optimization algorithm that the global optimum point can be found instead of being trapped in local optimum point as gradient-based optimization algorithm does.
Based on the literature review, we found that the simultaneous consideration of hard milling, MQL, and optimization in machining technology is significant in terms of practice and academic. The proper setting of process parameters that improves quality and productivity of hard milling remains a practical and academic issue. In addition, the holistic optimization of energy consumption (cutting energy), productivity (material removal rate), and quality (surface roughness) for hard milling has not been meticulously studied. So, this work aims to focus on the multi-objective optimization of the hard milling process for AISI H13 (a common hot work tool steel) with nanofluid MQL condition order to obtain high productivity, quality, and efficiency of energy consumption using PSO algorithm. One of the new points compared to other works is that the hardness of the workpiece is included in this study. The consideration of this process parameter is practical because the hardness of the workpiece may vary depending on the hardening condition (40–70 HRC). The influence of workpiece hardness to the machining response such as surface quality, productivity, and energy efficiency is involved in the optimization process of the hard milling in which nanofluid MQL condition is applied for greener manufacturing.
This paper attempts to model the relationship among process parameters (cutting velocity, depth of cut, feed per tooth, and hardness) of hard milling process of AISI H13 under nanofluid MQL condition and the machining responses (material removal rate, cutting energy, cutting temperature, surface roughness) by an appropriated technique. The effect of process parameters on the output responses will be figured out for a better understanding of hard milling process under nanofluid MQL condition. Some scenarios of optimization that depend on the circumstance of rough cut or finish cut will be studied. Single optimization or multi-objective optimization with or without constraints will be examined and presented in this paper. In this work, the Pareto approach and engineering data mining are adopted to figure out the feasible solutions and non-dominated solutions. Based on the Pareto plot, the proper choice of machining parameters can help the machine tool operator to increase productivity and energy efficiency of the machining process. Besides, the relation between cutting energy regarding material removal rate and hardness of the workpiece was elaborated. The next section of this paper will present in detail the systematical research procedure, the design of experiment (DOE), the experimental setup, and the optimization method. Then, the results and discussions will be shown, and finally, some highlights and conclusions will be made. This work is intended as a contribution to the green manufacturing industry (Figure 1).
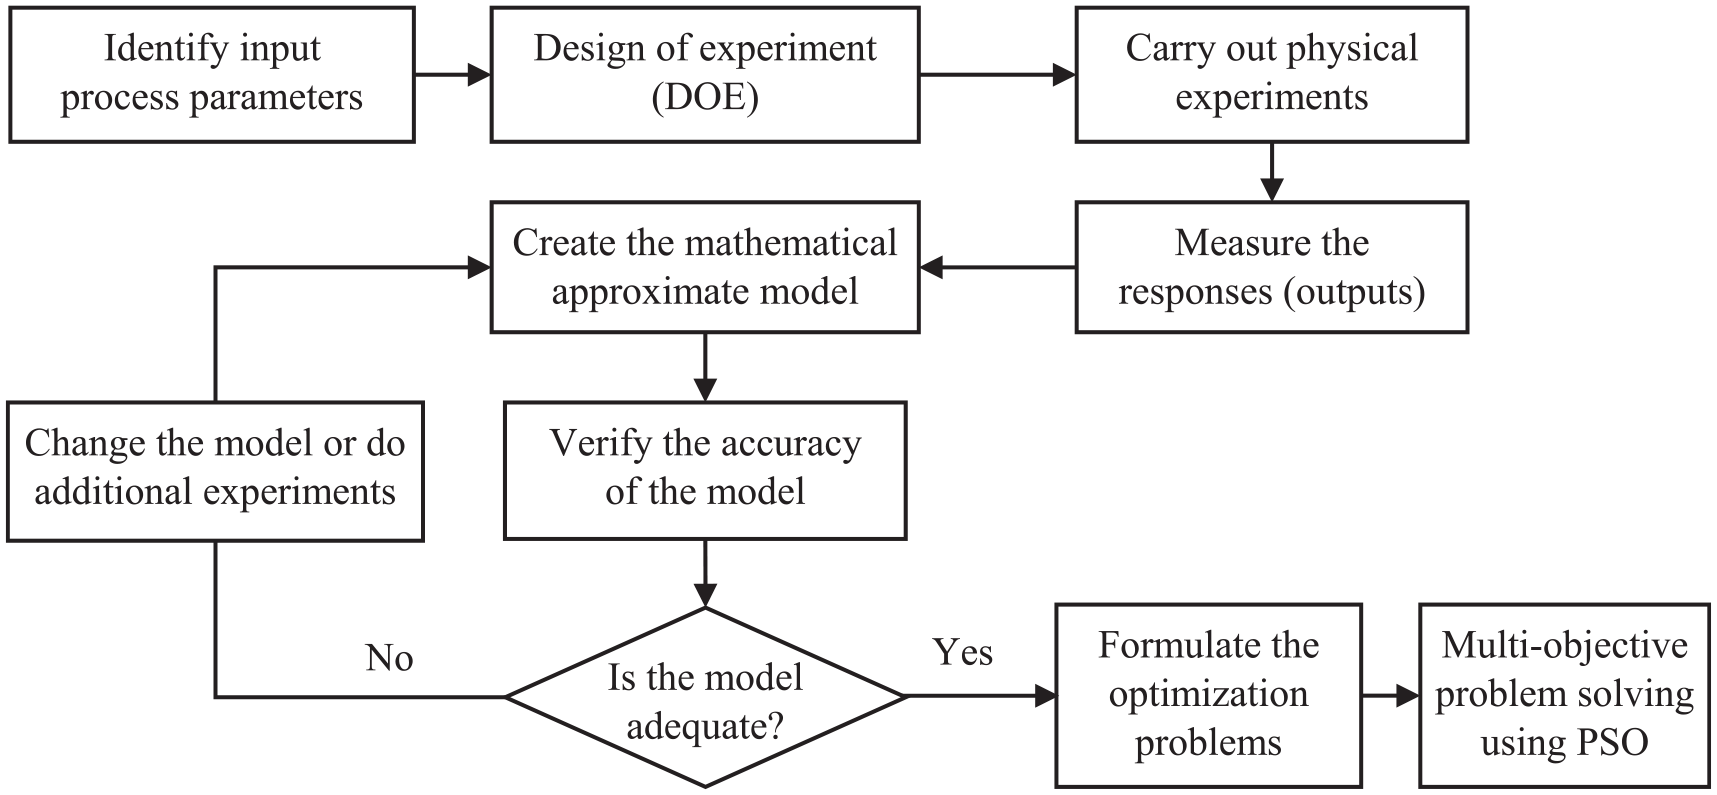
Systematic research procedure.
Materials and methods
The material was employed in this paper is AISI H13 steel that is frequently employed in the hot working mold and die industry with excellent toughness and fatigue resistance. The three hardened AISI H13 plates of steels with different hardness used in all milling tests were 40, 45, and 50 HRC. Workpiece dimensions were 180 mm (L) × 100 mm (W) × 40 mm (H) with the 100 mm dimension being the cutting length. A computer numerical control (CNC) milling machine, namely, Victor Vertical Machining Center 4 was employed for experiment. Φ10 M520 ultra carbide end mills with four flutes were used for cutting in all experiments.
Experiments were carried out under minimum lubrication conditions with appropriate flow rate of MQL oil, angle of nozzle, air pressure, and distance of nozzle parameters fixed as 90 mL/h, 60°, 3 kg/cm2, and 20 mm, respectively. To improve the characteristics of cutting fluid, we dissolve graphite nanoparticle with particle size smaller than 30 nm into the fluid to obtain graphite nanofluids. The concentration of graphite nanoparticle in the fluid is 0.5 Vol% mixed continuously by magnetic stirrer around 48 h. Experiment apparatuses and specifications are tabulated in Table 1.
Experiment apparatuses and specifications.
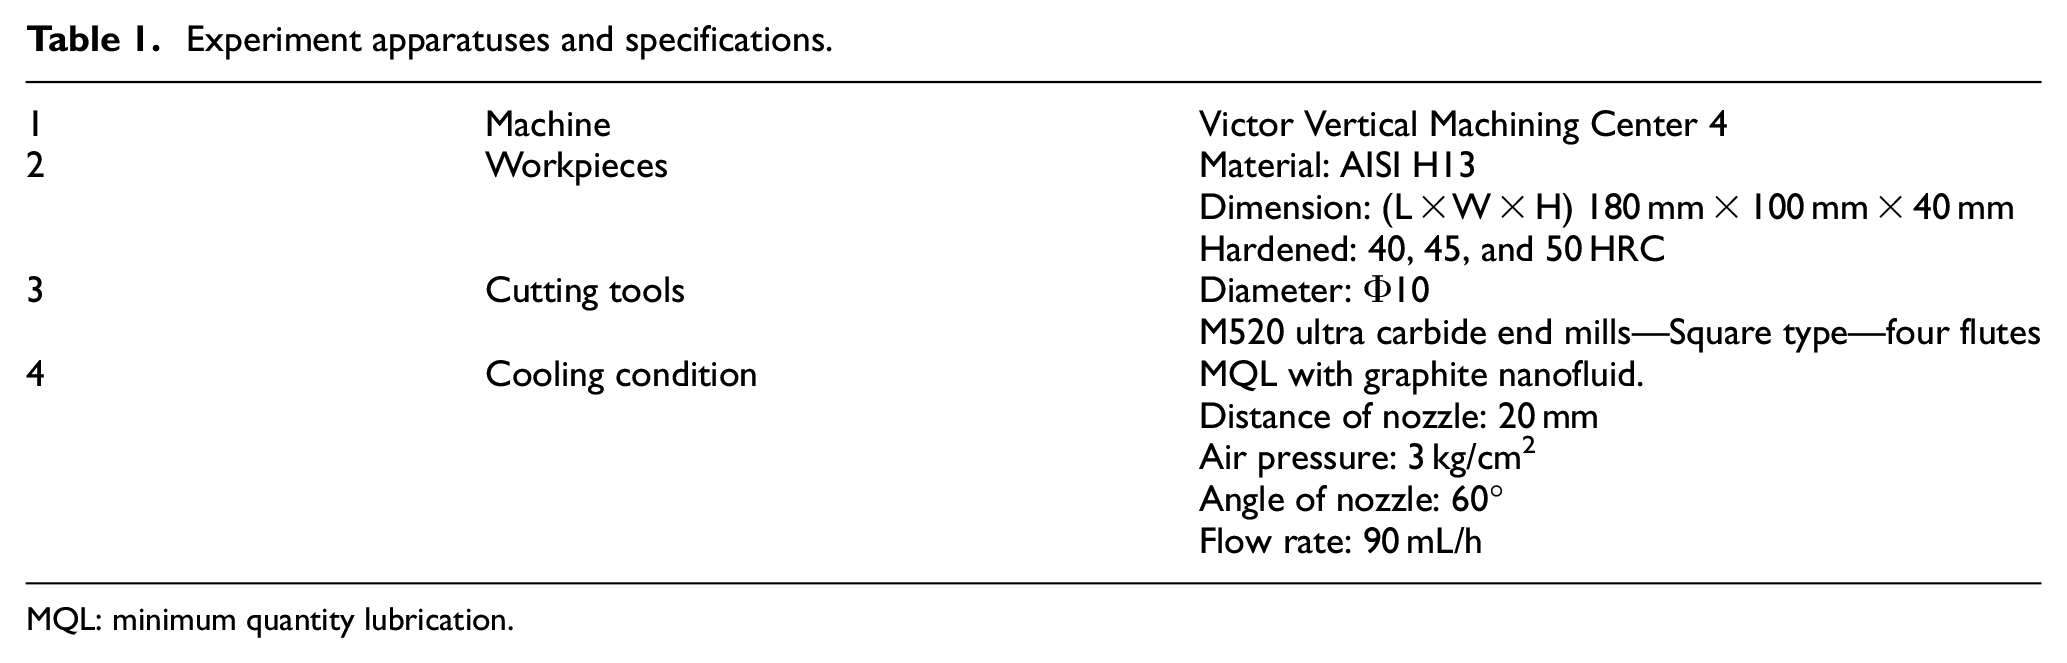
MQL: minimum quantity lubrication.
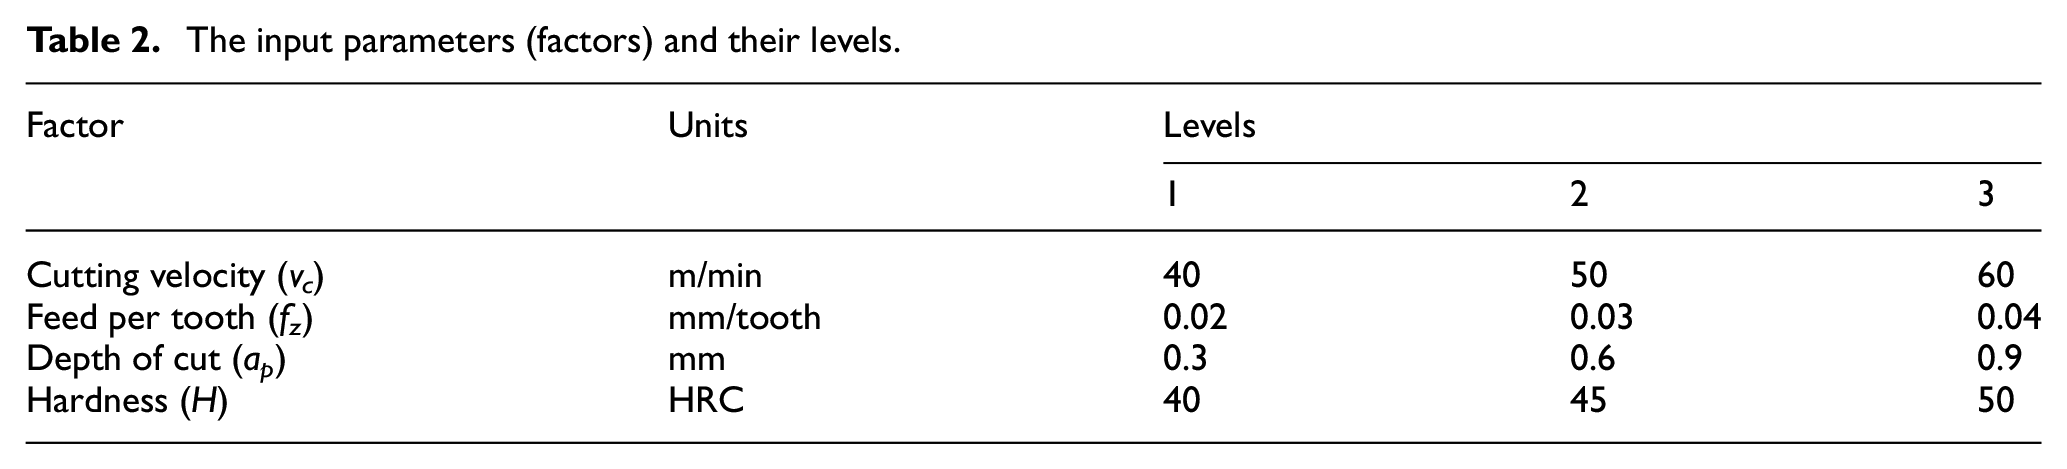
For DOE, we identify the main four input process variables, including cutting velocity (vc), depth of cut (ap), feed per tooth (fz), and hardness (H) of material. The values of process parameter are divided into three levels in which the levels are chosen based on the cutting tool catalog and a common range of hardness of AISI H13 when hardening. The inputs (or factors), the number of levels, and their values are presented in Table 2. To reduce the number of experiments and to save experiment costs, Box–Behnken design is adopted to generate a set of 25 experiments as shown in Table 3. Box–Behnken DOE that belongs to a class of incomplete three-level factorial designs can be used where corner points cannot be evaluated.
The input parameters (factors) and their levels.
DOE table and the results of experiment.
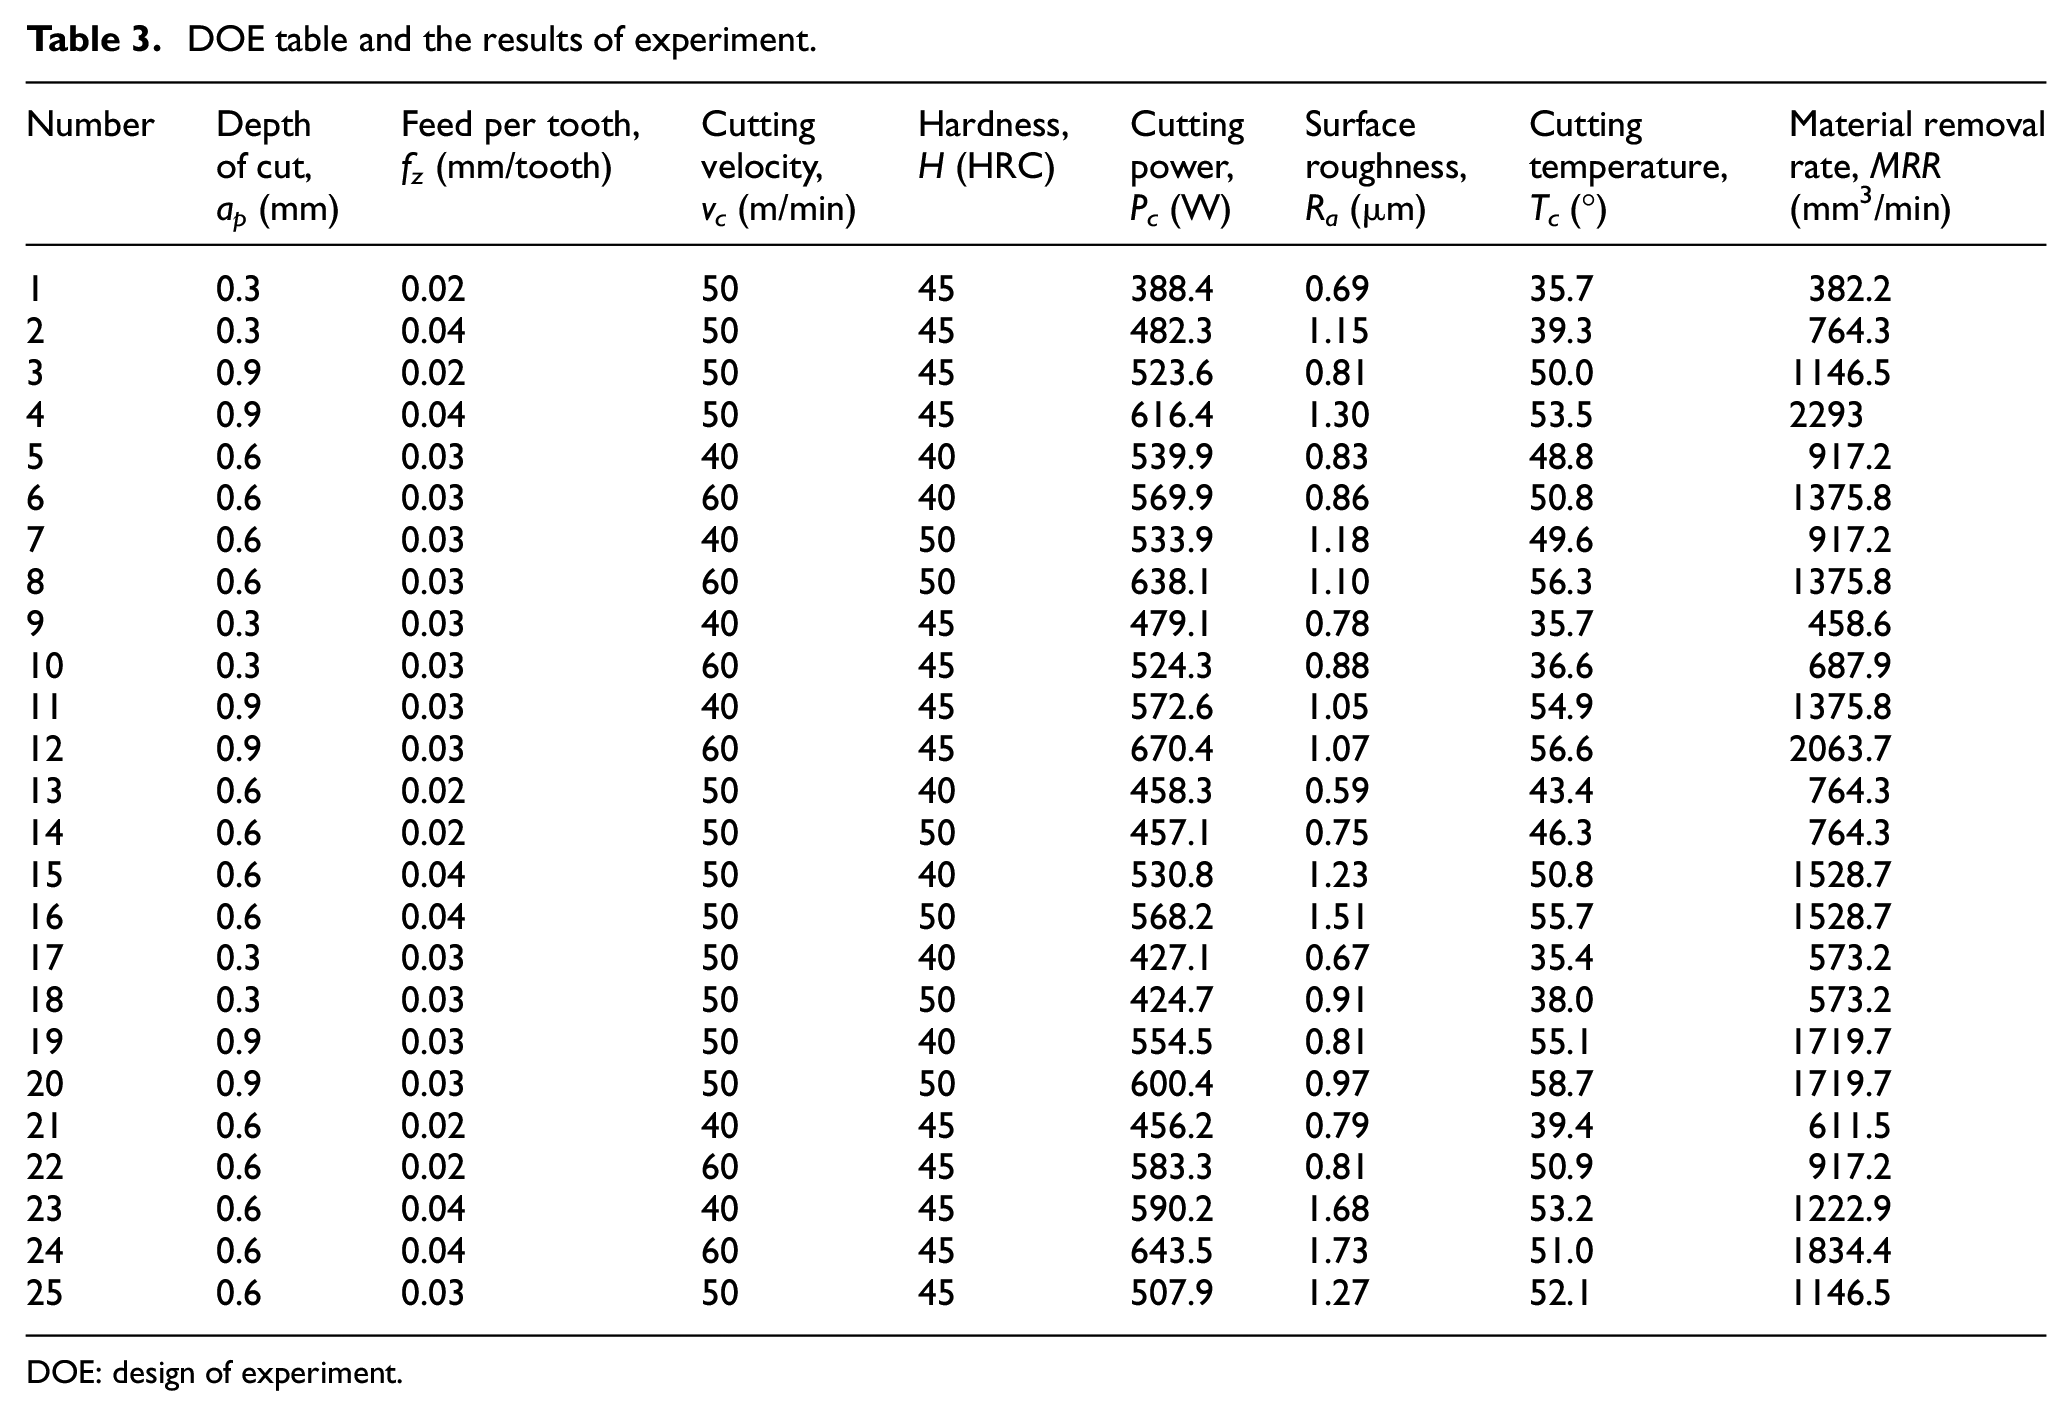
DOE: design of experiment.
The machining responses consist of surface roughness (Ra), cutting temperature (Tc), material removal rate (MRR), and cutting power (Pc). The surface roughness is measured using the Mitutoyo SJ-400 Surftest instrument. Every experiment was measured three times, and then the average value was obtained. The infrared camera model IRM_P384A3-20 of Ching Hsing Computer-Tech Ltd. was employed to measure the cutting temperature. The power consumption was measured by the Lutron 3 Phase Power Analyzer DW-6092. A computer that has the Lutron Measurement system software was connected to the power analyzer in order to process the power signals. The power consumption was calculated via the value of current and voltage. The details of the experimental setup are illustrated in Figure 2.
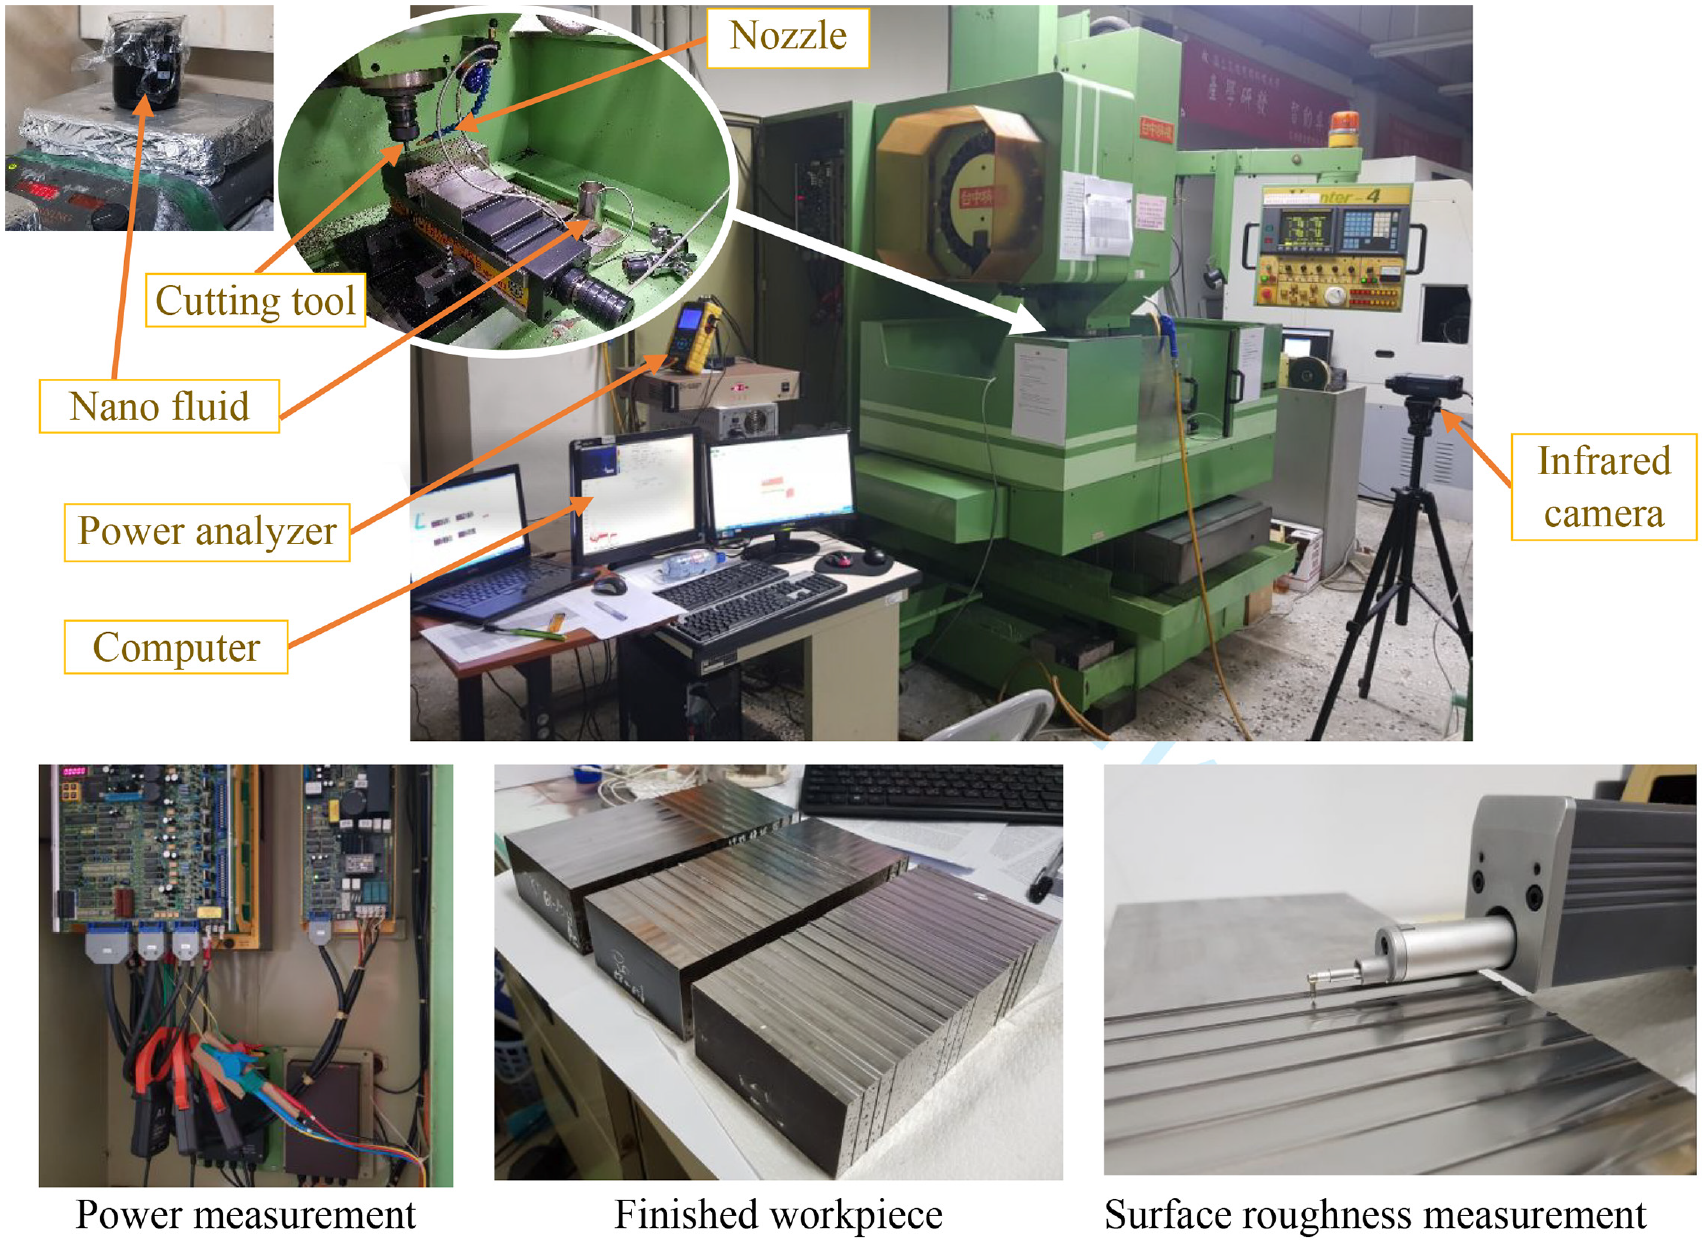
The details of the experimental setup.
The relationship between machining responses and machining parameters was performed by the approximate RSM model and/or Kriging model depending on the goodness of fit. The fidelity of the two models was assessed using the values of coefficient of determinant (R2). Next, the proper approximate model will be adopted to perform the optimization process by PSO technique. The theory of PSO algorithm has been well presented in the literature;20,31,45,46 therefore, duplication is unnecessary. The framework of PSO applied in this work is shown in Figure 3. To facilitate the optimization process, Isight 5.9 and MATLAB R2015a software were used for both modeling and optimization.
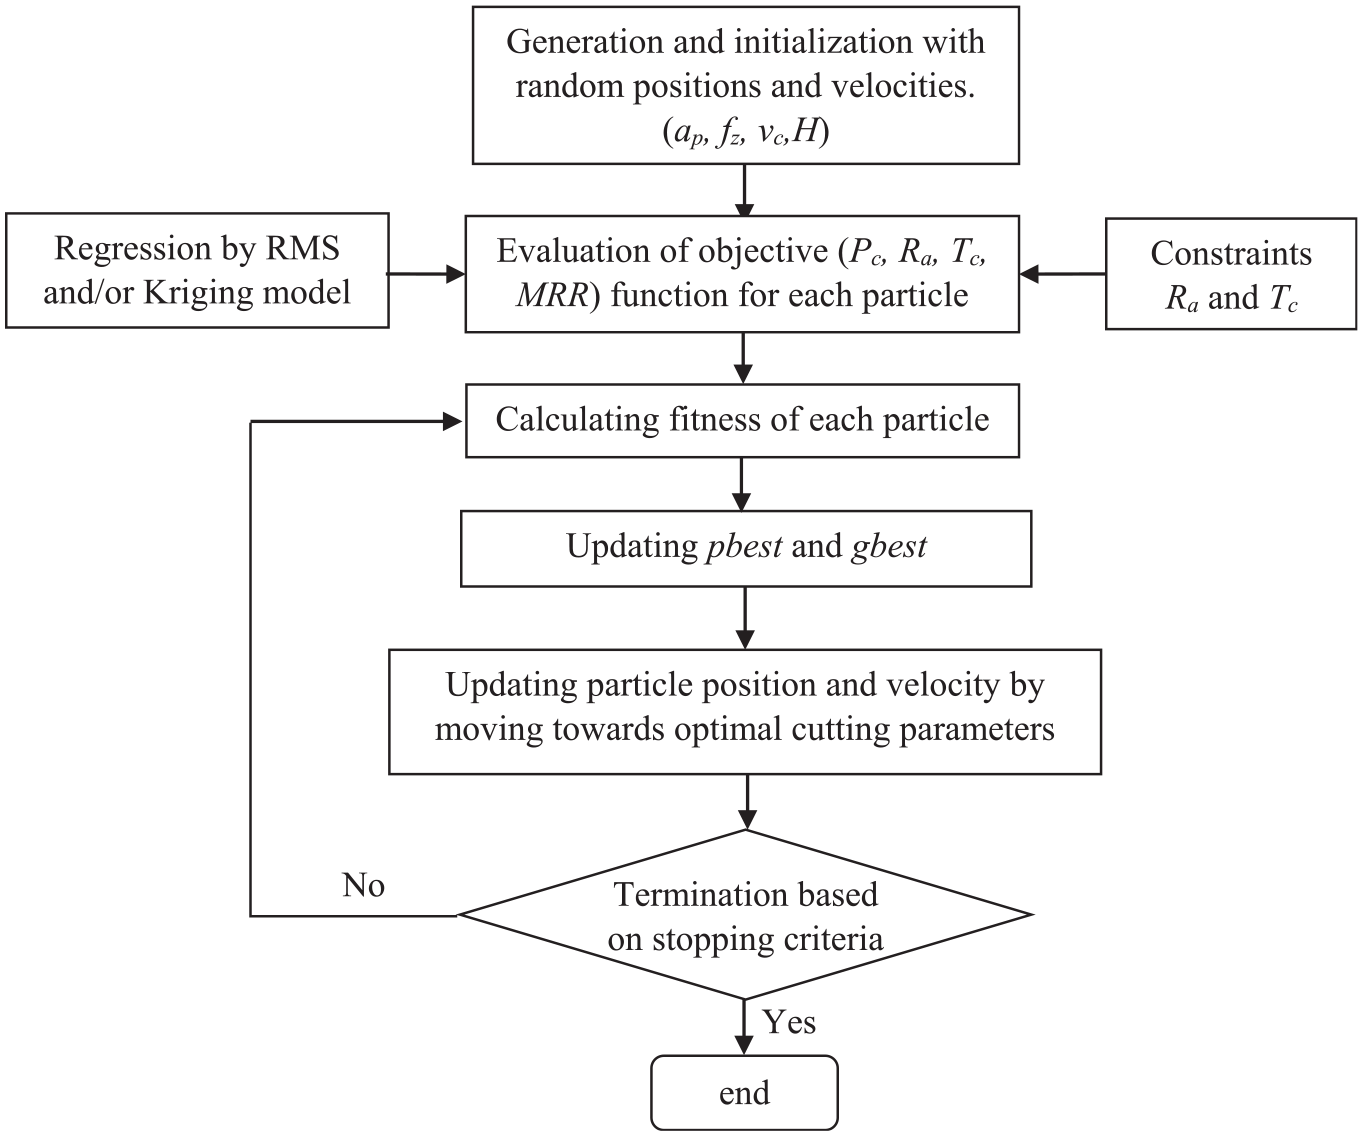
Algorithm of PSO method for optimal cutting parameters.
The objective of optimization is to obtain the highest MRR and smallest of Pc. Because the hardness of the workpiece cannot be treated as a control factor; therefore, the hardness was considered as a fixed input parameter. We considered three scenarios that are typical for common operations in machining. Each optimization scenario was done with three values of the hardness (40, 45, and 50 HRC), and then the effect of hardness to the optimization will be generalized by the regression model as follows:
First scenario: maximize MRR = f1 (vc, ap, fz, H) and minimize Pc = f2 (vc, ap, fz, H) regardless of the surface roughness and tool wear (unconstraint multi-objective optimization applied to rough cut).
Second scenario: maximize MRR and minimize Pc subject to the constraints of tool wear or cutting temperature (constrained multi-objective optimization applied to rough cut).
Third scenario: maximize MRR and minimize Pc subject to the constraints of surface roughness only (constrained multi-objective optimization applied to finish cut).
As previously mentioned in section “Introduction,” the selection of optimal solutions can be facilitated by the Pareto plot (a multi-objective optimization tool) and engineering data mining tool. For multi-objective optimization problems, a single solution that satisfied all objectives is impossible. Therefore, the Pareto optimal set will be figured out. Pareto optimal solution is the solution that we cannot find other one which decreases some objectives without causing an increase in at least one other objective (suppose a minimization problem).
Results and discussion
The data of experimental results in this work received from machining are collected and analyzed to evaluate the performance of the cutting process. DOE matrix of 25 experiments based on the Box–Behnken method and the machining responses data are shown in Table 3. As previously mentioned, the RSM and Kriging model were used to capture the relationship among machining parameters to machining responses based on experimental data. The RSM model is applied first. If the goodness of fit or the accuracy of the RSM model is not satisfied, the Kriging model will be used instead.
The regression results show that the coefficient R2 of Pc, Ra, and Tc are 0.84, 0.66, and 0.82, respectively, when using the RSM model meanwhile the R2 of the Kriging model are 0.95, 0.97, and 0.96, respectively (Figure 4). It can be concluded that the Kriging model is a better choice compared to RSM model. The Kriging model can be considered as a superior model replacing the conventional RSM models that capture the highly nonlinear relationship of process parameters and technological responses. This method is believed that to be more cost-effective 47 and superior to represent nonlinear relationships.48,49
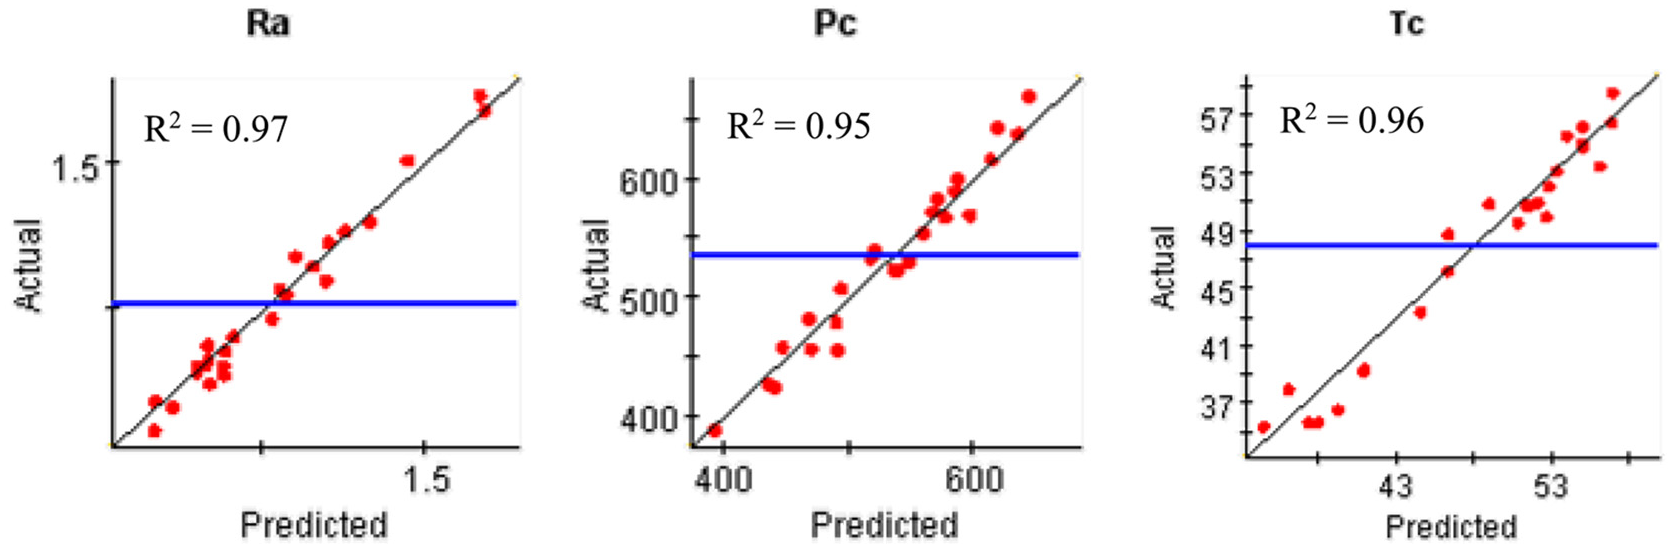
Error analysis of Kriging model estimated by the coefficient of determinant R2.
Figures 5–7 illustrate the three-dimensional (3D) graph showing the influence of the process parameters (vc, fz, ap, and H) on the response parameters (Ra, Pc, and Tc) when the Kriging model were applied. These 3D graphs are the visual tool that are used to observe the relationship between inputs and outputs as well as to analyze the trend of outputs.
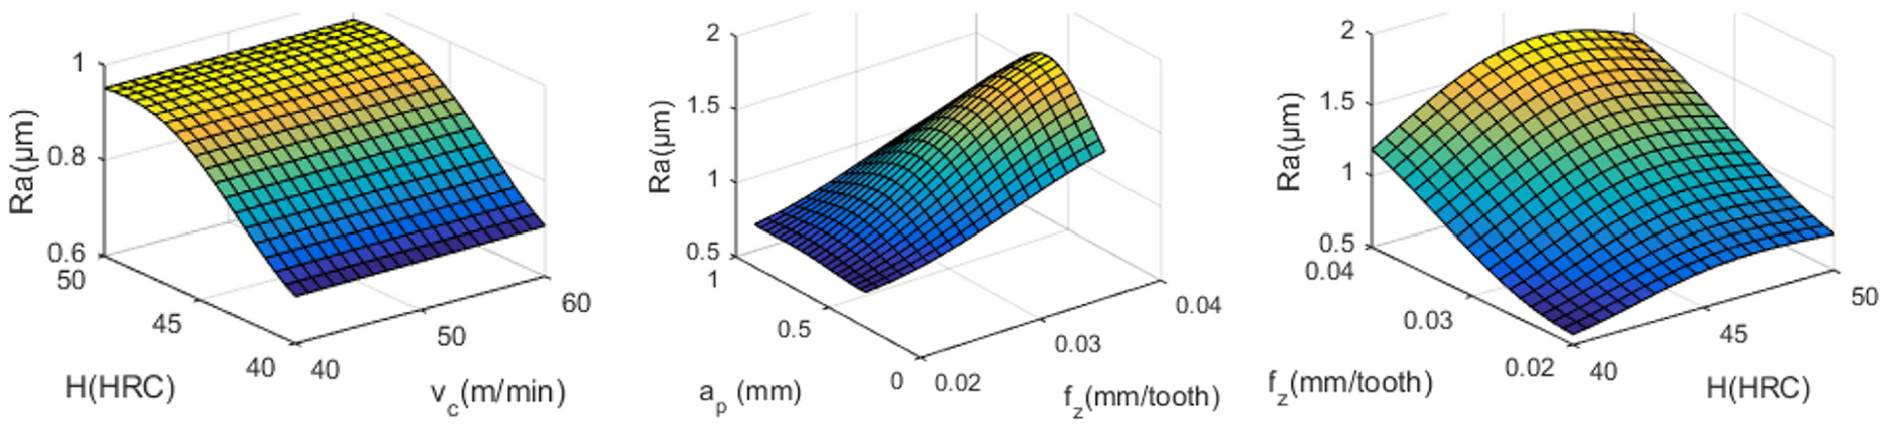
Surface roughness versus machining parameter.
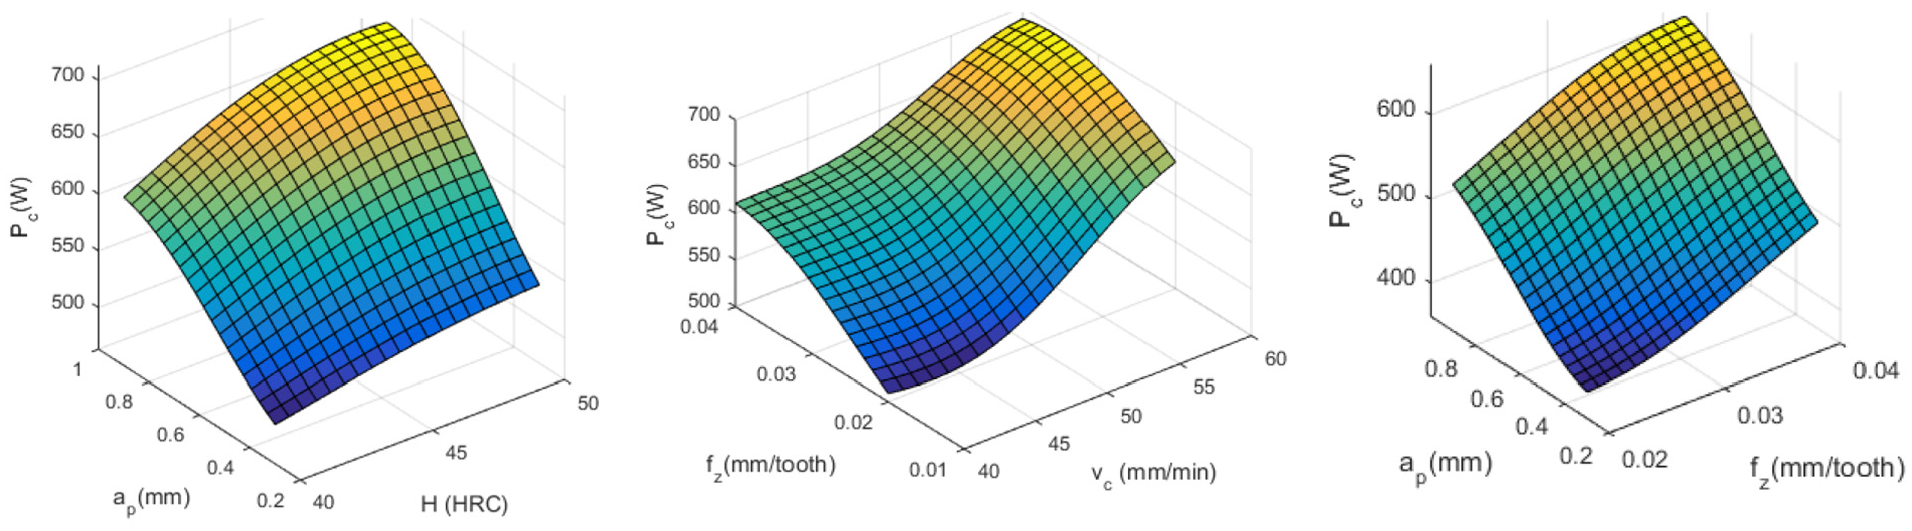
Cutting power versus machining parameter.
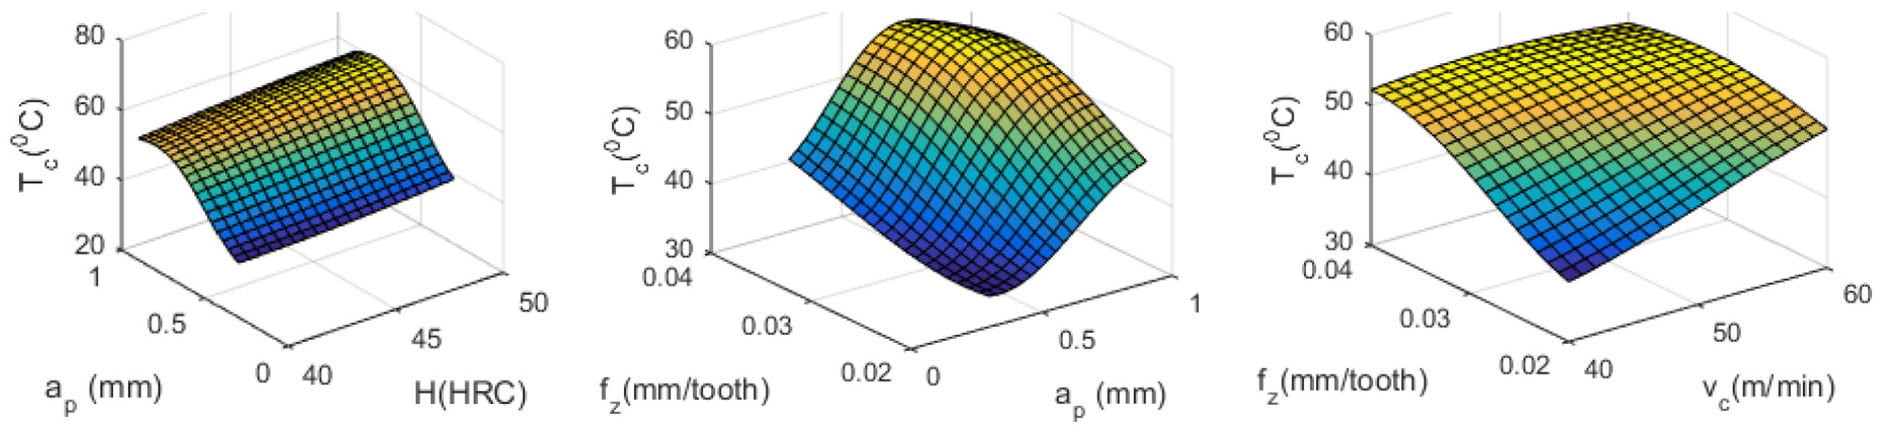
Temperature on cutting tool versus machining parameter.
Figure 5 illustrates the relationship between surface roughness and machining process parameters. It can be seen that the increased depth of cut, hardness as well as feed per tooth and diminished cutting velocity lead to an increase in the surface roughness. This can be demonstrated by the fact that increasing cutting velocity causes built-up edge (BUE) phenomena on cutting edge to restrain, the BUE breaks away from the cutting edge, so that increases the surface roughness quality. The increase in hardness and depth of cut adversely affects surface quality. They can lead to an improvement chip load which results in accession to cutting force. According to previous studies,23,25 increasing cutting forces leads to an increase in the risk of chatter vibrations and tool wear, following decreased surface quality. Feed per tooth is also a significant factor affecting surface quality. If increasing the feed per tooth, then the surface quality is lower. This can be explained that the furrows which are generated by the rotation of the cutting tool be expanded. The results are in good agreement with previous research.50,51
For the cutting power, it is found that increasing feed per tooth, depth of cut, and hardness results in an increase in cutting power (Figure 6). This can be interpreted as follows: with an increase in feed per tooth and depth of cut results in an enlargement of material removal rate per unit of time, which means that cutting force or cutting power is raised. The results are in line with previous research works.23,52
Cutting temperature directly affects tool wear and machining quality. The high temperature in the cutting zone results in faster tool wear, leading to increased cutting forces 53 and this may change the structural surface layer. It is difficult to exactly measure the real temperature on the rotating cutting tool like milling tool. The temperature on the cutting tool in this work was measured by an infrared camera. In the cooling and lubricating condition, the temperature on the cutting tool is significantly lower than the cutting temperature. Measuring the temperature on cutting tool by an infrared camera can indirectly assess the cutting temperature. Figure 7 depicts the temperature on the cutting tool concerning the change in process parameters. It can be seen that the temperature on the cutting tool has a nonlinear relationship with process parameters. As a general rule, the cutting temperature significantly diminishes when the depth of cut lessens from 0.9 to 0.3 mm, the feed per tooth changes from 0.04 to 0.02 mm/tooth, the hardness adjusts from 50 to 40 HRC, and the cutting velocity varies from 60 to 40 m/min. This phenomenon can be illustrated that when increasing the quantity of variable, parameter will increase the friction between the cutting tool and the workpiece. So the temperature at the cutting zone is increased. Our experiments results agree well with previously published results.53,54
This study also investigated the relation between cutting temperature and tool wear in order to identify the constraint of cutting temperature for an allowable tool wear rate in practice. Theoretically, tool wear depends on cutting parameters, workpiece properties, the tool material, and the cooling or lubrication system. Tool wear has a relationship with cutting temperature. It is known that the cutting temperature depends on heat source caused by friction and chip deformation of material in the cutting zone and therefore depends on the cutting parameters. The cutting temperature of all experiments was measured by an infrared camera is presented in Table 3.
Conducting tool wear measurement for all 25 experiments is a time-consuming and high-cost task. Therefore, four experiments that have different parameters and the cutting temperature and the cutting parameters increase steadily (experiments numbered 2, 6, 14, and 24 with the cutting temperature 39.3, 50.8, 46.3 and 51.0 °C, respectively) were selected. Then, we repeated these four experiments in order to measure the tool wear. Figure 8 shows the flank wear of four cutting tools of experiment No. 2, No. 6, No. 14, and No. 24. It can be found that flank wear increases when cutting temperature increases. The tool wear rate is faster when the cutting temperature is at a high level.
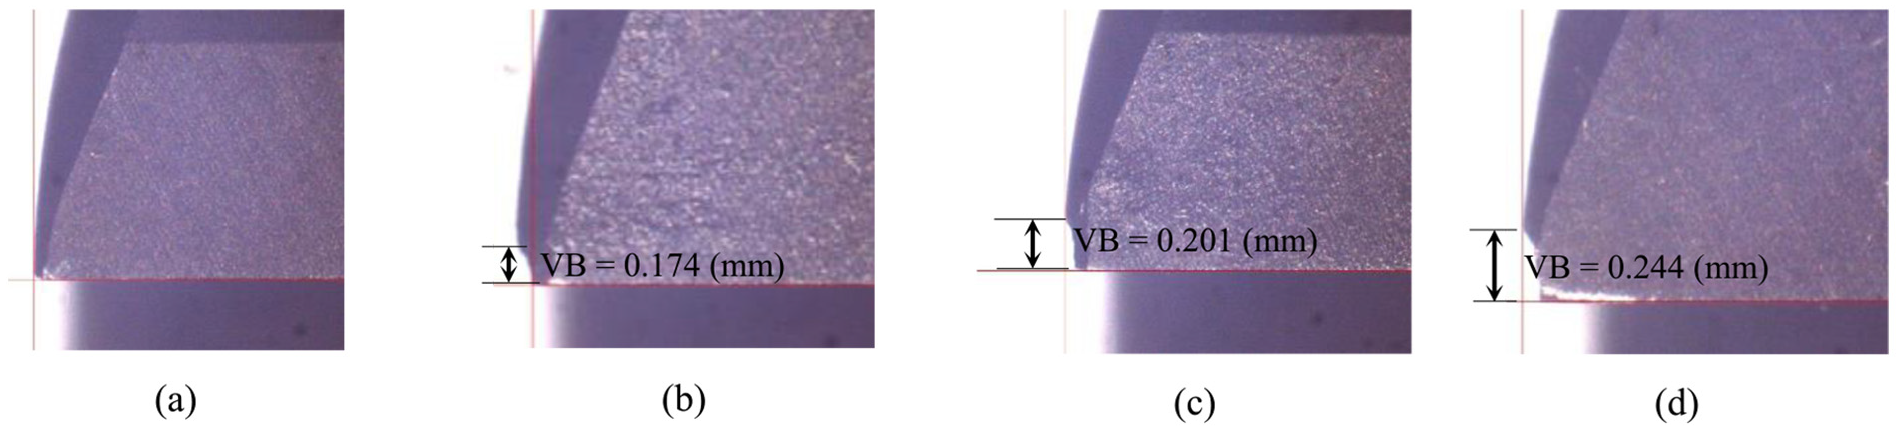
The tool flank wear of the end mill of four experiments: (a) No. 2, temperature 39.3 °C; (b) No. 14, temperature 46.3 °C; (c) No. 6, temperature 50.8 °C; and (d) No. 24, temperature 51.0 °C.
Based on the tool wear experiments in this work, we approximately found that if the cutting temperature is little greater than 50 °C, the tool wore intensively. Therefore, it is suggested that 50 °C is the constraint value of cutting temperature for multi-objective optimization when tool life is concerned.
The effects of process parameters on machining responses are shown in Figure 9. The contributions of process parameters to the machining responses are calculated by percentage (%). It can be found that cutting velocity (vc), hardness (H), and depth of cut (ap) have the greatest effect on Ra, Pc, and Tc, respectively. Other process parameters have a lower effect, and their effect varies depending on the machining response. For example, the magnitude of effect of fz on Ra and Tc ranks second meanwhile the second rank of effect on Pc is ap. The graph of the effect of input parameters also indicates that all the input parameters have a positive effect on the machining response. Increasing the values of input parameters results in the increase in machining response. This result agrees well with the relation showing in Figures 5–7.
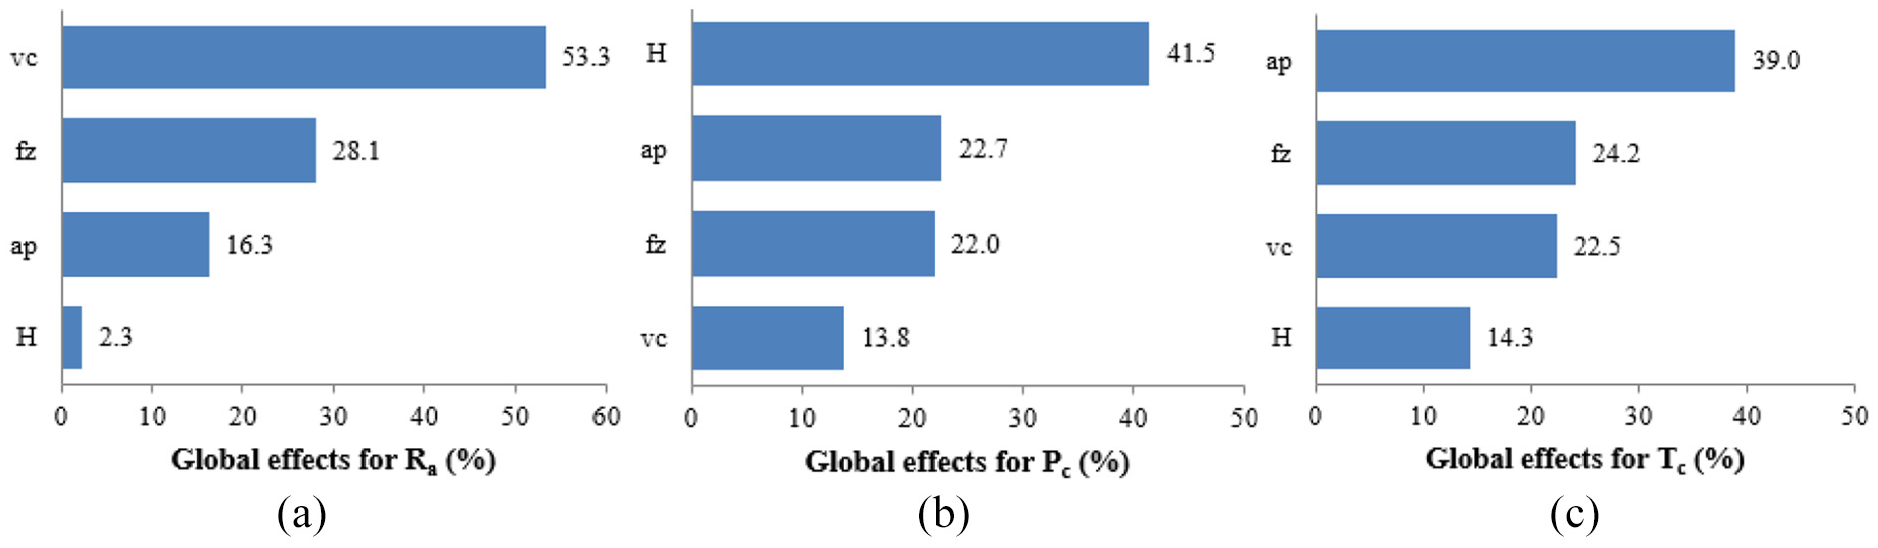
The global effect of input parameter on (a) Ra, (b) Pc, and (c) Tc (%).
This work focuses and pays more attention to the effect of workpiece hardness to the machining response including surface roughness, cutting power, and cutting temperature. It is interesting that the surface roughness nearly does not depend on the hardness (Figure 9(a)). However, the hardness has a double influence on cutting power compared to that of other process parameters (Figure 9(b)). Therefore, cutting harder material consumes more energy. These results agree well with the theory of metal cutting. Although the hardness has the most effect on cutting power, it has the lowest effect on cutting temperature compared to the remained cutting parameters (Figure 9(c)). As a result, tool life is less dependent on hardness compared to the depth of cut or feed rate.
After modeling the relationship between input variables and machining performance by Kriging model, these approximate functions will be adopted to solve the multi-objective optimization problem using PSO algorithm. At first, the unconstraint multi-objective optimization in which all the input parameters (vc, ap, fz, H) are included that maximize MRR and minimize Pc regardless of the surface roughness and tool wear. This optimization problem is to observe the behavior of process parameters. The scatter Pareto plot is generated by the PSO algorithm, which is exhibited in Figure 10. The black points are feasible solutions, and the blue points are optimal solution points (Pareto front points). It can be seen that optimal solutions are divided into three distinct regions. Regions 1 and 3 (Figure 10) have a high slope of Pareto front. When increasing MRR, at the same time Pc also increases exponentially. The phenomena of the region 1 can be explained as follows. When cutting at a very low MRR, the vc, ap, and fz are very low. In this case, increase in the vc, ap, and fz will increase cutting force very fast. In region 3, very high MRR means that the vc, ap, and fz are also high. The cutting tool works in a heavy condition so that the cutting force increases rapidly. In region 2, the Pareto line has a lower slope. In addition, optimum MRR and Pc have a linear relationship. We recommend that the region 2 is the good practice region. The MRR should be in the range of region 2 because the ratio of MRR and Pc is the smallest or the energy efficiency is largest. It can be seen that the shape of the Pareto front in Figure 10 is an important finding in this work because it gives the overall picture of the unconstraint multi-objective optimization when productivity and energy consumption are paid more attention due to the continuous requirement of manufacturing cost reduction.
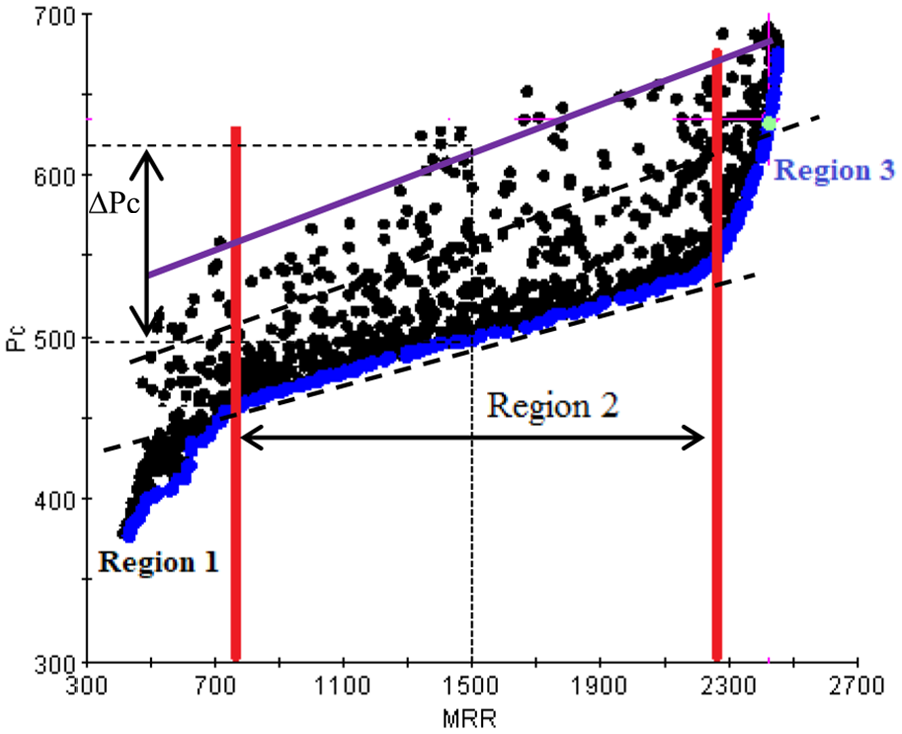
Pareto front generated by PSO algorithm based on Kriging approximate model.
The unconstraint multi-objective optimization in which all the input parameters (vc, ap, fz, H) result also revealed that the Pareto front points are the one that the hardness H is in the lower bound. Based on optimization results, we found that low hardness results in a low cutting energy consumption. This is an unsurprised result; however, it proves that the model of the relationship between process parameters and machining responses as well as the result of optimization are reliable. The Pareto plot in Figure 10 also infers that the optimization always gives better solutions compared to an un-optimized case. ΔPc is the maximum amount of cutting power that can be saved by optimization.
As previously mentioned, the hardness of the workpiece cannot be treated as a control factor; therefore, the hardness of the workpiece was considered as a fixed input parameter. Three optimization scenarios that were mentioned in section “Materials and methods” were investigated. Each scenario was done with three values of hardness: 40, 45, and 50 HRC. Then, the regression equations of minimum of cutting energy, material removal rate, and hardness were derived in the following form

where a and b are the coefficients, and c is the constant.
The regression equation (1) can be used to predict the lowest cutting energy when the hardness of the workpiece and the material removal rate are determined. The proposed approach is convenient for practical use because it is simple and easy to utilize.
Figures 11–13 show the Pareto front in which the two axes of the plot are the objective functions (MRR and Pc). The green line displays the trend line of the Pareto solutions. The linear regression equations and the coefficients of the determinant (R2) are included in the graph. The R2 values are greater than 0.9 and closed to 1.0. This means that the goodness of fit of the regression equations is very high. It is obvious that when increasing the MRR, the minimized Pc increases. However, the found things are that the slopes of the trend lines of the Pareto front are different. It can be seen that when the hardness of the workpiece increases, the slope of the trend lines in Figures 11–13 (the ratio of Pc and MRR) increases.
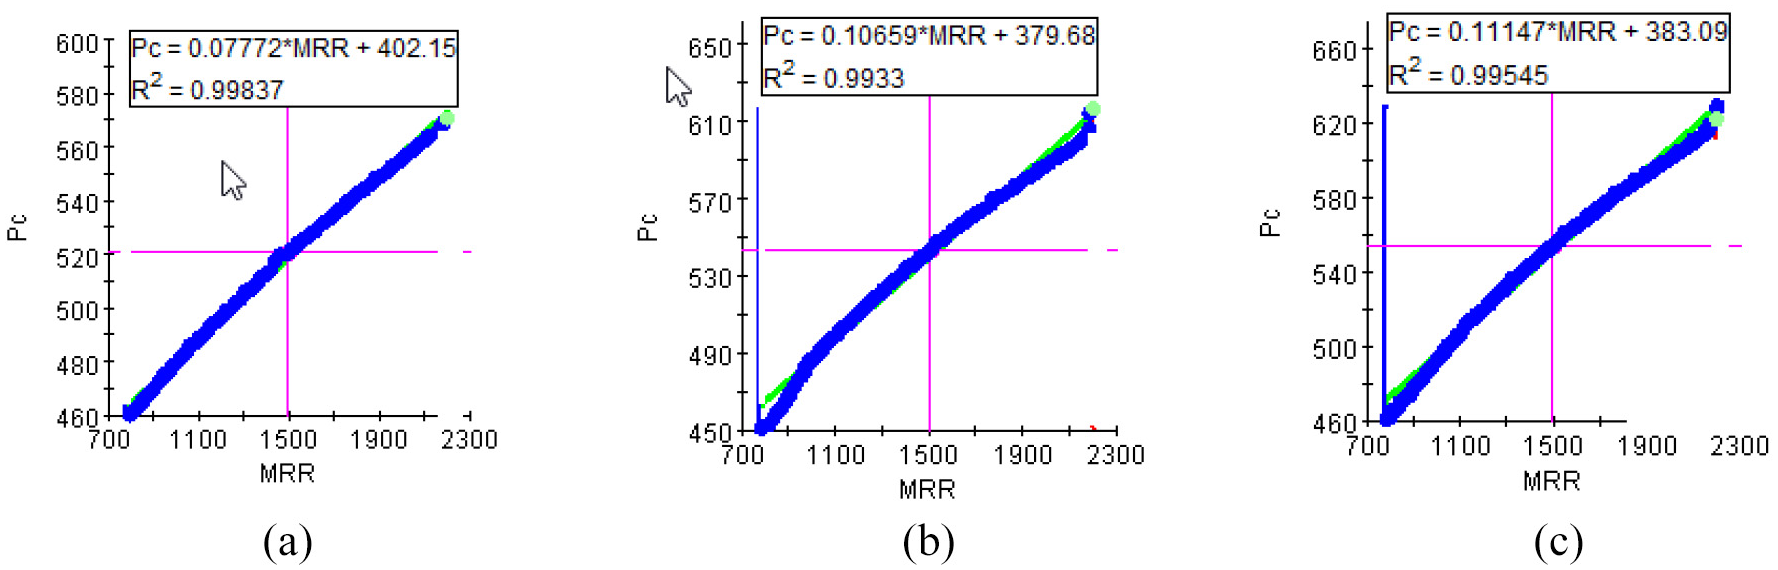
Pareto front for scenario 1 (unconstraint optimization) with different hardness: (a) 40 HRC, (b) 45 HRC, and (c) 50 HRC.
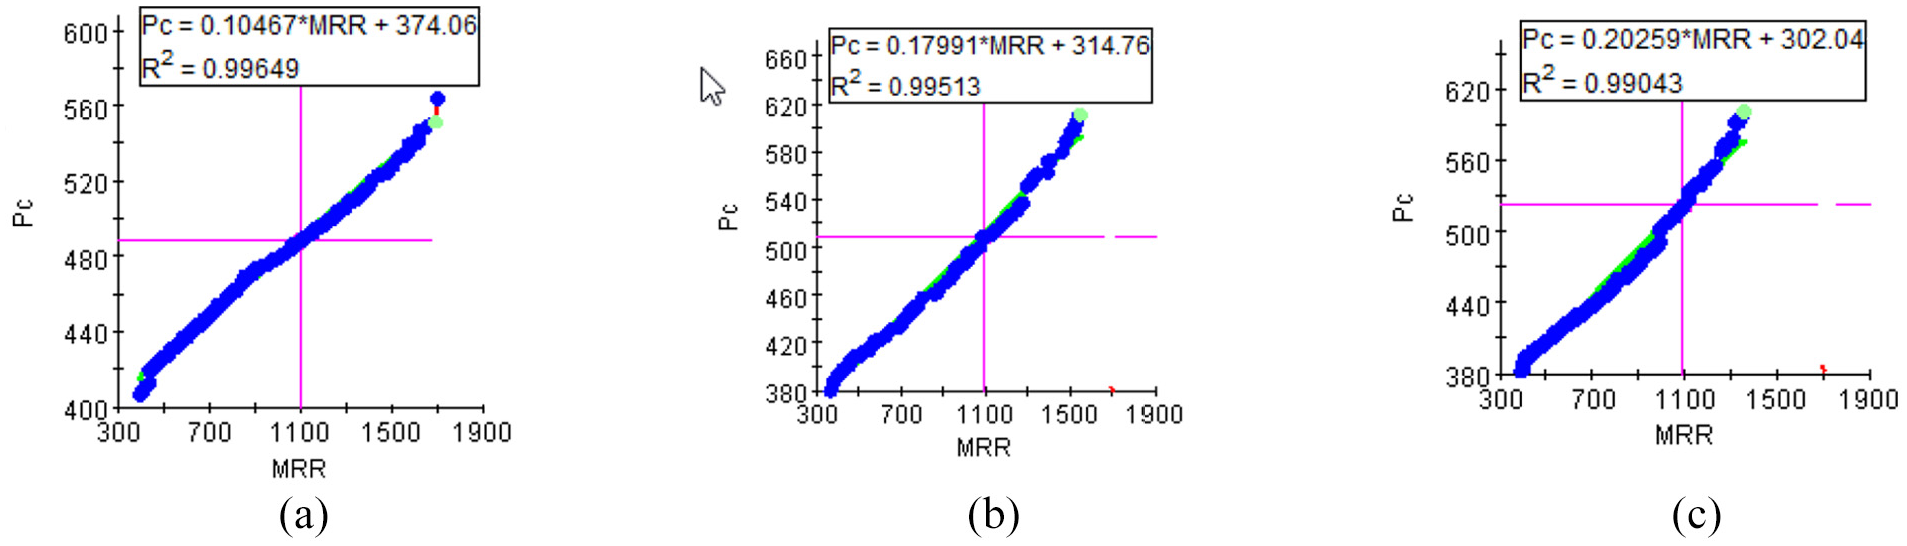
Pareto front for scenario 2 (cutting temperature Tc ≤ 50 °C is constraint) with different hardness: (a) 40 HRC, (b) 45 HRC, and (c) 50 HRC.
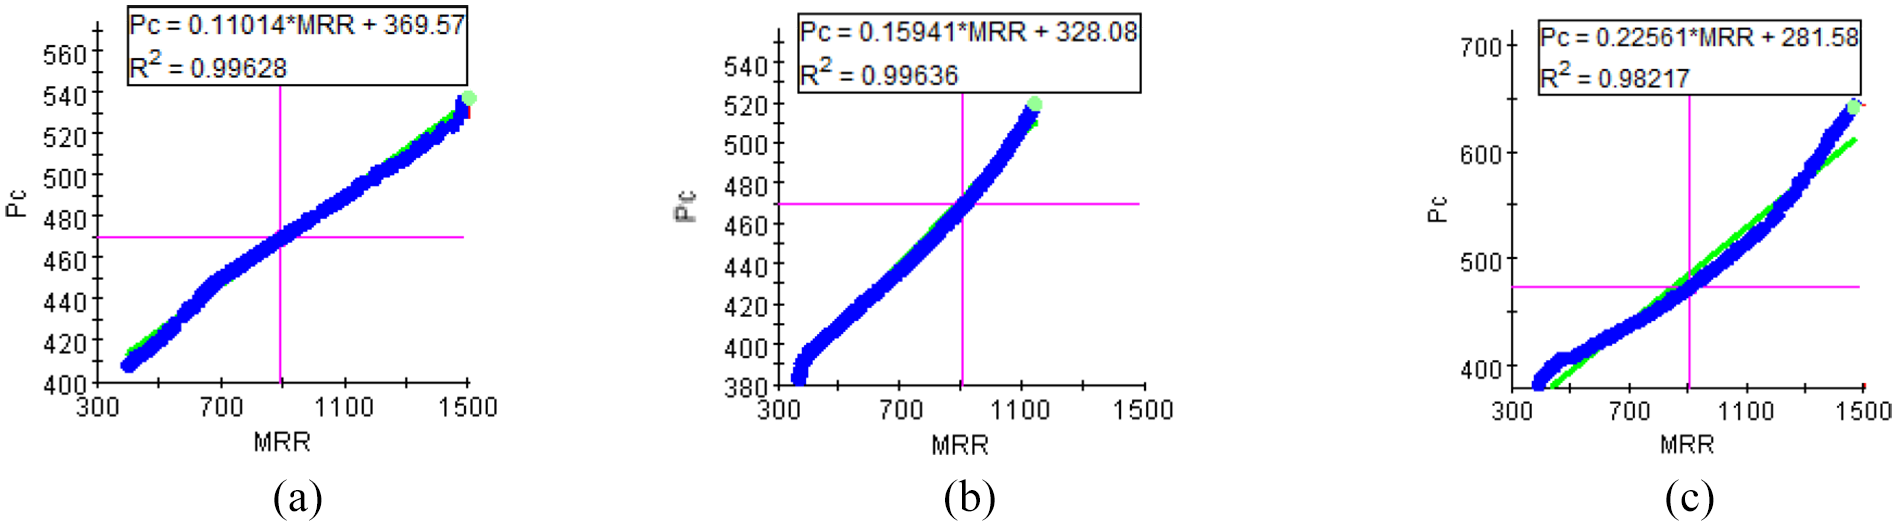
Pareto front for scenario 3 (surface roughness Ra ≤ 0.8 is constraint) with different hardness: (a) 40 HRC, (b) 45 HRC, and (c) 50 HRC.
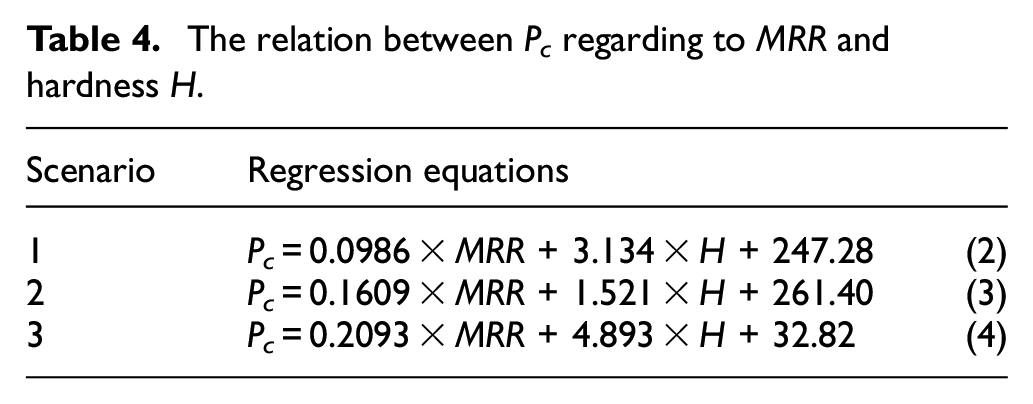
To predict the relation among Pc, MRR, and workpiece H, regression models were derived based on the data from Figures 11–13. These three regression equations are presented mathematically in Table 4. All of the regression equations are statistically significant. Table 5 illustrates the analysis of variance (ANOVA) result for scenario 1 (regarding equation 2 in Table 4). The R2 = 0.977 and p values of intercept, MRR, and H are lower than 0.05 (significant level = 5%). This means that all the coefficients of the regression equation are statistically acceptable. The equations in Table 4 can be conveniently used to predict the minimum cutting energy for any cases of MRR and H in their common range for three previously mentioned scenarios.
The relation between Pc regarding to MRR and hardness H.
ANOVA results for the scenario 1 (unconstraint optimization).
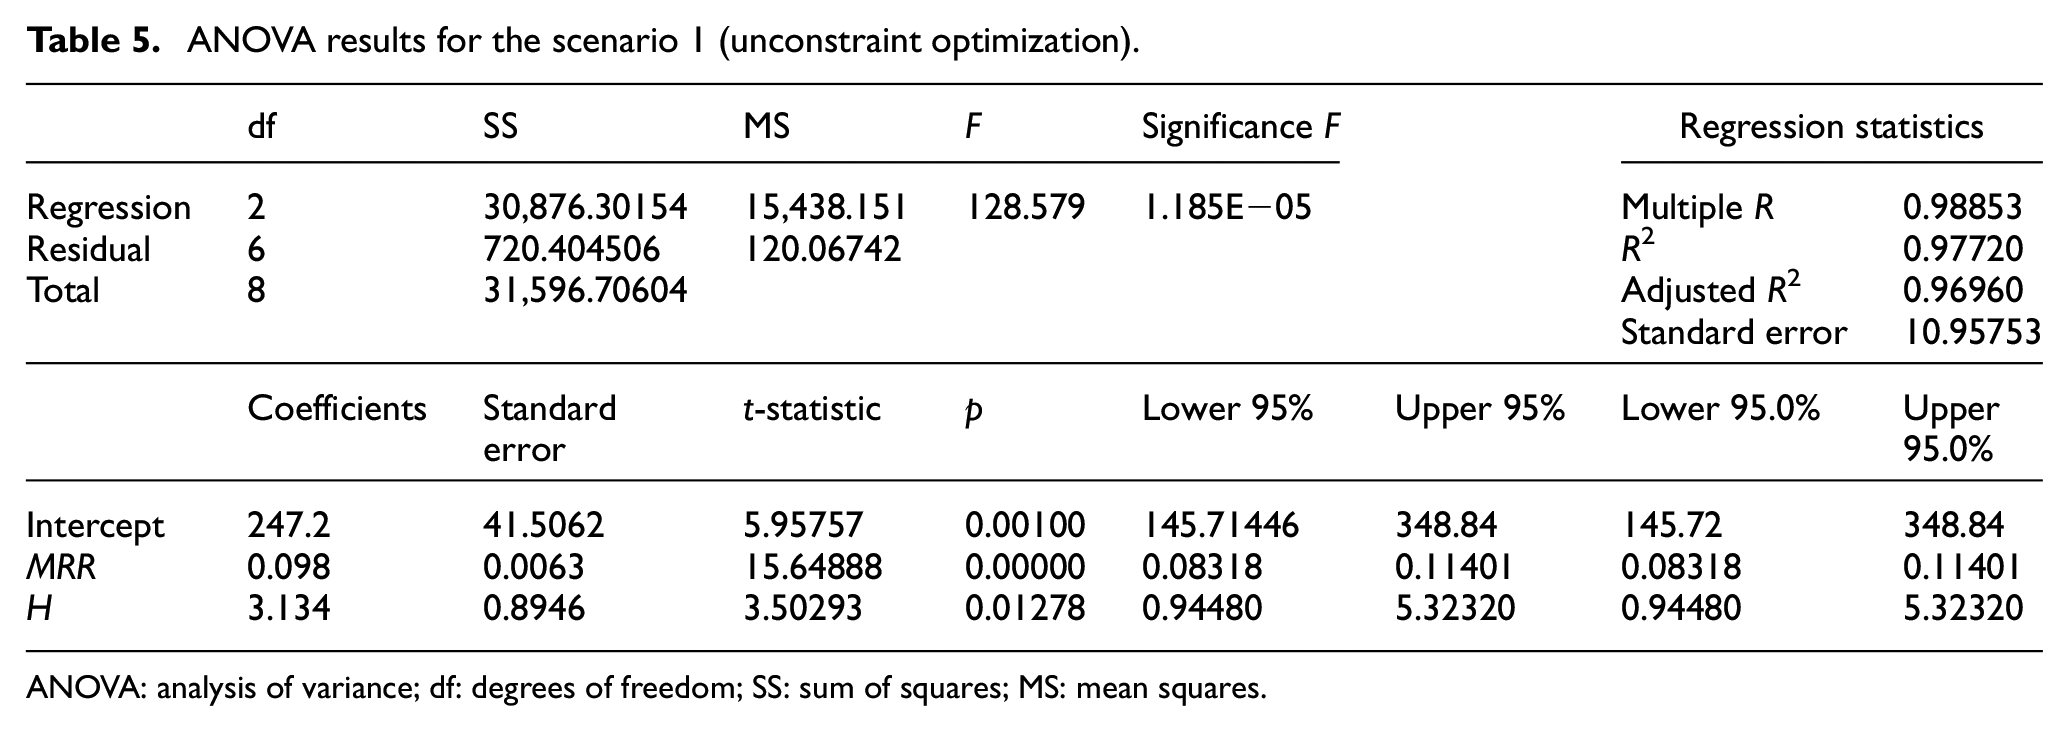
ANOVA: analysis of variance; df: degrees of freedom; SS: sum of squares; MS: mean squares.
Based on the linear regression equations showing the relation among Pc, MRR, and H in Table 4, it can be found that equation (2) for the case of the unconstraint optimization (scenario 1) has the lowest value of MRR coefficient (0.0986) compared to that of scenario 2 (0.1609) and scenario 3 (0.2093) (constraint optimization). It means that the energy efficiency for the case of machining without constraint is higher than that of constraint optimization. In addition, the effect of workpiece hardness on the cutting energy varies according to the scenario. In the case of cutting temperature is a constraint (scenario 2), hardness has the lowest effect compared to scenarios 1 and 3.
Another significant contribution of this work is to estimate what percentage of improvement of the process parameter optimization can be obtained compared to arbitrary un-optimized case. The Pareto plot of feasible solutions in Figure 14 answers this research question for the case of unconstraint optimization. For example, if the material removal rate is 1500 mm3/min for the case of 40 HRC of hardness, the minimum of cutting energy is 521 W compared to 591 W of the worst case. The potential improvement of energy saving is (591 − 521)/591 = 11.8%. For the case of 45 and 50 HRC of hardness, the improvement of energy saving is (639 − 545)/639 = 14.7% and (650 − 556)/650 = 14.4%, respectively. It can be seen that optimization always gives better energy consumption.
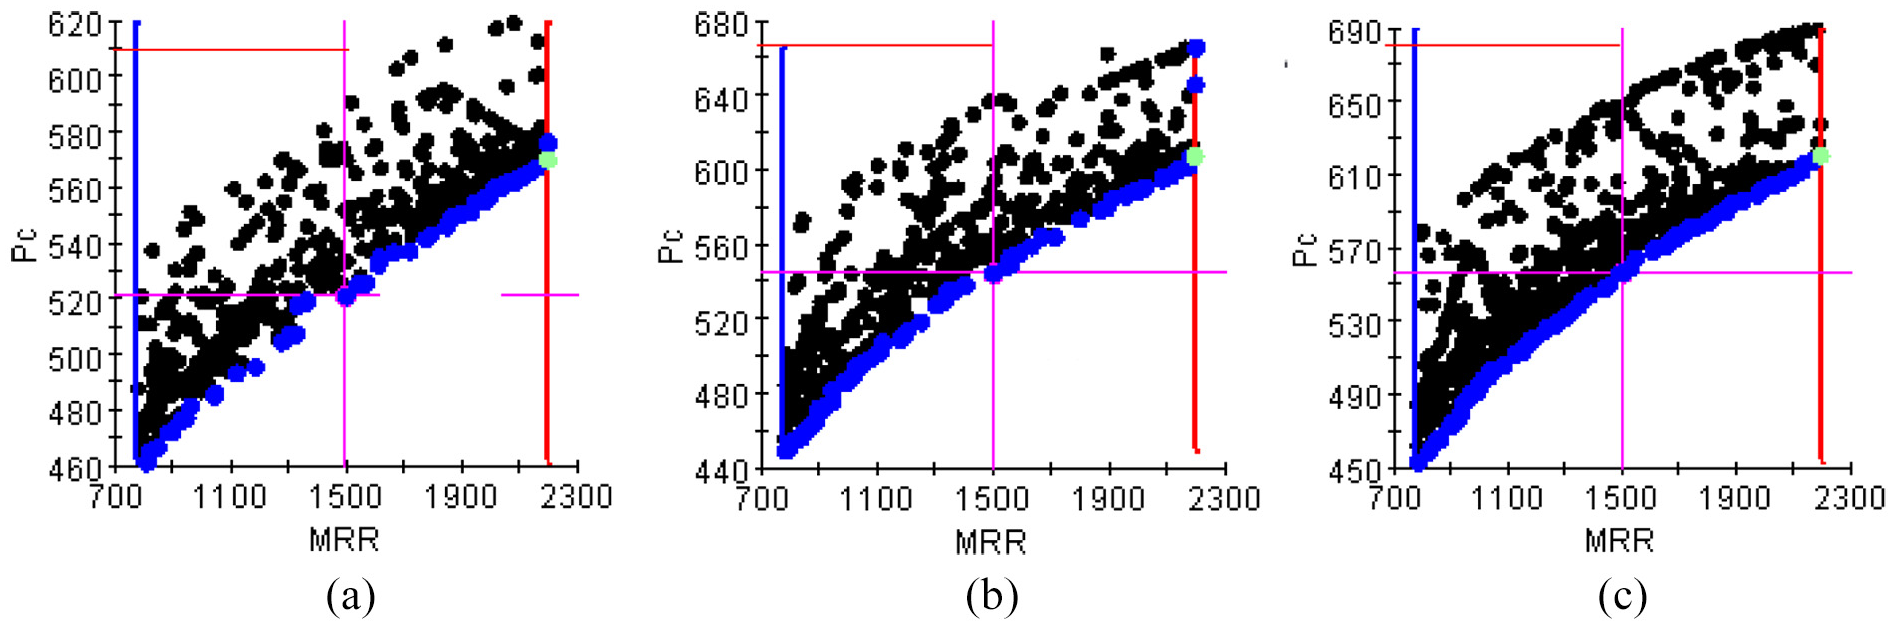
Illustration of the Pareto plot of feasible solutions for the scenario 1 (unconstraint optimization) with different hardness: (a) 40 HRC, (b) 45 HRC, and (c) 50 HRC.
The Pareto plot also shows that multi-objective optimization (minimized cutting energy and maximized material removal rate) results in multi solutions instead of a single solution. The blue points or the bottom points in Figures 10–14 are the Pareto front. The Pareto plot shows the trade-off optimal solution because increase in MRR will increase Pc. Choosing what optimal point depends upon certain machining conditions and purposes. To determine the optimal input process parameters at a selected optimal point in the Pareto optimal set, the data mining was used as shown in Figure 15. For example, when choosing an optimal point on Pareto front in Figure 14(b) in which the H = 45 HRC, MRR = 1507 mm3/min, and Pc = 544.4 W, the optimal process parameters are: vc = 48.4 m/min, fz = 0.034 mm/tooth, ap = 0.664 mm. It can be seen that the combination of Pareto plot and data mining is convenient for the decision-making of preferring multi-objective solution. This approach is more practical than the method that converts to multi-objective optimization to single optimization by weighting because there is no common rule for choosing the weight for each objective function. Pareto plot and data mining with graphical and tabular data are also more convenient than Taguchi-based TOPSIS (technique for order preference by similarity to ideal solution model) because TOPSIS also requires the information of weight of the criteria.
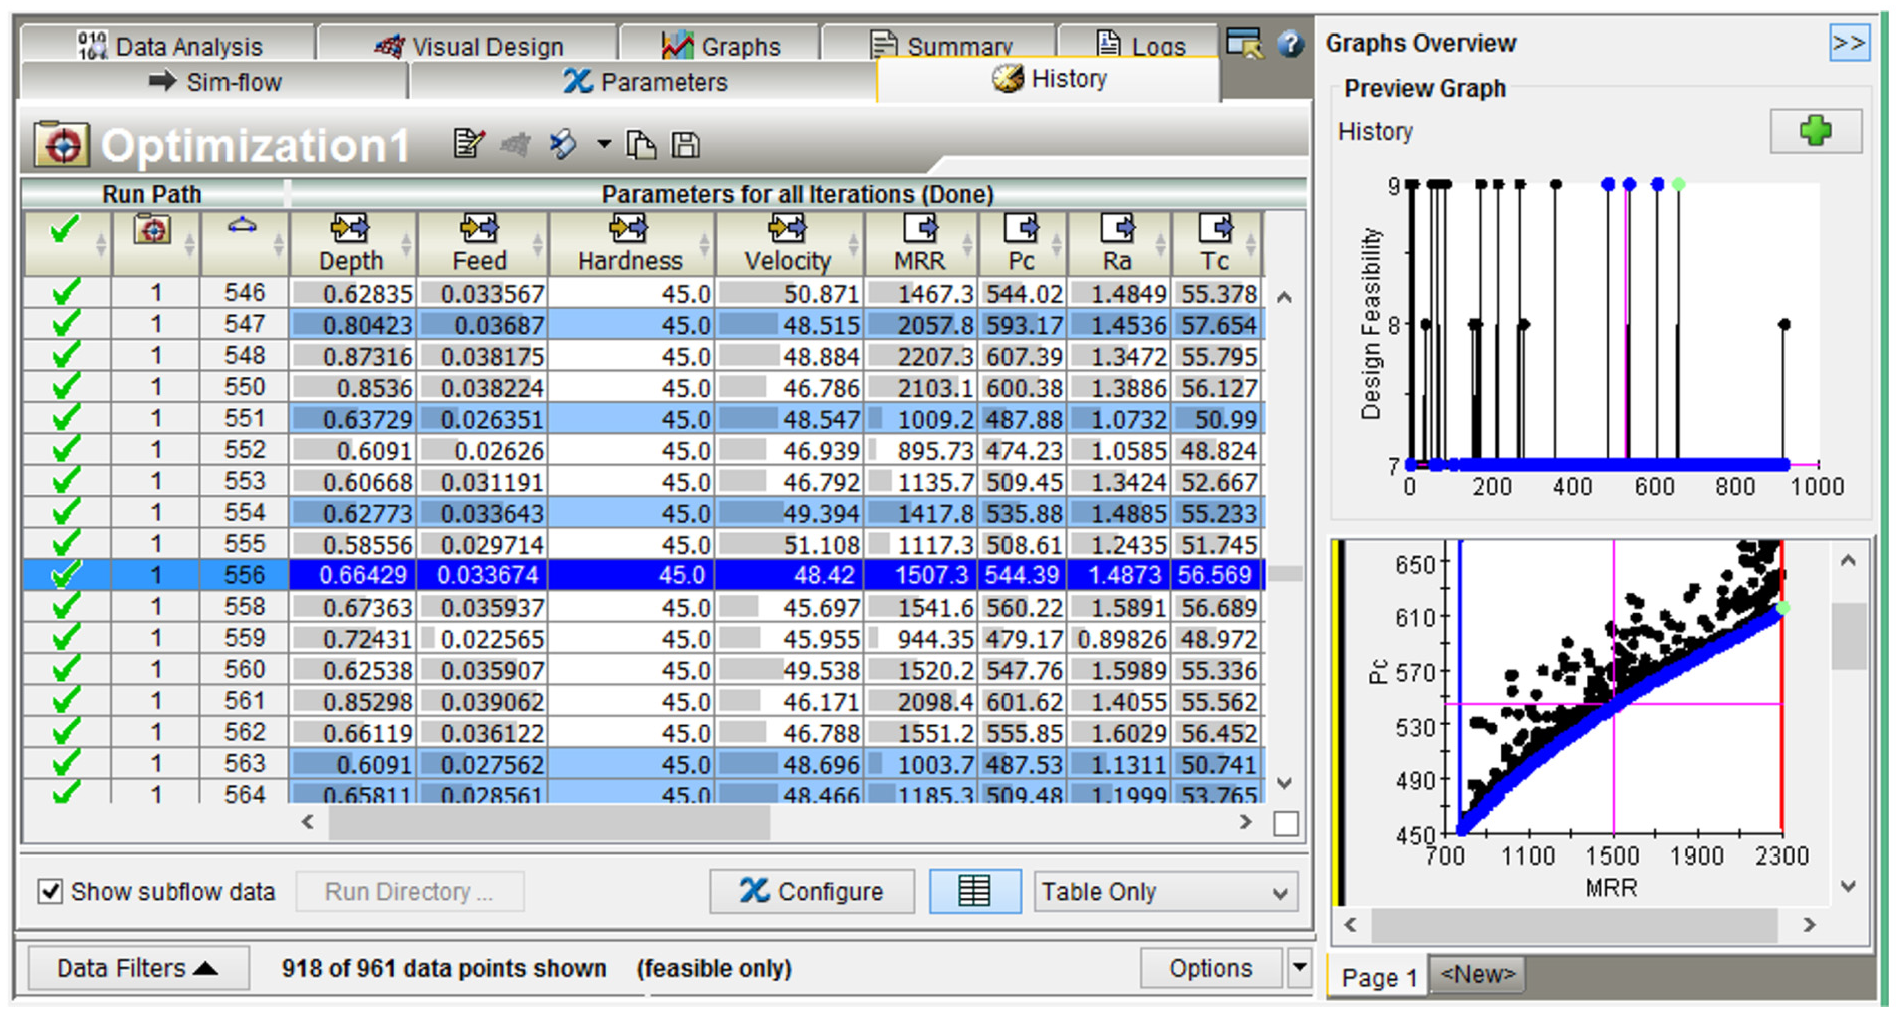
Data mining for determining the optimal input process parameters.
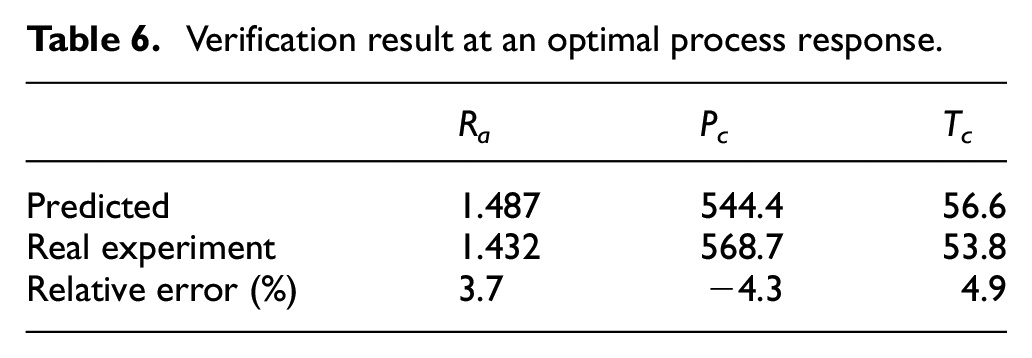
To verify the optimal results based on an approximate mathematical model and proposed optimization method, an experimental verification was carried out to assess the error. The comparison between the predicted and experimental values was listed in Table 6. The verification result shows that the relative errors of Ra, Pc, and Tc between the predicted and actual experimental values are 3.7 %, −4.3%, −4.9%, respectively. These errors are less than 5% and that can be acceptable in engineering. The verification indicates that the approximate Kriging model and PSO optimization method are reliable. It can be confirmed that the combination of Kriging model and PSO multi-optimization is a versatile or general-purpose method for solving nonlinear engineering optimization.
Verification result at an optimal process response.
Conclusion
This paper investigates the hard milling process on AISI H13 steel in terms of productivity, quality, and cutting energy under nanofluid MQL condition. The simultaneous increase in machining productivity and reduction of energy consumption in a green manufacturing environment are a significant contribution. The cutting energies of various workpieces and machining parameters were intensively focused on this work. In summary, our research proposes the Kriging model to exhibit the relationships between hard milling process variables (depth of cut, cutting velocity, feed per tooth, and workpiece hardness) and technological responses (surface roughness, cutting power, and cutting temperature), and then the PSO evolutionary algorithm is employed to solve multi-objective optimization problem for several machining scenarios regarding roughing and/or finishing machining operation. The combination of Kriging metal model based on statistical scheme and emerging PSO multi-objective algorithm fosters the optimization process of hard milling under nanofluid MQL. The proposed modeling and optimization method can be considered as a convenient and reliable approach that can be widely used in mechanical engineering. The main conclusions derived from the results of this work can be drawn as follows:
The Kriging model for the cutting power, surface roughness, and cutting temperature has R2 value of 0.95, 0.97, and 0.96, respectively. Therefore, this is an appropriate model that can be effectively used to model the influence of process parameters and machining response with high accuracy.
The optimization results show that cutting energy can be reduced up to around 14% compared to the worst case without optimization.
It is found that the optimization problem, where the material removal rate and cutting energy are considered as objective functions and the surface roughness or cutting temperature related to tool life is a constraint, is more appropriate than a single objective and three or more objectives in milling machining. Too many objectives will narrow down the feasible solutions that are not technically and economically efficient.
Multi-optimization without cutting temperature and surface roughness constraint (in case of rough cut) results in lower cutting energy compared to constraint optimization.
Based on the Pareto plot, the proper selection of input machining parameters can help the machine tool operator to increase the machining productivity and energy efficiency.
The Pareto front obtained from multi-objective optimization results shows that the lowest cutting energy has a linear relationship with the hardness of the workpiece and the material removal rate. The increase in the hardness and MRR makes the increase in cutting energy linearly.
The percentage of improvement of the productivity, quality, and cutting energy obtained by optimization depends on certain machining scenarios (rough cut or finish cut, single optimization or multi-optimization). However, appropriate machining parameters can only be achieved by process parameter optimization and obviously increase the machining productivity and energy efficiency that contribute to an eco-friendly industry.
The data mining is a robust tool that can support an accurate determination of input parameters when technological responses of machining are selected by the optimal algorithm.
This work is intended as a contribution to green manufacturing. However, the research results are just case studies of hardened AISI H13 steel and flat end mill tool. Other hardened materials and cutting tools will be studied in the future. The tool wear, tool life, and microstructure of machining surface under other nanofluid cooling as well as the optimization with machining cost will also be the further work.
Footnotes
Author’s Note
Ngoc-Chien Vu is also affiliated with Mechanical Engineering Faculty, Nha Trang University, Vietnam.
Declaration of conflicting interests
The author(s) declared no potential conflicts of interest with respect to the research, authorship, and/or publication of this article.
Funding
The author(s) disclosed receipt of the following financial support for the research, authorship, and/or publication of this article: This work was partially financially supported by the Ministry of Science and Technology of the Republic of China under contract number MOST 107-2622-E-992-013-362 CC3.