
Abstract
Plants are our source of oxygen and nutrients on earth. Therefore, conservation of biodiversity is vital for the survival of other species. With the developing technology, plant species can be examined more closely. Image processing, which is a subject of computer science, has an important role in this field. In this study, an image processing–based method has been developed to automatically separate the petiole region of the plant leaves. To determine the boundary line of the petiole region, the cumulative pixel distributions of the input images in binary format according to the X- and Y-axis are analyzed. Accordingly, optimum thresholds and petiole boundary points are determined. The proposed method was tested on 795 leaf images from 90 different plant species that grow both as trees and shrubs in the Czech Republic. According to the results obtained in experimental studies, it is thought that the proposed method will make an important contribution especially in studies such as automatic classification of plants and leaves and determination of plant species in botanical science.
Introduction
Plants are one of the most important sources of life in our world. Carrying these resources to the future in a healthy way is necessary for the continuation of vital activities. For this reason, it is necessary to carry out procedures such as identifying, classifying plant species, and monitoring regional population numbers. Identification of plant species is a central challenge for the development of many botanical industries (sustainable agriculture and botanical medicine, cosmetics, etc.), conservation of biodiversity, and the success of habitat management. The ability to recognize and understand the characteristics of a plant species is often a task accessible to experts. Those used by botanists help to make a semantic interpretation possible and to classify a leaf according to a species list. Biodiversity is declining steadily worldwide. 1 The current extinction rate is largely a result of direct and indirect human activities. 2 Accurate knowledge of identity and geographical distribution of plants are essential for the preservation of future biological diversity. 3 For this reason, rapid and accurate plant identification is essential for the efficient investigation and management of biodiversity.
Automated plant identification is a field of research that has gained increasing interest in computer vision as a promising solution for the development of many botanical industries and the success of biodiversity conservation. Most of the proposed approaches are based on the analysis of the morphological characteristics of the leaves. In addition, when a large amount of leaf species is encountered, it is particularly important to increase the sensitivity of the botanical information about the leaf parts (petiole, blade, and base) and thus to separate them from the image. Today, there is increasing interest in automating the process of identifying plant species. The availability and widespread use of technologies, such as digital cameras and mobile devices, new techniques in image processing, and pattern recognition, allow for the realization of automatic species identification.
Plant leaves play the most important role in the recognition and classification of plant species. The class of plant leaves belongs to can be decided by looking at their morphological features such as shape, fold and size. Hence, biological and physiological examination of leaves may be required in these determination procedures. 4 The features and shapes that will define the plant must be removed from the plant. For each class, it is necessary to determine the properties and make selections to represent the corresponding class. 5 A plant leaf as shown in Figure 1 consists of three parts: blade, petiole, and base. Blade is the large part that makes up the main leaf. Generally, the upper face is green, the lower face is pale green color, and the leaf consists mostly of two symmetrical parts. Petiole is the part that connects the leaf blade to the stem and generally has a short length. In the absence of a petiole, the leaf is connected directly to the main body. The base of the petiole (where it is attached to the node) may be of different shapes. Sometimes it is enlarged and called “pulvinus: cushion.” The base is the part of the petiole that joins the main body and is larger than the petiole. Leaf base is the structure that protects the buds in the leaf seat. If it wraps them, it is called leaf scabbard. If a leaf has these three parts, it is called a full leaf. Petiole may not be seen on all leaves. Therefore, leaves with petioles are called petiolate leaves, and leaves without petioles are called sessile leaves. 6
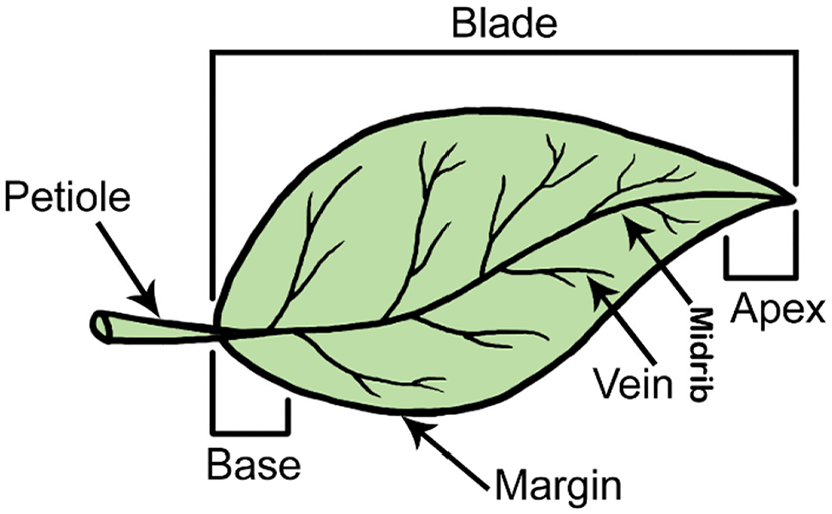
Parts of the leaf.
Nowadays, with the development of information technology, it has become easier to do all kinds of operations in computer environment. These processes also provided a huge gain in terms of time, cost, and labor force. One of the most important of these technological developments is that it contributes to the progress in many industries and sciences, thanks to processing images on computers. Image processing methods are an essential element, especially for botanical studies such as biodiversity conservation, agricultural processes, and plant classification. Computerized vision methods provide well-enough results in plant classification and identification. 7 Studies in this field have mostly performed image preprocessing, feature extraction, and classification. In particular, the process of feature extraction is a serious and time consuming. Each plant species has its own characteristics. Therefore, in order to obtain high accuracy in plant identification or classification processes, these attributes should be determined well.
Aakif and Khan 8 conducted study of fruit leaves by applying morphological processes using Fourier descriptors for feature extraction. In another study, Kulkarni et al. 9 used a framework to describe the classification of plants using the shape, vessel, color, and texture properties combined with the Zernike moment. Wu et al. 10 developed a domain-related visual and semantic feature of plant leaf, then these features were translated into a hierarchy that was easily represented by XML. There are many different approaches to leaf classification and recognition.11–17 The identification of plant leaves will occur as a result of the examination of each leaf separately. Recognition and classification of different types of plant leaves individually are not appropriate in terms of time and cost. For this purpose, leaf images can be automatically identified and classified in computer environment and will be very easy in terms of time and cost. Chaki and Parekh 18 have proposed an automated system for recognizing plant species based on leaf images. The moment invariant and centroid-radii shape models are studied for leaf recognition. Lee and Chen 19 have proposed region-based features for leaf image classification. Simple features, such as aspect ratio, compactness, and centroid, are used to classify and retrieve the leaf images of 60 plant species. Gu et al. 20 have shown a segmentation of leaf skeleton based on a combination of wavelet transform (WT) and Gaussian interpolation. The recognition rate is compared with k-nearest neighbors (k-NN) and radial basis probabilistic neural network (RBPNN) techniques based on run-length features extracted from the skeleton of the leaves images.
This paper provides an original method of automatically separating the petiole region in leaf images of woody plant species. There are almost no studies in the literature on this subject. In this respect, the proposed method is one of the preliminary studies. This paper is organized as follows. In the “Material and method” section, the properties of the dataset used in the experimental studies and the proposed method are explained in detail through a sample image. In the “Experimental results” section, the developed algorithm was tested with leaf images in dataset. Accordingly, successful and unsuccessful algorithms were analyzed. In the “Conclusion” section, the general evaluation of the proposed algorithm is made and the contributions to the literature are emphasized.
Material and method
In this study, petiole regions of plant images in binary file format were segmented. The samples used in the experiments is a database called MEW (Middle European Woods) 21 which was created in 2010 for the experiments on the recognition of tree species according to the leaf shapes. This database contains leaf images from 90 different plant species that grow both as trees and shrubs in the Czech Republic. For each plant species, there are 795 samples ranging from 2 to 25. The proposed method uses geometric and image processing techniques to solve the problem. The two-dimensional (2D) input images are converted into cumulative pixel distribution graphs according to the X- and Y-axis, and the targeted parts of the leaf are easily detected by geometric methods. The flowchart of the proposed method is shown in Figure 2.
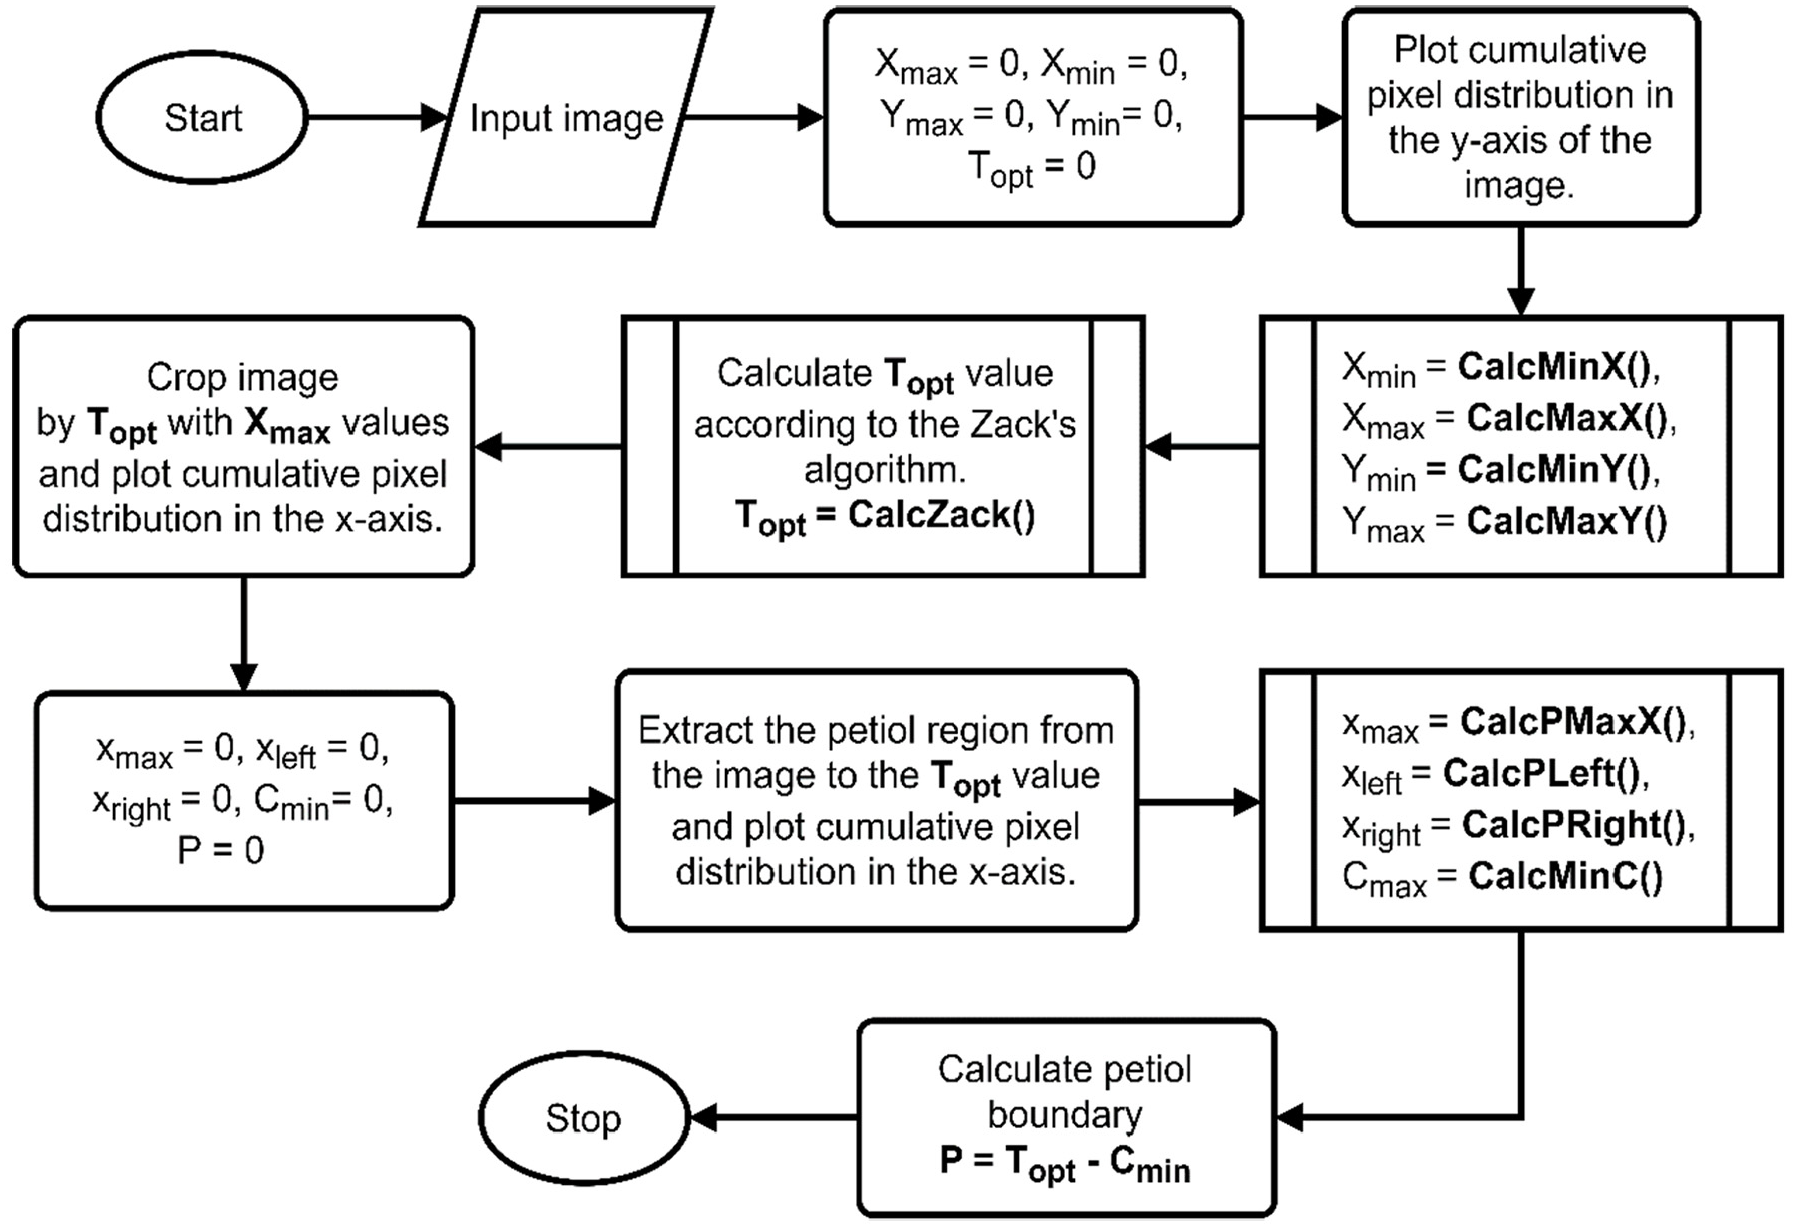
General flowchart of the proposed method.
In the proposed method, a cumulative pixel scatter plot is first drawn according to the Y-axis of input image. This graphic is scanned from right to left and the reference points
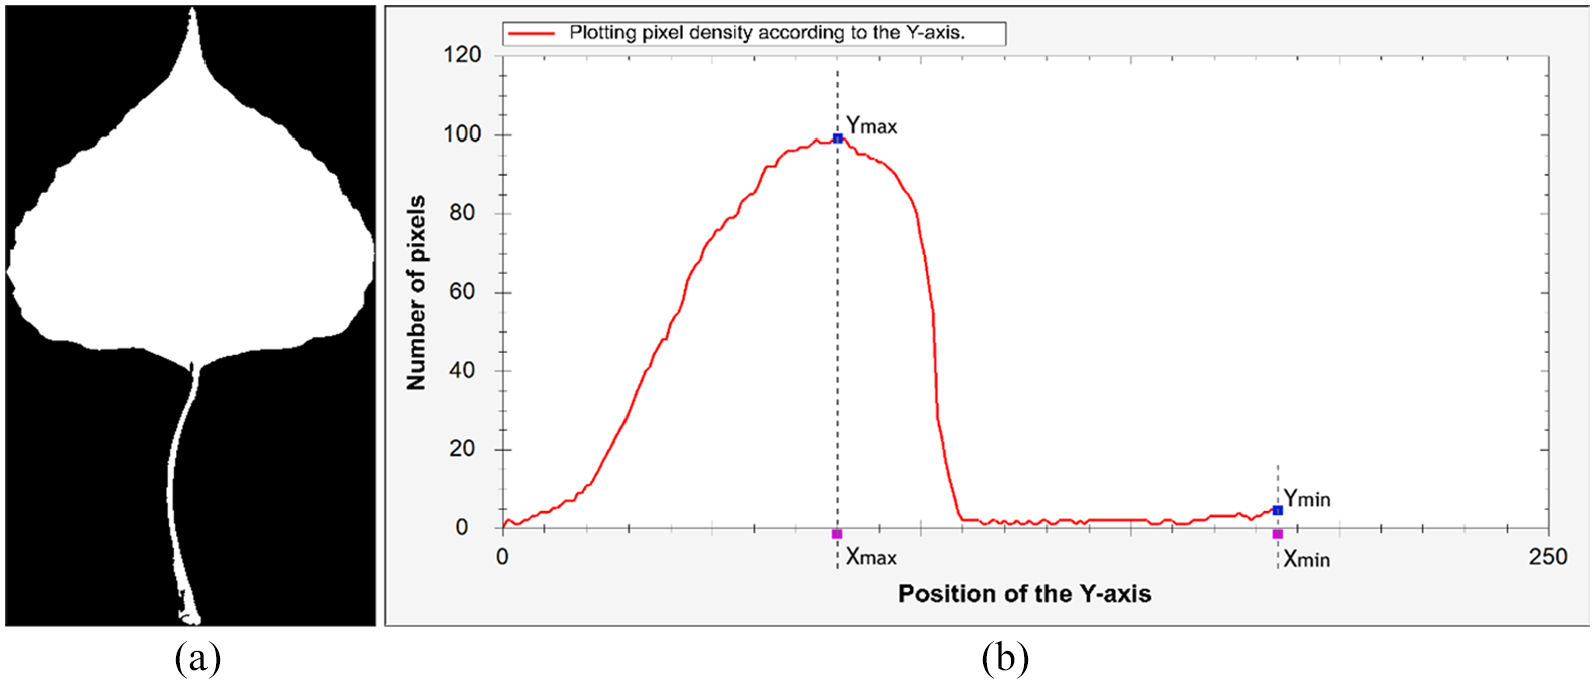
The cumulative pixel scatter graphic of leaf image according to Y-axis: (a) input image and (b) input image graph.
The following equations (1)–(4) are used to determine these reference points
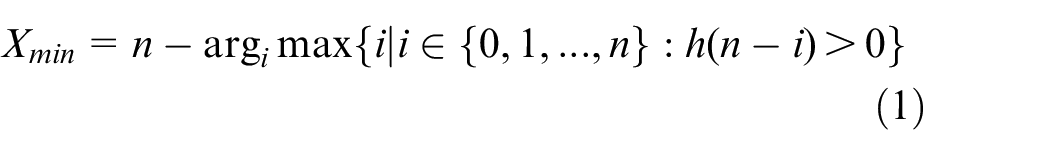

where


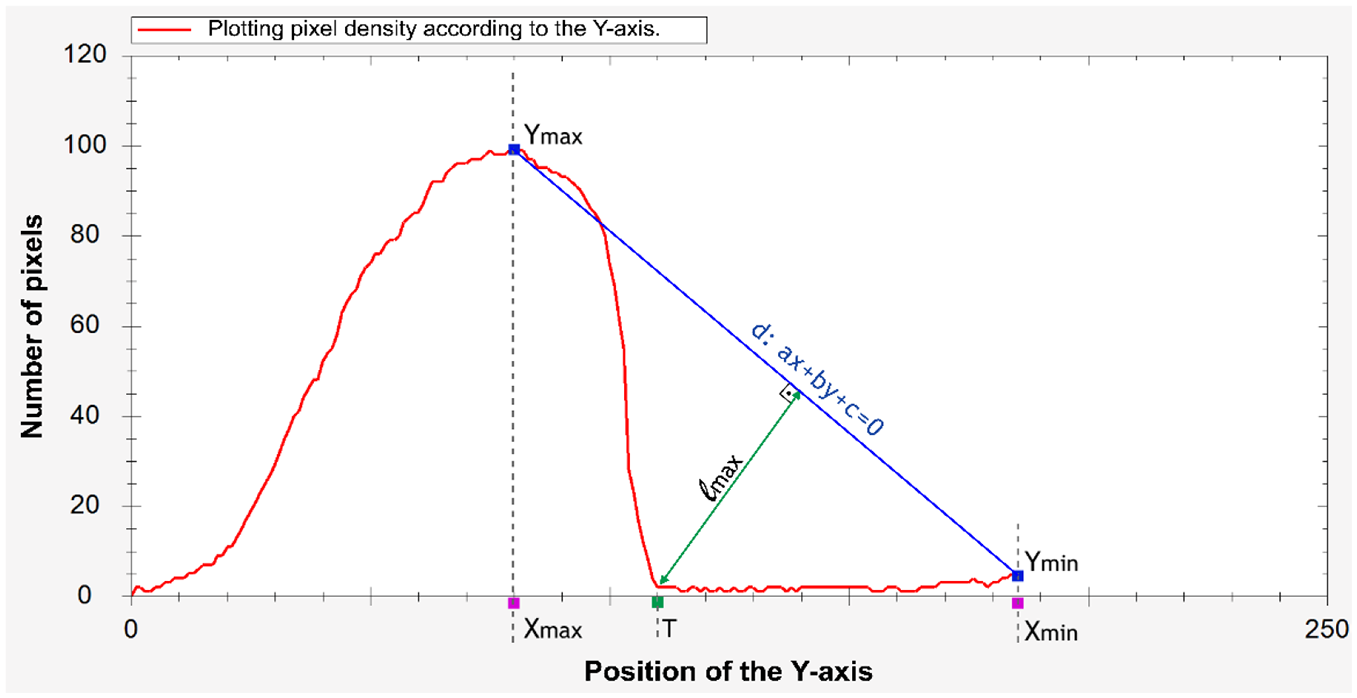
Zack’s triangle method.
Then, using these coordinate variables, the equation of d-line given two points is obtained as in equation (5)
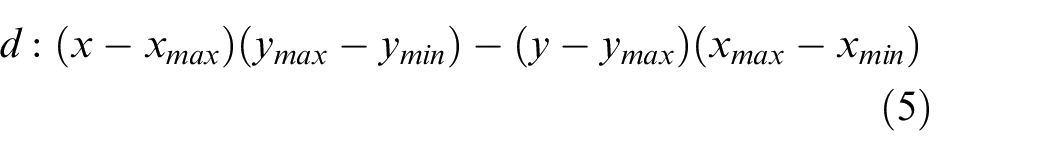
Assuming that this equation is
As a result of this process, as shown in Figure 5, optimum threshold point
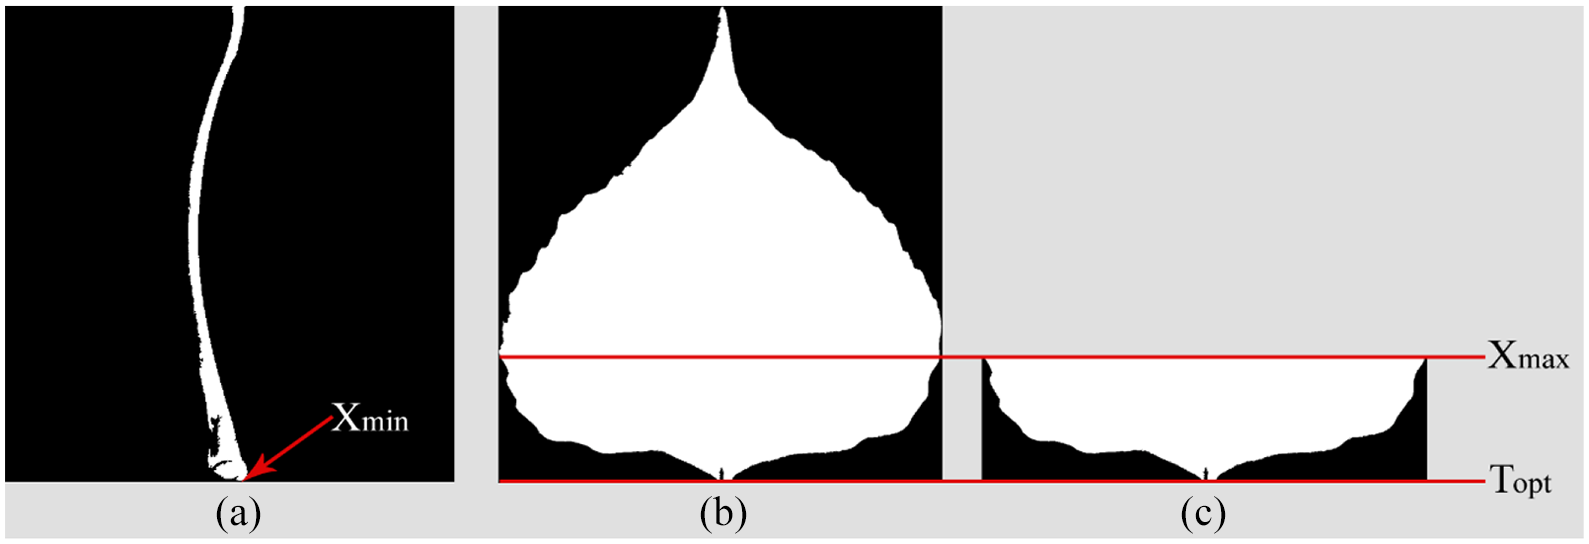
Parts of the leaf: (a) petiole, (b) blade, and (c) cropped blade according to
Figure 6 shows the pixel scatter graphic of the cropped leaf image according to the X-axis. When the graphs are examined, it is clear that there is a melt at the peak after the removal of the petiole. However, a certain reference range is required for accurate calculation of the petiole region in the graph shown in Figure 6(b). For this purpose, the cropped petiole image is plotted according to the X-axis and coordinates representing the width range of the petiole are obtained, as shown in Figure 7.
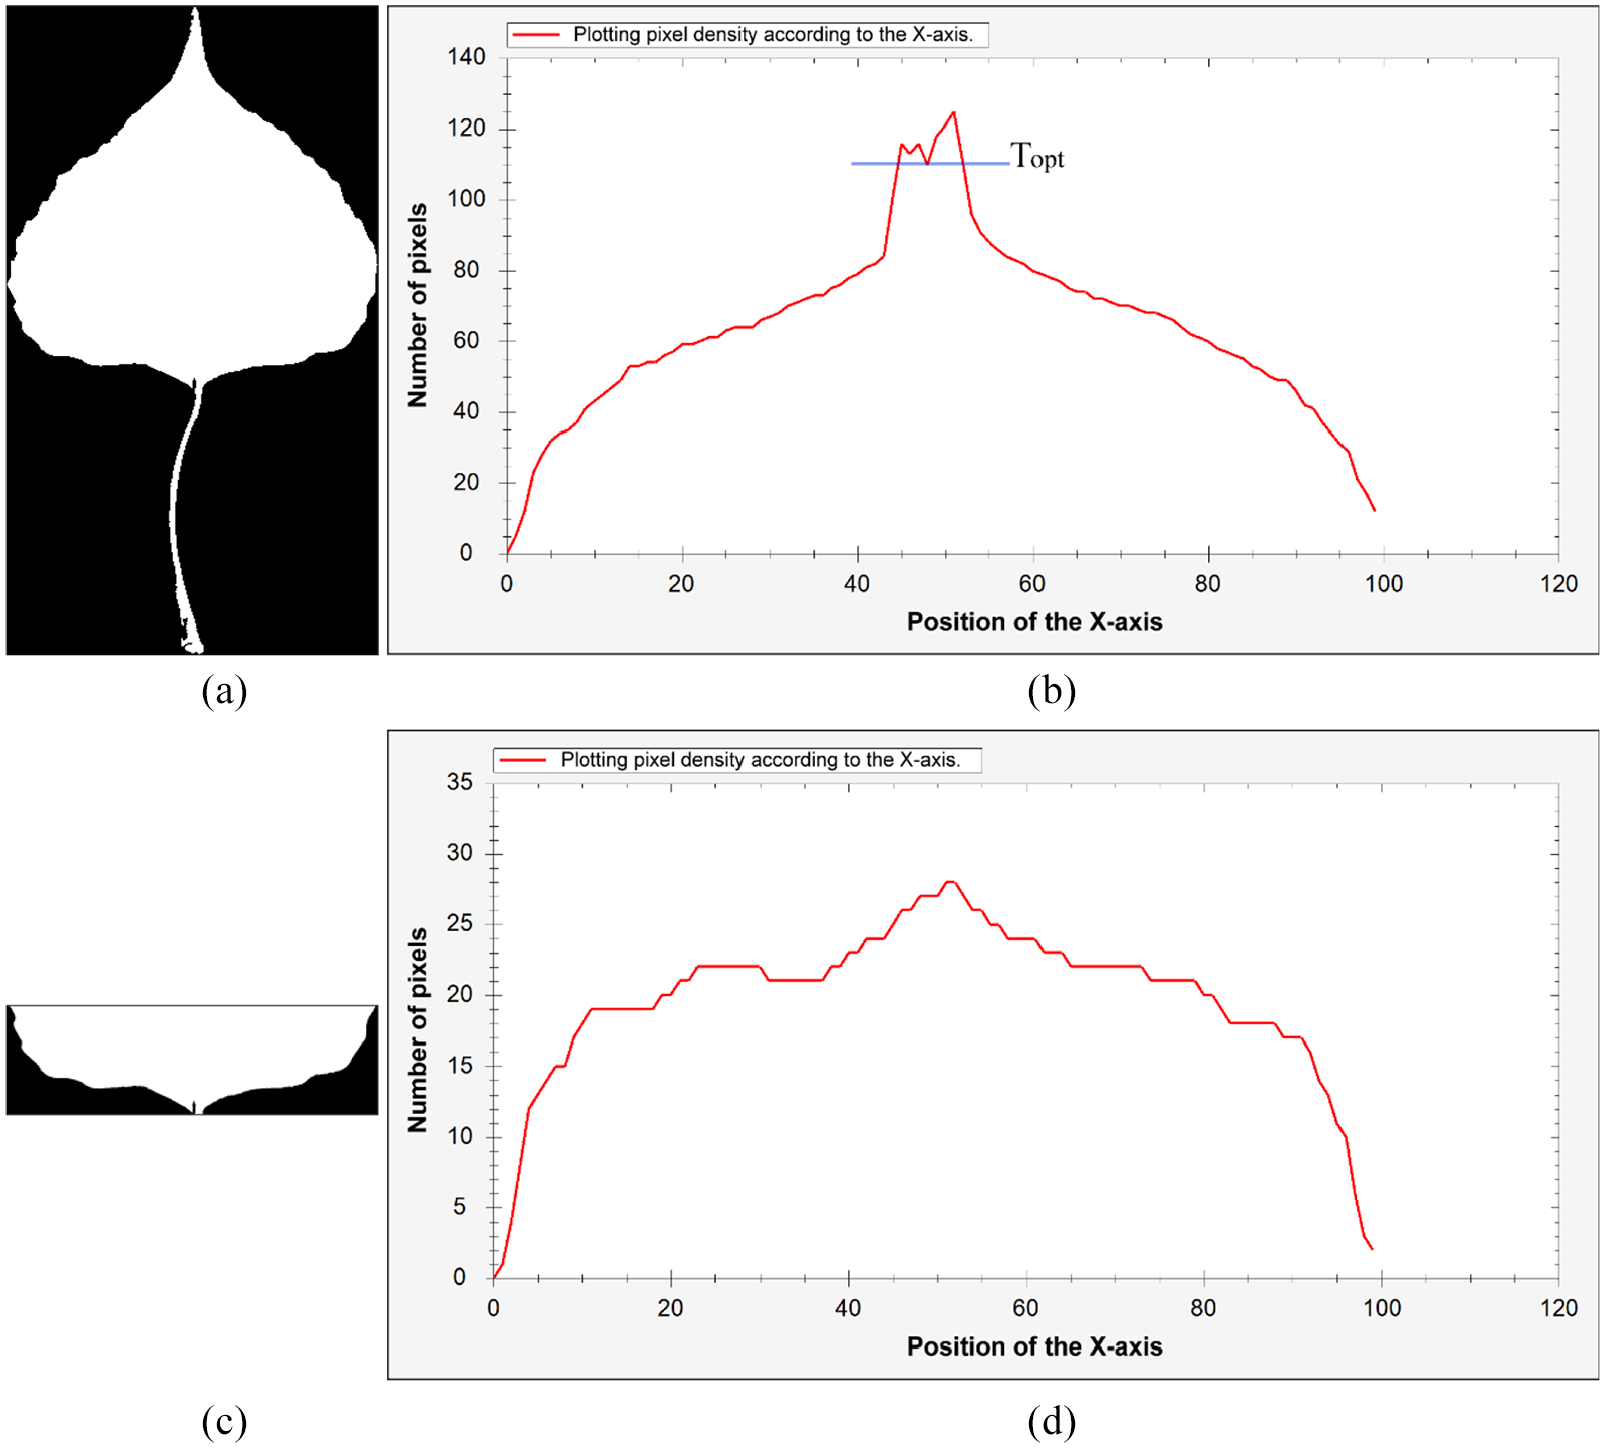
Cumulative peak scatter graphic of X-axis of leaf image: (a) input image, (b) input image graph, (c) cropped image and (d) cropped image graph.
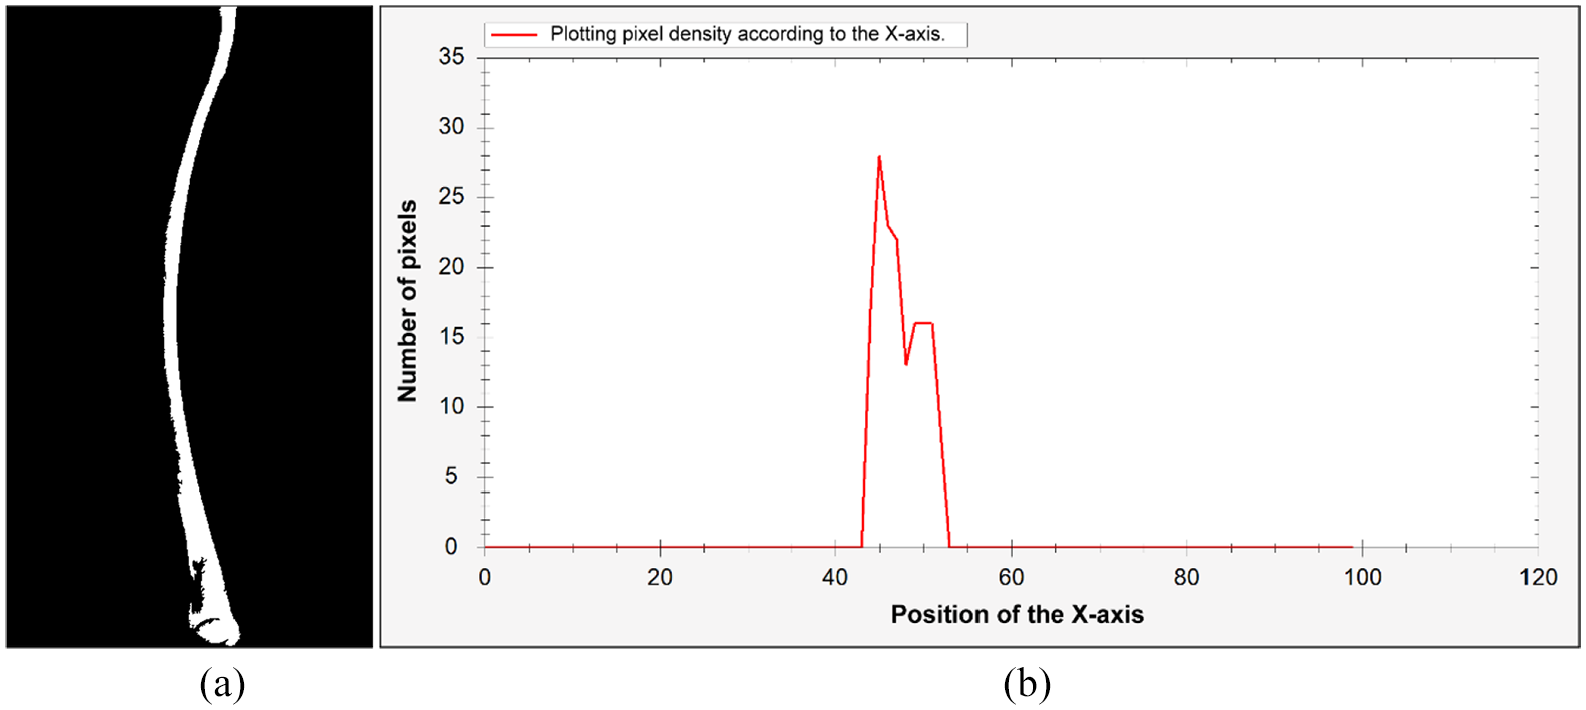
The widest range of petiole: (a) a cropped petiole and (b) cumulative pixel scatter graphic according to the X-axis of the petiole.
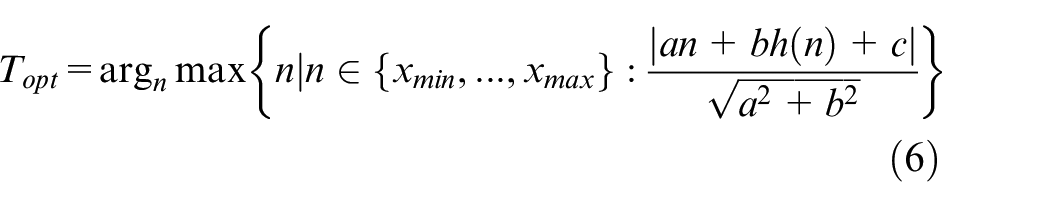
According to Figure 7(b), the reference point

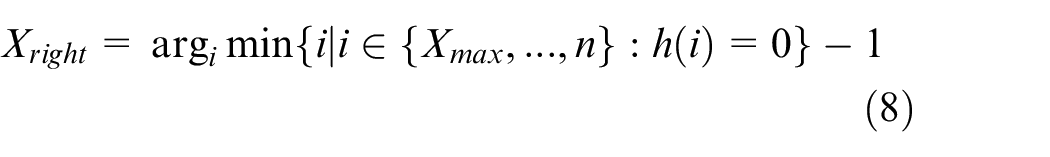
In the next step, the coordinate values

After this step, a cumulative pixel distribution graph is plotted according to the X-axis of the cropped leaf image as shown in Figure 8. The minimum value in the petiole region is determined as shown in equation (10)

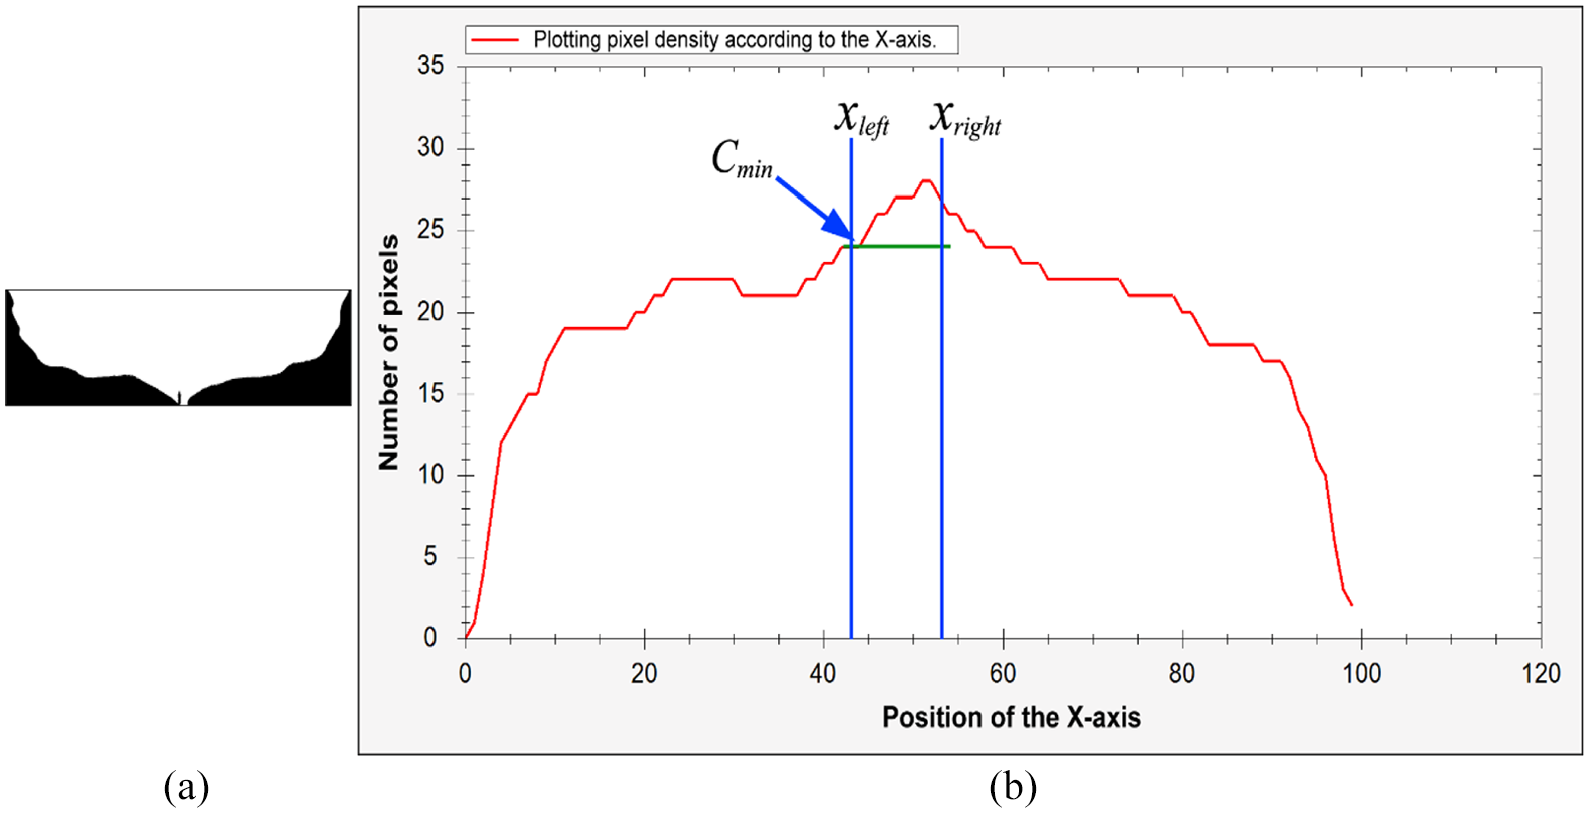
(a) Determination of the
Finally, in equation (11), the petiole boundary

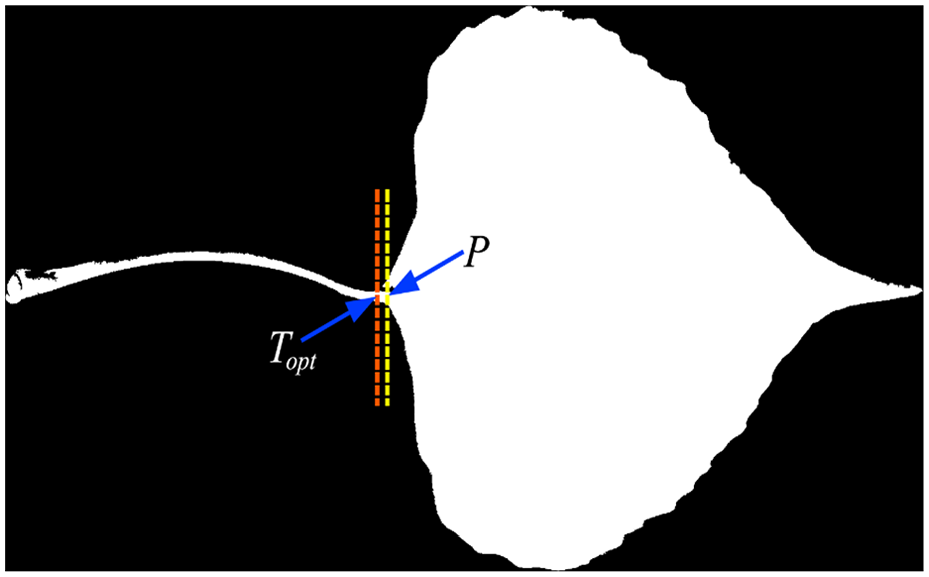
Determination of the petiole boundary.
Experimental results
Each of the leaf images used in the experimental studies has different sizes. In addition, due to its large size, it directly affects the runtime of the algorithm. Therefore, the width of each leaf image was determined to be 100 pixels. Accordingly, the scaled image height was calculated as shown in equation (12). Bicubic interpolation algorithm was used to scale the images. In the last step, images were converted to binary format again with Otsu thresholding algorithm
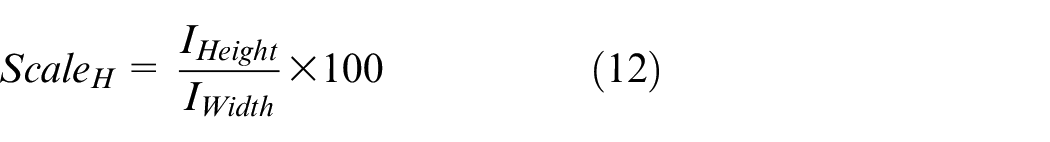
Table 1 shows the coordinates obtained from the proposed algorithm and the boundaries of the petiole region depending on the morphological characteristics of the leaf images.
Plant species in which the algorithm is successful.
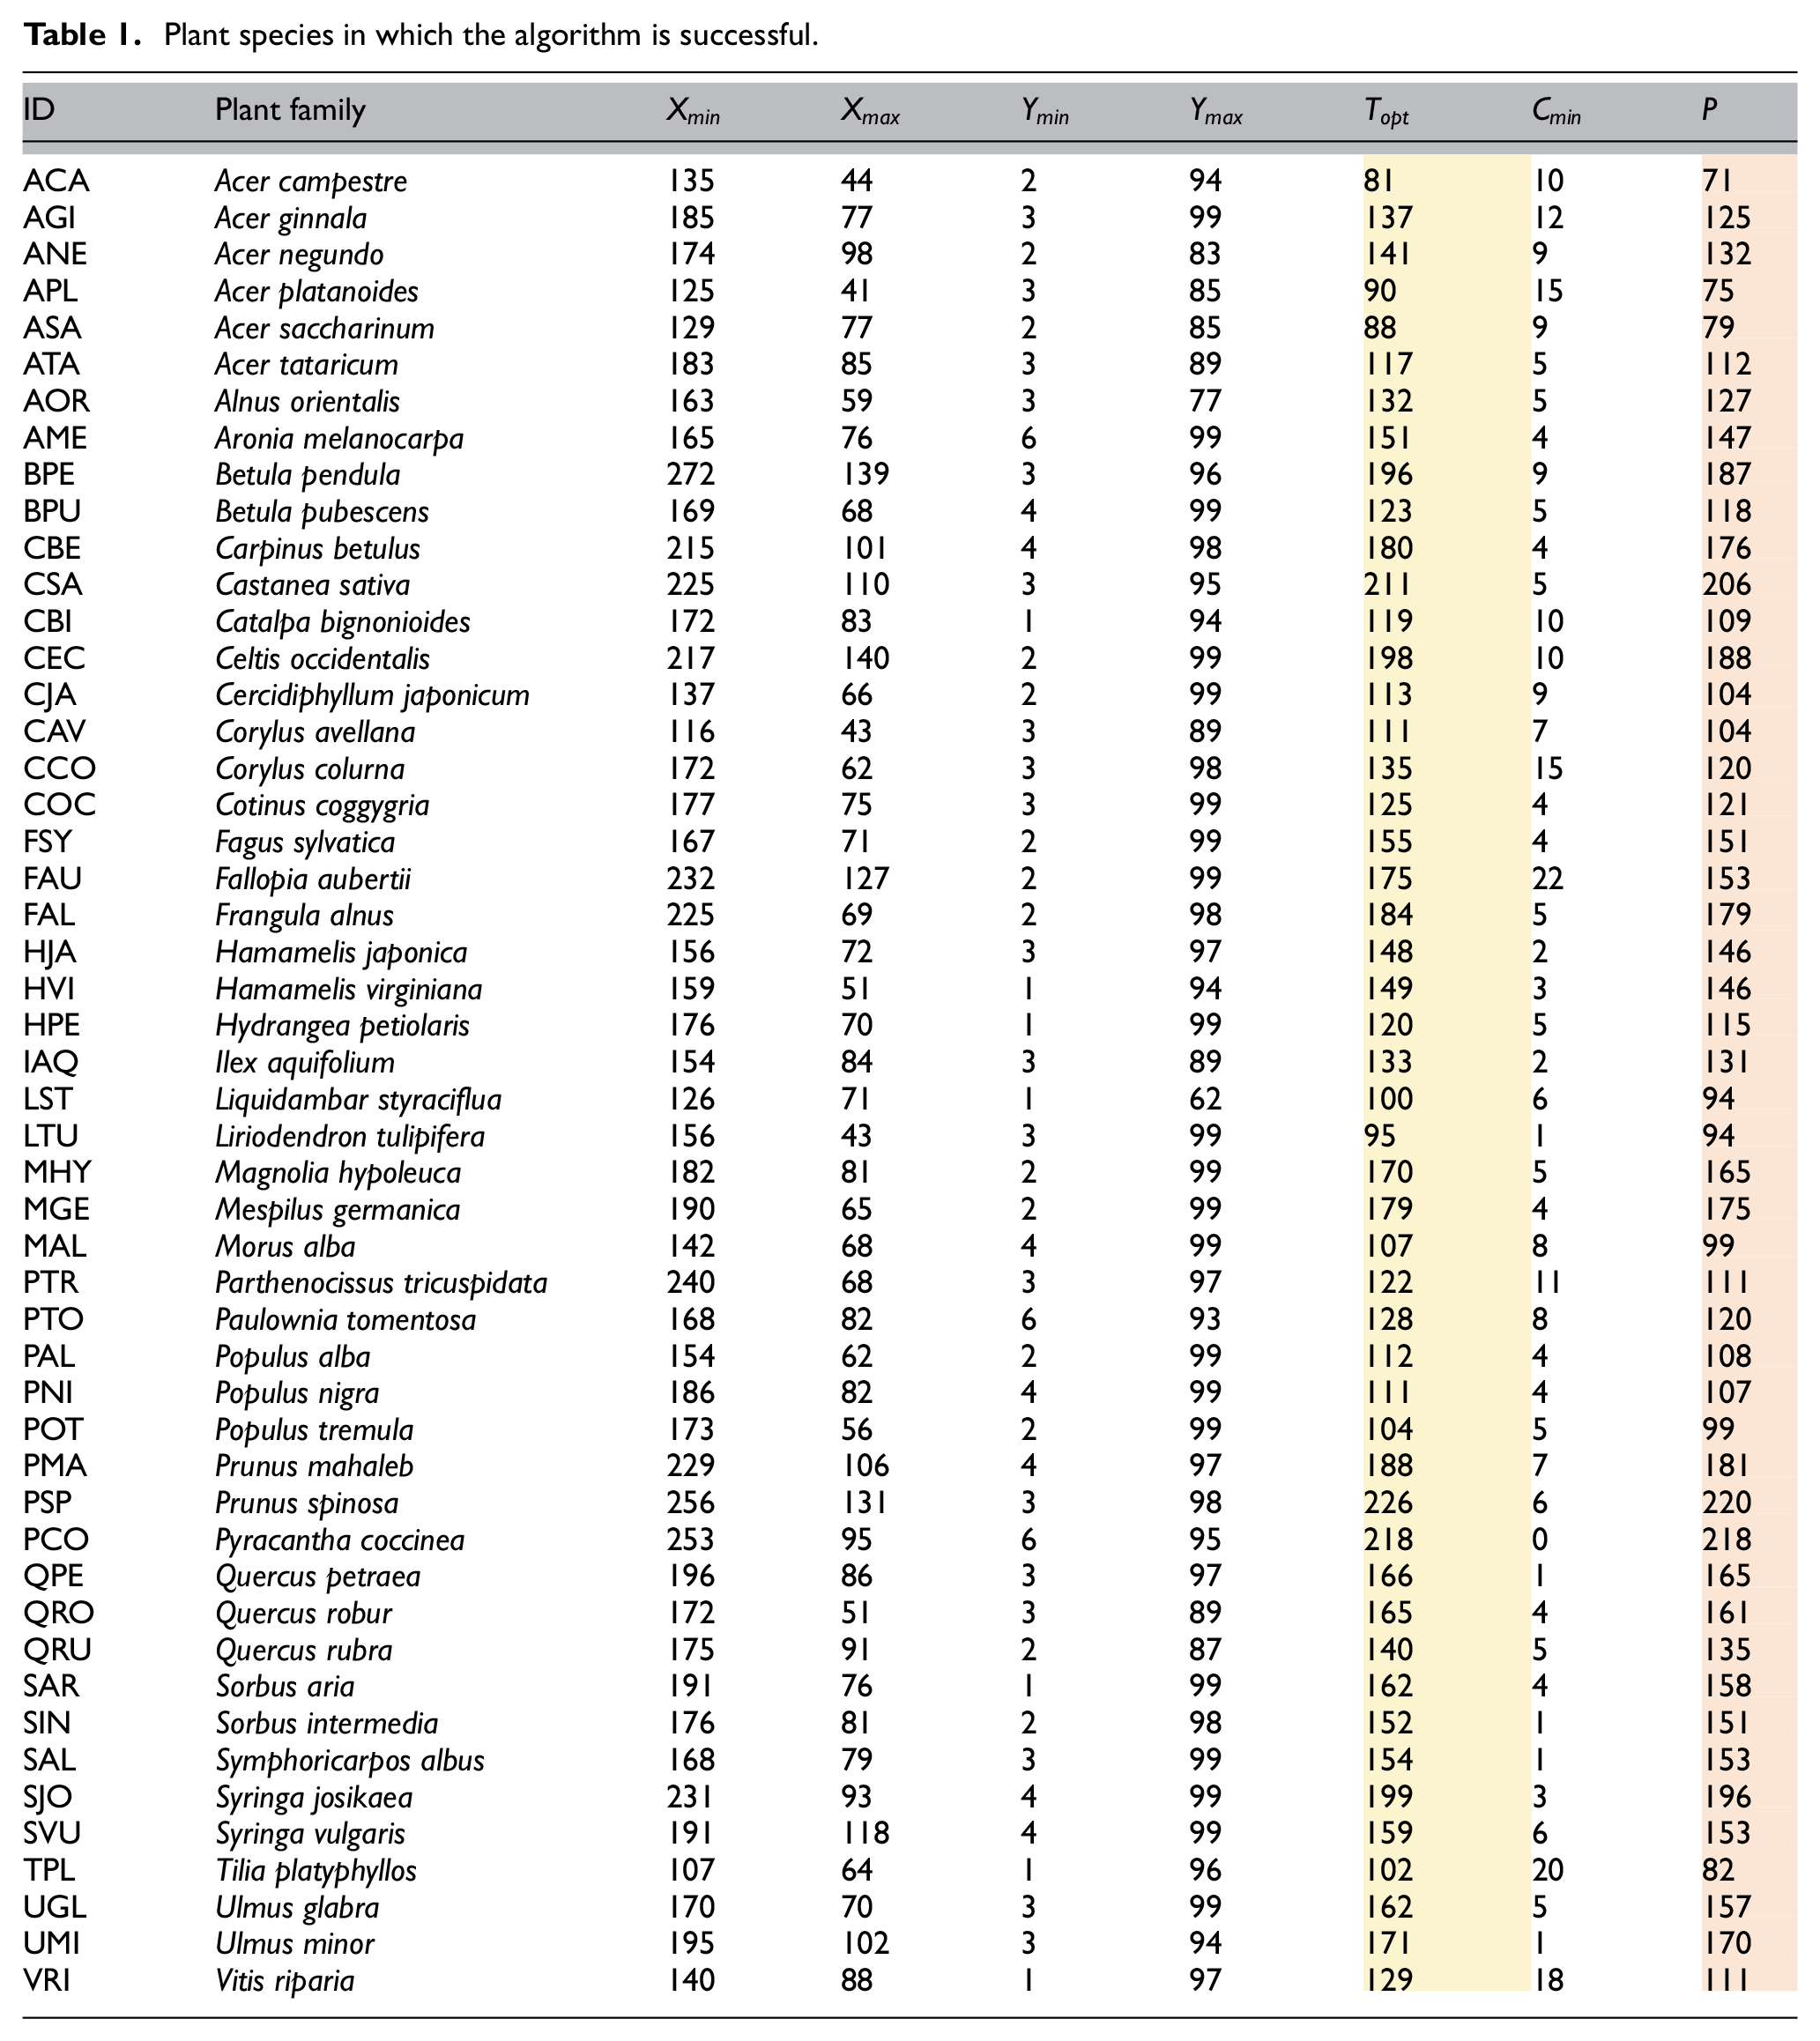
Examples of different plant families from leaf images in the dataset are shown in Figures 10 and 11. Each image is labeled according to the ID field in Table 1. The proposed algorithm determined the boundary of the petiole separating the leaf from the stem for each sample image. Accordingly, in the resulting images, the line drawn in red is the visualization of
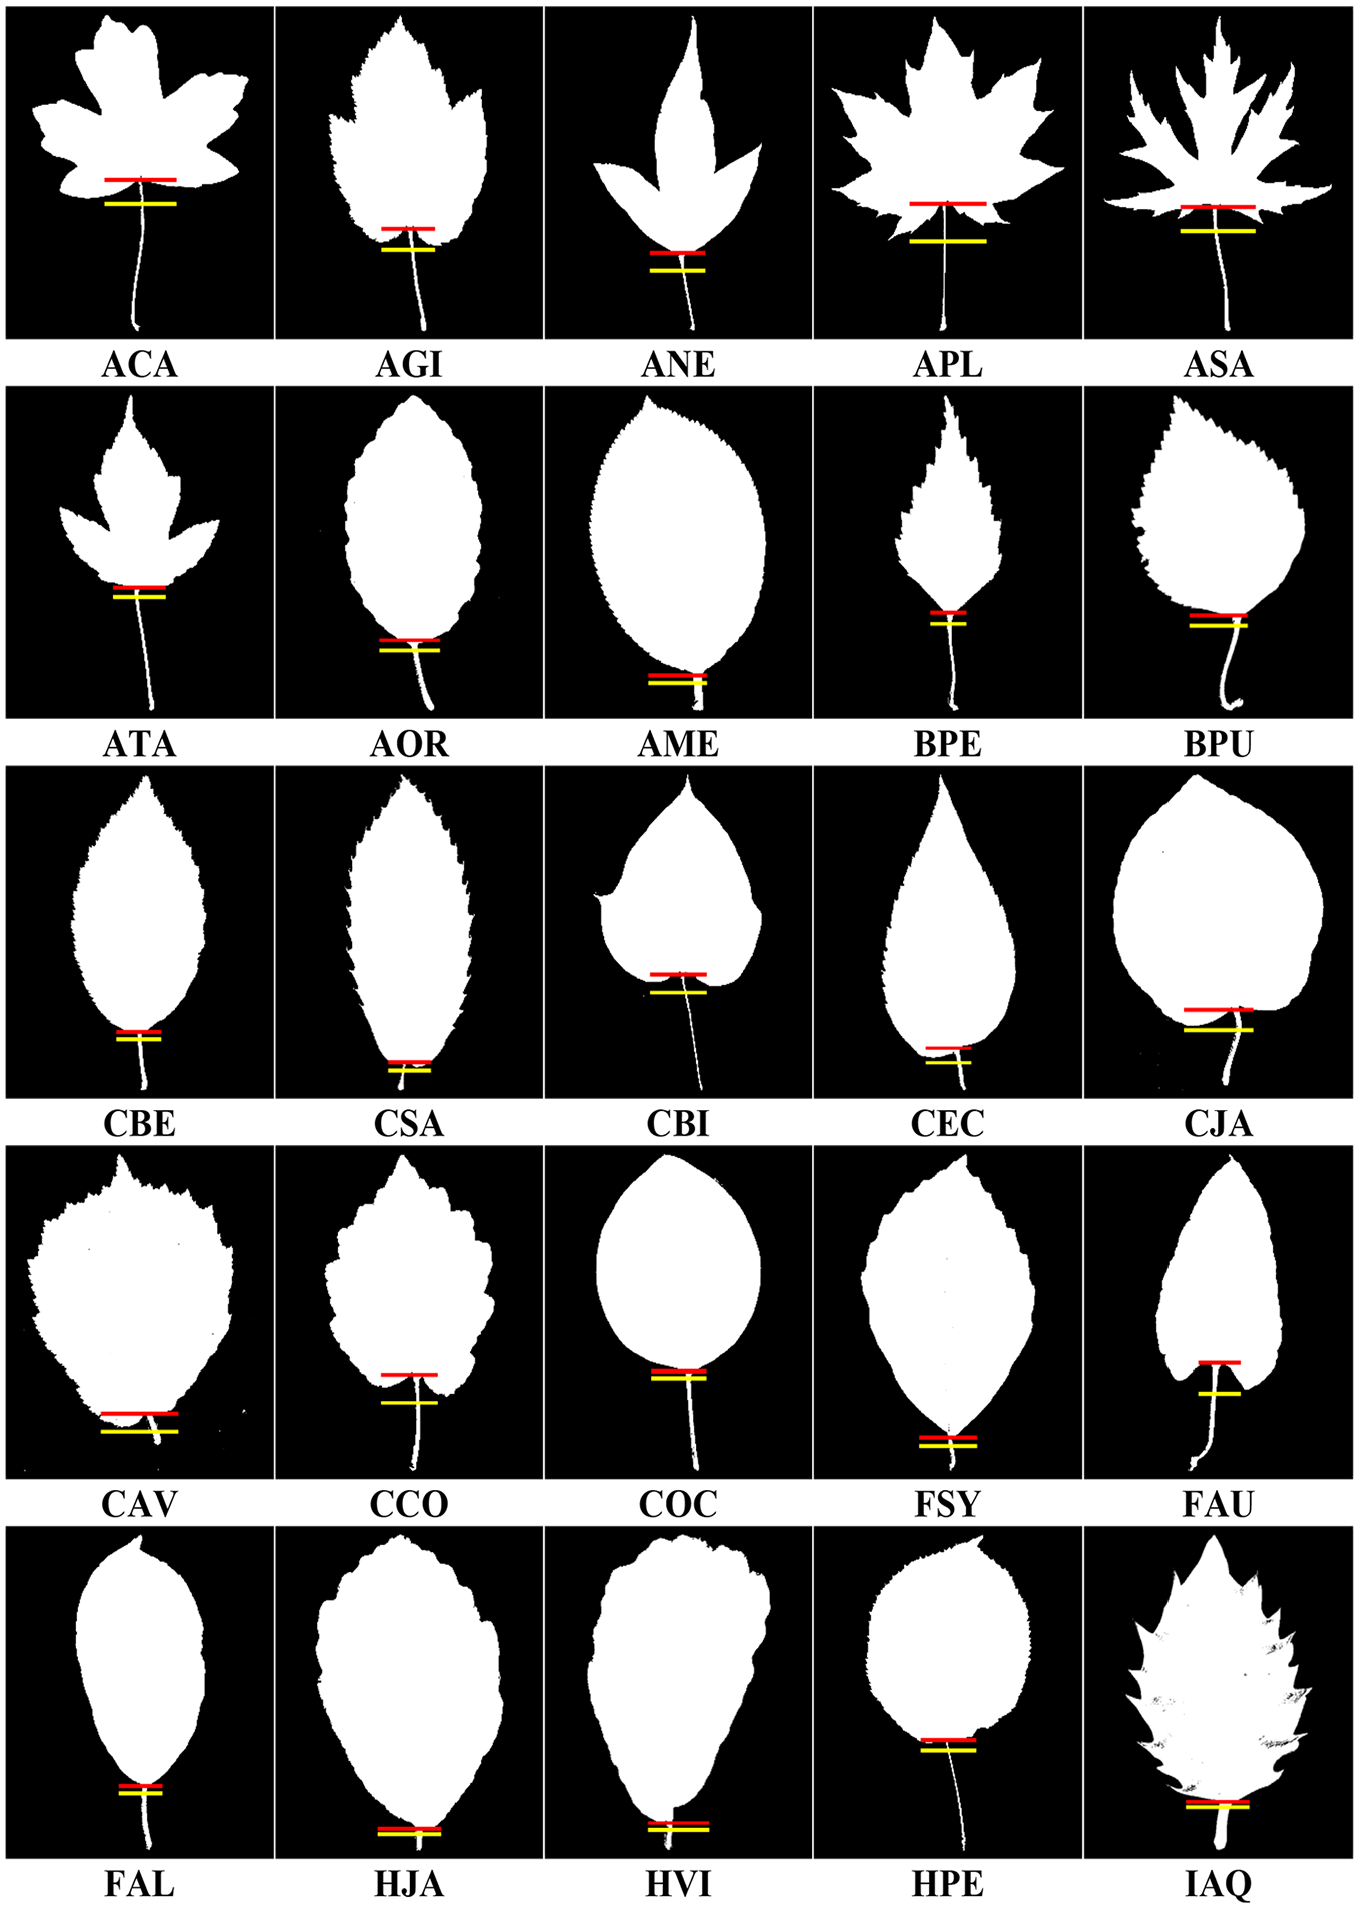
Determination of the boundaries of the petiole by the proposed method (part 1).
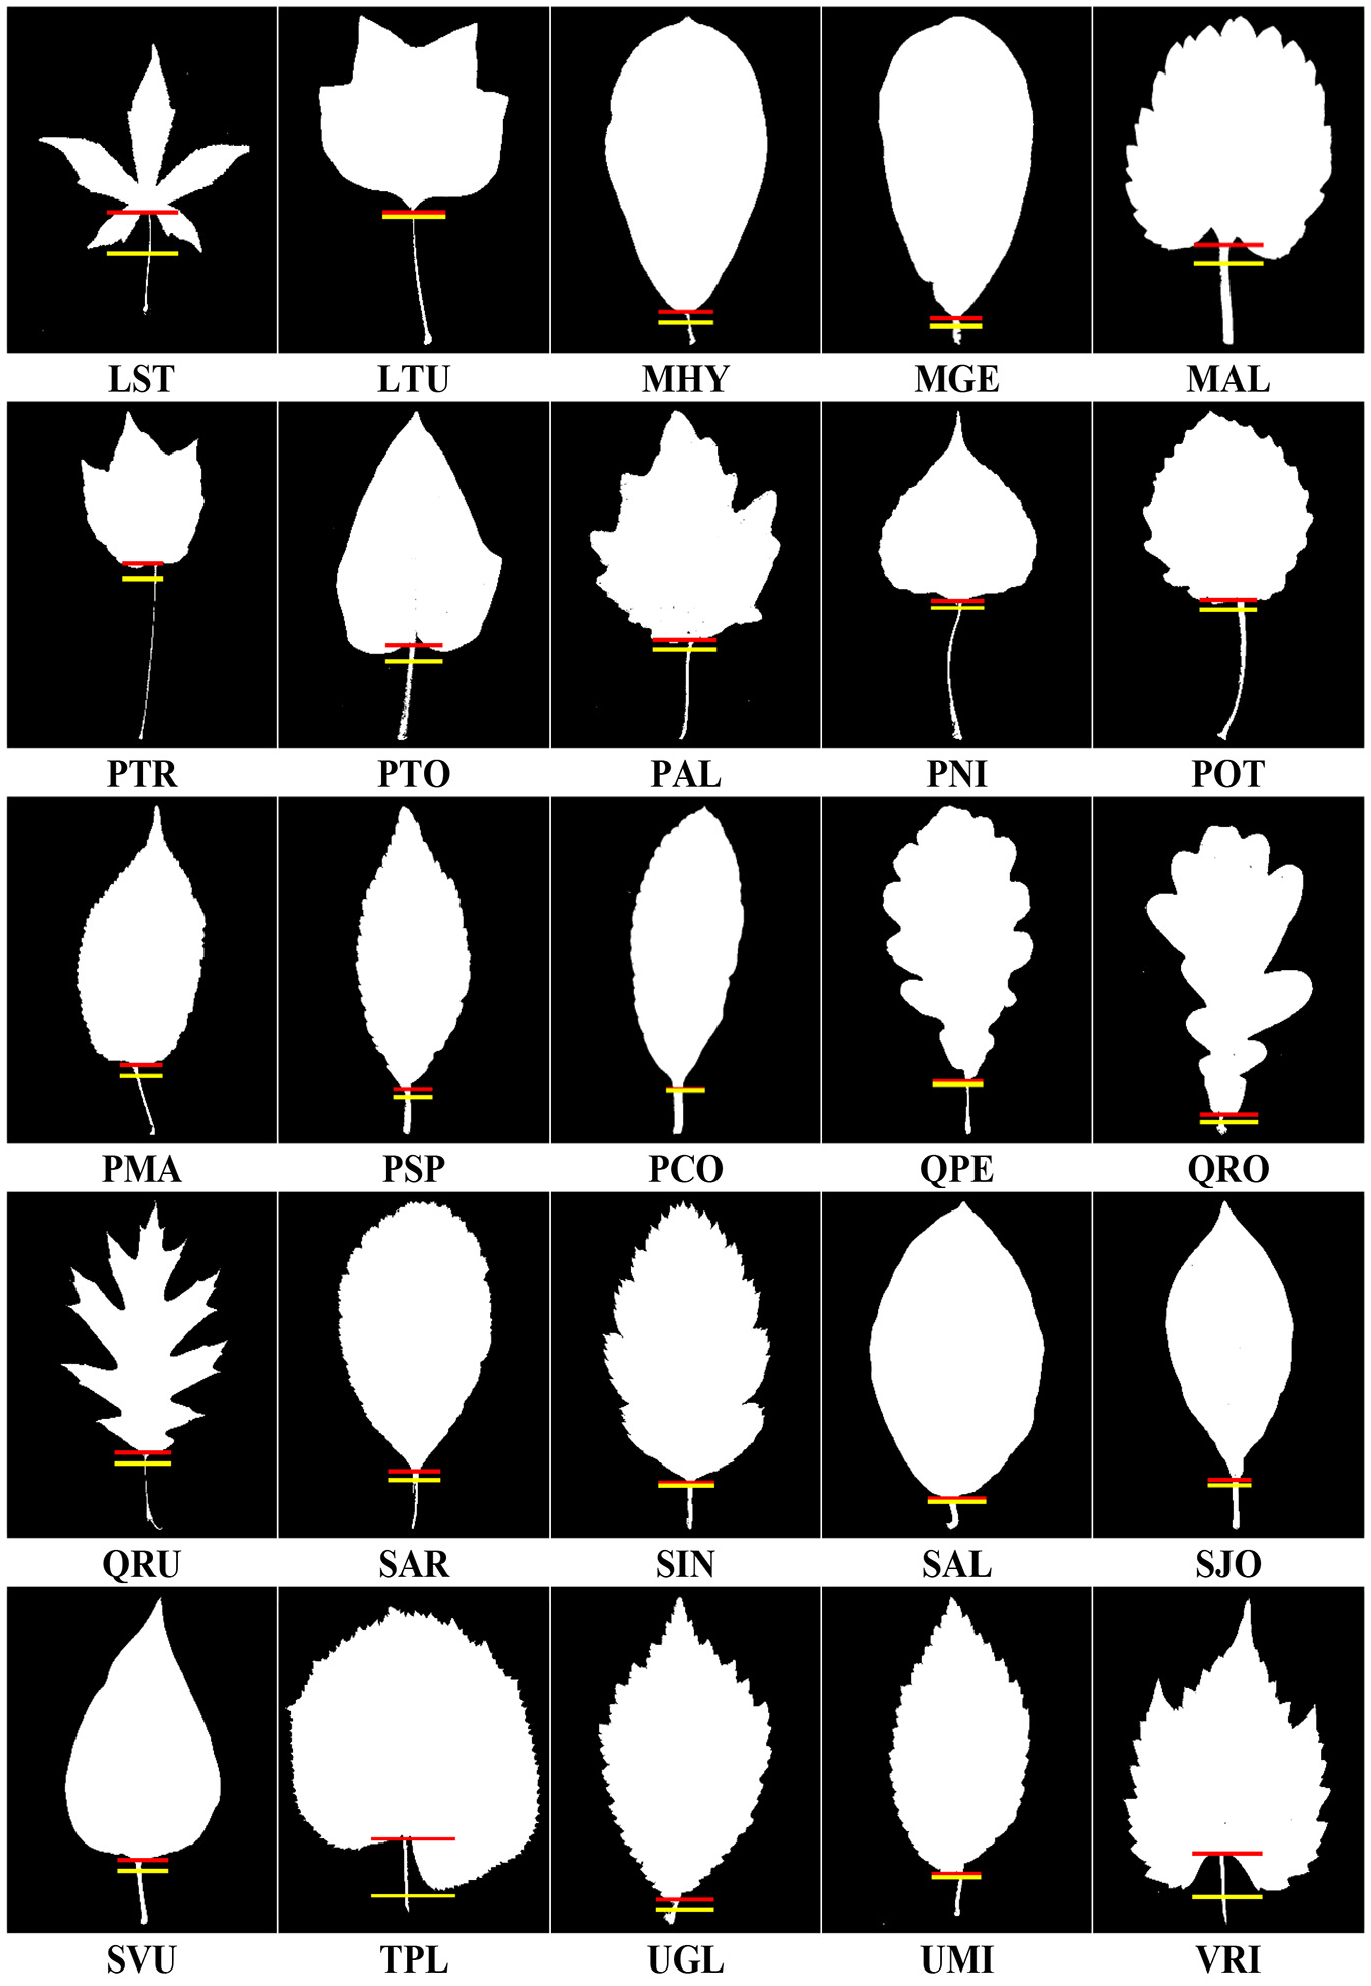
Determination of the boundaries of the petiole by the proposed method (part 2).
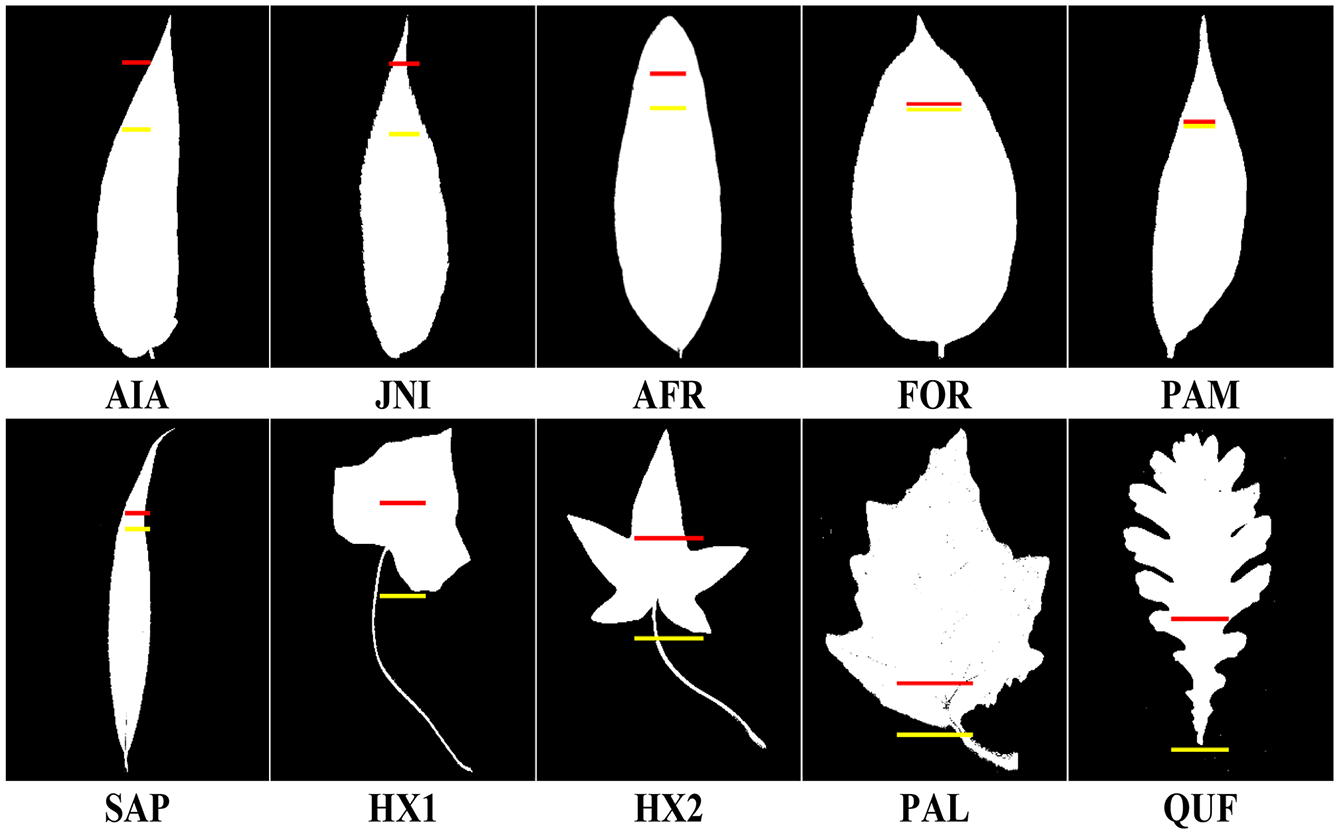
The proposed algorithm has achieved considerable success in automatic detection of the petiole region boundary in leaf images. However, the method has not achieved enough success in some images for some of the following reasons:
In cases where little of the petiole length;
In cases where apex is gradually tapering;
In cases where the petiole is both too short and the leaf tip gradually tapered;
In cases where the petiole is not sufficiently linear (e.g. in the form of an arc, twisted wire), the proposed method has not achieved enough success.
Table 2 shows the properties of leaf images for which the algorithm failed. The results obtained from the leaf images given in Table 2 are as shown in Figure 12, where the red line is the visualized state of
Cases where the algorithm fails.
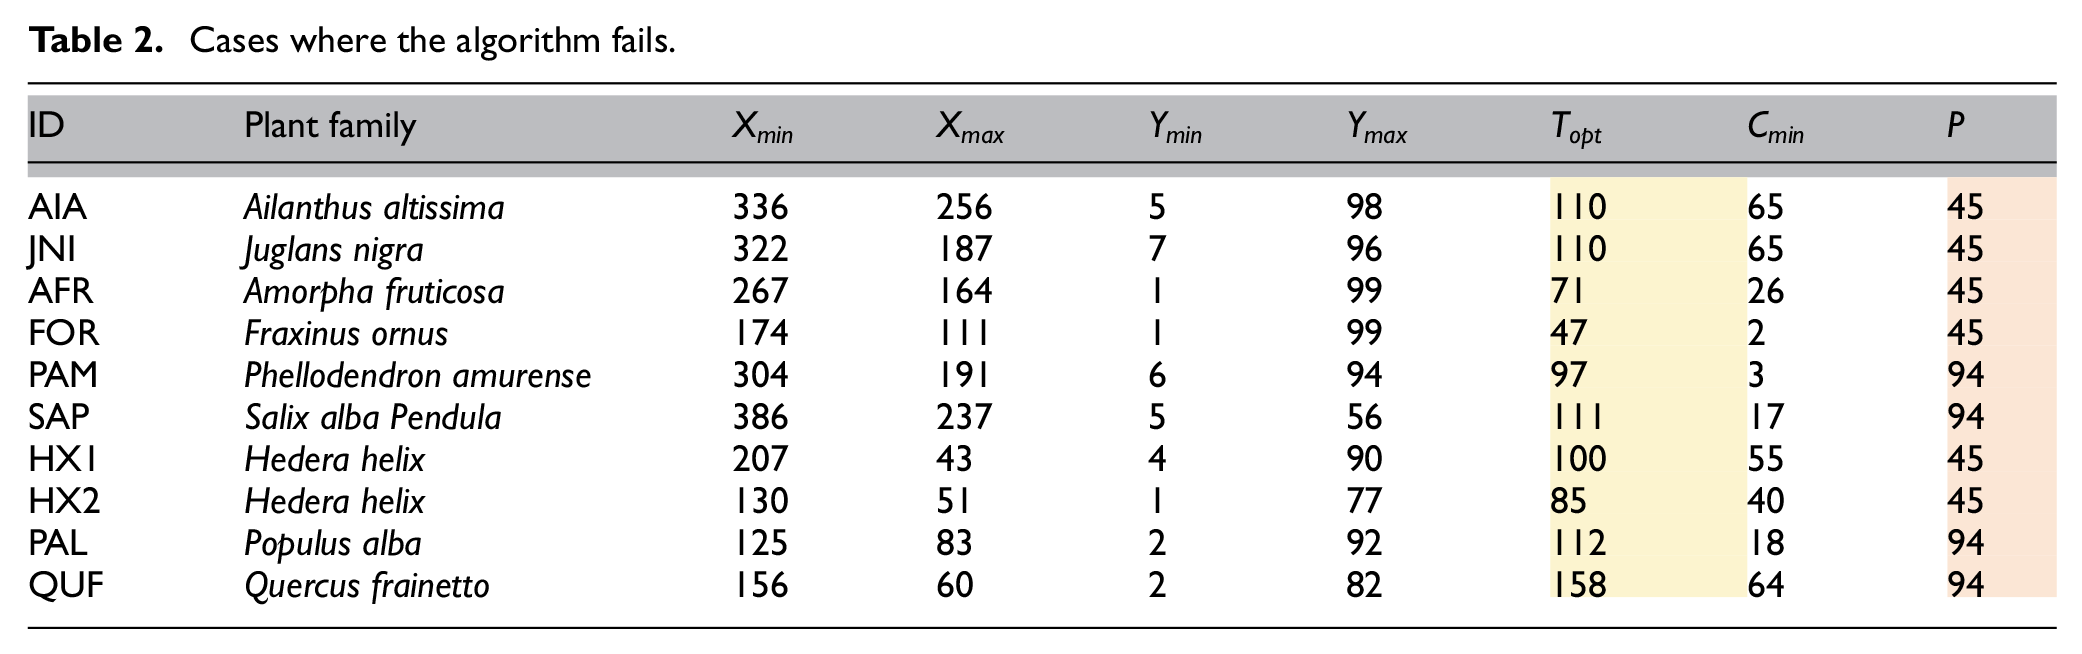
Cases where the algorithm fails.
The petiole region boundary in each leaf image used in the experimental studies was marked manually. Then, with the developed algorithm, the petiole region boundaries were determined automatically. After this, the error values (in pixels) in each leaf image were calculated according to the following methods. In this way, it is possible to analyze how far from the actual value the petiole limit value is calculated automatically with the proposed method.
Error measurement
The observational error is the difference between a measured quantity and its actual value and is also known as a “Measurement Error.” In the measurement of error values,


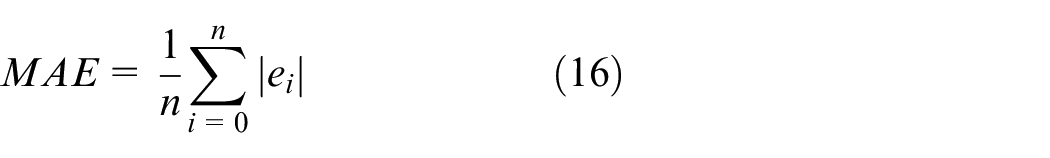
Mean absolute error
Mean absolute error (MAE) is a measure of the difference between two continuous variables. The MAE is the average vertical distance between the each actual value and the line that best matches the data. The MAE is also the average horizontal distance between each data point and the best matching line. The MAE is a linear score that measures the average magnitude of errors in a series of estimates, regardless of their direction, where all individual errors are weighted equally on average. The MAE value can range from 0 to ∞ and is given by
Root mean square error
A metric is the magnitude of the error that is often used to find the distance between the values calculated by an algorithm and its actual values. Root mean square error (RMSE) is the standard deviation of calculation errors. An RMSE value of zero means that the model has made no errors. RMSE is calculated according to equation (17)
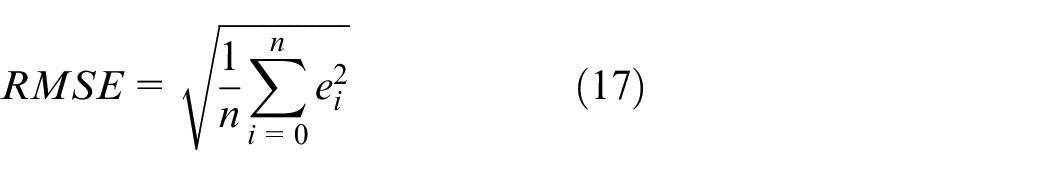
where e is the mean error and T is the number of data to be tested. The error values for calculating the petiole boundary regions in the image set of the algorithm are shown in Table 3. Accordingly, the proposed method can detect the petiole boundary region of different types of plant leaves with an error of less than ±5 pixels.
Error values in the calculation of the petiole boundary region by the proposed method.
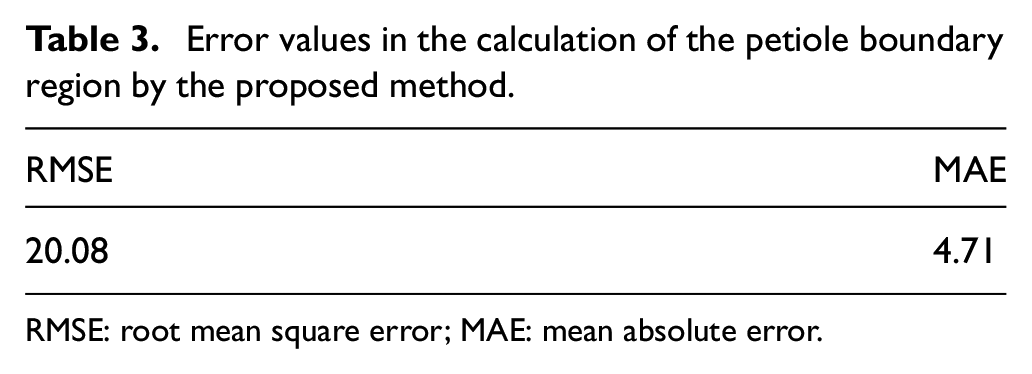
RMSE: root mean square error; MAE: mean absolute error.
Conclusion
In this study, a unique method was developed for automatic segmentation of petiole regions in woody plant leaves. This method optimally separates the leaf base and petiole boundary, considering the variety of leaf forms. In order to determine the petiole boundaries, geometric calculations were made by transforming leaf images into cumulative pixel graphs according to X- and Y-axis. Experimental studies of the proposed method were carried out with leaf images obtained from 90 different plant species that grow as both trees and shrubs in the Czech Republic. The results obtained are directly applicable for studies in plant science with high accuracy in petiole segmentation. In the literature, scientific studies on the complete segmentation of the petiole region in plant leaves are almost non-existent. Since the proposed method provides high segmentation success, it will provide an important parameter for the studies to be performed in this field (feature extraction for leaf classification, plant species recognition, etc.). MAE rates of the proposed method were calculated. As a result, the proposed method is able to detect the petiole boundary region in different types of plant leaves with an error of less than ±5 pixels.
Footnotes
Declaration of conflicting interests
The author(s) declared no potential conflicts of interest with respect to the research, authorship, and/or publication of this article.
Funding
The author(s) received no financial support for the research, authorship, and/or publication of this article.