
Abstract
In order to conduct a further in-depth exploration of the role of temperature-related parameters in the condition monitoring of wind turbines, this paper proposes a method to assess the condition of wind turbines by analyzing the supervisory control and data acquisition system temperature-related parameters based on existing research. A prediction model of time-sequence regression is established, based on the key temperature signals of WTs, so as to reflect their health condition in the form of prediction residuals. A kind of health index from the perspective of temperature-related parameters is developed by separating the statistics concerning the conformity of the predicted values of key temperature parameters within a certain time window from the measured values in order to clearly present the implied information on the health condition of wind turbines contained in the model prediction residuals. The case study shows that the trend of health index from the perspective of temperature-related parameters is consistent with the health condition of wind turbines. In some instances, its decline obviously occurs earlier than the maintenance provided to address the stoppage, suggesting that such indexes can effectively reflect some early health problems of the wind turbines to provide a reference for their scientific maintenance.
Keywords
Introduction
Wind power is one of the most promising renewable energy technologies for the future. 1 The condition monitoring of wind turbines (WTs) has received a significant amount of attention from those trying to optimize maintenance plans, reduce maintenance costs, and avoid malignant safety and production accidents. 2 The signals in WTs (e.g. vibration, acoustic emissions, stress, torque, temperature, and electrical parameters) reflect the condition of WTs to a certain extent. Hence, they could be used for the condition monitoring of WTs.3–5 Vibration signal-based WT condition-monitoring technology is the most widely discussed.6–8 The vibration characteristics of mechanical systems were investigated in Martini and Troncossi 9 and Escaler and Mebarki 10 The experimental modal analysis approaches of mechanical systems were discussed in Martini et al. 11 and Manzato et al. 12 Conclusions in Martini and Troncossi, 9 Escaler and Mebarki, 10 Martini et al., 11 and Manzato et al. 12 have reference value for vibration signal-based WT condition monitoring. Francisco et al. 13 proposed a different approach to evaluate the operating conditions of a scaled WT through vibration analysis. Dong et al. 14 carried out a comprehensive and systematic research on the vibration response characteristics and operational modal analysis of offshore WTs. Electrical signal-based WT condition monitoring is also explored. Gong 15 studied the rotor balance state using the state judgment method via current signals. Jin et al. 16 presented a novel framework for the quantitative evaluation of the faults and health conditions of WTs using generator current signals. The methods to monitor the condition of WTs can be largely divided into three types: those based on the statistics on parameter monitoring and the analysis of trend, 17 those based on failure modeling,18,19 and those based on normal behavior modeling,20–22 all having been the objects of profound researches of scholars. While the engineering application of the methods based on the statistics on parameter monitoring and the analysis of trend are tedious, the methods based on failure modeling are an extremely complex science; very few data are typically available for failure incidents and, generally speaking, the appearance and development of the failures vary greatly. 23 Therefore, the methods based on normal behavior modeling have drawn extensive attention in recent years.
A WT condition-monitoring system may rely on several types of datasets,24,25 as WTs in service are generally equipped with a supervisory control and data acquisition (SCADA) system. The condition-monitoring approach based on SCADA datasets is cost-efficient and readily available.26–28 The research and application of other important parameters, based on WT condition monitoring, for example, temperature-related parameters, are mainly dependent on SCADA data. Feng et al. 29 showed that the gearbox temperature rises when the gearbox efficiency decreases. Wilkinson et al. 30 studied different methods of SCADA data-based condition monitoring, one of which includes a comparison of the temperature trends of different turbines in a particular wind farm. The above two studies are based on statistical analysis of data, and some scholars also studied methods based on normal behavior modeling. On the basis of up to 14 months of SCADA data from 10 offshore WTs, Schlechtingen and Santos 31 developed a linear model to predict the target temperature with an accuracy of ±4 °C. The use of daily averages of the residual was demonstrated to be plausible for the purposes of fault detection. Sun et al. 32 presented a neural network-based model for WT anomaly identification. This model considers temperature-related parameters. Guo et al. 33 proposed a new condition-monitoring method using temperature trend analysis for a WT gearbox based on the nonlinear state estimate technique. In more recent studies, Rodríguez-López et al., 23 by conducting a residual analysis of the bearing temperature using a prediction model developed based on time delay neural network, realized the fault diagnosis and life evaluation of bearings on the nondrive end of a generator.
In general, it is inadequate to merely make a comparison with the research and application of WT condition monitoring based on vibration and electrical signal, temperature-related parameters. Among the existing studies on temperature-related parameters, those based on a regression model are more promising than those based on statistics alone. However, the existing regression model-based methods do not take into full consideration the thermal inertia of temperature changes, and the prediction accuracy needs to be improved. Moreover, different studies have shown that the accuracy of temperature regression models has a highly distinct variation.
In order to conduct a further in-depth exploration of the role of temperature-related parameters in the condition monitoring of WTs and a better analysis and utilization of SCADA data, this paper proposes a method to assess the condition of WTs by analyzing the SCADA system temperature-related parameters based on existing research. Using the framework of the nonlinear autoregressive with exogenous inputs (NARX) neural network, this work establishes a predictive time-sequence regression model, based on the key temperature signals of WT. The vague information on the condition of WT contained in the individual variation prediction residuals is clearly presented through the health index from the perspective of the temperature-related parameters (HIPT) established in this paper. The monitoring data from two WTs, generated in 3 years, are used to verify the effectiveness of the proposed method. An instance analysis shows that the trend of HIPTs is consistent with the condition of the WTs. It is also quite adaptable to the normal switching of the working conditions of WTs, and more importantly, it could effectively reveal some early health problems of WTs, providing a reference for the scientific maintenance of WTs.
The remaining of this paper is organized as follows. Section “Structure and fault analysis of permanent magnet direct-driven WTs” provides a brief analysis of the working principle of permanent magnet direct-driven WTs and a discussion of the relationship between common faults and temperature parameters. Section “NARX-based modeling of temperature parameter prediction” introduces the structure, variables, choice of parameters, training, and verification for temperature parameter prediction. Section “Prediction residual analysis to assess the health condition of the WT,” based on the analysis of the prediction residual characteristics of the model, proposes a method to develop HIPT. Section “Implementation of the proposed method” presents the entire process of the proposed method. Section “Results and discussion” is devoted to the analysis and discussion of the results of the proposed method applied to the instances. Finally, this paper is concluded in section “Conclusion.”
Structure and fault analysis of permanent magnet direct-driven WTs
WTs are generally divided into horizontal-axis WTs and vertical-axis WTs, 34 of which the horizontal-axis type, the market mainstream type, is further divided into several common models, such as the fixed-pitch stall control WTs, doubly fed asynchronous WTs, and permanent magnet direct-driven WTs. At present, the doubly fed asynchronous WTs are the most widely used. The elimination of the gearbox from permanent magnet direct-driven WTs is removal of a weak part in the structure. In recent years, thanks to the development of permanent magnet materials and the improvement of power electronics technology, direct-driven permanent magnet synchronous WTs have been further developed and may become the future mainstream model. The study object of this paper is a permanent magnet direct-driven WT.
Figure 1 shows the overall structure of a permanent magnet direct-driven WT, which mainly consists of a rotor system, nacelle, tower, power generation system, yaw system, pitch system, and other components and subsystems. The rotor system includes blades and a hub, which are important for the energy conversion of a WT; the nacelle is composed of a nacelle cover, spinner, and chassis, and it is a core component in the WT supporting system; the yaw system, consisting of a yaw bearing, yaw drive, yaw brake, and so on, will quickly and smoothly align the generator system with the wind direction to give the rotor the maximum wind energy when the direction, a vector of the wind speed, changes; and the variable pitch system controls the blades to rotate around their mounting axis, and by changing the pitch angle of the blades, it changes the aerodynamic characteristics of the WT. 34
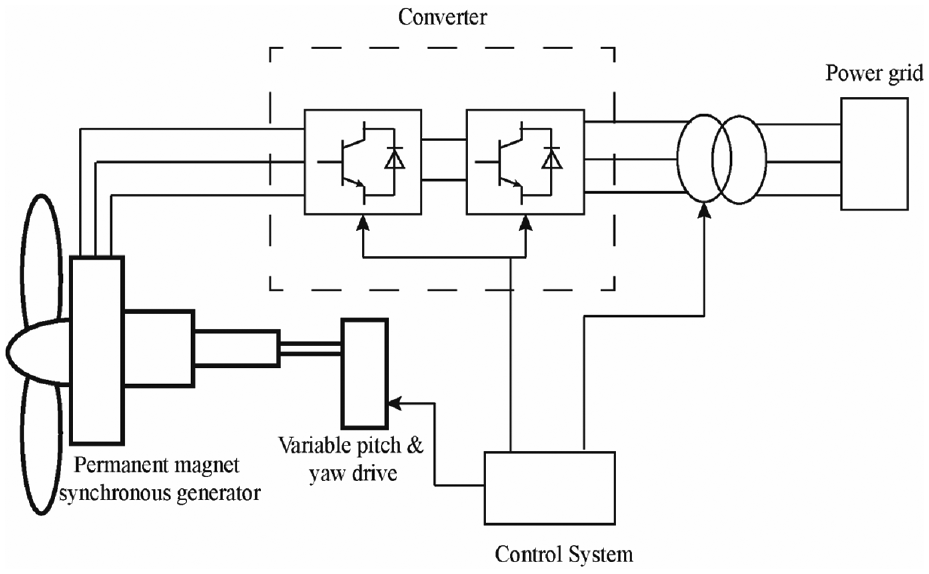
Schematic of the principle of permanent magnet direct-driven WTs.
WTs are prone to failures, as they are generally located at a height of tens of meters or even hundreds of meters and work in a harsh and complicated environment.35,36 Statistics show that the subsystems with high failure rates in WTs are the electrical system, rotor blades, pitch system, hydraulic system, control system, and transmission system. Common failures of the mechanical body of WT include rotor system imbalance, poor lubrication, wear and corrosion, and so on,37–39 which will be indicated as abnormal signals of the temperature of key components. In addition, the temperature signals are related to the working conditions of WTs. Some failures of electrical, hydraulic, and other systems do not necessarily result in an abnormality of the temperature signal itself. Instead, they might lead to a relationship between the working conditions of WTs and the temperature signal abnormality. Therefore, it is feasible to assess the condition of WTs by analyzing temperature-related parameters.
NARX-based modeling of temperature parameter prediction
The relevant factors influencing the temperature signals of WTs are roughly divided into three categories: (1) external environment: ambient temperature, wind speed, humidity, atmospheric pressure, and so on; (2) operating condition: WT output power, rotor speed, pitch status, yawing status, and so on; and (3) health condition: the dynamic balance condition of the WT rotor system, lubrication condition of the mechanical body, wear and corrosion, yaw system and pitch system performance, and so on. Among these factors, the first and second categories can be directly monitored, and some parameters thereunder have been incorporated into the SCADA system. Based on the historical temperature signals, the current and historical external environment, and the operating condition of the WT, the temperature parameter prediction model, discussed in this section, predicts the current temperature signals and shows the health condition of the WT in the form of prediction residuals of the model.
The NARX neural network is a forward network with feedback and can be seen as a back propagation (BP) neural network with a time-delay input and a delay feedback connection between the output and input.40–42 In general, NARX converges faster and has a better generalization ability than other recurrent networks, which is related to the fact that it can keep information two to three times longer than the standard recurrent neural networks.42,43 Hence, this study chose the NARX neural network framework to build the temperature parameter prediction model.
The SCADA data used in the study are derived from the 2 MW permanent magnet direct-driven WTs, located in a mountainous wind farm in Southern China. The WT has a diameter of 96 m, a cut-in wind speed of 3 m/s, a rated wind speed of 11 m/s, and a rotor speed of 6–17 r/min. The SCADA system records 10 min averages of 1 Hz sampled WT condition and external environment parameters, including the wind speed, rotational speed, voltage, current, power, and temperature. This study used a total of 3 years (from 1 January 2013 to 31 December 2015) of SCADA data from two WTs (WT No. 1 and WT No. 2), since the wind farm was in stable service.
NARX neural network
The NARX neural network relies on neurons, as the basic processing unit, where the relationship between the input and output is
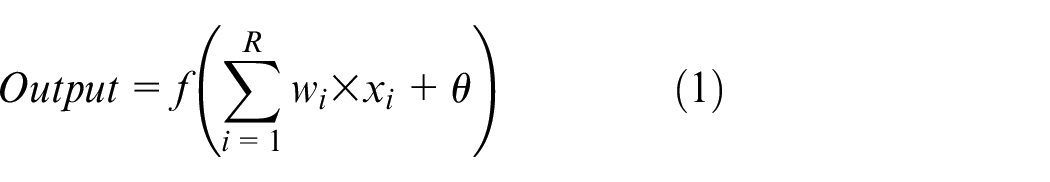
where
The NARX neural network is a forward network with feedback and can be seen as a BP neural network with a time-delay input and a delay feedback connection between the output and input. The NARX model is defined as follows

where


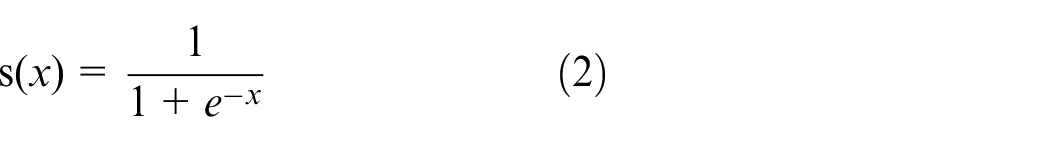
A typical NARX neural network consists of an input layer, a hidden layer, and an output layer, as shown in Figure 2. The training process of the NARX neural network is based on error backpropagation. The error function of the network for a single sample is defined as
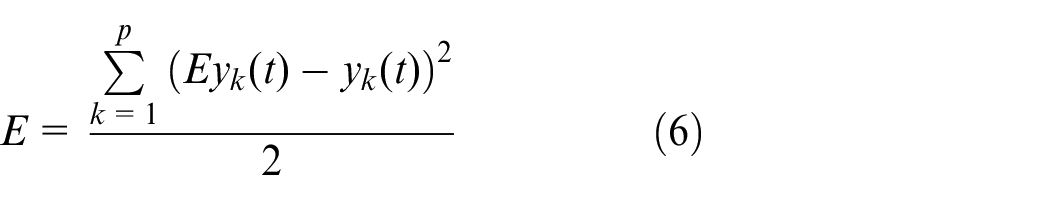
where

Typical structure of the NARX neural network.
Choice of variables
It can be deduced from the working principle of permanent magnet direct-driven WT that the main bearing temperature, the nacelle temperature, and the hub temperature, which are closely related to the dynamic balance of the rotor system, the lubrication of the mechanical body, the wear and corrosion of the components, the performance of the yaw system and pitch system, and so on, are key temperature parameters. In this paper, the above three parameters are selected, from the 19 temperature signals monitored in the SCADA system, as autoregressive prediction variables. The temperature parameters that are not used include the nacelle control temperature, the inverter temperature, and so on, which seem to reflect local problems and these problems are easier to be addressed through simpler methods such as statistical comparison.
The SCADA system monitoring data, generated in the first year after the WT No. 1 of the target wind farm was put into stable operation, are taken as examples (other WTs at the wind farm follow a similar pattern). The relationship between the key temperature parameters and the parameters of the main external environment incorporated into the SCADA system and the device operating condition is shown in Figure 3. It can be seen, from Figure 3(a)–(c), that the ambient temperature has a very obvious influence on the three key temperature parameters, the linearity of which shows a tendency to increase as the ambient temperature climbs. However, at the same temperature, the main bearing temperature is more dispersed than the other two temperature parameters, indicating that factors other than the ambient temperature have a more significant effect on the main bearing temperature. It can be seen, from Figure 3(d)–(f), that the three temperature parameters are more evenly distributed in the low-wind-speed range, while in the high-wind-speed range, they are more concentrated in the high-temperature range. This is because, in the low-wind-speed range, where the WT is idle or in an underpower condition, the temperature parameters are mainly under the influence of the ambient temperature, whereas in the high-wind-speed range, where the WT is in full-power operation, the temperature parameters are under the significant influence of the wind speed, in particular, in the high-wind-speed range, the main bearing, as a rotating member, shows an obvious tendency toward temperature rise. In addition to the apparent laws, mentioned above, the increase in the wind speed will also change the cooling mode and heat dissipation speed of the WT. It can be seen, from Figure 3(g)–(l), that the active power and rotor speed have an influence on the key temperature parameters, such as the wind speed, because the two have a strong correlation with the wind speed. It can be noted, from Figure 3(m)–(o), that when the pitch angle is close to 0 degrees (the WT is in the running condition), the temperature parameters are concentrated in the high-temperature range, while they are relatively evenly distributed when the pitch angle has other values (the WT is in the pitch regulation process or stop status). In addition, from the perspective of physical mechanism analysis, the three pitch systems for the blades constitute a mutually independent servo control system. Therefore, the synergistic performance among the systems would also affect the temperature parameters.
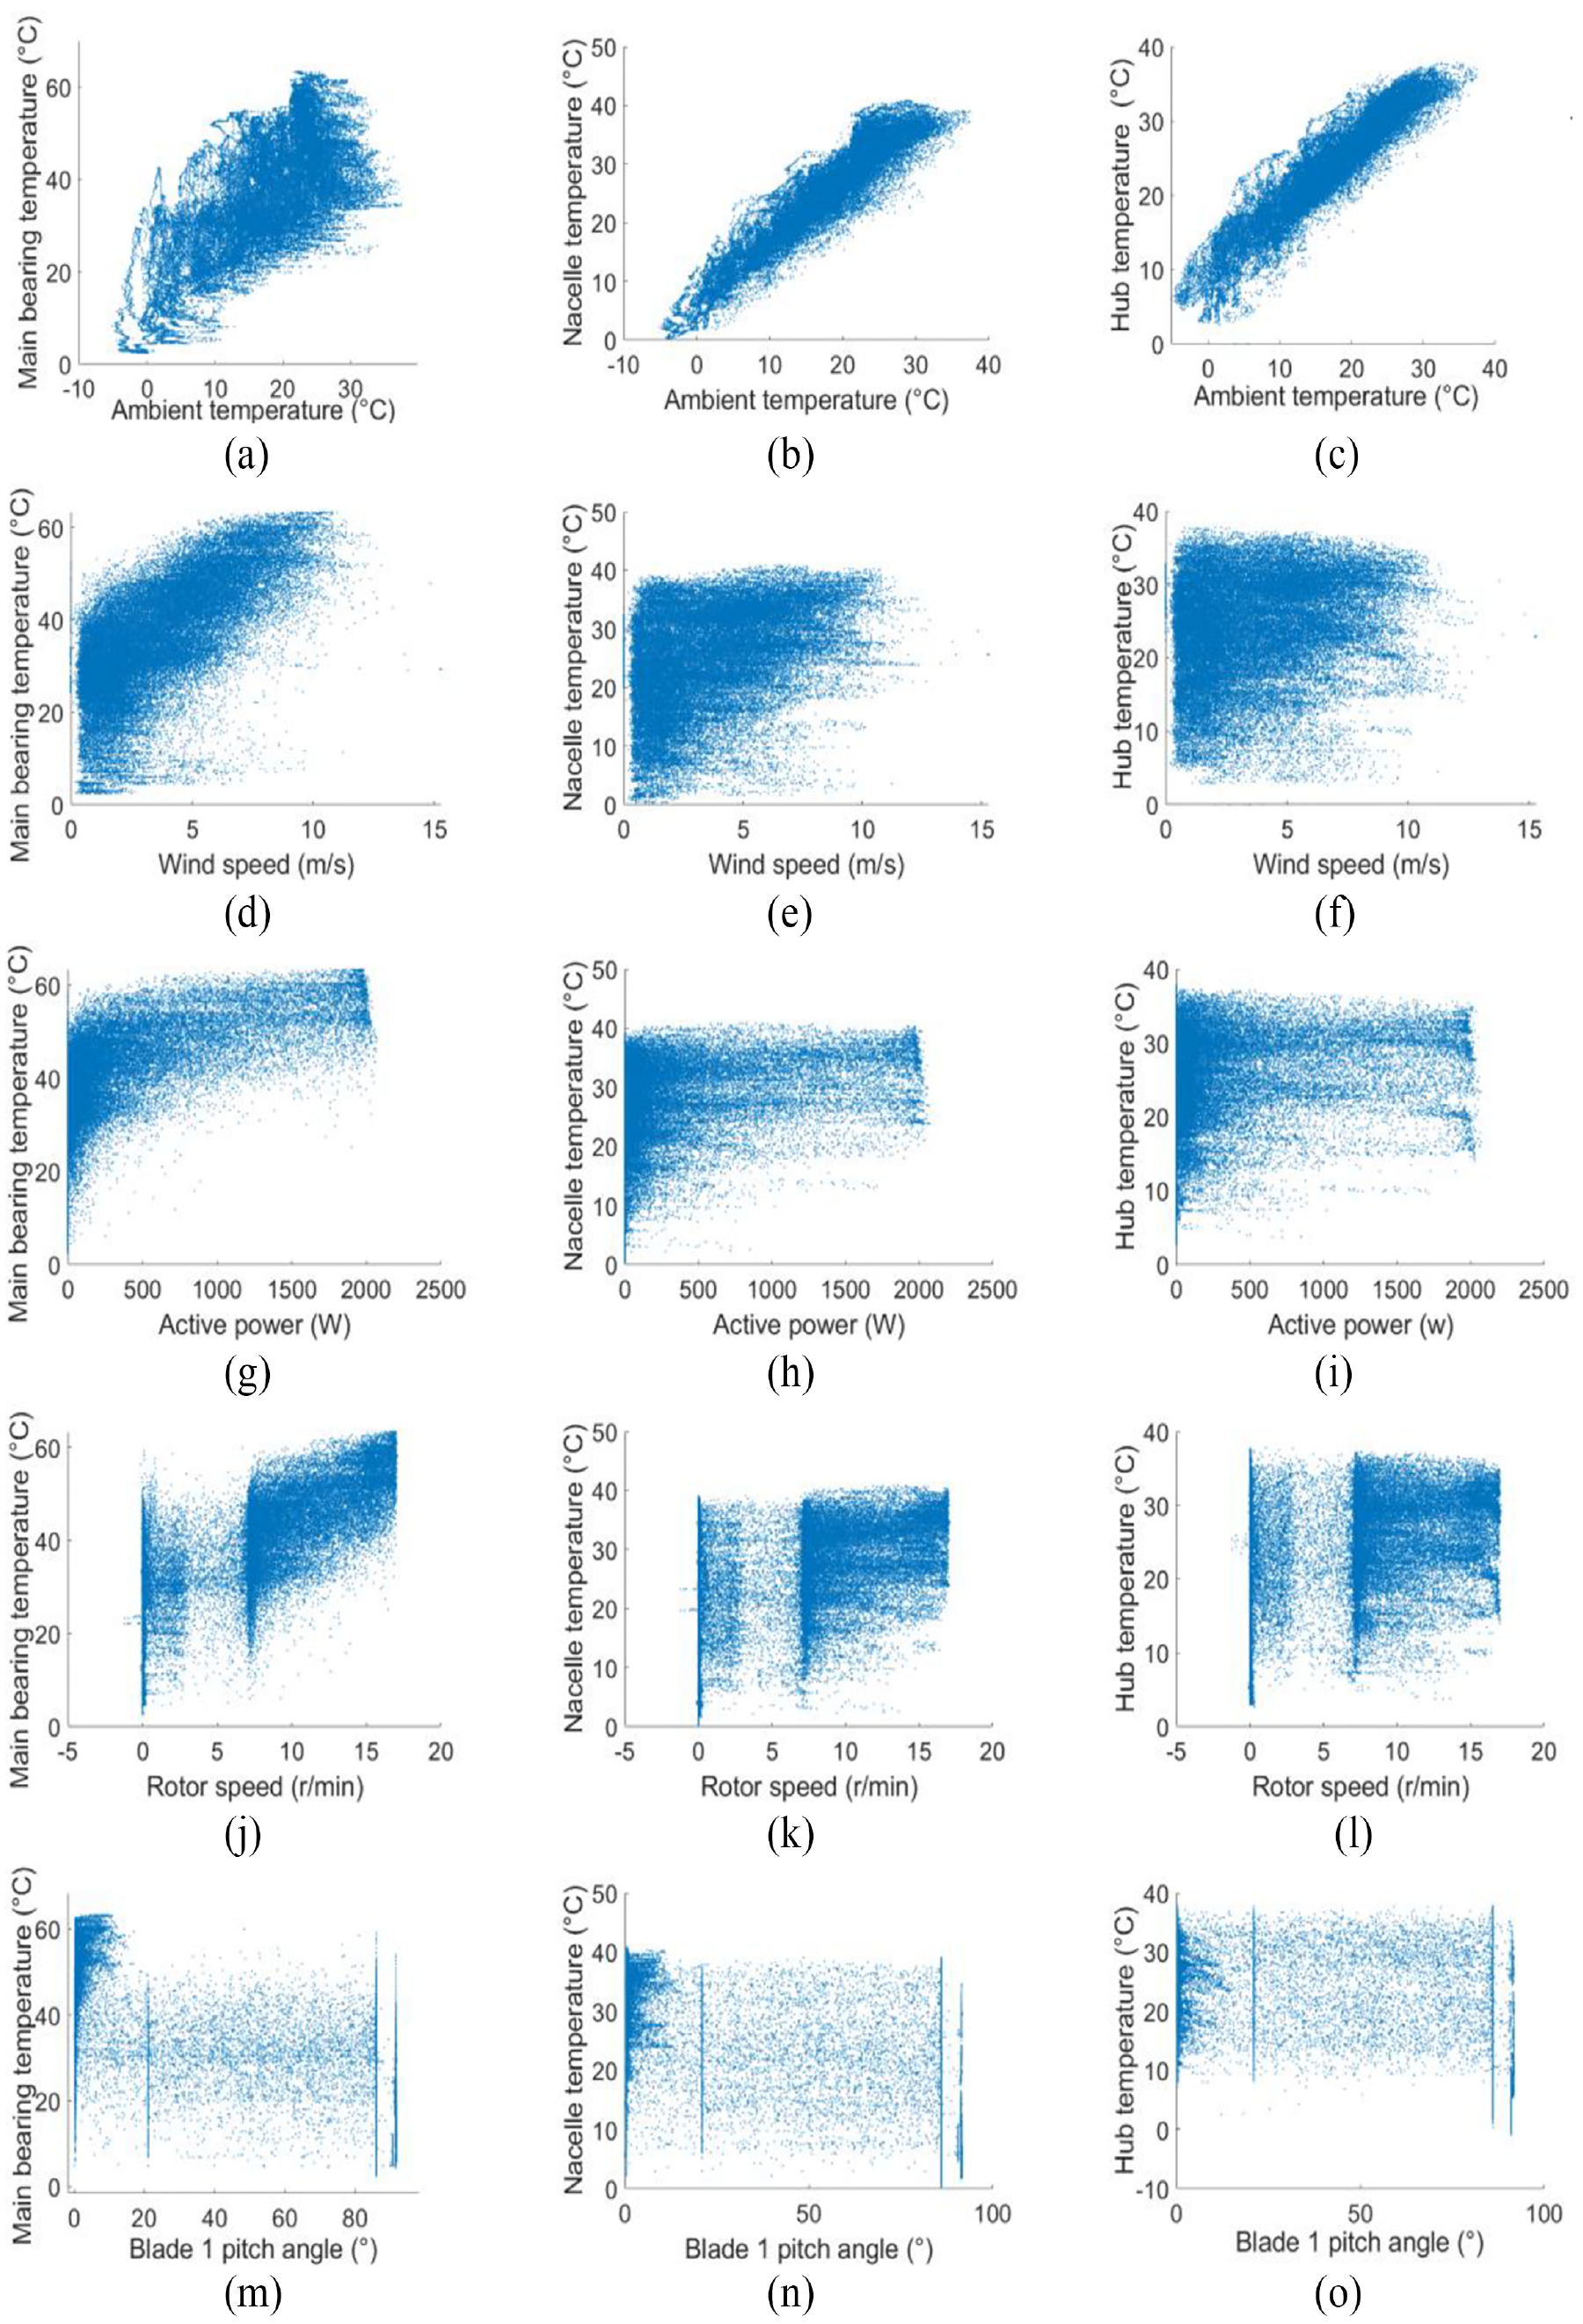
Analysis of the relationships between key temperature parameters and other parameters: (a) ambient temperature and main bearing temperature, (b) ambient temperature and nacelle temperature, (c) ambient temperature and hub temperature, (d) wind speed and main bearing temperature, (e) wind speed and nacelle temperature, (f) wind speed and hub temperature, (g) active power and main bearing temperature, (h) active power and nacelle temperature, (i) active power and hub temperature, (j) rotor speed and main bearing temperature, (k) rotor speed and nacelle temperature, (l) rotor speed and hub temperature, (m) blade 1 pitch angle and main bearing temperature, (n) blade 1 pitch angle and nacelle temperature, and (o) blade 1 pitch angle and hub temperature.
In summary, the ambient temperature is the most important external environment factor for each key temperature parameter. The wind speed, active power, rotor speed, and pitch angle have a visible influence on the key temperature parameters; they are all related to the working status of the device to a certain extent. According to the physical mechanism of the temperature change, the wind speed and pitch angle also include other relatively independent factors that contribute to the temperature changes. However, the synergistic performance among the three pitch systems for the blades is part of the health condition of the WT, which is expected to be reflected in the form of model prediction residuals herein and can thus be ignored during the modeling process. With a view to simplifying the model structure and putting the redundant information among the input variables into an appropriate range, the external input variables determined in this paper for the model include the ambient temperature, wind speed, active power, and rotor speed.
Structure design of the prediction model
With the NARX neural network, it is possible to establish multiple separate single-output temperature prediction models, with each key temperature parameter as an output value, or a multioutput prediction model, with the prediction values of multiple key temperature parameters as outputs. As described in the analysis of section “Choice of variables,” the ambient temperature, wind speed, active power, and rotor speed have obvious influences on each of the three key temperature parameters. In other words, the factors of the main external environment and device operating condition, which influence the key temperature parameters, are the same. Moreover, it is inferable, from Figure 4(a) and (b), that there is also a significant correlation among the key temperature parameters. An improvement to the prediction accuracy can be expected, as the establishment of a multi-input and multioutput prediction model, based on the NARX neural network, not only reduces the number of models but also incorporates the correlation among the key temperature parameters into the prediction basis. Therefore, the prediction model designed in this paper is a multi-input and multioutput prediction model of the NARX neural network, where the main bearing temperature, nacelle temperature, and hub temperature are the autoregressive prediction variables and the ambient temperature, wind speed, active power, and rotor speed are the external input variables.
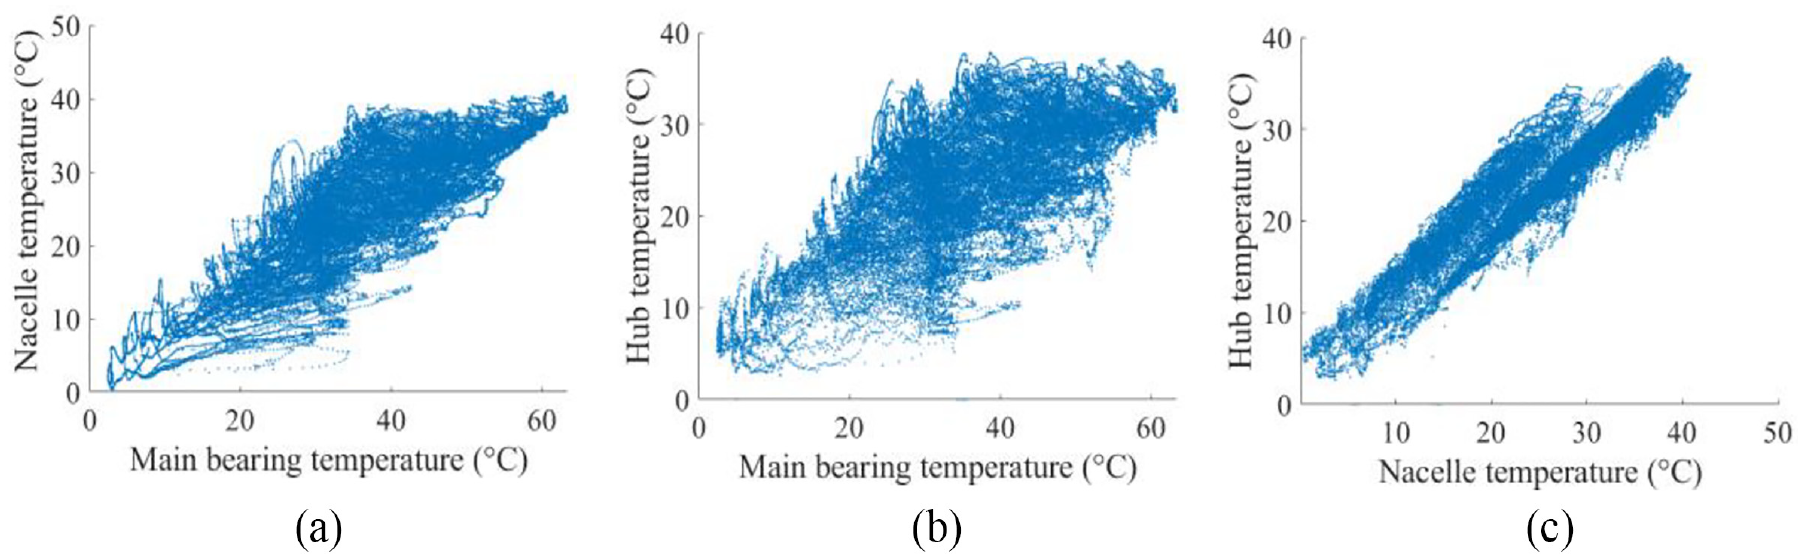
Analysis of the relationships between the key temperature parameters: (a) main bearing temperature and nacelle temperature, (b) main bearing temperature and hub temperature, and (c) nacelle temperature and hub temperature.
Next, the number of hidden layers needs to be determined. According to the Kolmogorov theorem, a neural network containing a hidden layer can approximate any nonlinear function, which will produce satisfactory results for most problems.44,45 Therefore, a single hidden-layer neural network is employed in this paper.
The next two parameters to be determined are the duration of the feedback delay and the number of nodes on the hidden layer for the model. The duration of the feedback delay
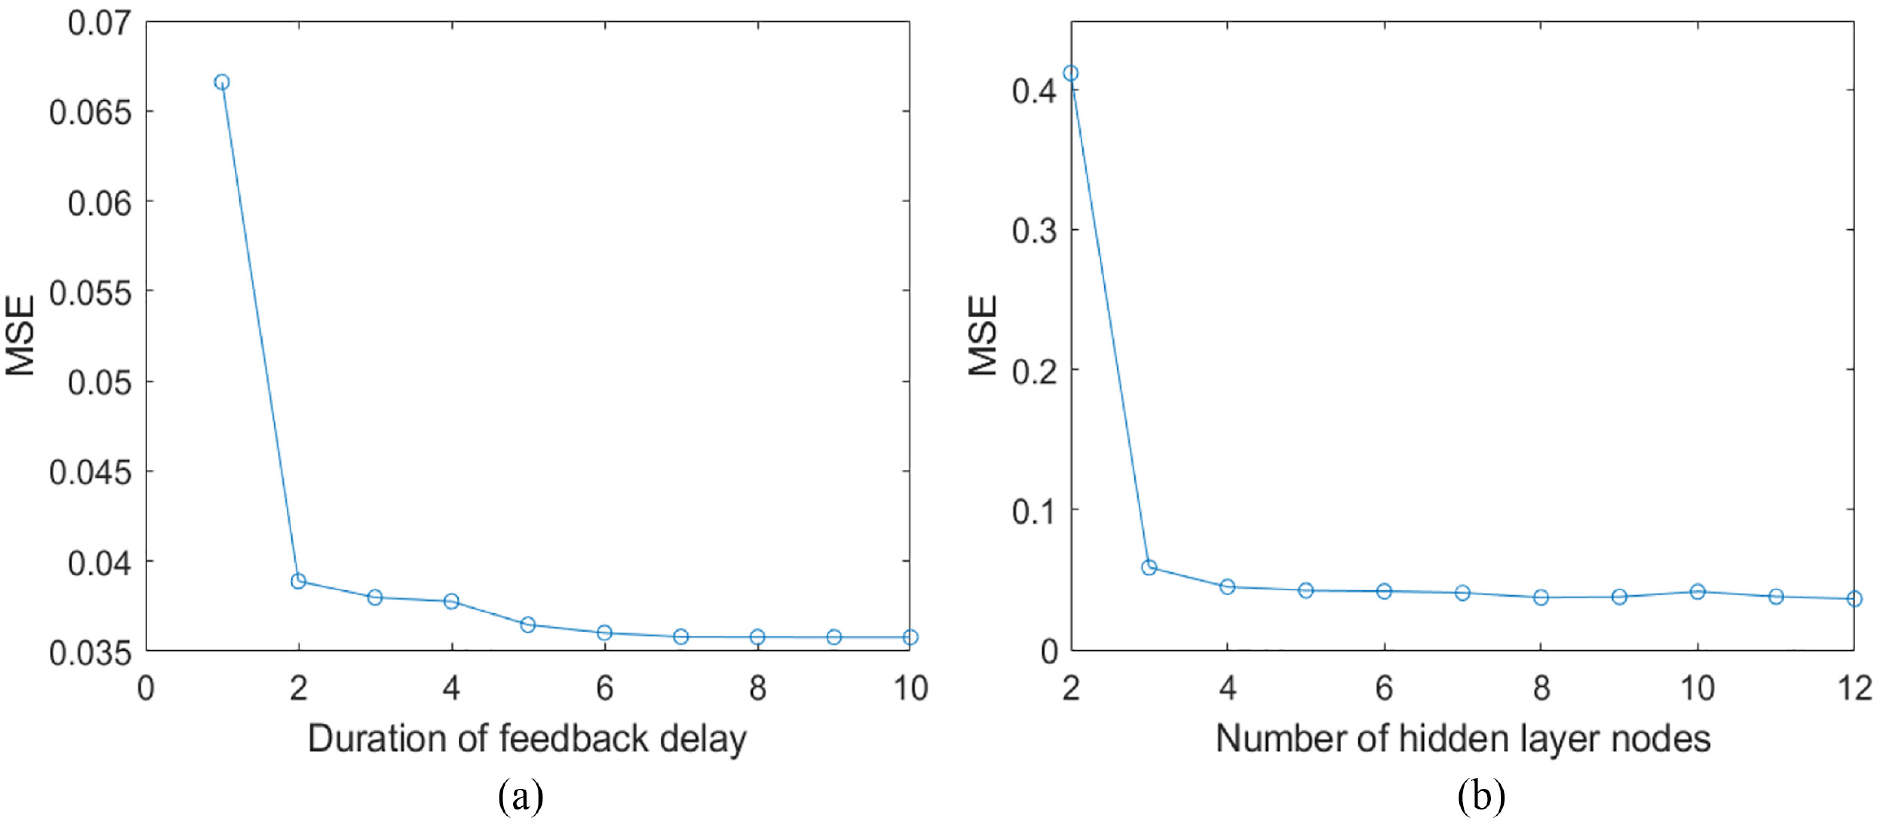
The influence of (a) the duration of the feedback delay and (b) the number of hidden layer nodes on the prediction accuracy.
Then, the steps are repeated to set the duration of the feedback delay
Training and verification of the prediction model
It is found, through the study in this paper, that the WT is in a good health condition in the initial days, as the amount of abnormal monitoring data is much less than the amount of healthy monitoring data. When the NARX neural network is trained with the monitoring data of the WTs in initial service, the generalization ability of the model can basically eliminate the influence of abnormal data from the accuracy of the model. Therefore, there is no need to manually screen the training samples. The study also found that the prediction model designed according to section “Structure design of the prediction model” converges quickly. Therefore, a set of about 1000 samples can meet the needs of model training. Hence, the set of the formal training of the model can be randomly picked from the operational data of the first year of stable service of the target WT, preferably covering the working conditions of four seasons, and a sample size greater than 1000 will suffice. Moreover, as different studies have shown that the accuracy of temperature regression models varies to a highly unique extent, 23 it is necessary for each WT that a prediction model is trained using its operation data. In this study, the sample set for the model training is composed of 2000 random sample points (70% of the sample set is randomly selected as a training set, 15% as the verification set, and 15% as the test set during training also), or 500 for each season, of the first year of stable service of WTs.
The sample set established by the above method is used to train the prediction model of WT No. 1 on a personal computer (8G RAM, Intel i5-8250u, and MATLAB2018). It took 153 iterations, or 2 min 11 s, for the model to converge. The speed of training prediction model can meet the requirement of engineering application.
To employ the prediction model, it is necessary to carry out a more rigorous test on the validity of the model. The operation log shows that in the first year of stable service, WT No. 1 was in good condition from 18:05 on June 27 to 4:05 on July 8 during which no interruption occurred to the SCADA system, and 1500 sample points recorded did not make to the set for the training of the prediction model. Here, 1500 sample points are used to further verify the validity of the prediction model of WT No. 1.
After the above 1500 sample points are input to the prediction model, the predicted residuals of the three output variables, that is, the main bearing temperature, nacelle temperature, and hub temperature, as shown in Figure 6, are obtained. It can be seen from the figure that the means of the predicted residuals of the three output variables from the verification set are −0.02 °C, −0.01 °C, and 0.01 °C, respectively, suggesting the model to be unbiased. And the corresponding standard deviations of the predicted residuals of the three output variables are shown to be 0.06, 0.1, and 0.11, as well as the maximum absolute values of the predicted residuals, 0.57 °C, 0.64 °C, and 0.66 °C are in favor of the high precision of the prediction model. The proposed method is verified by the result to be valid in establishing a prediction model and useful in assessing the condition of WTs.
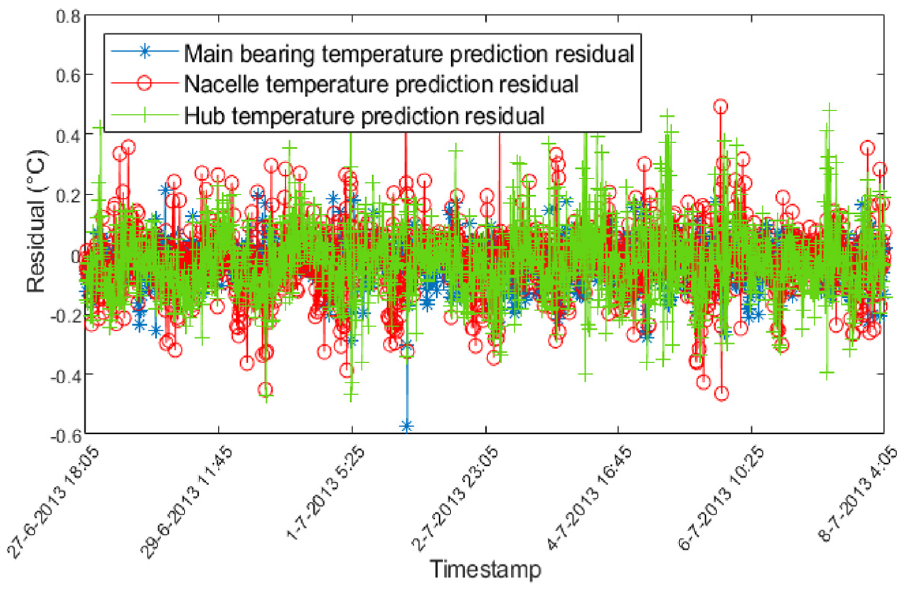
Residuals from the prediction model of the WT No. 1 with the verification set.
Prediction residual analysis to assess the health condition of the WT
This section will be devoted to discussing how the health condition of a WT can be determined using the prediction residuals of the model.
It is clear from the analysis in section “Training and verification of the prediction model” that the model generates unbiased and highly precise prediction with respect to the three output variables. For the sake of simplification and convenience in engineering application,
wherein
The prediction residuals of the prediction model of WT No. 1 is shown in Figure 7(a), where the monitoring data of the SCADA system generated in the first year of stable service are all input to the prediction model. It can be seen, from the figure, that most of the prediction residuals are very small. However, it is also clear that there are only few residuals that are very large. Here, an analysis is conducted to determine the causes of these residual singular values.
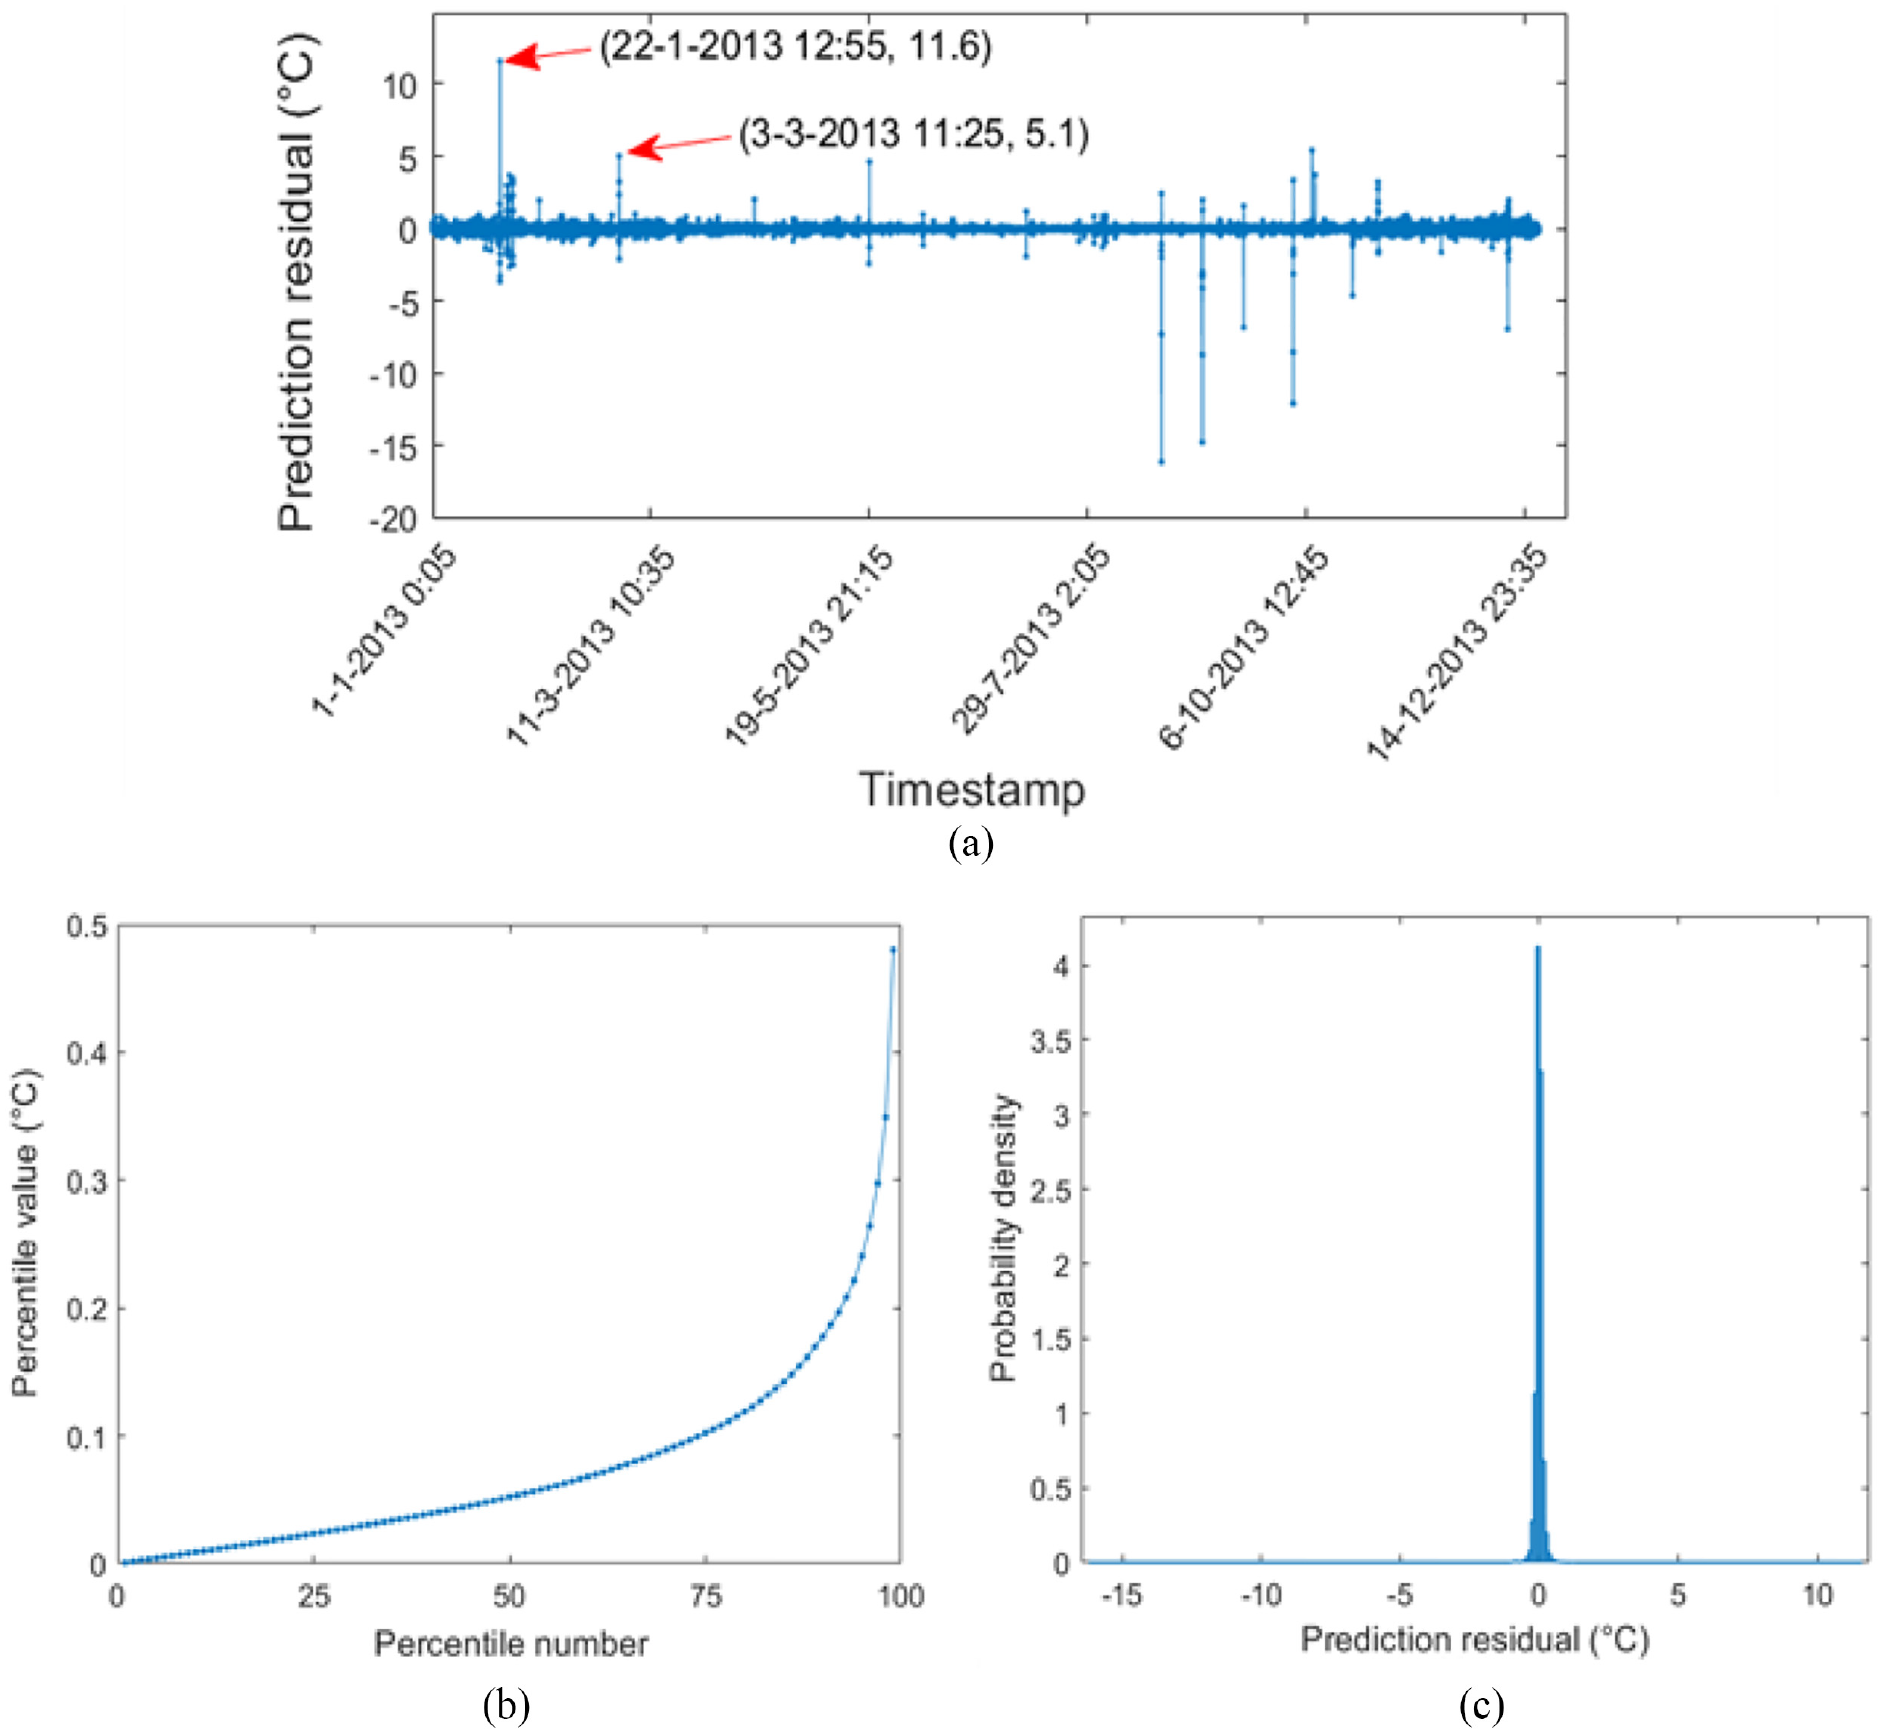
Analysis of the prediction residuals of the model: (a) prediction residuals, (b) percentiles of the prediction residuals, and (c) probability density distribution of the prediction residuals.
In Figure 7(a), the prediction residual at 12:55 on 22 January 2013 is 11.6 °C, a residual singular value, while in Table 1, the adjacent SCADA raw data are shown. It can be seen from Table 1 that the ambient temperature at 12:25 on 22 January 2013 and at 12:35 on 22 January 2013 are obviously abnormal, which explains this predicted residual singular value.
SCADA data around 12:55 on 22 January 2013 in Figure 7(a).
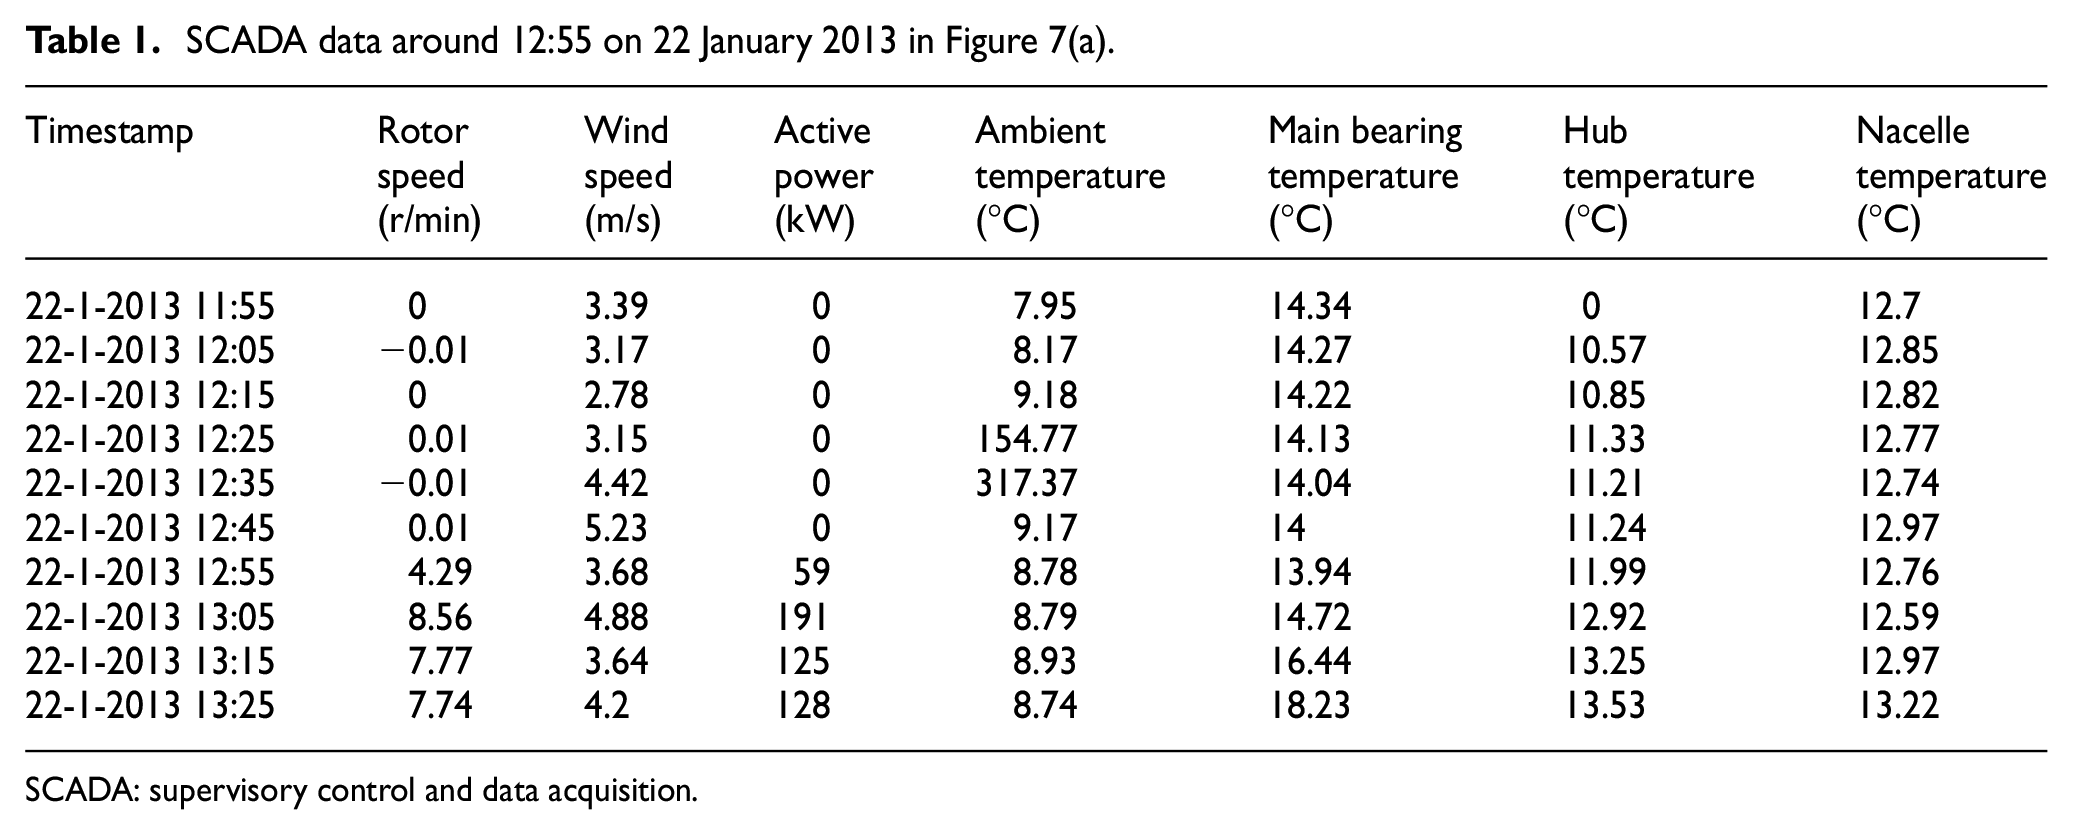
SCADA: supervisory control and data acquisition.
The prediction residual at 11:25 on 3 March 2013 is 5.1 °C, another residual singular value, while in Table 2, the adjacent SCADA raw data are shown. It can be seen from Table 2 that, around this moment, the wind speed is below the cut-in wind speed and the WT is in a normal stop status. However, the hub temperature, recorded by the SCADA system, abruptly decreases from 18.44 degrees at 11:15 on 3 March 2013 to 0.31 degrees at 11:25 on 3 March 2013, suggesting that there is a certain abnormality in the monitoring data during this process.
SCADA data around 11:25 on 3 March 2013 in Figure 7(a).
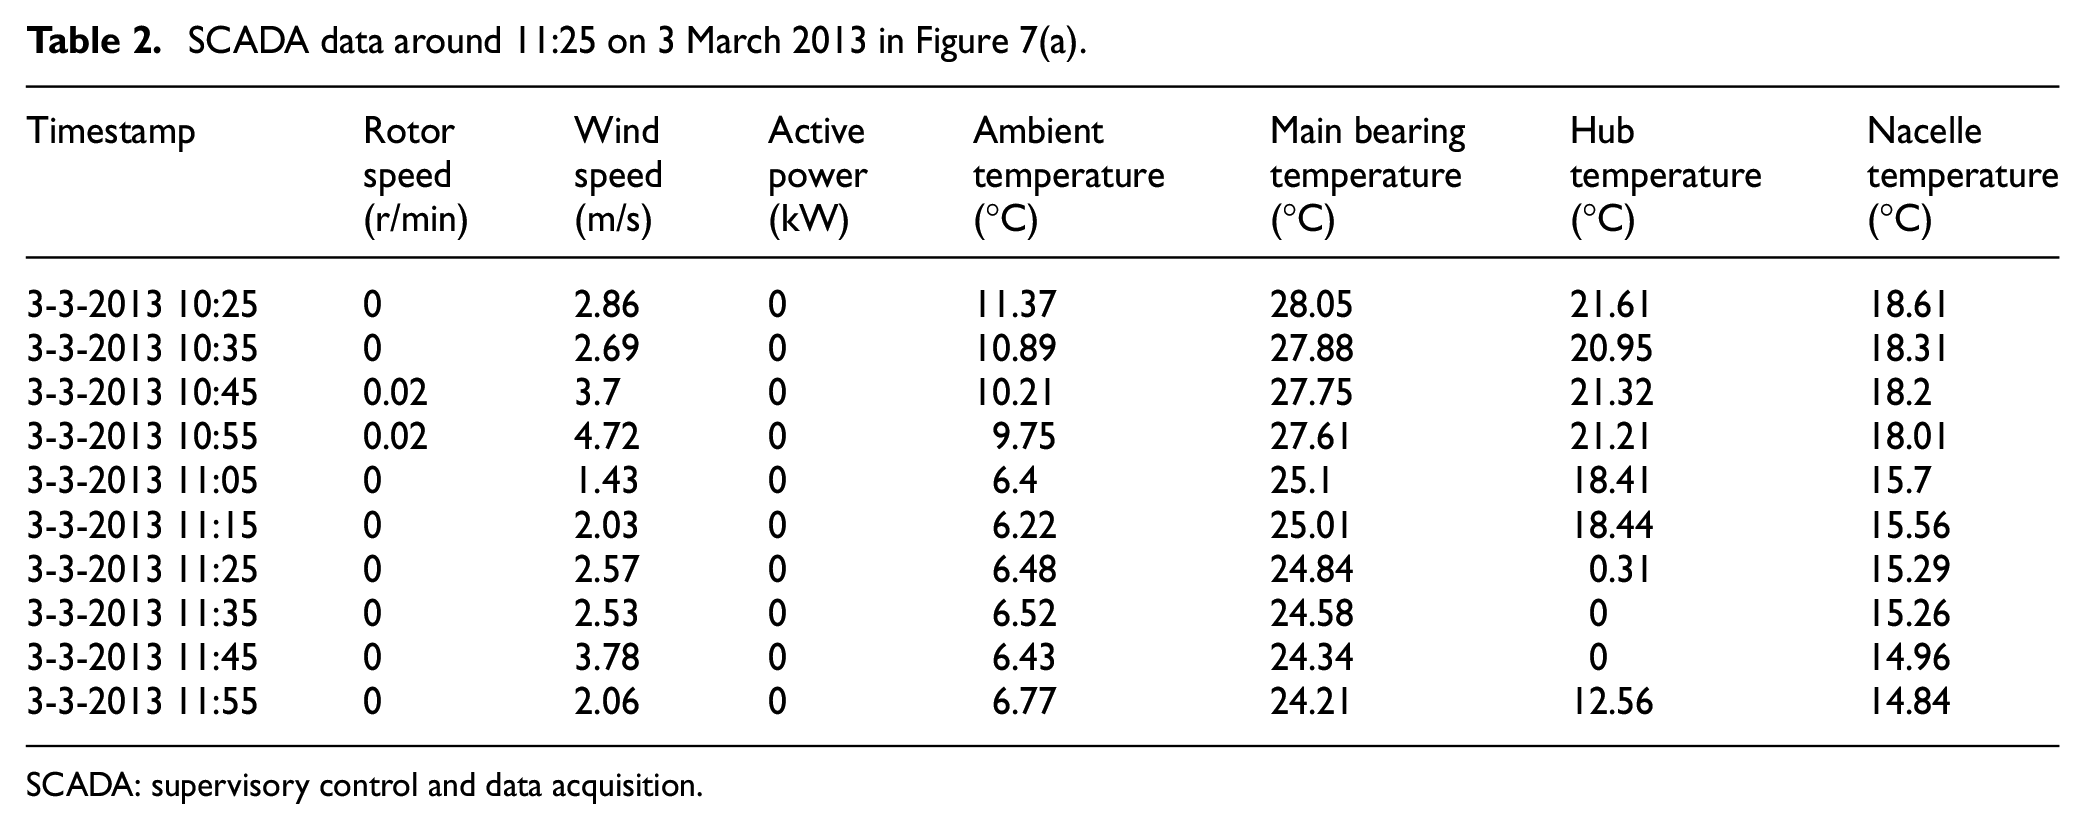
SCADA: supervisory control and data acquisition.
In the above two examples, the predicted residual singular values are both caused by SCADA data anomalies. Thus, instead of simply suppressing them as invalid predictions using conventional data processing methods, they should be incorporated into the WT health assessment in an appropriate way.
On the other hand, the self-contained temperature threshold alarm function of the SCADA system saves the health condition assessment based on the temperature prediction residuals from unnecessary excessive attention to the magnitude of the residuals, and it is the outlying degree of the residuals that merits attention. For instance, while the prediction residual at 12:55 on 22 January 2013 is more than double that of at 11:25 on 3 March 2013, they are not very different, since 85% of the prediction residuals of the model are within ±0.2 °C.
In order to clearly present the implied information on the health condition of the WT, contained in the model prediction residuals, a method to calculate HIPT is proposed, based on the in-depth analysis of the multiyear prediction residuals of multiple WTs in the target wind power farm
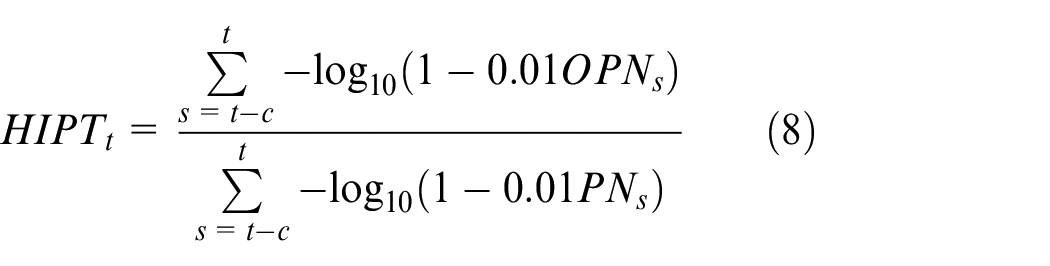
where
where
The criterion for the outlying degree of the prediction residuals is the percentile of the absolute value of a standard prediction residual of the model, that is, after the training of the prediction model, all training samples are input to the model and the percentiles of the absolute values of the prediction residuals of the model are statistically obtained, as shown in Figure 7(b). Figure 7(c) shows the probability density distribution of the predicted residuals after the monitoring data of the SCADA system for the first year of stable service are input to the model. Through extensive analysis and verification during the study, it is found that the prediction residuals of the model do not fit any common probability distribution model. Therefore, the percentile is adopted as the criterion for the outlying degree of residuals.
In order to calculate the HIPT, two parameters need to be determined: the duration of the time window
Implementation of the proposed method
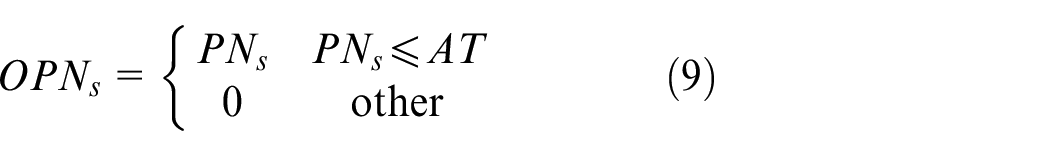
The entire process of the proposed method, as shown in Figure 8, is divided into off-line stage and online stage. The off-line stage, established to prepare the prediction model and necessary parameters for WT condition monitoring, is detailed in sections “NARX-based modeling of temperature parameter prediction” and “Prediction residual analysis to assess the health condition of the WT.”
Entire process of the proposed method.
In the online stage, the online SCADA data of monitored WTs are used to evaluate their health condition. First, the temperature parameter prediction model established in the off-line stage is used to predict the current temperature parameter value. Next, the predicted value is compared with the actual measured value to obtain the predicted residual. Then, the prediction residual of the model in a certain time window is mapped to HIPT. Finally, the HIPT is used to evaluate the health condition of the WT. A subsequent case analysis also shows that setting a lower threshold for HIPT can effectively predict an upcoming stoppage of the WTs (0.5 is an effective lower threshold for WTs involved in this study).
Results and discussion
Large time scale analysis
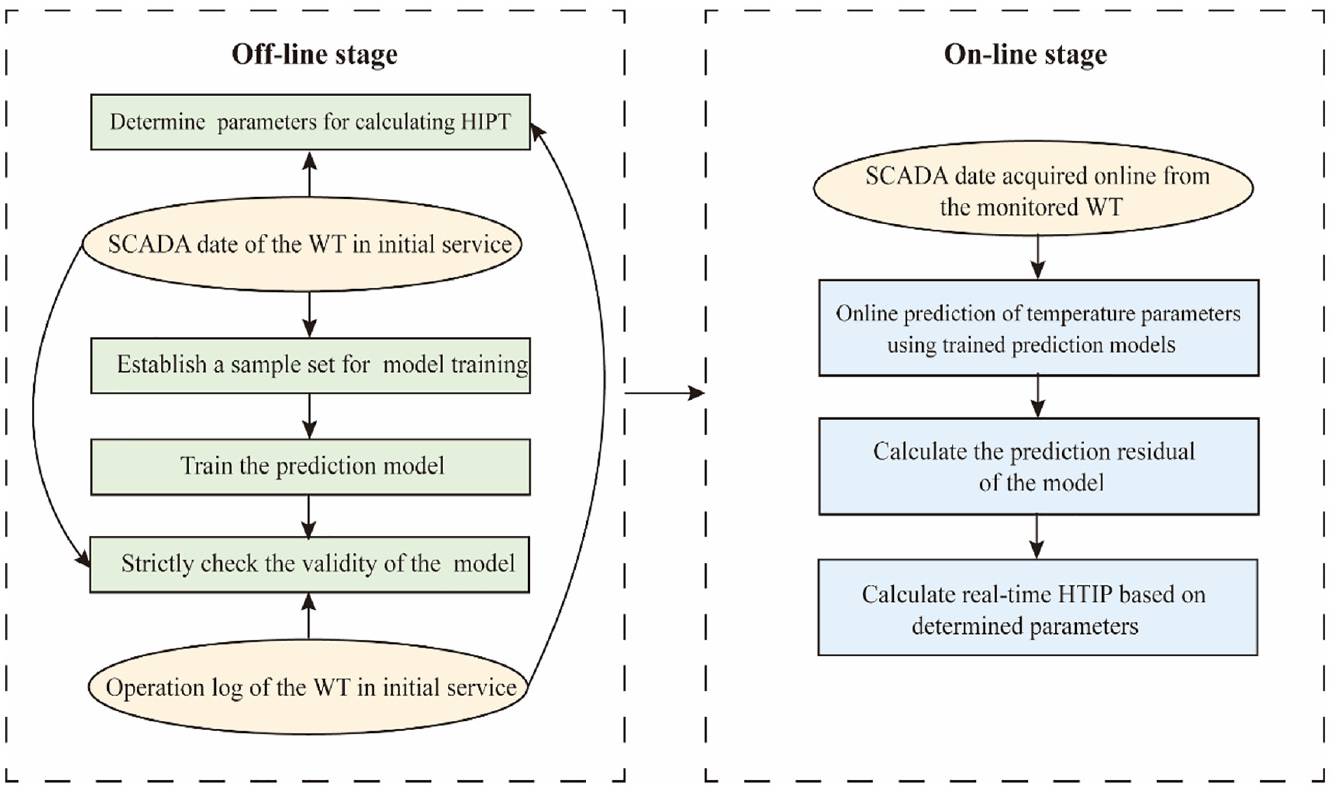
In this section, the effectiveness of the proposed method for the assessment of the health condition of WTs is examined using a large time scale. Figure 9 shows the HIPT of WT No. 1 in the second-year service and the abnormal stoppage data of the same WT in the same year. The abnormal stoppage data are selected from the SCADA data by the criterion that the wind speed is greater than the cut-in wind speed, but the WT has no power output. Figure 10 shows the HIPT of WT No. 1 in the third-year service and the abnormal stoppage data of the same WT in the same year. It can be seen, from Figures 9 and 10, that for WT No. 1, there are abnormal stoppage points densely distributed in the beginning of the second year of service (from 5 January 2014 to 8 February 2014), in the beginning of the third year (from 23 January 2015 to 11 February 2014), and at the end of the third year (from 27 November 2015 to 31 December 2015). And the HIPT values of the mechanical body in these three periods are mostly at a lower level (below 0.5), while those are mostly at a higher level (above 0.5), when the WTs work normally. The HIPT proposed in this paper has an obvious correlation with the abnormal stoppage of the WT, and the overall trend of the index changes is consistent with the health condition of the WT.
Analysis of the relationship between HIPT and abnormal stoppage for the second year of service of WT No. 1.
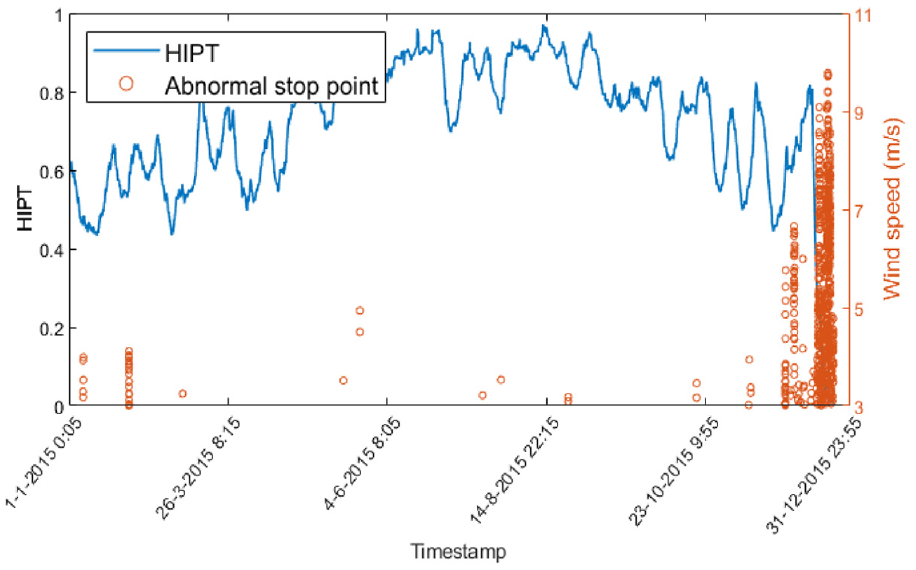
Analysis of the relationship between HIPT and abnormal stoppage for the third year of service of WT No. 1.
WT No. 1 also has some isolated abnormal stoppage points at other moments. At some moments of abnormal stoppage, the HIPT is significantly low, such as at 2:25 on 7 December 2015 and 5:35 on 7 December 2015. There are also some abnormal stoppages, where the HIPT is at a high level, such as at 5:15 on 16 May 2015 and at 9:15 on 23 May 2015. This is because the HIPT in this paper does not cover all health problems, and not all abnormal stoppages are caused by health problems of WTs.
The effectiveness of the method proposed in this paper is further verified by another WT in the target wind power farm. The temperature parameter prediction model of WT No. 2 is trained by the same method to obtain further data. Figure 11(a) shows the prediction residual sequence obtained by inputting all the training samples into the prediction model, while Figure 11(b) provides the percentiles of the absolute values of the standard prediction residuals of the model. Figure 12 shows the HIPT and the abnormal stoppage data for the second year of service of WT No. 2, while Figure 13 shows the HIPT and the abnormal stoppage data for the third year of service of WT No. 2. It can be seen, from Figures 11–13, that the percentiles of the absolute values of the standard prediction residuals of WT No. 2 are significantly different from those of WT No. 1, suggesting that there is an individual difference in the prediction accuracy between the different WTs, to which the prediction model is applied. However, the distribution ranges of the HIPT of WT No. 1 and WT No. 2 are not significantly different, indicating that the HIPTs are more stable than the prediction model itself. As in the case of WT No. 1, the HIPT of WT No. 2 also has a significant correlation with abnormal stoppage.
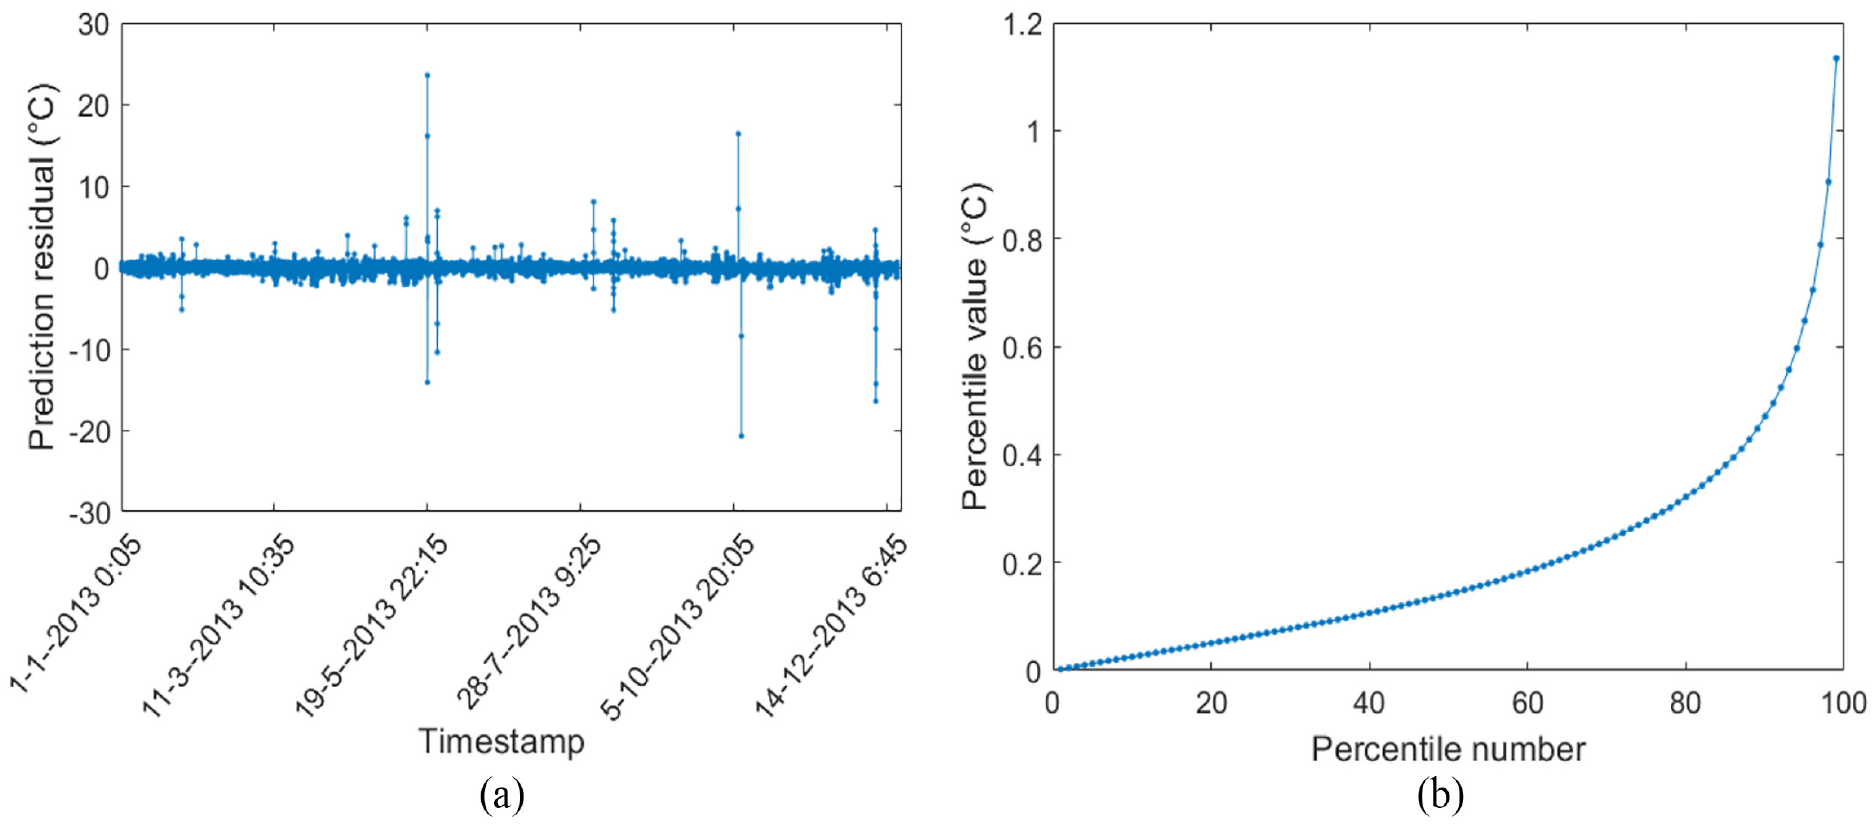
The predicted residuals of the prediction model of WT No. 2 and the percentiles of the absolute values of the standard prediction residuals: (a) prediction residuals and (b) percentiles of the prediction residuals.
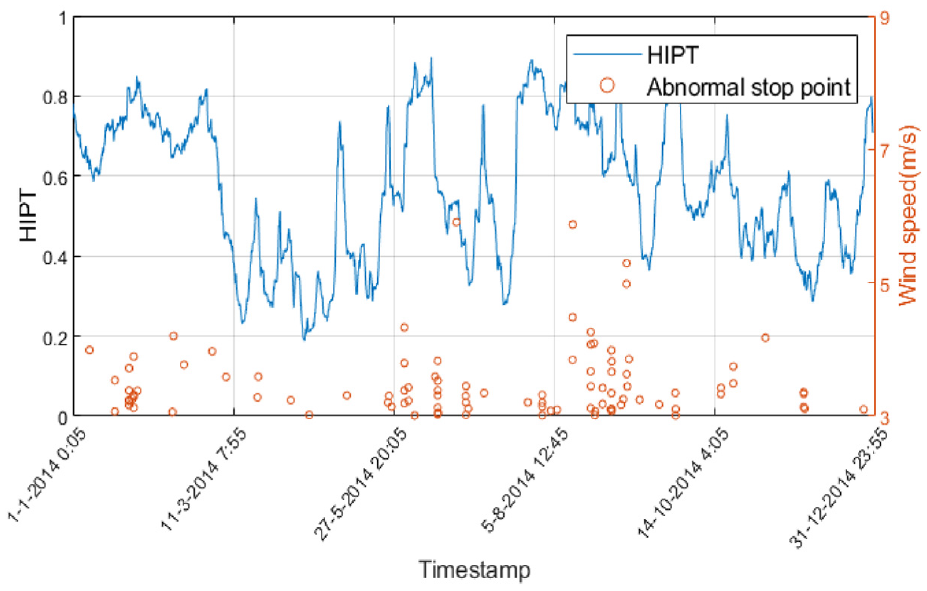
Analysis of the relationship between HIPT and abnormal stoppage for the second year of service of WT No. 2.
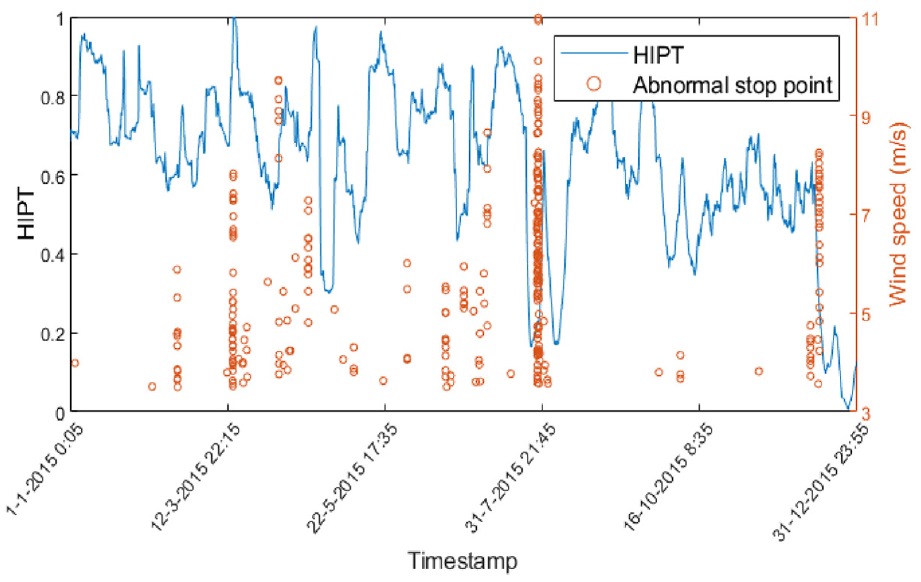
Analysis of the relationship between HIPT and abnormal stoppage for the third year of service of WT No. 2.
Short time scale analysis
In this section, the data were analyzed using a short time scale. HIPT curves are plotted with 100 abnormal stoppage-free consecutive sample points, randomly selected from the HIPT sequences, for the second year of service of WT No. 1 and WT No. 2, as shown in Figure 14(a) and (b), respectively. Figure 14 (a) and (b) identifies the sample points, where the operating conditions have been switched between operation and stoppage during these two periods of the corresponding WTs. It can be seen, from the figures, that the normal switching of the working conditions will not cause a sudden change in the HIPT, nor will it make a significant difference to the changing trend. This is because the training samples of the prediction model cover all the working conditions of the WT, giving the HIPT a good adaptability to the normal switching of the working conditions.
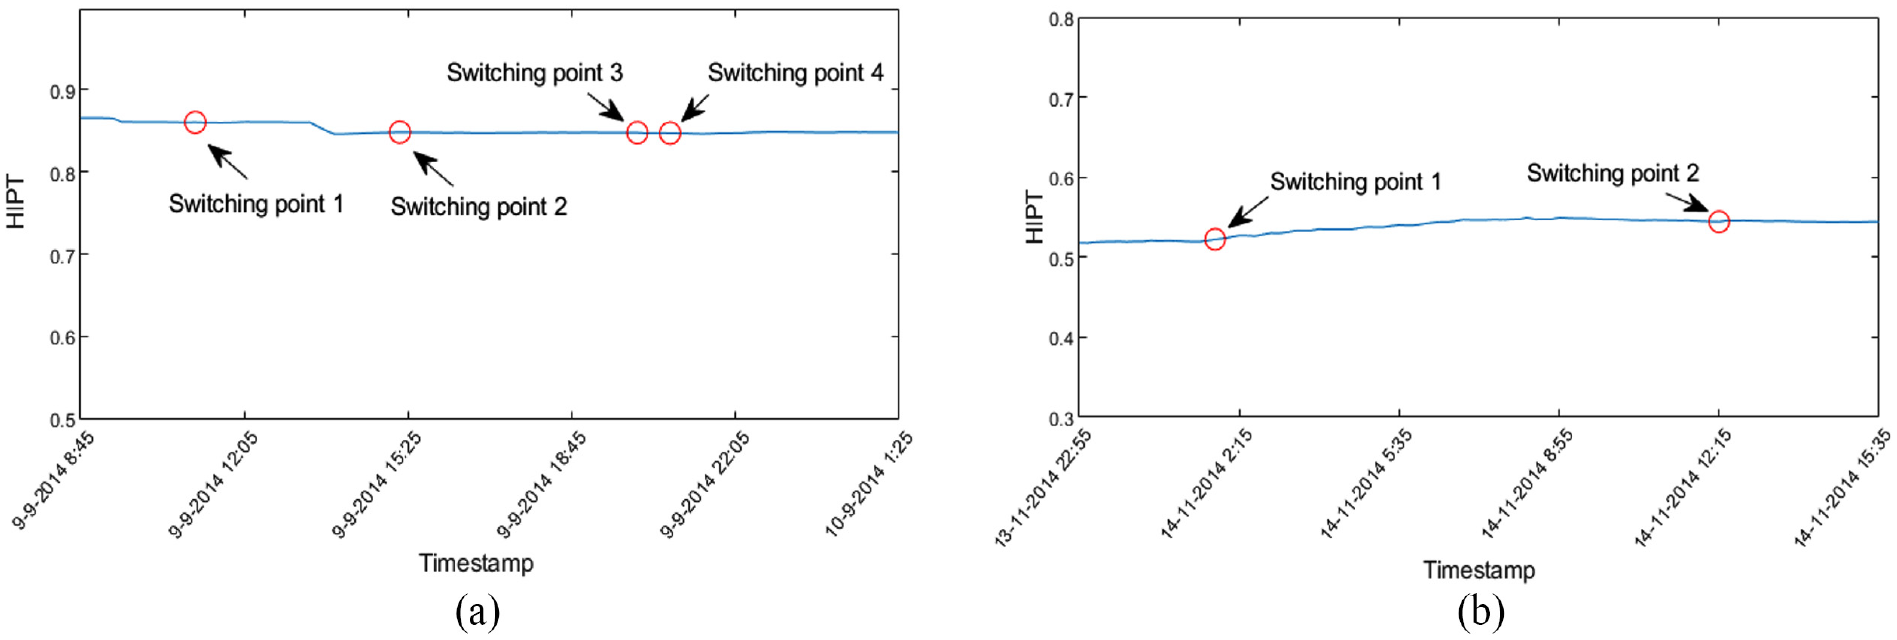
Stability analysis of the HIPTs at the switching moments of the operating conditions of the WTs: (a) WT No. 1 and (b) WT No. 2.
After that, the condition of the WTs, before and after maintenance, is considered. Figure 15 shows the health index curve together with the corresponding abnormal stoppage data, before and after a maintenance task is performed in the second year of service of WT No. 1. As shown in Figure 15, it is known, from the raw data and event log of the SCADA system, that a pitch system-related problem was detected at 10:35 on 9 February 2014, upon which, there was a continuous maintenance stoppage for a duration of up to 12 days (from 10:35 on 9 February 2014 to 16:35 on 21 February 2014), and that the HIPT of the WT began to show a declining tendency around 5:55 on 1 February 2014 and dropped below 0.5 at 19:05 on 4 February 2014, 8 days before the start of the continuous stoppage.
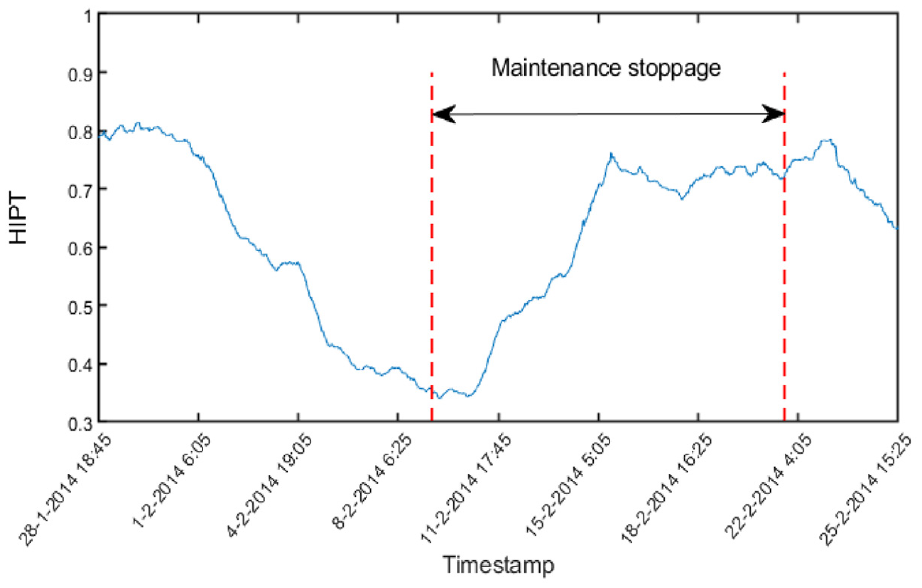
Analysis of the changing trend of HIPT before and after a certain maintenance task of WT No. 1.
Figure 16 shows the HIPT and the corresponding abnormal stoppage data before and after maintenance task in the third year of service of WT No. 2. As shown in Figure 16, it is known, from the raw data and event log of the SCADA system, that an electrical system-related problem was detected at 7:45 on 28 July 2015, upon which, there was a continuous maintenance stoppage for a duration of up to 2 days (from 7:45 on 28 July 2015 to 14:25 on 30 July 2015) and that the HIPT of the WT began to show a declining tendency around 22:35 on 24 July 2015, 3 days before the start of the continuous stoppage. In the instances shown in Figures 15 and 16, the decline of the HIPT of the WTs obviously occurs earlier than the abnormal stoppage, suggesting that such indexes can effectively reflect some early health problems of the WTs to provide a reference for their scientific maintenance.
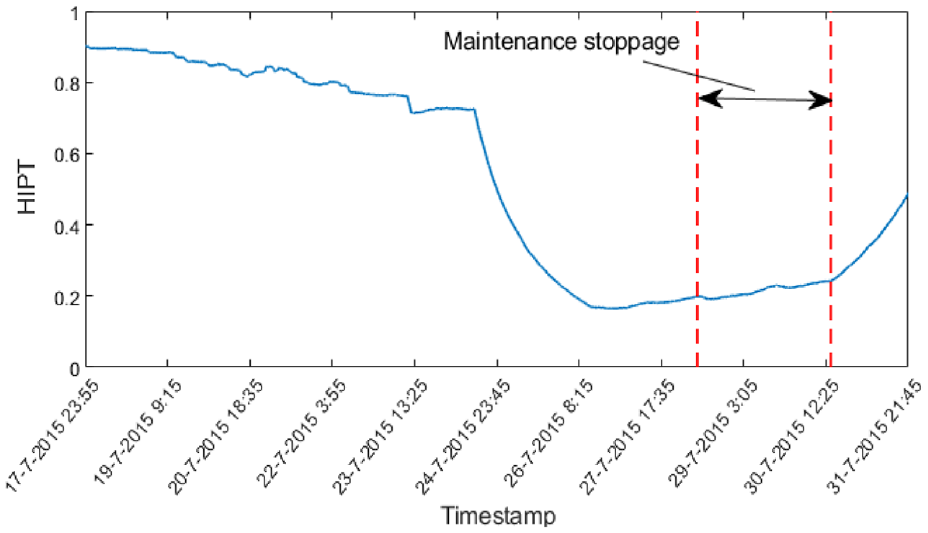
Analysis of the changing trend of HIPT before and after a certain maintenance task of WT No. 2.
Further analysis of the raw data described in the instance shown in Figure 16 shows that the WT has no power output when the pitch angle is 0 degrees. While this fault does not cause an abnormality of the temperature parameter itself, it is not consistent with the inherent relationship between the temperature-related condition parameters of WTs (in the training sample, the WT has a power output when the pitch angle is 0 degrees). Therefore, the health index of the WT proposed in this paper can also suggest this failure.
It can be found, by comparing the above two instances, that between the WTs, there is a difference in the trend of the HIPT after the start of maintenance. In the instance illustrated in Figure 15, the HIPT immediately rebound after the start of the stoppage maintenance, which is not the case in the instance shown in Figure 16. This is because the failure of the WT in the instance illustrated in Figure 15 is related to the pitch system, and the stoppage eliminates the health condition problem of the WT. The WT failure in the instance illustrated in Figure 16 is related to the electrical system, and the health condition problem of the WT is still reflected by the HIPT of the WT after the stoppage. Therefore, it is still significant to calculate HIPT during stoppage maintenance.
Finally, the advantages of the proposed method are further illustrated by analyzing the variation of the original temperature parameters of the maintenance instance shown in Figure 17. It can be seen in Figure 17, which shows the variation curve of the original temperature parameters of the maintenance instances shown in Figure 16, that the relationship between the change of original temperature parameters and the health condition of the WTs is very unclear. Although it is possible to assess the health condition of WTs by making a direct statistical comparison of temperature parameters using a method similar to those in Cross and Ma 22 and Rodríguez-López et al., 23 a lot of cumbersome analysis work is required in the later state. This is because, although the change of the health condition of the WTs will affect these temperature parameters, the temperature parameters are subject to the impact of other factors such as external environment, operating condition, and so on. Most of the time, the health condition of a WT is not even a main factor of the change of temperature parameter. It is very difficult to obtain the health condition of WT by directly observing the change of temperature parameters. However, the method proposed in this paper, by establishing a high-precision prediction model and making the residual analysis of temperature parameters, can separate out the changes of temperature parameters arising from external environment, operating condition, and so on, and, thanks to the advantages of HIPT proposed herein, clearly present the changes in the health condition of the WTs (as shown in Figures 15 and 16).
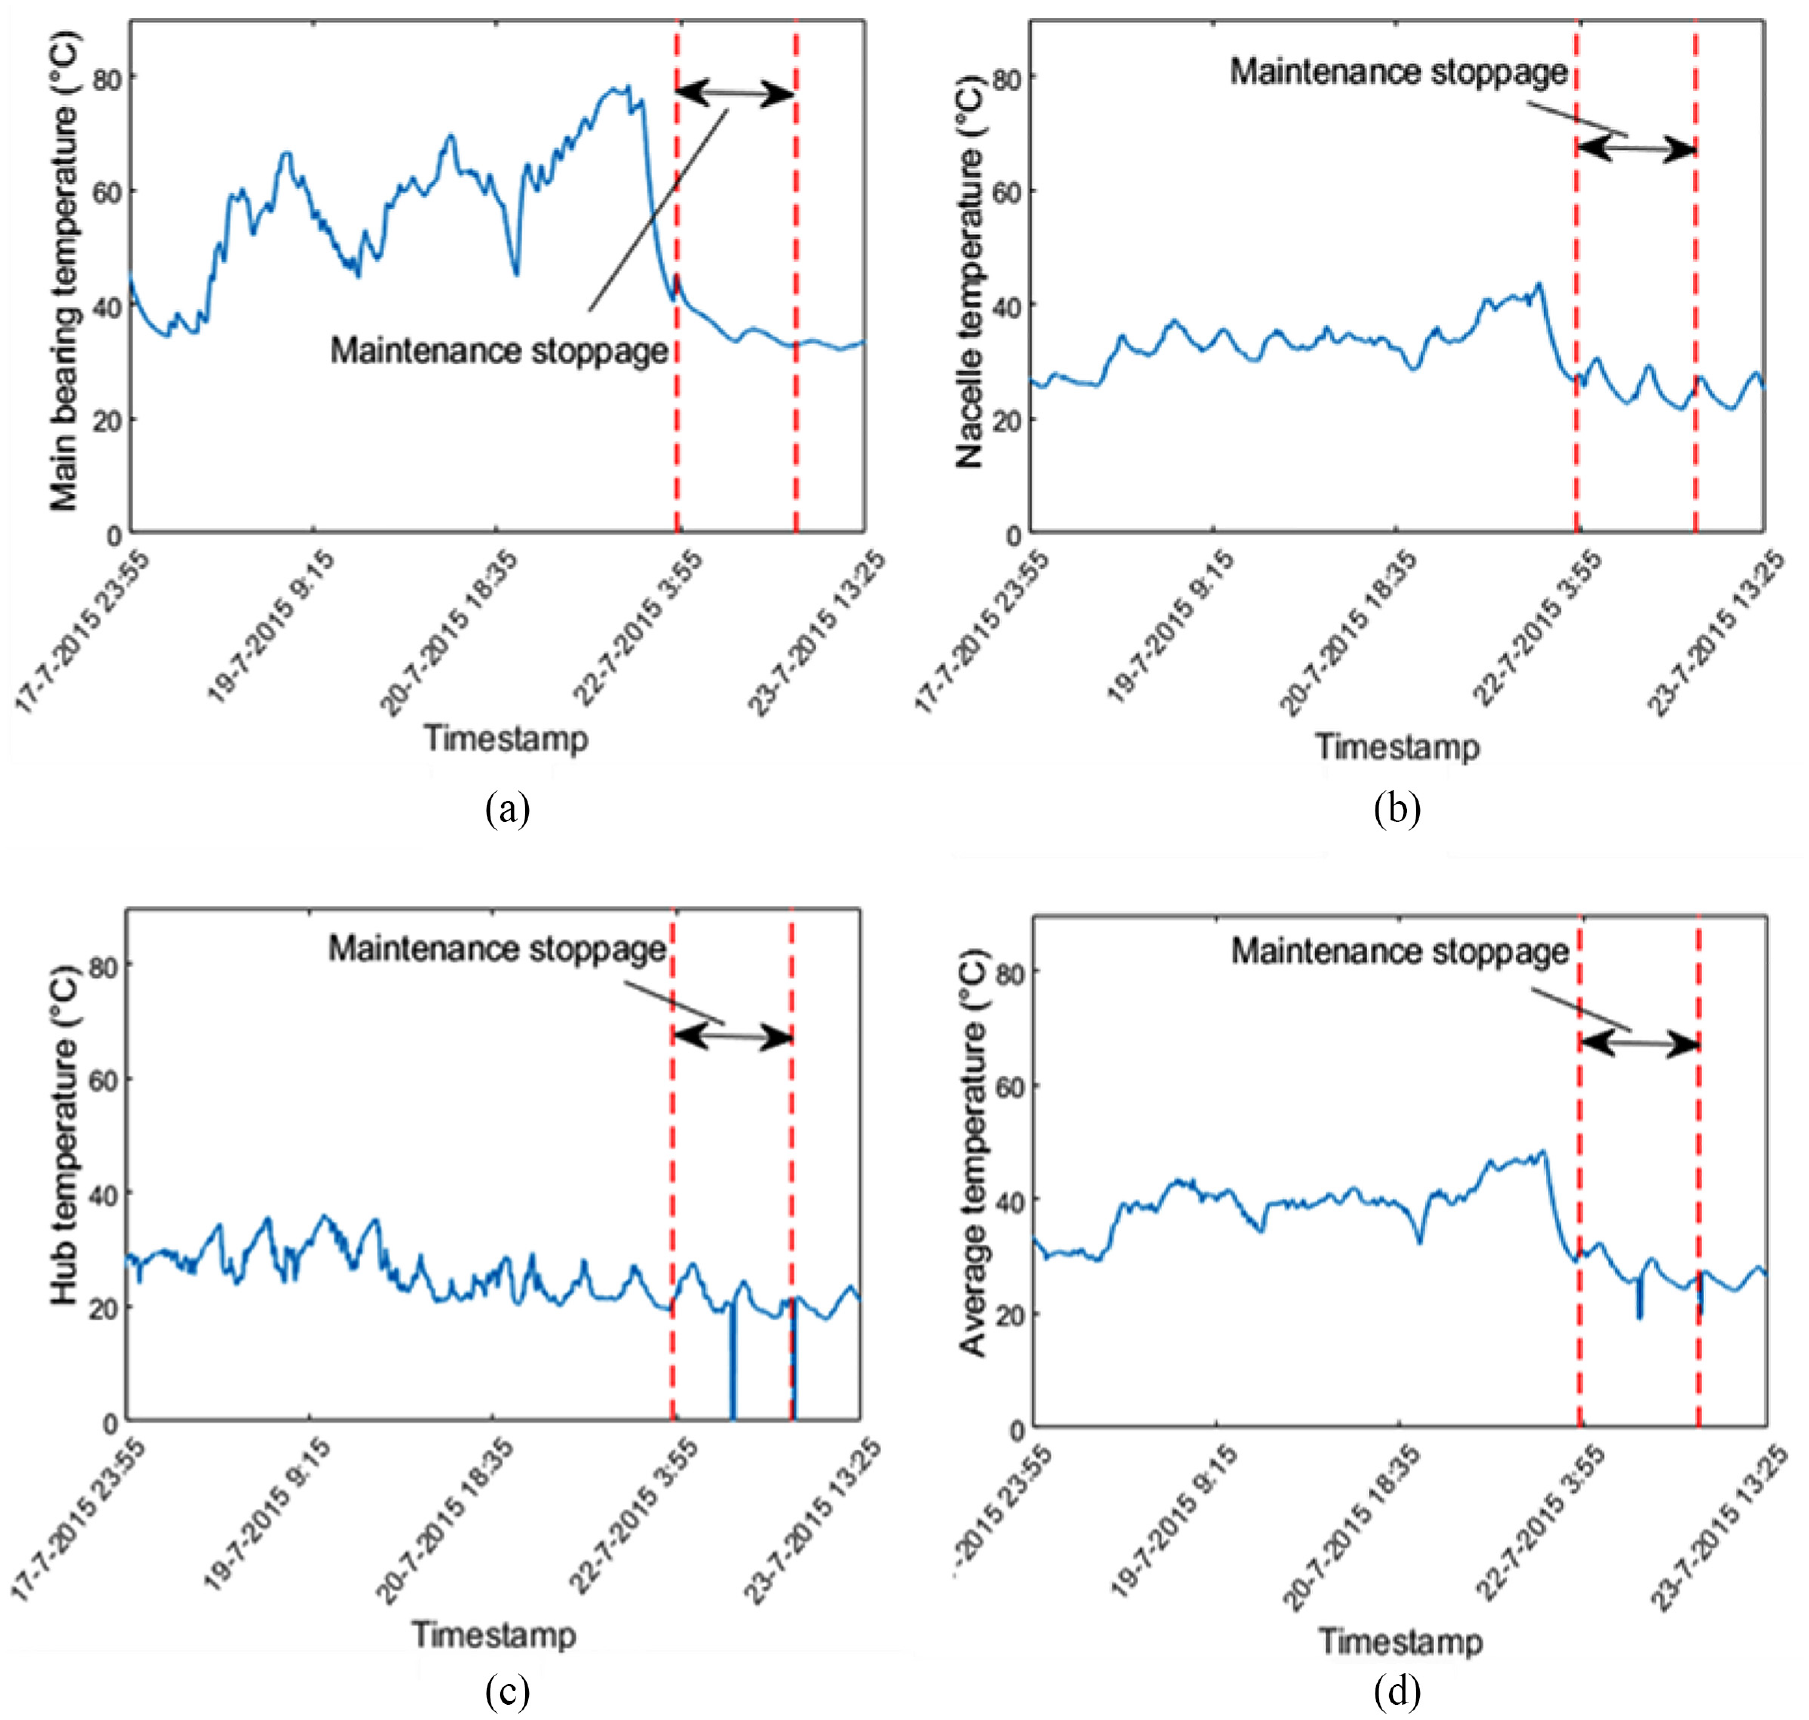
The variation curve of original temperature parameters of the maintenance instances shown in Figure 16: (a) main bearing temperature, (b) nacelle temperature, (c) hub temperature, and (d) average of the above three temperature parameters.
Comprehensive performance assessment
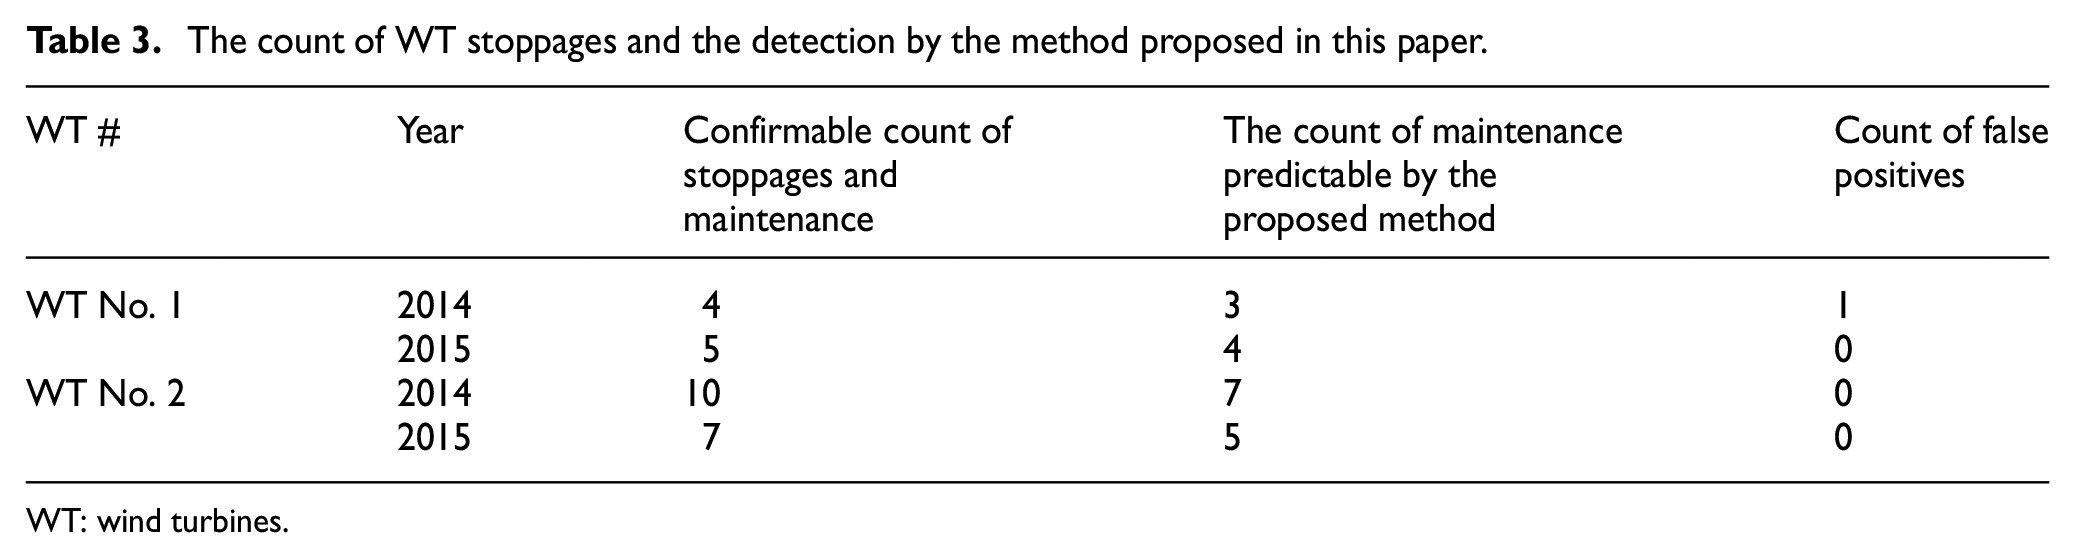
In this section, the effectiveness of the proposed method is comprehensively evaluated using the full event log and SCADA data used in this paper. The count of stoppages and maintenance of the two WTs in the second and third years of stable service, which can be confirmed by taking 0.5 as the warning lower threshold of HIPT, as well as the effectiveness of the detection by the method proposed herein are shown in Table 3. In these 2 years, the two WTs went through stoppage and maintenance 26 times, of which 19 are predictable by the proposed method. WT No. 1 had a false positive in the second year of service (2014). As far as these data are concerned, the proposed method has a true positive rate of 79.2% and a precision of 95%. Considering that the data used in this paper are neither laboratory-obtained data nor calibrated standard data sets, but are all derived from the WTs in actual operation, it is shown that the method proposed herein has an engineering application value and can be used to detect the condition of WTs.
The count of WT stoppages and the detection by the method proposed in this paper.
WT: wind turbines.
It can also be seen from Table 3 that the method proposed herein is effective to a certain different extent for different WTs as only two times of stoppage and maintenance of WT No. 1 are missed by this method, while WT No. 2 has five such misses.
Conclusion
In order to improve the reliability of WTs and reduce maintenance costs, a method to assess the health condition of WTs is proposed, based on the analysis of the temperature-related parameters of the SCADA system. The method is based on the NARX neural network framework, where a prediction model of time-sequence regression is established, based on the key temperature signals of the WTs, so as to reflect their health condition in the form of prediction residuals. The HIPTs of the WTs are developed by separating the statistics concerning the conformity of the predicted values of key temperature parameters within a certain time window from the measured values in order to clearly show the information on the health condition of the WTs, vaguely contained in the prediction residuals, and effectively suppress the influence of the singular values of the predicted residuals on the health condition assessment. The case study shows that the HIPT proposed in this paper can be used for WT operation monitoring and fault prediction, which can thus reduce maintenance costs and avoid malignant safety and production accidents of WTs.
Compared with relevant methodologies, the proposed method has the following main features and advantages: (1) many related studies23–31 show that the establishment of a regression prediction model is an effective way to monitor the condition of WT, but few probe into how to establish an accurate and practical regression prediction model in light of the characteristics of temperature-related parameters. The regression prediction model in this study gives full consideration to the characteristics of temperature-related parameters, especially the impact of thermal inertia on temperature parameters. (2) The NARX algorithm used in the prediction model, although a classic artificial neural network, is rarely studied in the field of condition monitoring of WTs. NARX allows us to easily incorporate the impact of historical condition on temperature parameters into a prediction model through feedback delay and historic feedback input; therefore, compared with common regression prediction algorithms such as BP neural network, support vector NARX is more suitable for temperature parameter prediction. NARX has developed into a mature algorithm that has a more promising prospect of engineering application than some new data-mining algorithms do. (3) The HIPT proposed in this paper maps the fitness of the measured values of several temperature parameters with the prediction model into a single indicator, which is succinct and clear in engineering applications. (4) The HIPT helps with health condition evaluation by counting the weighted proportion of normal predicted residuals in a certain time window, which implies that singular values do not have a significant impact on the overall trend of HIPT; therefore, the method proposed in this paper does not need the filtering algorithm like many other studies do and can better retain the useful information in the monitoring data (from the perspective of information theory, all filtering algorithms would cause damage to information due to the suppression of noise interference, which always comes with certain loss of useful information).
Because individual SCADA data of different WTs are obviously different, further efforts are required to improve and expand the proposed method using more analyses and tests.
Footnotes
Declaration of conflicting interests
The author(s) declared no potential conflicts of interest with respect to the research, authorship, and/or publication of this article.
Funding
The author(s) disclosed receipt of the following financial support for the research, authorship, and/or publication of this article: This research was funded by the National Key Research and Development Program of China (grant number 2016YFF0203400), the Program of Key Technologies R&D and Major Technological Achievements in the Transformation of the Strategic Emerging Industry of Hunan Province (grant number 2018GK4024), the National Natural Science Foundation of China (grant number 51875199), and the Key Research and Development Program of Hunan province (grant number 2018GK2073).