



Abstract
This paper aimed at investigating the impacts of some cultural, social and economic factors of the students’ families on the students’ education and attitude toward mathematics. This study has been carried out through the use of data envelopment analysis. Data envelopment analysis is a linear programming method that its main purpose is to compare and evaluate the efficiency of a number of similar decision-making units, and to compare and analyze them, which have different values of consumed inputs and produced outputs. In this study, the inputs are the various aspects of cultural, social and economic conditions (such as family income, physical and mental health condition of the family members, and parents’ occupation) of the families of 300 sixth-grade elementary school students in district 4 of Tehran, and the outputs are the extent of achievement in the mathematics test and the interest of the students of the mentioned schools to the activities related to the mathematics course and moral discipline. After the completion of the investigations, the effective and ineffective units were identified and the results were completely interpreted.
Introduction
Education should enable us to respond to the opportunities and challenges we face as quickly as the change in the world in which we live and work. These changes involve some parts of school curriculum. Mathematics education has always been investigated as one of the main educational topics. The most important role of mathematics is the development of thinking. The general goal of mathematics teaching is to develop good mental habits in every student so that they can handle every type of problem as much as possible. Hence, mathematics education is relevant to the completion and implementation of an appropriate curriculum, as well as issues and topics related to teaching and learning mathematics.
Studies show that both internal factors (such as intelligence, memory and motivation) and external factors (such as classroom conditions, students’ social status and the extent of student’s interaction with his teacher) affect teaching.
Bucher and Manning 1 attributed the school’s atmosphere, which is the heart and soul of the school, to the parameters such as intimacy, tolerance and flexibility, and consider it as one of the external, important and influential factors in education. Springer et al. 2 and Brook et al. 3 considered classroom environment as one of the students’ important learning factors. However, unlike them, Marcoulides et al. 4 found a weak relationship between school culture and mathematical attitudes in his study in the context of Cyprus. Clearly, as school culture can influence student’s learning, family culture as the first platform for student’s growth plays a significant role in student’s learning. The extent to which family culture can have impact on student’s educability and enthusiasm regarding different sciences has been one of the topics studied by researchers in the field of education. Koutsoulis and Campbell 5 considered parents as one of the key factors in developing and evolving positive attitudes in children toward their education. Tymms 6 found a weak relationship between the two variables of family socioeconomic status and attitudes toward mathematics.
In a study by Marco Leeds (2005), it was found that the relationship between beliefs, values and the process of mathematics education is low. Pahlavan and Kajbaf 7 investigated the effect of socioeconomic status of 500 public high school students’ families in Isfahan city on mathematics learning. They used the correlation method and implementation in TIMSS (Trends in International Mathematics and Science Study) scale in their study. Their findings indicated a significant and direct effect of the process of mathematics education on the attitude toward mathematics, the significant and reverse effect of the school culture’s structures and the family’s socioeconomic status on the process of mathematics education, as well as the significant and direct effect of the constructs of beliefs and values on the process of mathematics education and the attitude toward mathematics in the model. 7
This study examines the effect of some cultural, social and economic factors of the students’ families such as the family income, physical and mental health condition of the family members, and parents’ occupation on the result of mathematics test, discipline and interest of students in performing mathematical activities in the classroom. In this study, the data were collected on the 300 sixth-grade male students from three primary schools in district 4 of Tehran, and the effective and ineffective units were identified and the results were analyzed through the use of data envelopment analysis (DEA) method. The following section represents an introduction to DEA.
Data envelopment analysis
Data envelopment analysis indicates a concept of the calculation of the efficiency levels’ evaluation within a group belonged to the organization. The efficiency of each unit is computed based on the comparison to a number of units with the highest performance. 8 This technique is based on a linear programming approach which main purpose is to compare and measure the efficiency of a number of similar decision-making units, which have different number of consumed inputs and produced outputs. These units can be branches of a bank, schools, hospitals, and so on. Comparing and measuring efficiency means how good the decision-making unit has used its sources in the way of production, compared to the other decision-making units.
The development of the non-parametric estimation method of the DEA took place in the Farrell’s 9 study in 1957. In this estimation method, in order to measure the efficiency of a firm, the performance of that firm was compared to the performance of the best existing firms. This method was developed in 1978 by the study of Charnes et al. 10 and addition of the possibility of incorporating multiple inputs and multiple outputs. Moreover, in 1993, Andersen and Petersen 11 introduced a new method for ranking the efficient units. Since the initial presentation of this method up to the present time, the method of DEA has been expanded and many researchers have been turned to this subject. In 2003, Banker et al. conducted a study, based on which the analysis of the procedure of the implemented changes in technical and professional efficiency of the Texas public schools took place. The results of this study indicated a direct relationship between the inefficiency and the cost of variables. 12
The first DEA model was called CCR. The basis for the formation of this model is the definition of efficiency as a ratio of an output to an input. In other words, in the CCR model, for the calculation of technical efficiency, instead of using the ratio of an output to an input, the ratio of the weighted sum of outputs to the weighted sum of inputs is used. In the CCR model, it is assumed that the returns to scale is constant for all firms. Constant returns to scale means that all industries have been produced on an optimal scale and the size of the organization has no effect on its efficiency.
Multiplier form of CCR with the input nature

In the CCR model, i = {1, …, m} and r = {1, …, s} respectively represent the inputs and outputs of each industry and j = {1, …, n} represents decision-making units. The parameters yij and xij represent the inputs and outputs, respectively. The ur and vi also respectively represent the decision-making variables for the weights of inputs and outputs.
The BCC model with input nature is explained below based on the definitions of decision-making variables, parameters and factors provided by Banker, Cooper and Charnes for the CCR model. The BCC output-oriented model is called a multiplier model. The value of w in the mode of achieving the optimal solution shows the type of the model’s return to scale. That is, if w is positive, returns to scale value is an increasing amount; if it is negative, returns to scale value is a decreasing value; and if it is zero, returns to scale value is a constant value.
Multiplier form of BCC with the input nature

Statistical population/sample size
The population of this study included a total of 2800 sixth-grade elementary school male students in district 4 of Tehran during the academic year 2018–2019. Since access to the information of all students in different schools was very time consuming, using cluster sampling method, from the total of 25 primary schools, 3 primary schools were selected, namely Talayedaran primary school (school 1) with 106 sixth-grade students, Komeil primary school (school 2) with 160 sixth-grade students, and Ammar primary school (school 3) with 140 sixth-grade students. From these students, taking the sample size formula into account and considering the low relative error, 320 students were randomly selected and considered as the sample of the study. However, after data cleaning and removing the outliers, the data from 300 returned questionnaires were analyzed.
Procedure
For the purpose of sampling, the district 4 of Tehran Education department was divided into three parts of north, central and southern, and a school was randomly selected from each region. After determining the population and the sample and the stages of implementation, the questionnaires were completed by school counselors and then the students’ teachers. Each questionnaire contained six items as inputs and three items as outputs for a student.
The scores considered for the inputs and outputs are based on the results of the studies by Andersen and Petersen, 11 Banker et al., 12 Martin et al., 8 and Koutsoulis and Campbell. 5
The first input is the student’s father’s educational level. The results were divided into five categories with different scores. In this categorization, score 4 was allocated to the illiterate ones, score 8 was allocated to the ones with literacy at reading and writing, score 12 was allocated to the ones with diplomas, score 16 was allocated to the ones with associate degree and bachelor degree and score 20 was allocated to the ones with master’s degree and above. The second input is the amount of student’s mother’s educational level which was scored the same as above.
In Tables 1–5, scores for different inputs of the model are represented. Inputs in Table 1 represent the financial conditions of the student’s family. Tables 2 and 3 indicate the economic and cultural conditions of the student’s family, and finally, Tables 4 and 5 reflect the physical, emotional and moral health of the family.
Assigned scores to the input 3.

Assigned scores to the input 4.

Assigned scores to the input 5.

Assigned scores to the input 6.

Assigned scores to the input 7.

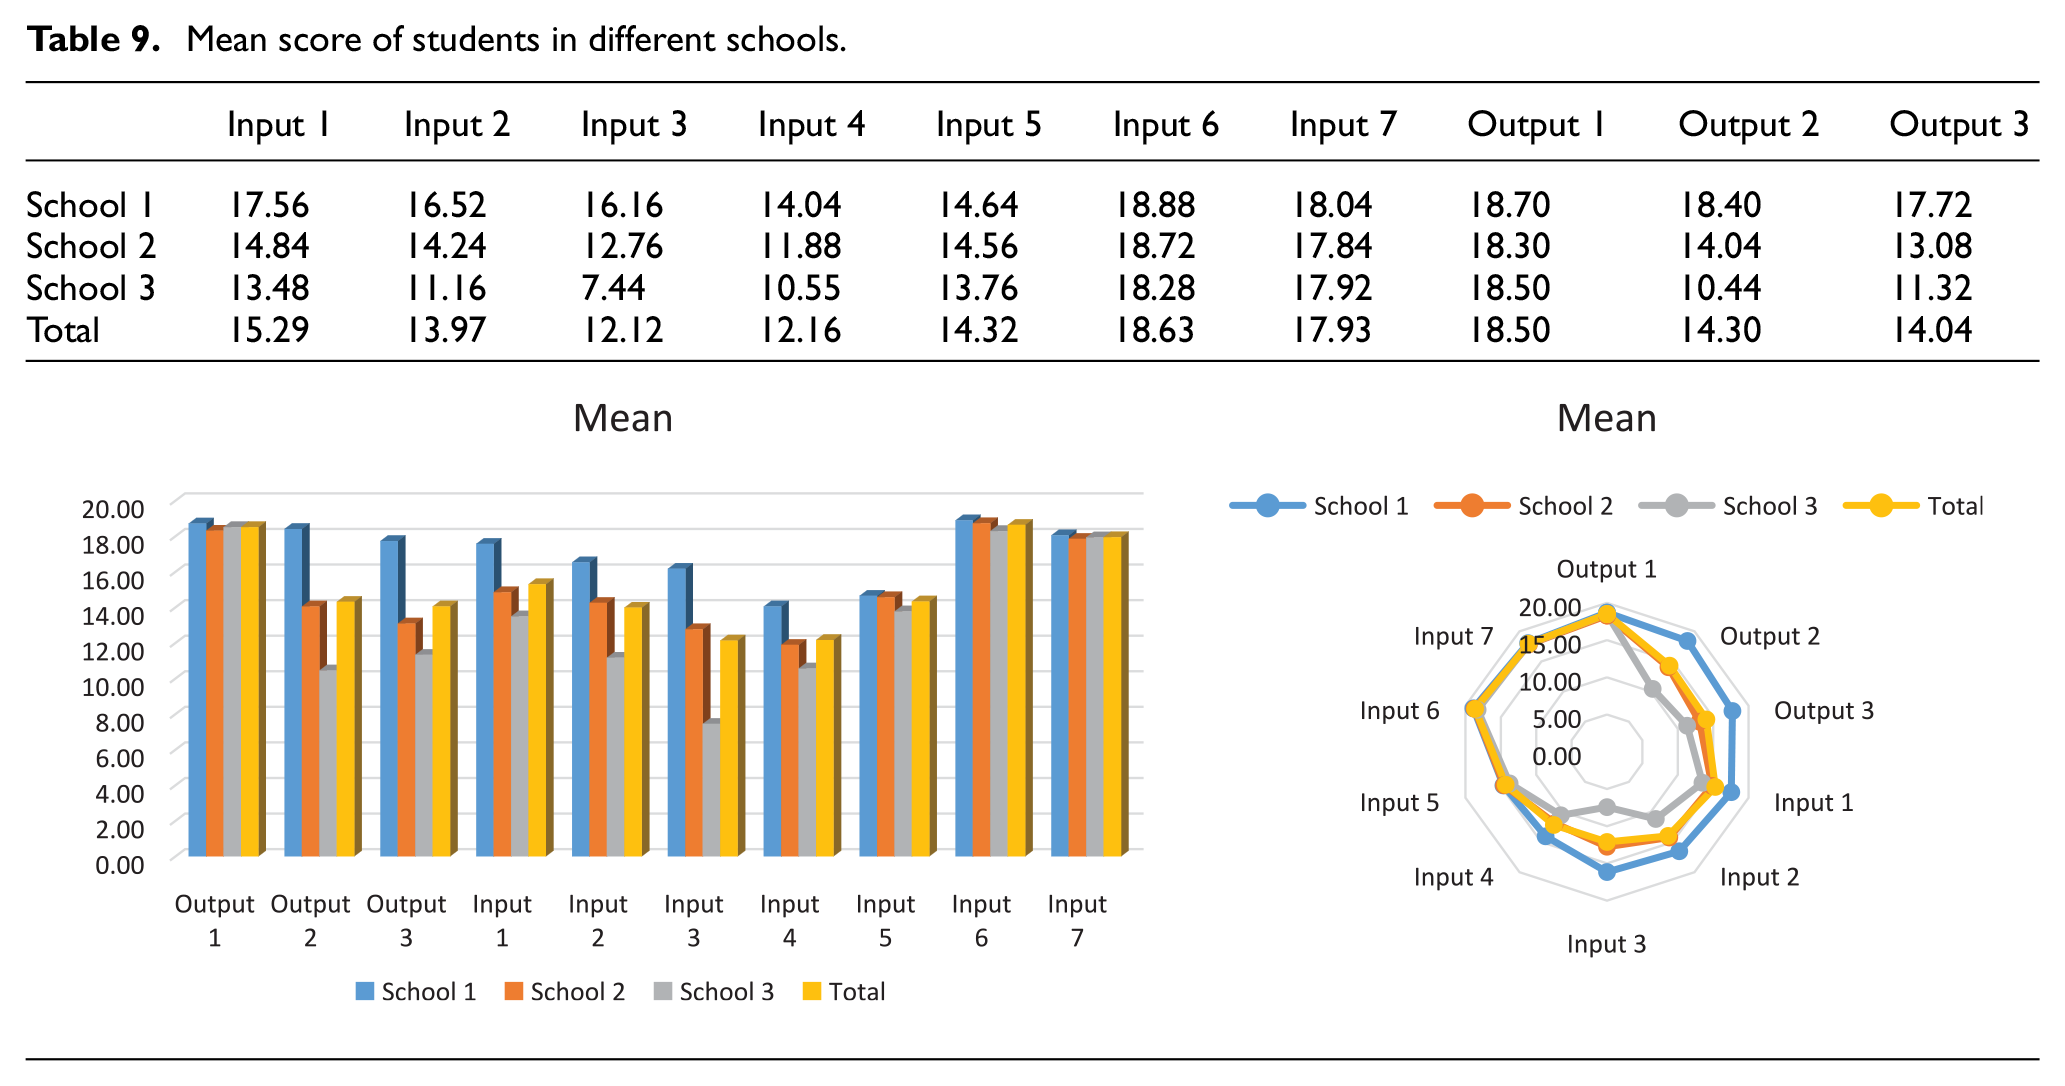
The result of the student’s mathematics test in the last year’s final assessment, the extent of the student’s interest in solving math problems and participation in classroom activities, and ultimately the student’s ethical discipline are the outcomes of the evaluation model; the scores of which are shown respectively in Tables 6–8. Moreover, in Tables 9 and 10, the mean and the variance of the scores for each input and output for the students of the schools 1-3 and the whole participants are specified, and their bar graphs and radar charts are plotted for a better comparison.
Assigned scores to the output 1.

Assigned scores to the output 2.

Assigned scores to the output 3.

Mean score of students in different schools.
Standard deviation of the students’ scores in different schools.

As it can be seen, the mean of the inputs 1 to 5 in school 1 is higher than school 2, and in school 2 is higher than school 3. The relatively low standard deviation of these inputs for all three schools reflects their low dispersion. The mean score of input 3 for school 3 is very low, and due to the low standard deviation of this input, it is concluded that the students in this school have very poor economic conditions. Inputs 6 and 7, which are about the quality of guardianship and the physical health of the students’ families, indicate appropriate mean score in the three schools.
Output 1, which is related to the results of the students’ mathematics test, has a very high mean score and low standard deviation in the three schools. However, outputs 2 and 3 which reflect the students’ classroom activities and discipline in school 1 are higher than school 2, and in school 2 are higher than in school 3. This shows that the economic situation of the students’ families is directly related to the students’ discipline and motivation to participate in classroom activities in mathematics class.
Now we examine the efficiency of the schools through the use of DEA method. Efficiency stands for not losing the resources, and it is derived from the ratio of the total output to the total input. An efficient unit is a unit that with regard to the inputs’ conditions had a desired output. On the other hand, an inefficient unit is a unit which compared to the other units and with regard to its potential input could have a better output but its output had not been a desired one. In DEA models, the solution to improve inefficient units is to reach the efficiency boundary. The efficiency boundary consists of the units with efficiency amount of 1; therefore, each unit with an efficiency amount greater than or equal to 1 is called efficient and otherwise is inefficient. Table 11 lists the number of efficient and inefficient units in three schools and in total.
Number of the efficient and inefficient units.

As can be seen, 95% of the students of school 1, 87% of the students of school 2% and 57% of the students of school 3 are efficient.
Those decision-making units which are evaluated efficient in DEA models all have the efficiency score of 1, so no distinction can be made between them. This is while most of decision makers are seeking a complete ranking of units, so that they can better evaluate their efficiency and take steps toward further improvement. Table 12 indicates the number of the ranks higher than, equal to and lower than 1 of each of the schools separately and in general through the efficiency values derived from the BCC output-oriented approach. The higher the ranking, the better the school students’ performance.
Ranking.

As it can be seen, the number of students with the efficiency greater than one is approximately equal in all three schools. School 1 has the highest number of students with rank 1, and school 3 has the highest number of students with the rank lower than 1.
Conclusion
In this paper, a comparative comparison was made among the three schools for boys in district 4 of Tehran in terms of efficiency. The findings of this study indicated the direct impact of various aspects of the economic, cultural, social and physical and mental health condition of the students’ families on the efficiency of their schools.
As can be seen, 95% of the students of school 1, 87% of the students of school 2% and 57% of the students of school 3 are efficient, showing that students of school 1 had a very good performance. School 1 had proper inputs and could have outputs with high mean scores. This school had been able to create a good motivation for the students whose families were in an appropriate condition in terms of the various economic, cultural, social and physical and mental health aspects, so that the students would be disciplined, would participate in mathematics activities and achieve a good result in the mathematics test. The mean score of the inputs and outputs of the students in school 2 was lower than school 1, and the number of students in this school was lower than school 1. School 3 did not have appropriate inputs and outputs compared to the other two schools, which shows that the number of inefficient students in this school is very high.
Footnotes
Declaration of conflicting interests
The author(s) declared no potential conflicts of interest with respect to the research, authorship, and/or publication of this article.
Funding
The author(s) received no financial support for the research, authorship, and/or publication of this article.
