
Abstract
Most of the research studies nowadays are trying to bring automation to biomedical engineering and Lab on a Chip which is fast growing interdisciplinary field and has attracted researchers from various fields. The objective of this paper is to present an overall system to control droplet movement inside microfluidic channel using fuzzy logic controller, image processing algorithm, and microvalves installed within microfluidic channel. A state space model has been derived from circuit analogy approach to describe the microfluidic network. Furthermore, a COMSOL-based study is primed for device structure by means of droplet generation and controlling the droplet through fitted valves. Moreover, an image processing algorithm based on active contours has been proposed in this research to track the movement of the droplet through the channel. This droplet controlling method is utterly based on fuzzy controller as well as camera images to move the droplet at desired position by controlling flow rates inside the fluidic channel using valves installed inside the microfluidic device. The results indicate that the fuzzy logic controller performs much better in terms of stability and faster response as compared to conventional proportional–integral–derivative controller.
Introduction
Microfluidics droplet techniques have revealed great promise for many different applications in various fields. Droplet-based systems are successfully employed in cell biology, food diagnostics, targeted drug discovery, drug delivery, and various other chemical industrial applications.1–5 Droplet microfluidics is also widely applied in enzyme kinetics, polymerase chain reaction (PCR)-based analyses, functional component encapsulation, crystallization studies of protein, and cell cultures as well as molecule and polymeric particle synthesis.6–12 Besides, its applications include adequate control of small volumes of substance, reducing quantities of reagents inside samplings, reduced analysis time, improved sensitivity, decreased detection limits, better screening with high throughput, and increased operational flexibility. These aforementioned recompenses are the fundamental properties of droplet-based microfluidic techniques which are highly integrated with innumerable fields. 13
Different techniques have been introduced for controlling droplet generation; alike electrowetting method which involves the electric field, variation can help in changing interfacial tension among surface and the liquid. Liquid wetting is produced as a result of activation of electrodes and switching off the electrode reserves. 14 The interfacial tension change is able to produce liquid finger and thereafter cutting off from the reservoir for producing the droplet. However, this process of elect wetting complicates the whole process because of electrodes and other equipment that would potentially interfere ongoing chemical process. Several active and passive methods have also been applied to control droplet shape and size, 15 but their application area is very limited and they are susceptible of fabrication defects. In case of passive fusion devices, the droplet coalescence is commonly achieved by a special design of microfluidic channels where the fusion elements are usually fitted. In 2008, Bremond et al. 16 have designed, expanded, and incorporated coalescence chamber inside the channel through which droplets are brought closer to each other and were merged before entering into the tapered channel. Fidalgo et al. 17 introduced a droplet fusion method that relied on surface energy pattern in microfluidic channel, which trapped and fused the droplet inside the channel.
However, this kind of approach has potential drawback of cross-contamination among the droplets on the patterned surface. Few other droplet trapping techniques were also presented through which most common was tripping pillar; rows of pillars were constructed inside the device which serves as passive fusion elements. First droplet has been trapped in the pillar array and was merged with next coming droplet just before the surface tension was filled up with hydraulic pressure.
Numerous studies for active fusion have been reported utilizing the external control developed using electric field18–21 as well as laser pulses 22 to trigger pulses. Synchronization of multiple droplets is a key factor to perform active droplet fusion efficiently since it relies on the droplet closeness with each other. Various designs have also been incorporated to synchronize the droplet in two parallel channels and merge them into a single channel downstream in order to achieve droplet coalescence effectively. However, parallel channel system can be affected by the flow rates. Furthermore, channel back pressure is also affects fusion efficiency. 23 Shemesh et al. 24 utilized a piezoelectric actuator for controlling droplet generation as well as allow them to merge downstream along the channel to form fused droplets having adjustable volumes and composition.
One of the most significant control components in a microfluidic system is microvalves that are utilized to control the timing, position, as well as rate of flow for generation of droplet in a microfluidic system. There are multiple appealing characteristics to consider when designing microvalves, for example, short response time, the low leakage rate, large operational temperature range, poor power consumption, and a small footprint. An additional desirable characteristic of designing a microvalve is the fact that it should be inexpensive, convenient to manufacture, includes a small footprint, can certainly function as the external valve going inside the channel, as well as also can easily be integrated with complicated microfluidic network. After reviewing briefly the existing literature, we cannot find any research on the entire system level application on droplet microfluidic system that is easy to develop, use, and is also least costly. Therefore, there is a pressing demand for a control system that can accommodate all the benefit mentioned above.
In this research, the system-level approach has been utilized for controlling the movement of droplet inside the microfluidic network which is the first of its kind. To grasp the goal, first a COMSOL-based simulation has been carried out for the characterization of the pin valve as well as the device itself. Also, two control strategies have been proposed to check the state space model of the microfluidic network such as fuzzy logic intelligent control strategy and proportional–integral–derivative (PID) control strategy. Furthermore, greedy algorithm for image processing has been proposed, which serves as the feedback to the controller. Experiments are performed to fabricate the device as well as the whole system including pin valves, controller, and image processing algorithm for real-time position control of the droplet inside the microfluidic network.
Operating principle
Entire system design
System consists of fuzzy logic controller designed in MATLAB. A user can input the desired position of the droplet in MATLAB which is further connected with the syringe pump through USB to UART cable. Two syringe pumps are linked to the T-channel of microfluidic device to generate droplets. One pump is for continuous phase, whereas the other pump is for dispersed phase. The objective of whole system is to match the current position of droplet to the desired position using fuzzy controller which essentially adjusts the flow rates via syringe pump.
When this desired position is achieved, the particular pin valve will certainly turn ON and fluidic flow inside channel will stop to obtain the droplet at that desire position. To be noted that we are considering monodispersed only. After the generation of first droplet, the solenoid valve was activated to stop the flow of dispersed phase; hence, no more droplets are produced during controlling of the first droplet. The adjustment of flow rates depends on input parameters “e” and “Δe,” provided by image processing algorithm to the controller. On the upper surface of the T channel, we have a thin polydimethylsiloxane (PDMS) layer termed as control layer. Pin valves are supported by a thin silicon layer which has been attached to the control layer as shown in Figure 1. The controller sends signal to the pressure pumps to stimulate pin valve, which then presses the PDMS layer resulting in blocking of whole channel. T H. 16 X 1 multiplexer is coupled with controller for selecting the particular pin to activate at specific time. The controller, however, controls the pins through selected lines and sends command signal to them. The greedy algorithm for image processing assists in locating the current position of droplet by determining the center of droplet at a particular instant by tracking the droplet movement. The working mechanism of this algorithm is explained in detail later on.
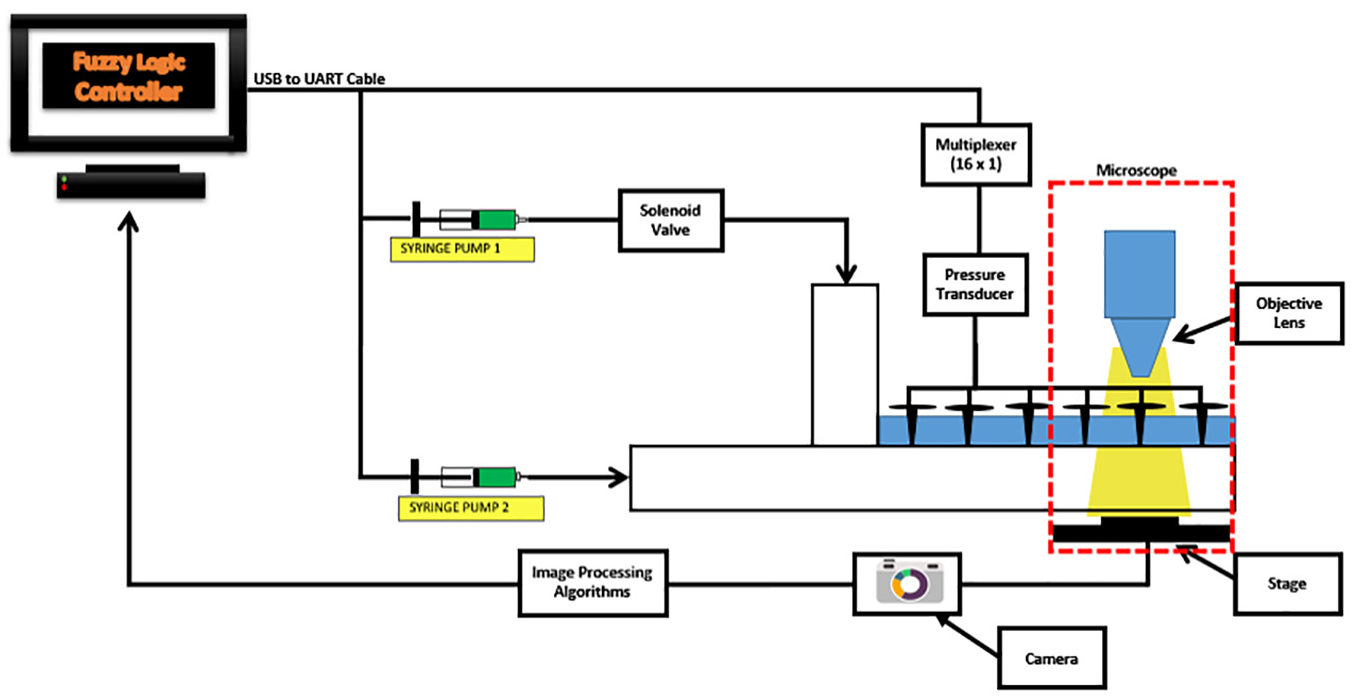
Overall system schematic design for controlling the droplet movement inside the channel of microfluidic devices.
Materials and methods
Device design and fabrication
A quite simple microfluidic device has been designed consisting of flow focusing region, illustrated in Figure 2. It contains two inlets named I1 and I2 as well as one outlet named O1 having a diameter of 2 mm. The width and height of main channel are 200 and 100 m, respectively. A standardized soft-lithography protocol is used to fabricate the microfluidic channel.
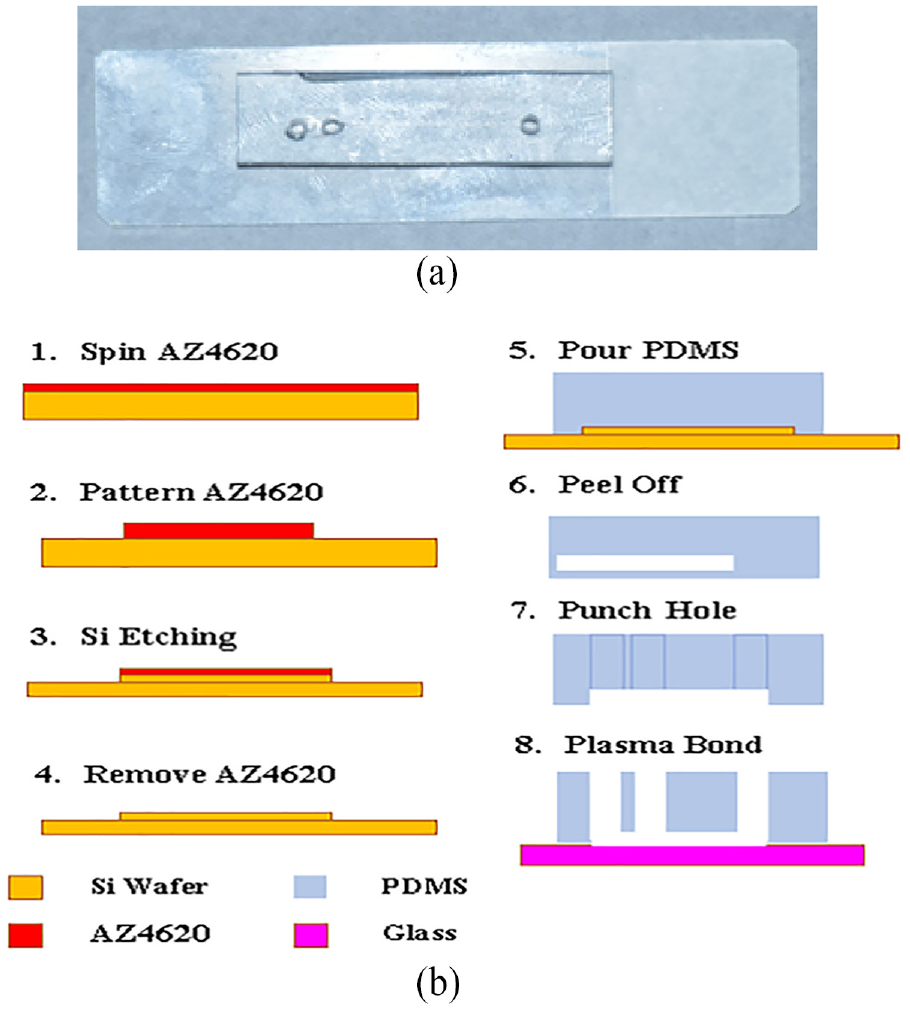
The fabrication and schematic of the device: (a) image of real PDMS device and (b) step-by-step device fabrication process.
A few of the substantial steps are given in Figure 2(b). Carefully, a positive photoresistor (AZ4620) was spun-coated onto a silicon wafer of 4 in at 4000 r/min for around 120 s to get thickness of 6 m. Afterward, this silicon wafer was prebaked for around 5 min at 100°C for 35 s in UV light, for 6 min in MIF developer AZ 300, and in the end post baked for 5 min at 110°C. For acquiring 100 m etching, a deep silicon etching device Plasma Pro System100 ICP380 has been utilized. Then, the silicon wafer was washed by de-ionized water and dried using nitrogen gas to remove the residual photoresistor. The Dow Corning pre-polymer, PDMS (Sylgard184), along with curing agent were assorted with a ratio 10:1 (w/w), de-gassed for removing bubbles and poured on a silicon wafer and cured at 78°C for 3 h. After that, PDMS with microchannel was bounded, demolded, and punched onto a glass slide with the help of plasma cleaner (PDC-32 G).
Material preparation for droplet generation
In this research, two different kinds of aqueous phases have been prepared, which include phosphate buffered saline (PBS, Life Technologies, Carlsbad, USA) and 8% polyethylene diacrylate (PEGDA, molecular weight 700 Da, St. Louis, USA). Oil phase is prepared using high purified white mineral oil (VWR International, Radnor, USA) consisting of 20% v/v Span 80 surfactant (Sigma-Aldrich, St. Louis).
It is examined that the viscosity of oil phase is improved by adding more surfactant and hence assist in droplet generation, specifically for relatively viscous hydrogel pre-polymer solution. Therefore, for the generation of hydrogel droplets, 20% surfactant is used widely. To measure the viscosity of PEGDA solution, a viscometer (Cannon instrument) is used.
Design of system model
Within a control volume, the transient fluid motion (CV) is determined using momentum and mass conservation, while steady-state flow is discussed by the Hagen–Poiseuille law that regulates laminar flow. The Reynolds transport theorem can be utilized to compare the CV laws of conservation with system forces, resulting in dynamics identical to mass spring dampers. Supposing that these inertia, damping effects, and stiffness are linear and are not related to one another, they can be modeled individually applying electric circuit analogy, and afterward added together choosing the superposition features of linear systems. Moreover, considering that the fluid flow within a channel is consistent and one dimensional, and droplets are moving at the same speed as the surrounding continuous phase, droplet dynamics can easily be explained with such a fluid model. The benefit of electric circuit analogy is present in its capability to scale up and illustrate large interconnected networks.
Electric circuit analogy
As per the assumption of linear system, a fluid element is represented by two separate CVs that actually move and accelerate with the fluid flow shown in Figure 3. The first CV is rigid and consists of an incompressible fluid as well as models inertial effects. The second CV models the effects of compliance and is flexible. The above two effects are used together by superposition of droplet velocity
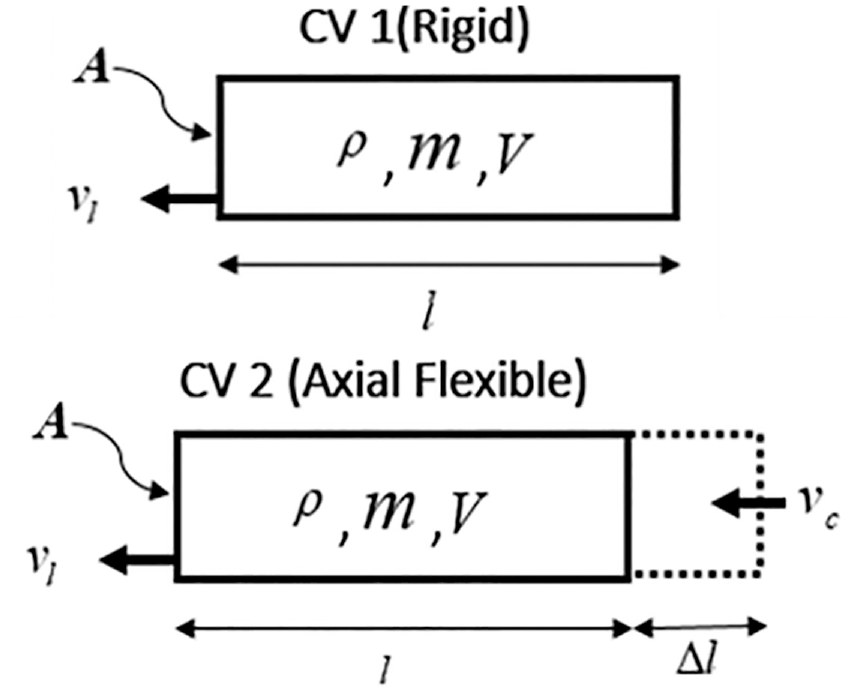
Control volumes move with respect to the fluid.
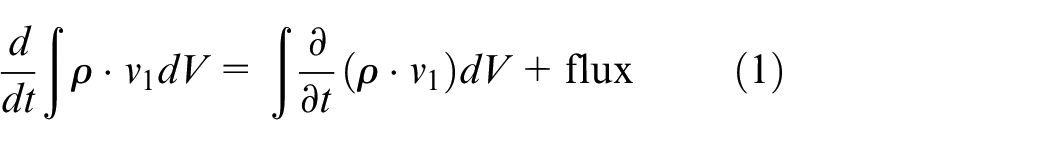
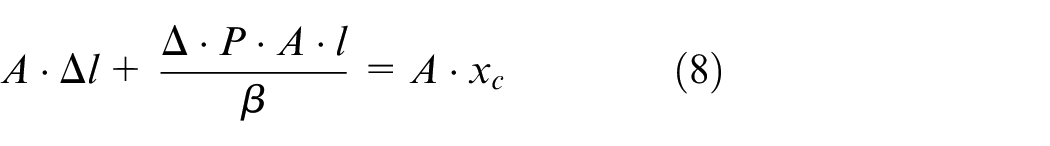
The result of employing conservation of momentum along with Reynolds transport theorem on the first CV is shown in equation (1). As CV1 is rigid and cannot be compressed, the flux term can be removed showing outcome in equation (2). Replacing net force with pressure difference (ΔP) and cross section area A, we get results as shown in equation (3).
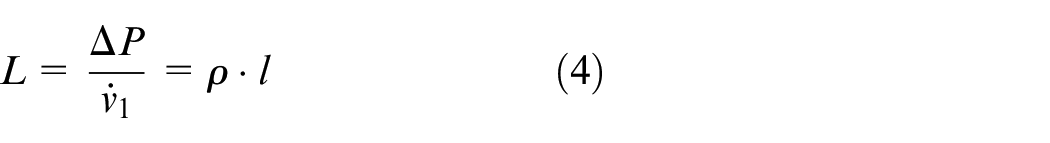
Constructing the analogy in a way that pressure difference is voltage, current is droplet velocity, and the inductance L of the fluid element can be calculated as equation (4)


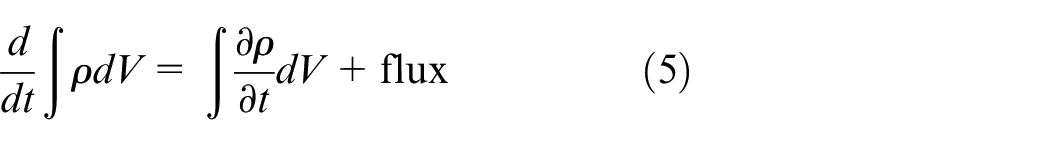
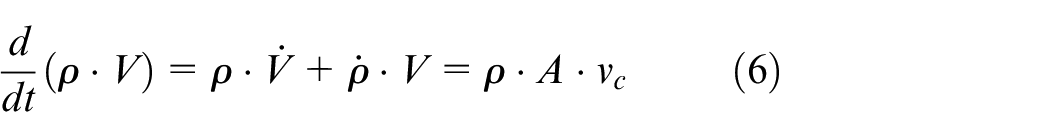
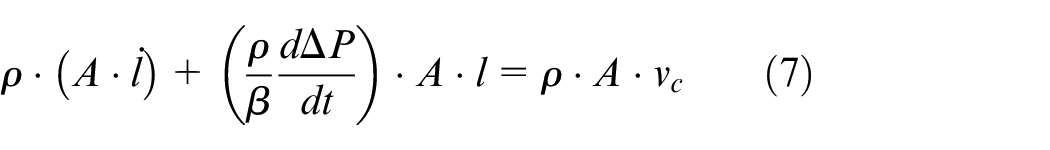
Employing conservation of mass to CV2 results in equation (5). By ignoring
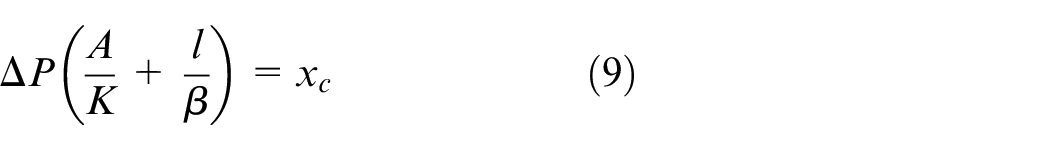
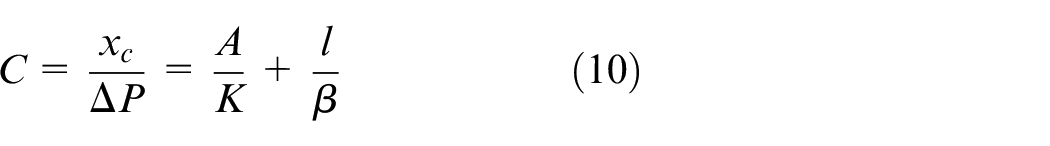
The resistance is derived using the Hagen–Poiseuille law, given in equation (11), which actually represents the damping effects of the fluid element
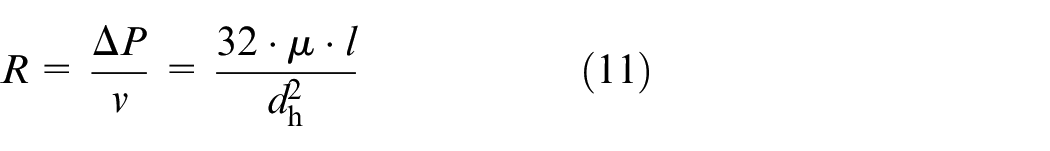
The channel and tubing dimensions along with the numerical values of inductance, resistance, and capacitance are used in this study.
Microfluidic channel network
Circuit analogy is applied to the microfluidic channel network. Representation of the T-junction selected for this study is shown in Figure 4. Among each component, an inductor and resistor are connected in series, under the reason that pressure drop ΔP is a result of both fluid inertia and laminar flow. Moreover, each fluid element is also attached to the ground using a capacitor, where ground indicates atmospheric pressure. The capacitor gets charged as PDMS expands and the fluid compresses. Figure 4 indicates the overall representation of microfluidic channel in terms of equivalent RL and C circuit where Req is equivalent resistance, Leq is equivalent conductance, and FL is the flow rate.
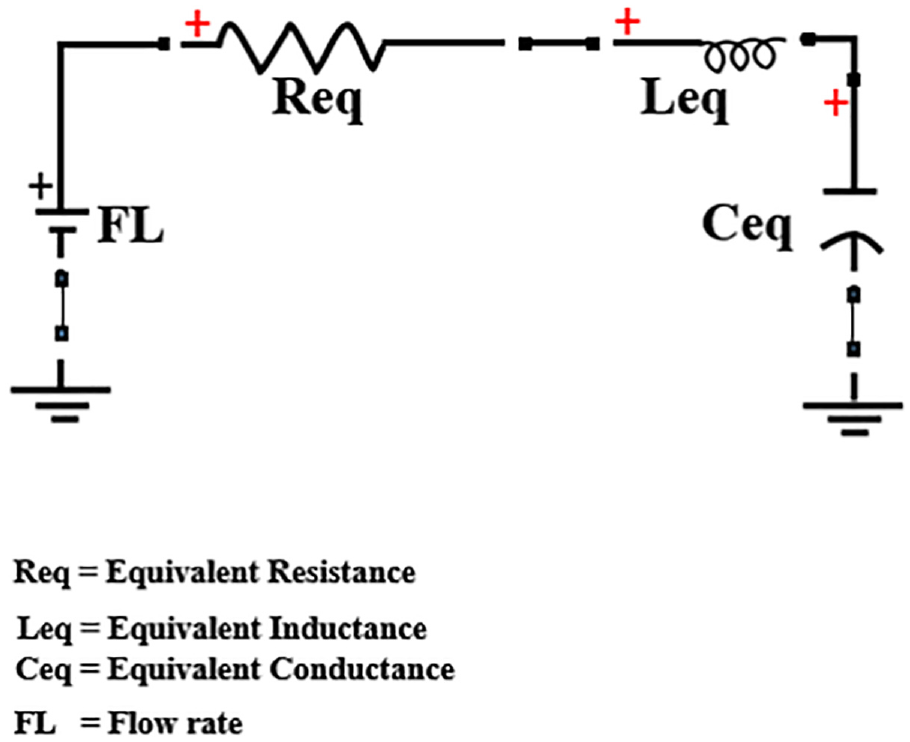
The overall representation of microfluidic channel in terms of equivalent R L and C Circuit.
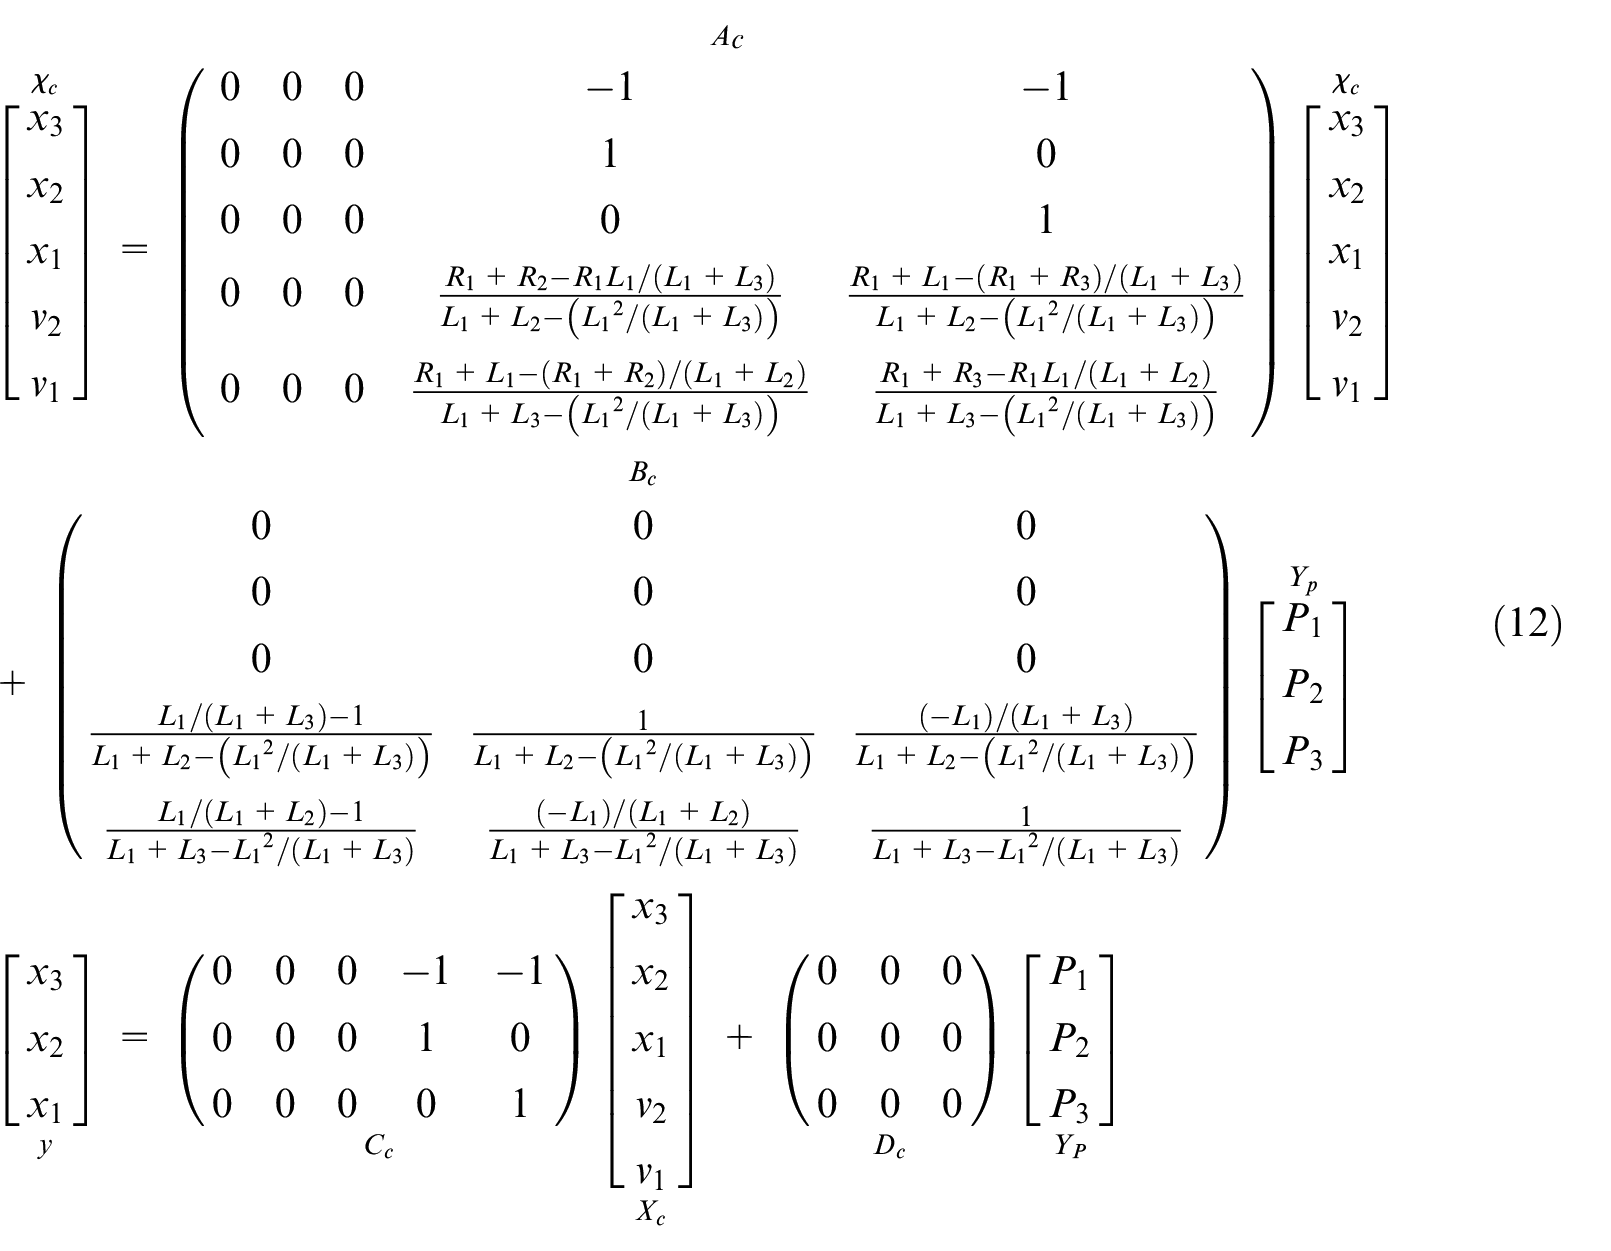
With the circuit representation in hand, it continues to extract the chip state space model
Combining chip model with pump model
The closed-loop system likewise contains the pressure pump that has its own mechanics as provided earlier. The common volumetric flow rate across a microfluidic chip is µL/min and performs properly within the electro-pneumatic transducer flow capacity.
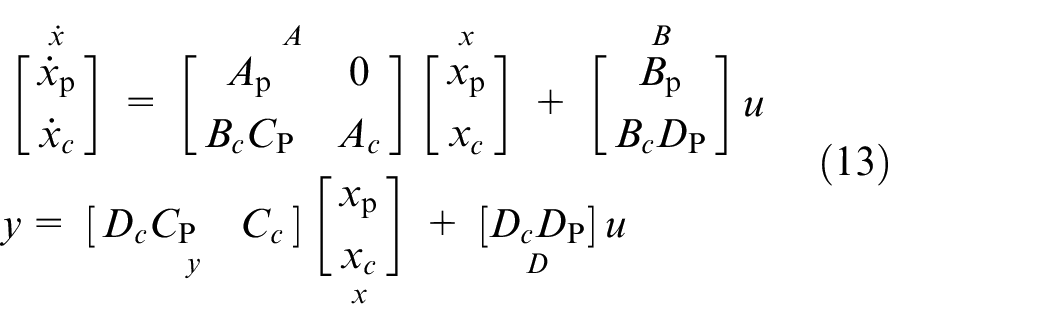
Considering this, the pressure from each inlet is independent from each other, and thus we can get the pump state space model (Ap, Bp, Cp, Dp). The chip model and the pressure pump model are interconnected in series shown in Figure 5, where the pump outputs behave as chip inputs. Using block diagram manipulation, the joined plant state space model (A, B, C, D) is defined using equation (13), whereby pump states xp and chip states xc combine together to become x
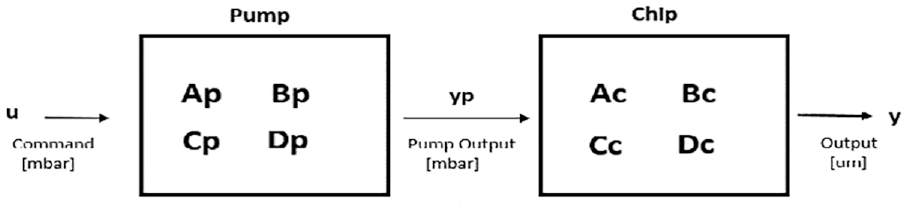
Pump and chip models attached in series.
Design of fuzzy logic controller
Any exact mathematical model for the system is not required to design FLC and rules can be defined using expert’s knowledge. This kind of approach provides the fuzzy logic controller a robust property as compared to conventional PID or state feedback controller. The entire operational mechanism of FLC is shown in Figure 6(c).
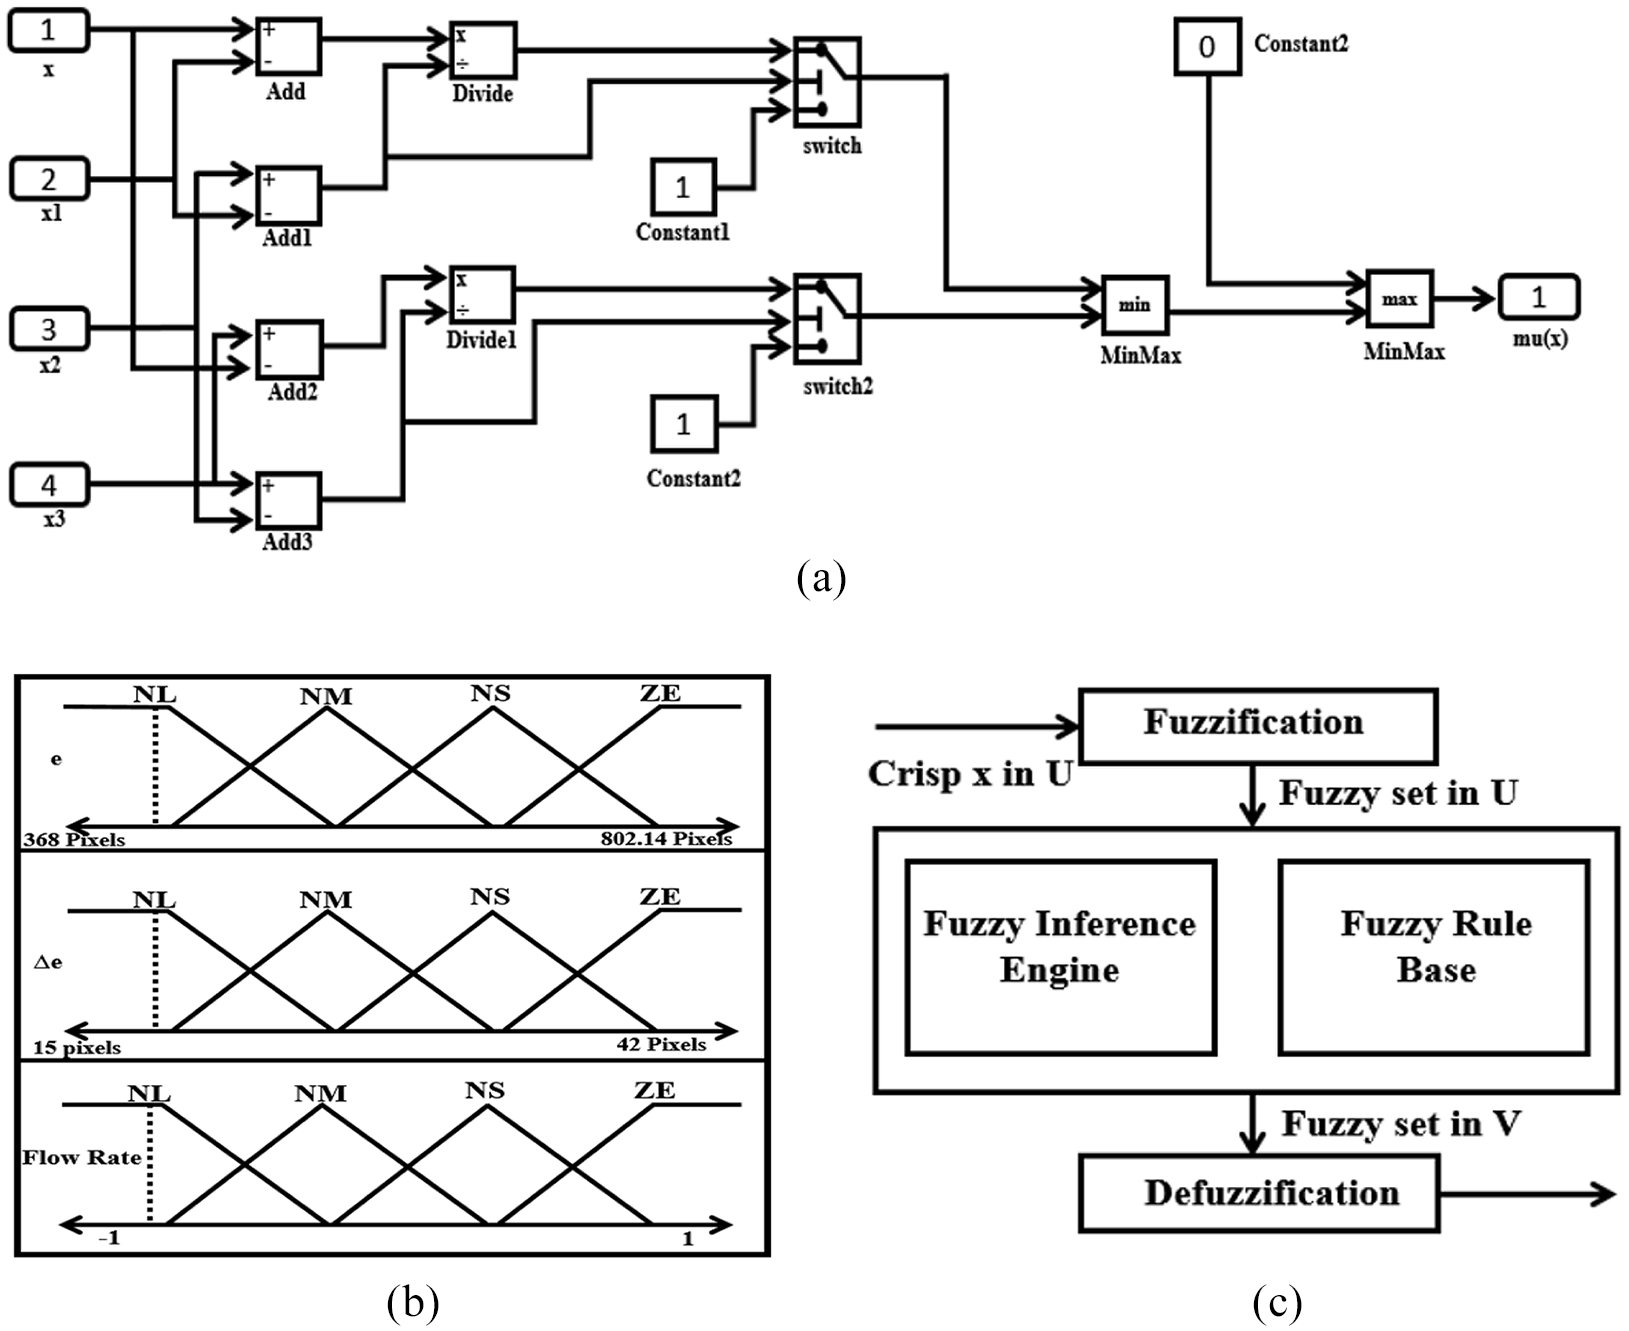
(a) The Simulink block diagram for generation of fuzzy triangular membership function. (b) The range of the triangular membership functions for inputs which are “e” and “Δe,” and the output which is the flow rate. (c) The overall working mechanism.
Membership function used for fuzzification
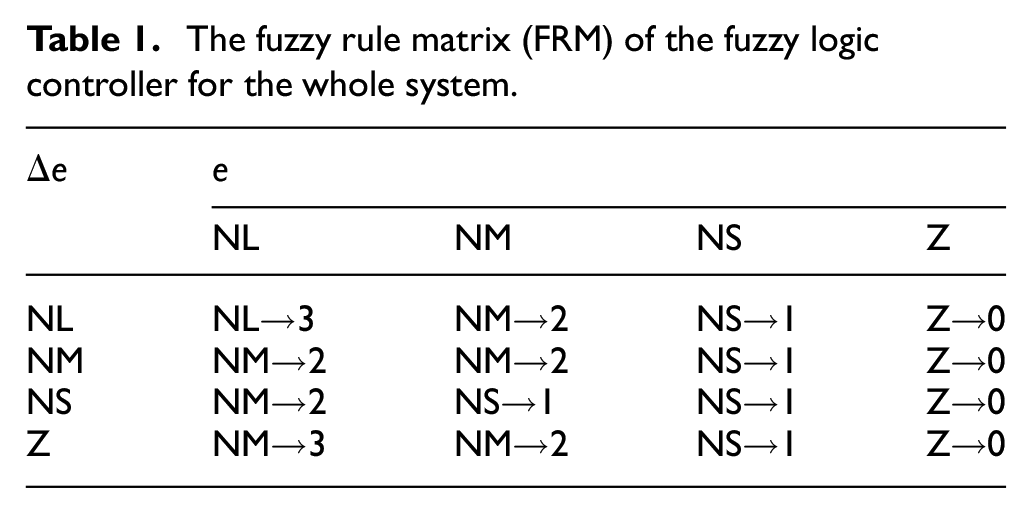
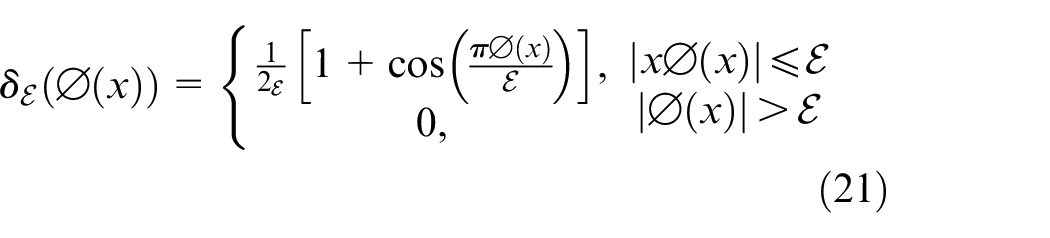
The membership function (MF), also known as characteristic function, helps in mapping each of the variables to a membership grade in between the values 0 and 1. There are various kinds of membership functions, for example, triangular, trapezoidal, Gaussian, and bell shape. In this study, we have utilized triangular MF which is characterized by
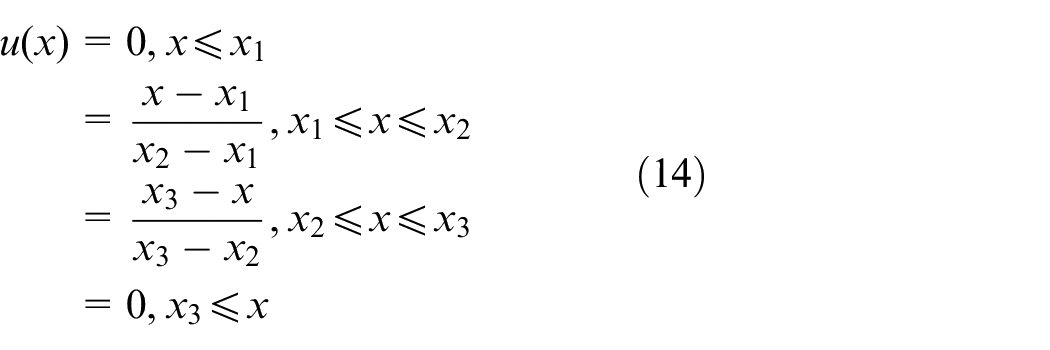
and determined the crisp values for three corners of triangular membership function. MF is generated in MATLAB, shown in Figure 6(a). The output of membership function corresponds to the crisp value input x. The selected membership function for both the parameters and their output flows is presented in Figure 6(b).
Fuzzification
After assigning MF to input variables, e and Δe, the very first step in any fuzzy interference system is fuzzification stage. The input values of crisp changed into fuzzified values based on MF and equivalent partitioned fuzzy subsets. In fuzzification approach, we have used the intersection of two sets A and B given as follows

where x is a binary operator for function T. The intersection operator is commonly known as Triangular norm (T-norm). It has been used in our design which is given as

Fuzzy logic controller has been implemented in MATLAB using min T-norm operator and the fuzzy set variables.
Fuzzy interference
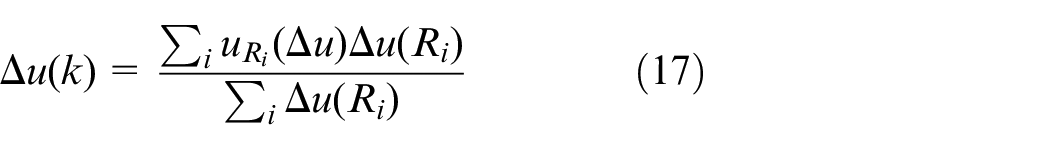
In fuzzy interference, “e” and “Δe” are changed into fuzzy numbers using fuzzy membership function. The control action manages the flow rates given by fuzzy rule matrix for different values of “e” and “Δe.” Obtained from human intuition, the 4×4 FRM is represented in Table 1 together with numeric representation of FRM. This FRM consists of 16 fuzzy rules to control the system.
The fuzzy rule matrix (FRM) of the fuzzy logic controller for the whole system.
In the output space, crisp values of every corresponding fuzzy subset are multiplied by membership degree, called strength. Maximum strength in the fuzzy subset is 1, which is considered as a crisp value and is used in multiplication process.
Defuzzification
Defuzzification is a process in which crisp values are extracting from the fuzzy sets. There are several defuzzification methods, for example, LOM (largest of maximum), BOA (bisector of area), SOM (smallest of area), COA (center of area), and MOM (mean of maximum). In our study, we have applied COA method. Defuzzified output by COA for discrete number of fuzzy rules is given by
where
Tracking algorithm for droplet movement
For tracking droplet movement, sequence of images is provided to greedy image processing algorithm. The key element of tracking algorithm is a result from the previous frame, except the first frame of a sequence that is used to find droplet location in the next frame. In our study, a greedy search has been designed and applied to find an approximate location of droplet. The variations between droplet movements in consecutive images are overlapped in this algorithm. As long as the detected contour of one droplet from previous frames touches the droplet boundary of current frames, the greedy algorithm continues to track the position of the droplet. The contour is drawn around droplet edges from the first frames to determine the center of droplet. At this point, the Euclidian distance from that center position of droplet to the desired position in the channel is measured which is considered as the error (e) for the current image. Change in error (Δe) will be regarded as the velocity of droplet that can easily be observed from error of previous image. In the light of e and Δe, recursive process of getting sequence of images undergoes this algorithm for acquiring the droplet position. These parameters are input to the FLC which then makes decision based on fuzzy matrix rule for changing flow rates.
First, greedy algorithm calculates total grayscale area enclosed by initial contour. Subsequently, it starts moving the initial contour using tiny step in four different directions that are two horizontal and two vertical directions. Total four new areas of grayscale are obtained at different positions and then their minimum is calculated. In case this minimum is less as compared to the initial grayscale, direction is assigned as the moving course and also the position of current contour is updated. The process continues unless termination condition is reached, that is, all of the new grayscales obtained from different directions are greater than or equal to the current values. The greedy algorithm is explained in Figure 7.
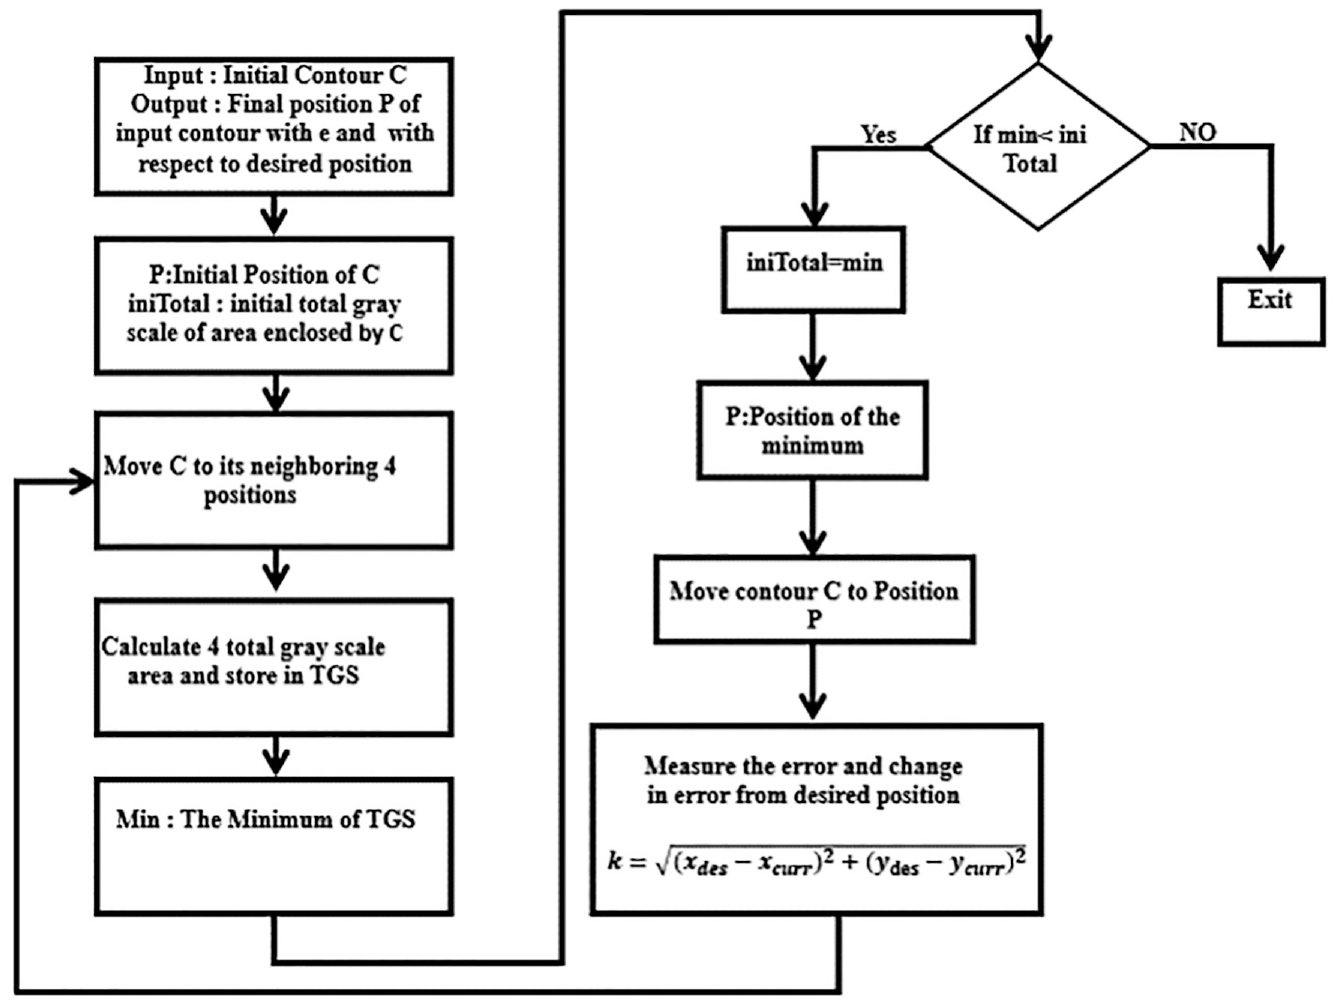
The greedy algorithm flow chart for tracking the droplet movement inside the microfluidic channel.
The algorithm designed for tracking droplet movement is robust. Since the droplet grayscale area is less than that of a background as well as the relative position of droplet in consecutive images is smaller, thus this algorithm will always go toward finding the local optimum, also called as global optimum. The proposed algorithm is simple, fast, and efficient as well as utterly adequate with system requirements as it takes decision on real-time basis to control the movement of droplet in a microfluidic channel. For segmentation, we have incorporated the competitive ability into active contours to make it more reliable and efficient.
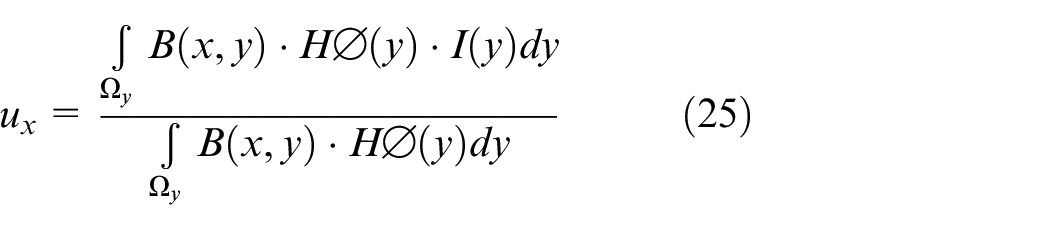
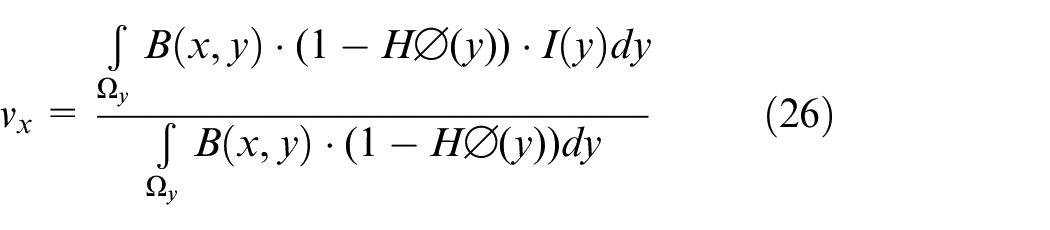
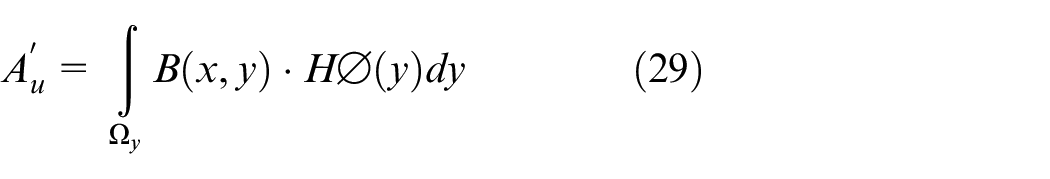
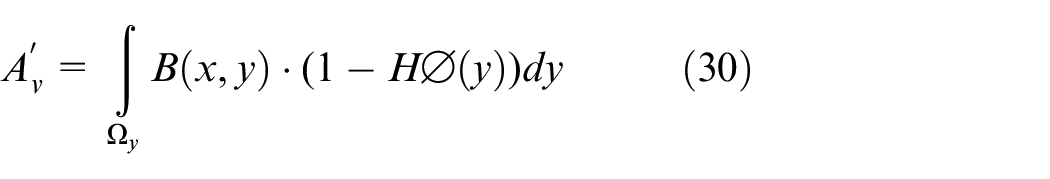
Localized region-based active contour
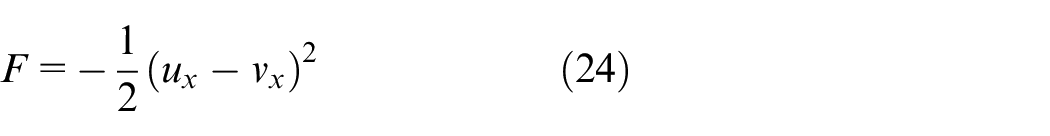
After completing the tracking process of droplets, we need to implement a localized region-based active contour model for segmenting the droplets. In this paper, we have obtained this localized model by introducing a well-known region-based active contour introduced in Yezzi et al. 25 into a localized framework. 26 We have selected the region-based active contour given in Yezzi et al. 25 because of its efficiency and simplicity. The region energy defined by this model is as given below
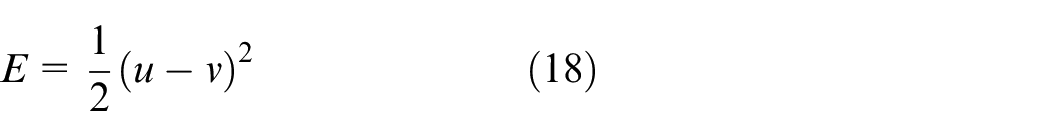
Here,
To find the maximum difference between
From Yezzi et al., 25 the related gradient flow for this energy is given by
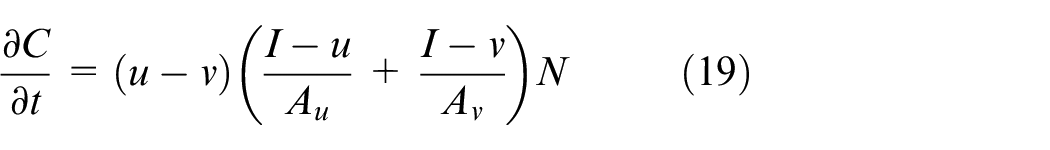
Here,
Despite many attractive properties, as it is still a constraint model after all, it has many limitations. So to boost up its performance, we have used localized framework from Chakraborty and Duncan. 26
In localized framework, the forehead and background are described as small local regions, and therefore, for guiding the motion of active contour only local energies are required. Hence, we can remove the global constraints and the active contour get localized. In this framework, along the curve, each point is considered separately and its neighbors are divided into local interior and local exterior because of the evolution curve. Using their local statistics, these two local models are modeled individually. Hence, a local energy can be defined. A point can be driven to move this energy in its own local region by minimizing it.
The localizing framework is defined as
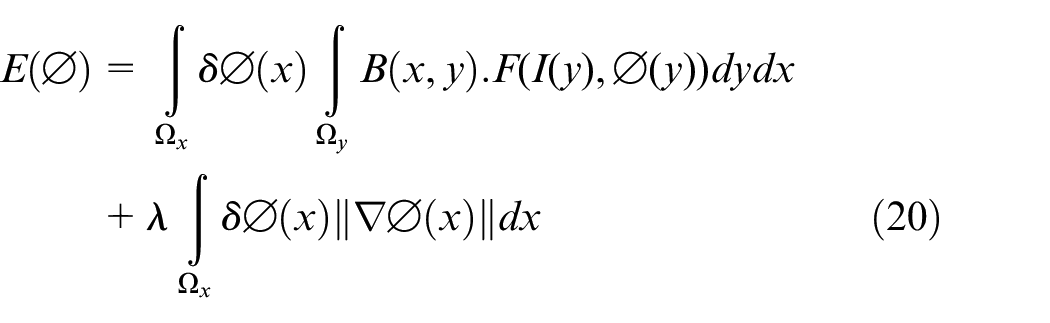
Here,
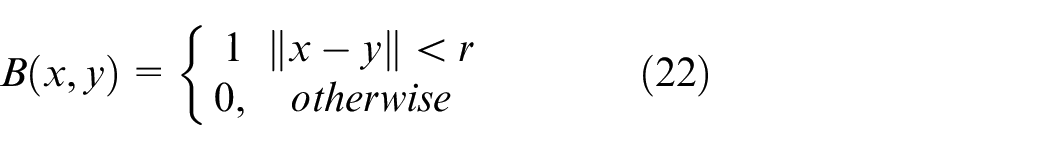
When the point y is inside the ball centered at
where
Once we have this localized framework, we now add the region-based energy (equation (19)) in this framework. For this sake, we first need to derive the essential internal energy F from equation (18) as follows
Here,
Here,
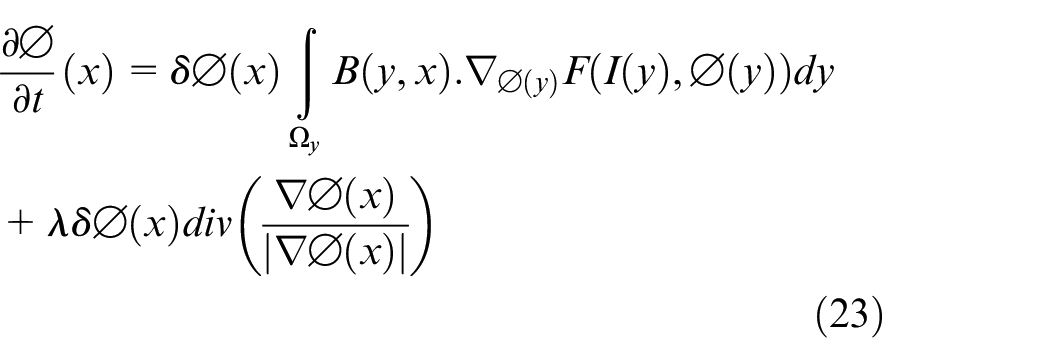
After that, by choosing the gradient of F, we further get
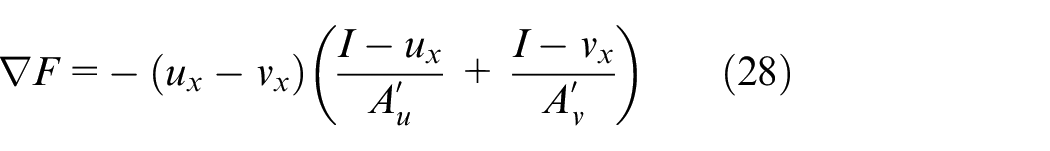
where
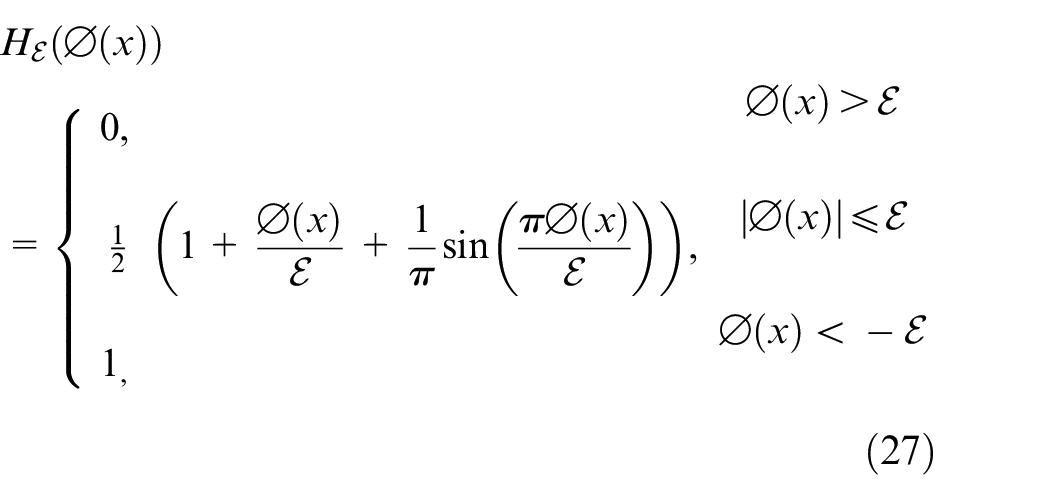
Finally, by applying
Along the curve, when
Incorporating competitive ability into active contour
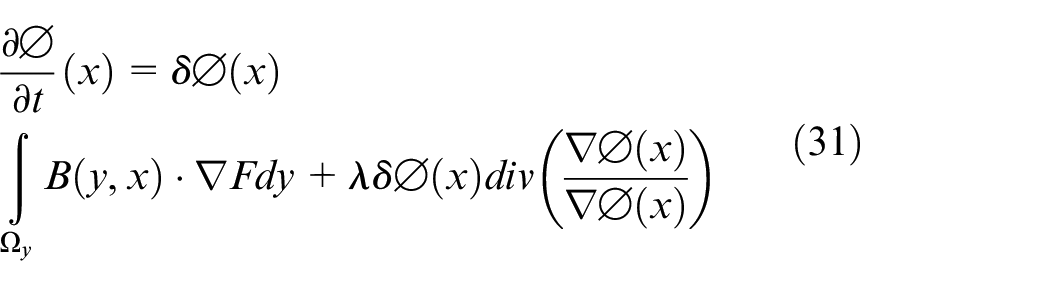
Although localized active contour contains many advantages as discussed, still it is not enough to achieve accurate segmentation in some circumstances, for example, in some situations, when two or more droplets drift and stick with one another as a result of flowing water. In such scenario, the active contour is not able to segment the target droplet as well as also can extract unwanted regions belongs to other droplets. The main cause for this failure is the interference of surrounding droplets. To cope with this issue, we utilize competitive ability into the localized active contour. With the help of this competitive ability, multiple objects can be segmented at the same time and accurately without being distracted by each other, and for this reason, it is very suitable for our localized active contour. In our study, a simple but competing algorithm is utilized with the localized active contour having competitive ability for touching droplets segmentation presented in Chakraborty and Duncan. 26 In this, a standard single level set evolution equation can be stated as below
where
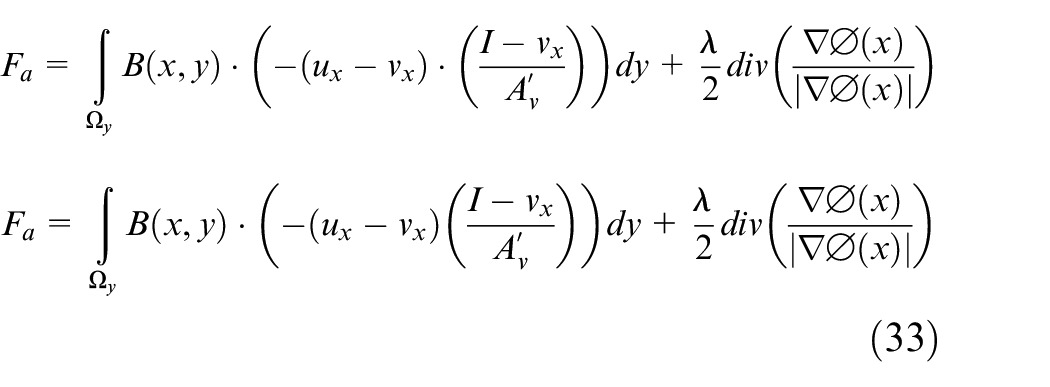
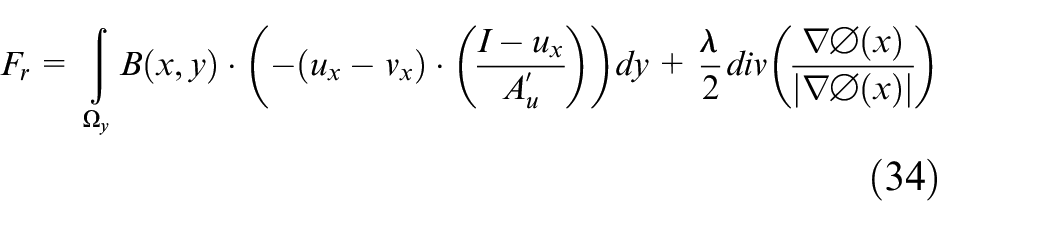
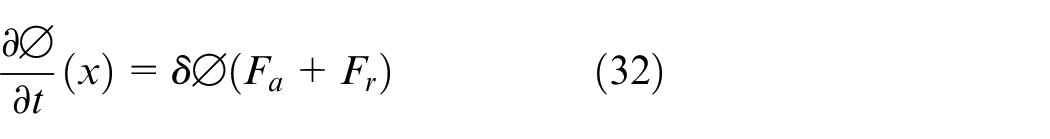
Using the competitive scheme from Chakraborty and Duncan, 26 the original level set equation (31) can be transformed into a similar one yet with competitive ability
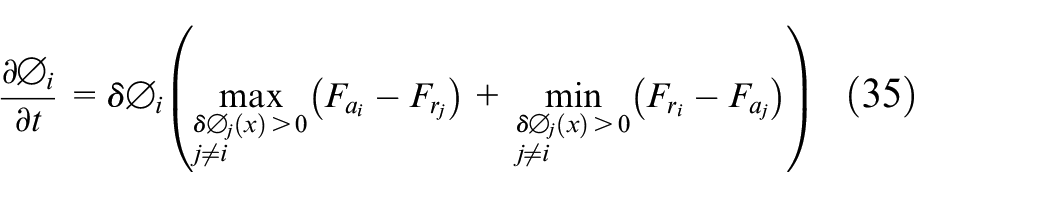
It is to be noted that the gradient flow (equation (35)) is for the
Implementation of level set evolution
We have taken two steps to accelerate the computation for the numerical implementation of gradient flow (equation (35)).
First, we have computed the update of level set function Ø around the zero level set only in a narrow band. Second, a reaction diffusion term 27 is applied into equation (35) to regularize the iterations of level set evolving with no re-initialization which is consuming a lot of time and may possibly deliver many unpredicted results. Once adding the diffusion term, we have iterative equation as follows

where
Using the above two steps, the computational cost of a level set evolving is minimized significantly. In addition, because of the intrinsic benefits of diffusion term (equation (31)), the outcomes of computation are quite accurate even if we are choosing a narrow band implementation. So in this way, we make our droplet segmentation process effective and efficient.
Summary
The segmentation method for droplet discussed above can be summarized as follows:
Initializing. The initial step of our droplet segmentation is done by segmenting the first frame in an image sequence. This segmentation approach can be carried out easily by any successful traditional method (e.g. watershed or region growing) because of the clear contours of droplets.
Droplet tracking. The segmentation results from prior frame work as initial position of contours for droplet tracking. Consequently, greedy search is applied for finding the estimate locations of droplets in the current frame.
Segmentation. From step 2, the search results are input into the active contour model as an initial contour. To prevent the leakage issue in some situations, we could expand the initial contours slightly. Soon after, the segmentation takes place.
Determine the termination. In case, if all the images in a sequence have already been processed, terminate the segmentation and exit. Otherwise, go to step 2.
Results and discussion
Experimental procedure and system setup
The whole system diagram is shown in Figure 8, showing the connectivity of FLC with camera, syringe pumps, and microfluidic device.
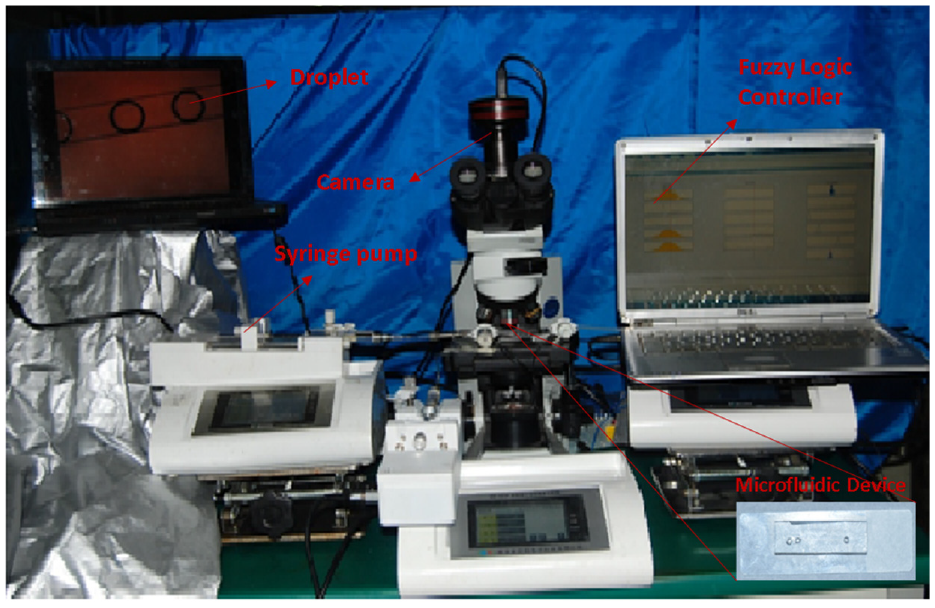
Overall hardware experimental setup for droplet control.
Geometry of device model and parameters estimation
First, we have simulated the T channel microfluidic device for generation of droplet; second, we control the droplet movement in microfluidic channel. Dimensions of the device are given in Figure 9.
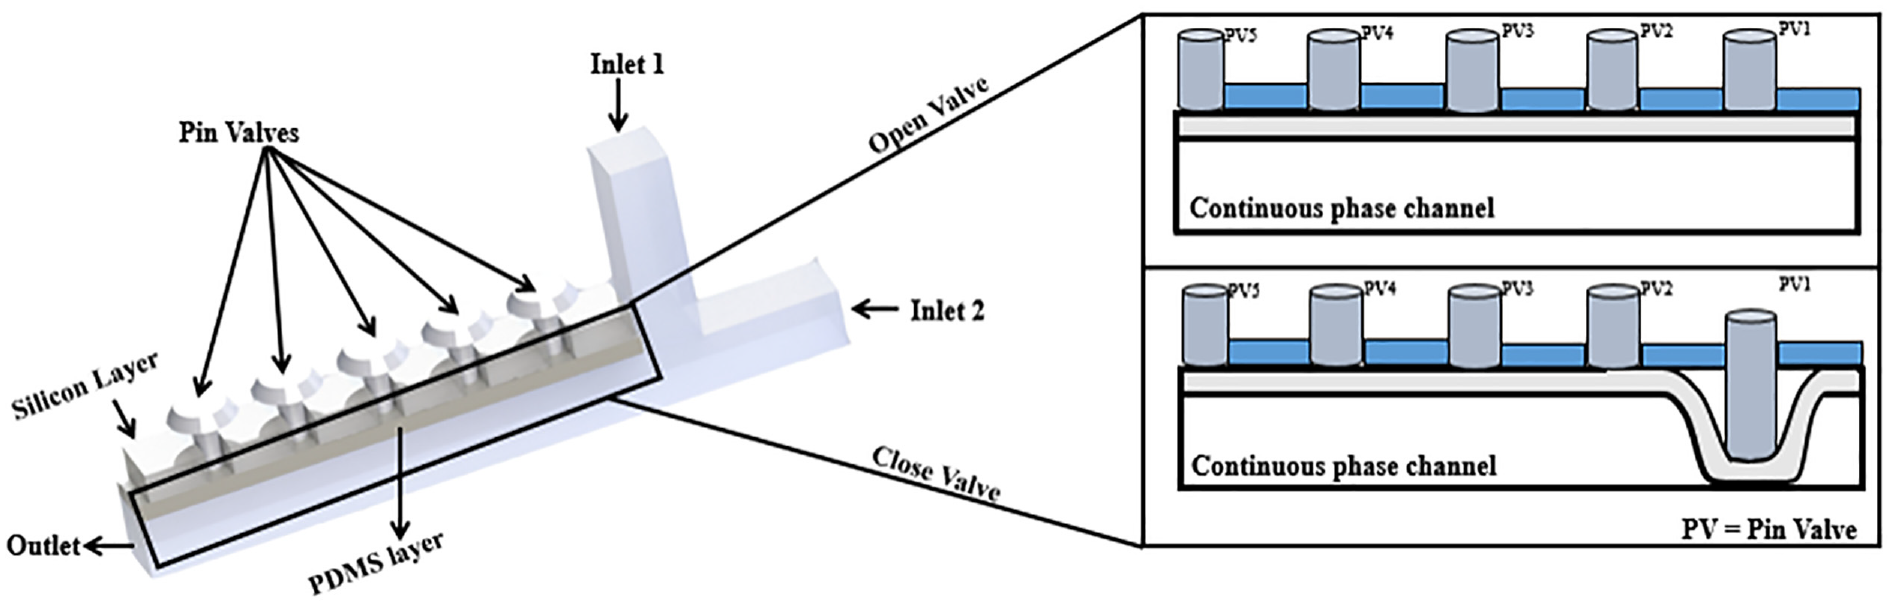
Detailed structure of T channel microfluidic device with Pin valves in open and closed form.
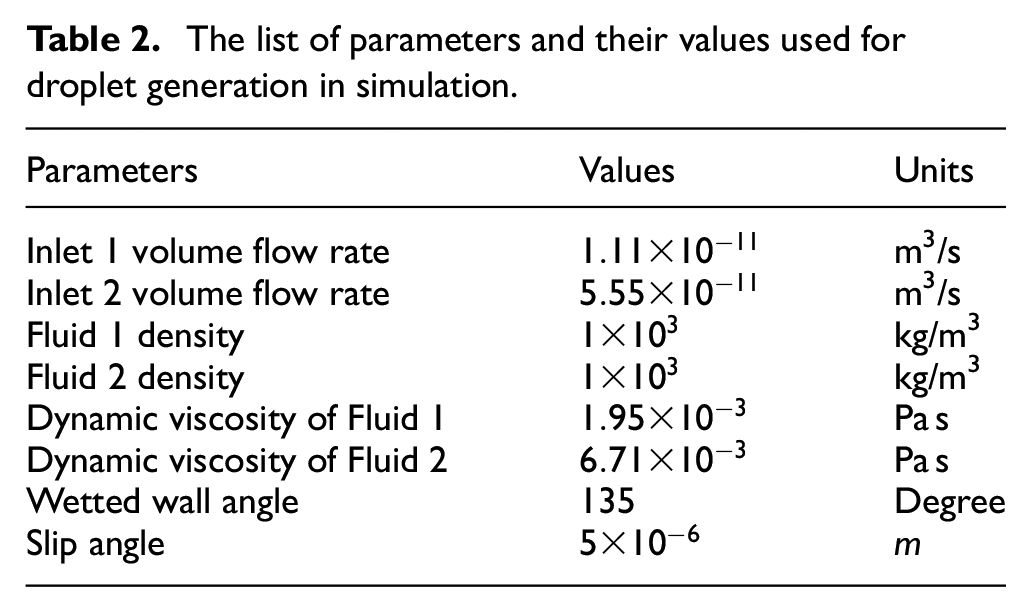
COMSOL Multiphysics is used to simulate the generation of droplet (Figure 10). Fluid 1 is set to be a continuous phase whereas Fluid 2 as dispersed phase. The flow directions and dimensions of microfluidic device are shown in Figure 9. Fluid 1 flows from left to right and Fluid 2 flows in the vertical direction from top to bottom. In the given model, Fluid 1 and Fluid 2 are defined as inlets. Surface coefficient is 0.005 N/m. The outlet defined as no viscous stress boundary condition and pressure at the outlet is same as atmospheric pressure. The condition of wetted wall boundary has been practiced to all the solid boundaries having contact angle specified whereas the slip length is equal to mesh size parameter. In this simulation, we meshed the model with hexahedral elements whereas the size of element is 1.25 × 10⁻⁵ m. The quadrilateral element has been used for boundary section.
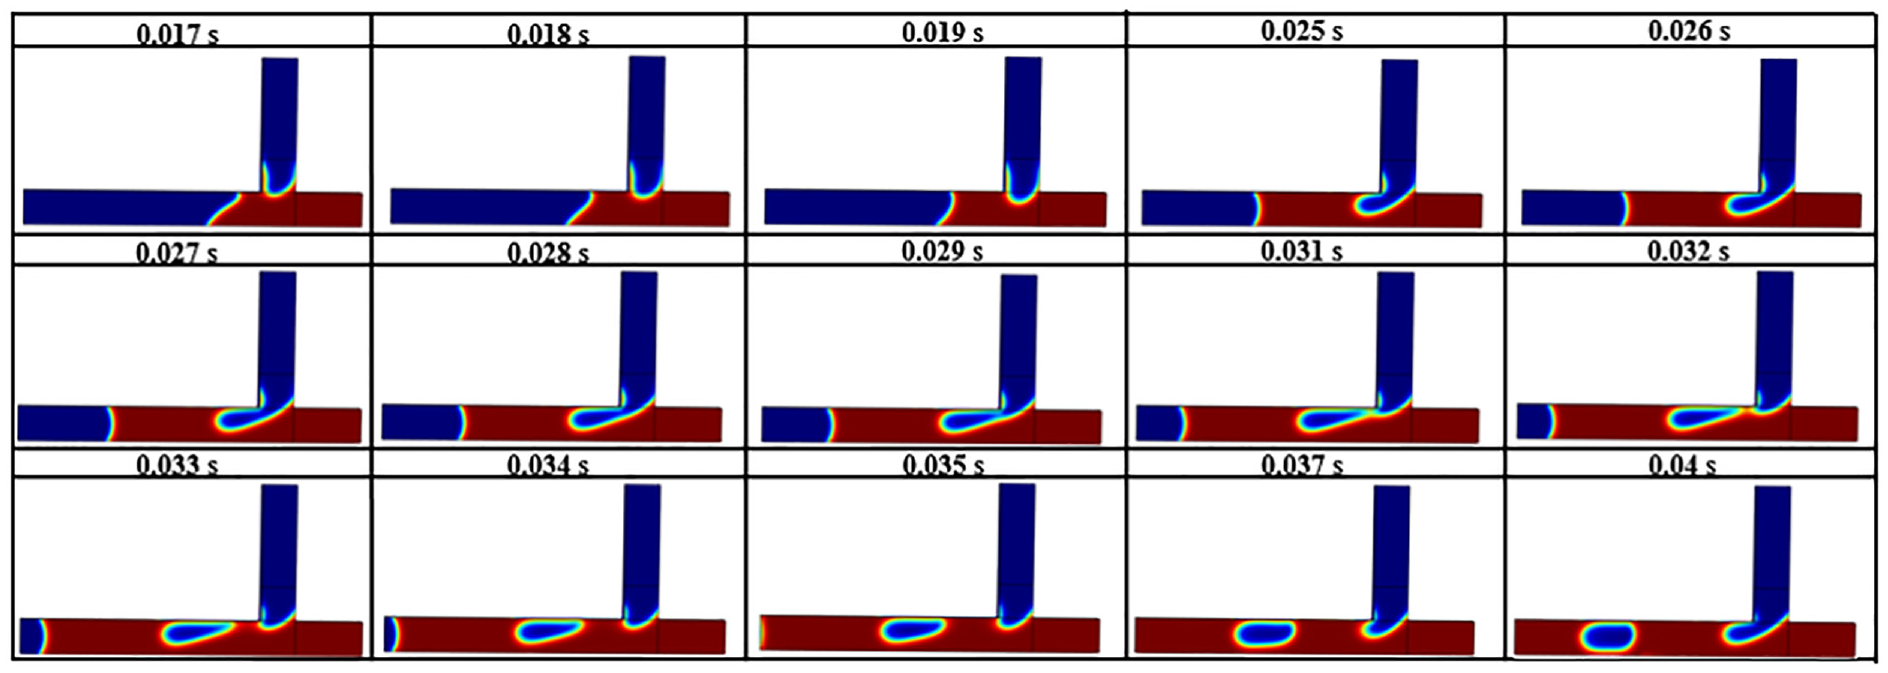
The generation of the droplet in T channel at different times.
The model used is two-phase flow and is able to generate monodispersed droplet in continuous channel. A continuity equation, a momentum transport equation, as well as a level set equation exists in this model. The equations are given below as
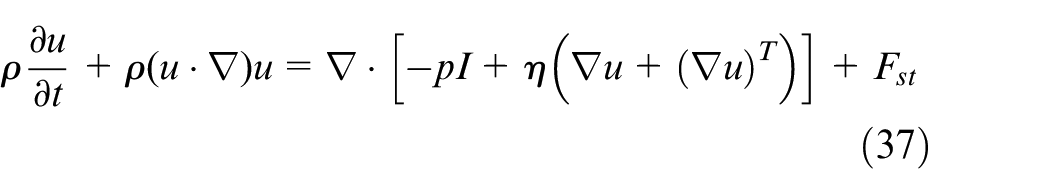

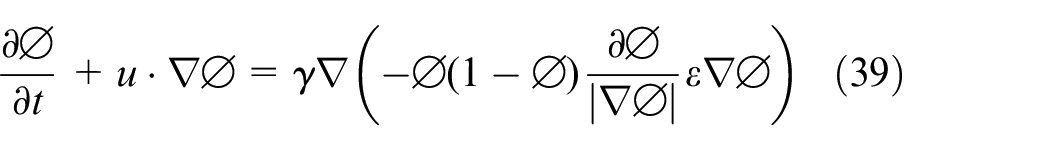
In the above equation,


where
The list of parameters and their values used for droplet generation in simulation.
Microvalves characterization
We have placed PDMS material on top of the channel and structure of the valve is given in Figure 11. The minimum pressure required is simulated to close the flow channel of cross section by simulating the system with COMSOL Multiphysics. Width of the PDMS material and depth of the channel were held constant at 3100 and 100 µm, respectively.
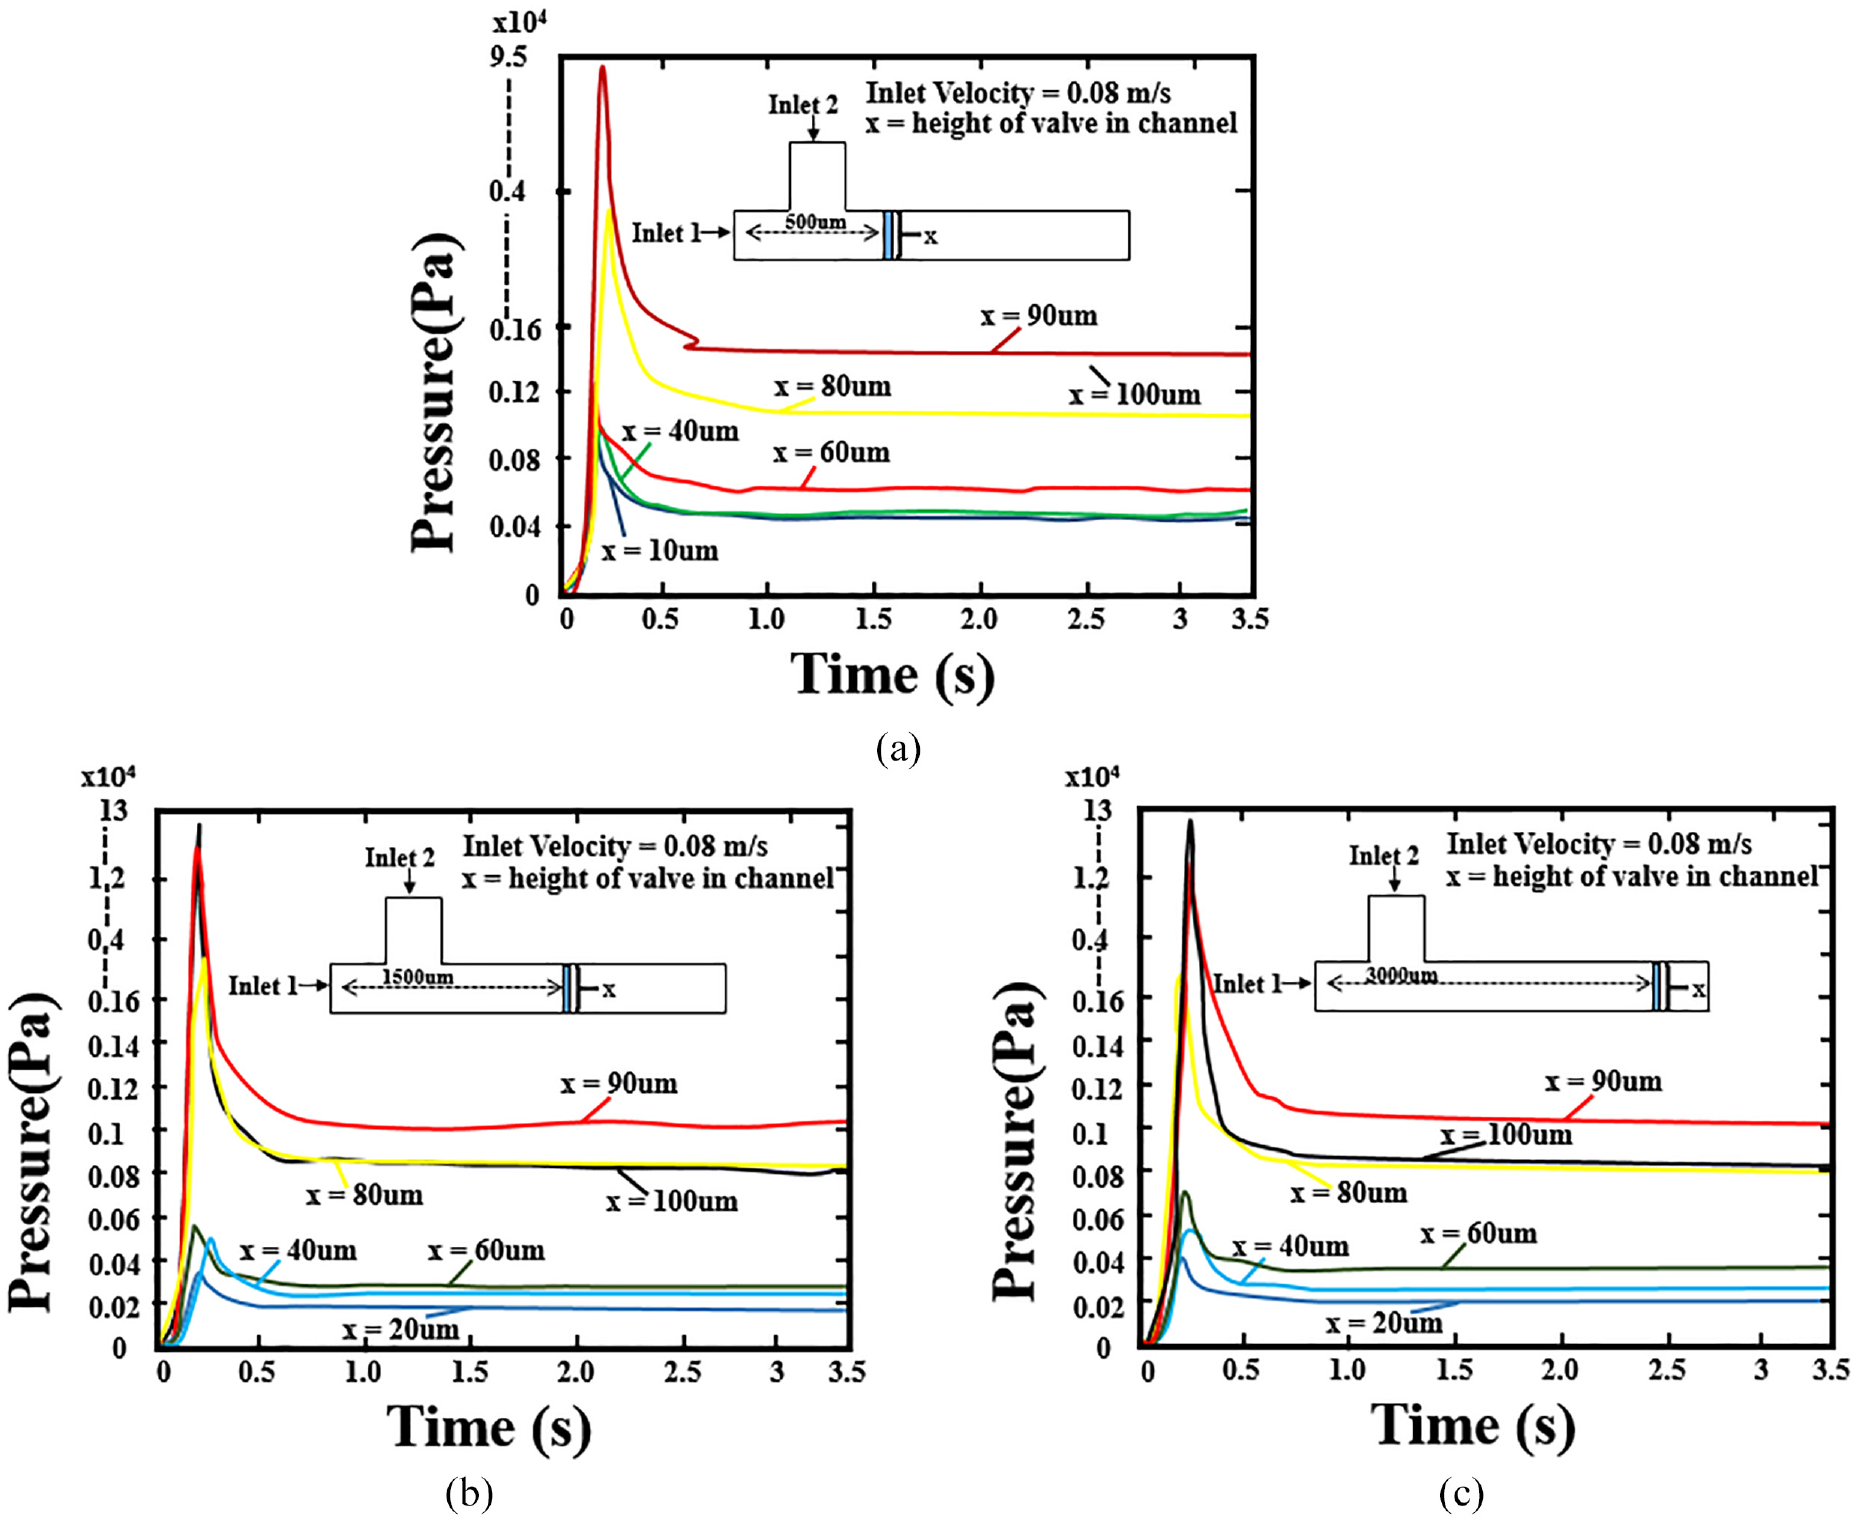
(a) Pressure on the valve inside the microfluidic channel at different positions inside the microfluidic channel at 500 µm from inlet 1. It is observed that as the height of the valve inside the channel increases, the pressure on valve also increases. (b) The pressure on the valve inside the microfluidic channel at distance of 1500 from inlet 1 in microfluidic channel and the highest peak is much larger as compared to distance of 500 µm. It is observed that as the height of the valve inside the channel increases, the pressure on the valve also increases. (c) The pressure on the valve inside the microfluidic channel at distance of 3000 from inlet 1 in microfluidic channel and the highest peak is much larger as compared to distance of 500 µm. It is noticed that as the height of the valve inside the channel increases, the pressure on the valve also increases.
A thin PDMS membrane was modeled as a near-incompressible Neo-Hookean material, adequate for rubber-like materials under large deformations. The library of COMSOL is Solid Mechanics and the value of Young’s modulus is 15 × 104 Pa, Poisson ratio is set as 0.41, and the density of the material is set as 910 kg/m3 for the simulation environment. Frictionless contact was enforced between the membrane and bottom flow channel surface while uniform pressure is applied on the top surface of deformed membrane.
Figure 14(d) shows displacement in PDMS material with applied pressure. There is a linear relation between the force applied and the displacement in PDMS material, which is due to the force applied within the elastic limit of the material.
To calculate the pressure exerted on the pin valve inside microfluidic channel, we have used fluid–structure interaction physics in COMSOL. The fluid flowing inside the channel is modeled by incompressible Navier stroke’s equation. Coupling between the fluid and structural domains was achieved by transferring boundary velocity and stress between fluid structure boundaries as shown in equations (14) and (15). A mesh independence study is conducted to ensure that a stable solution would maintain its accuracy without increasing the computational resources

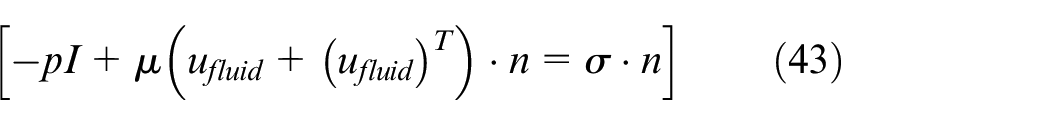
where
It is obvious that during the instant when channel is closed, pressure on pin valve increases.
Open valve (lift and drag) force on the droplet
Drag and lift coefficients are important for the droplet to be calculated at different points because of continuous phase inlet flow. Drag and lift coefficients are shown in the equations below
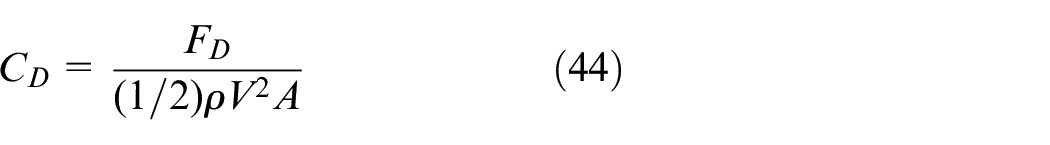
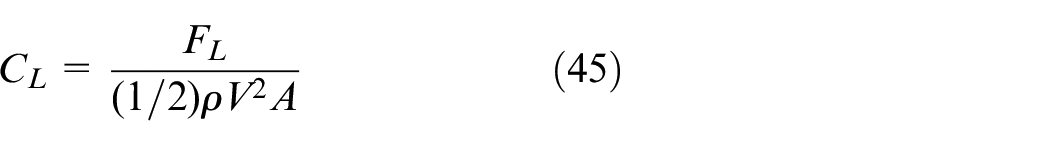
where
Results of image processing algorithm are shown in the Figure 12. It detects boundary of droplet and also recognizes the center of droplet as well as tracks its movement until it reaches the desired position.
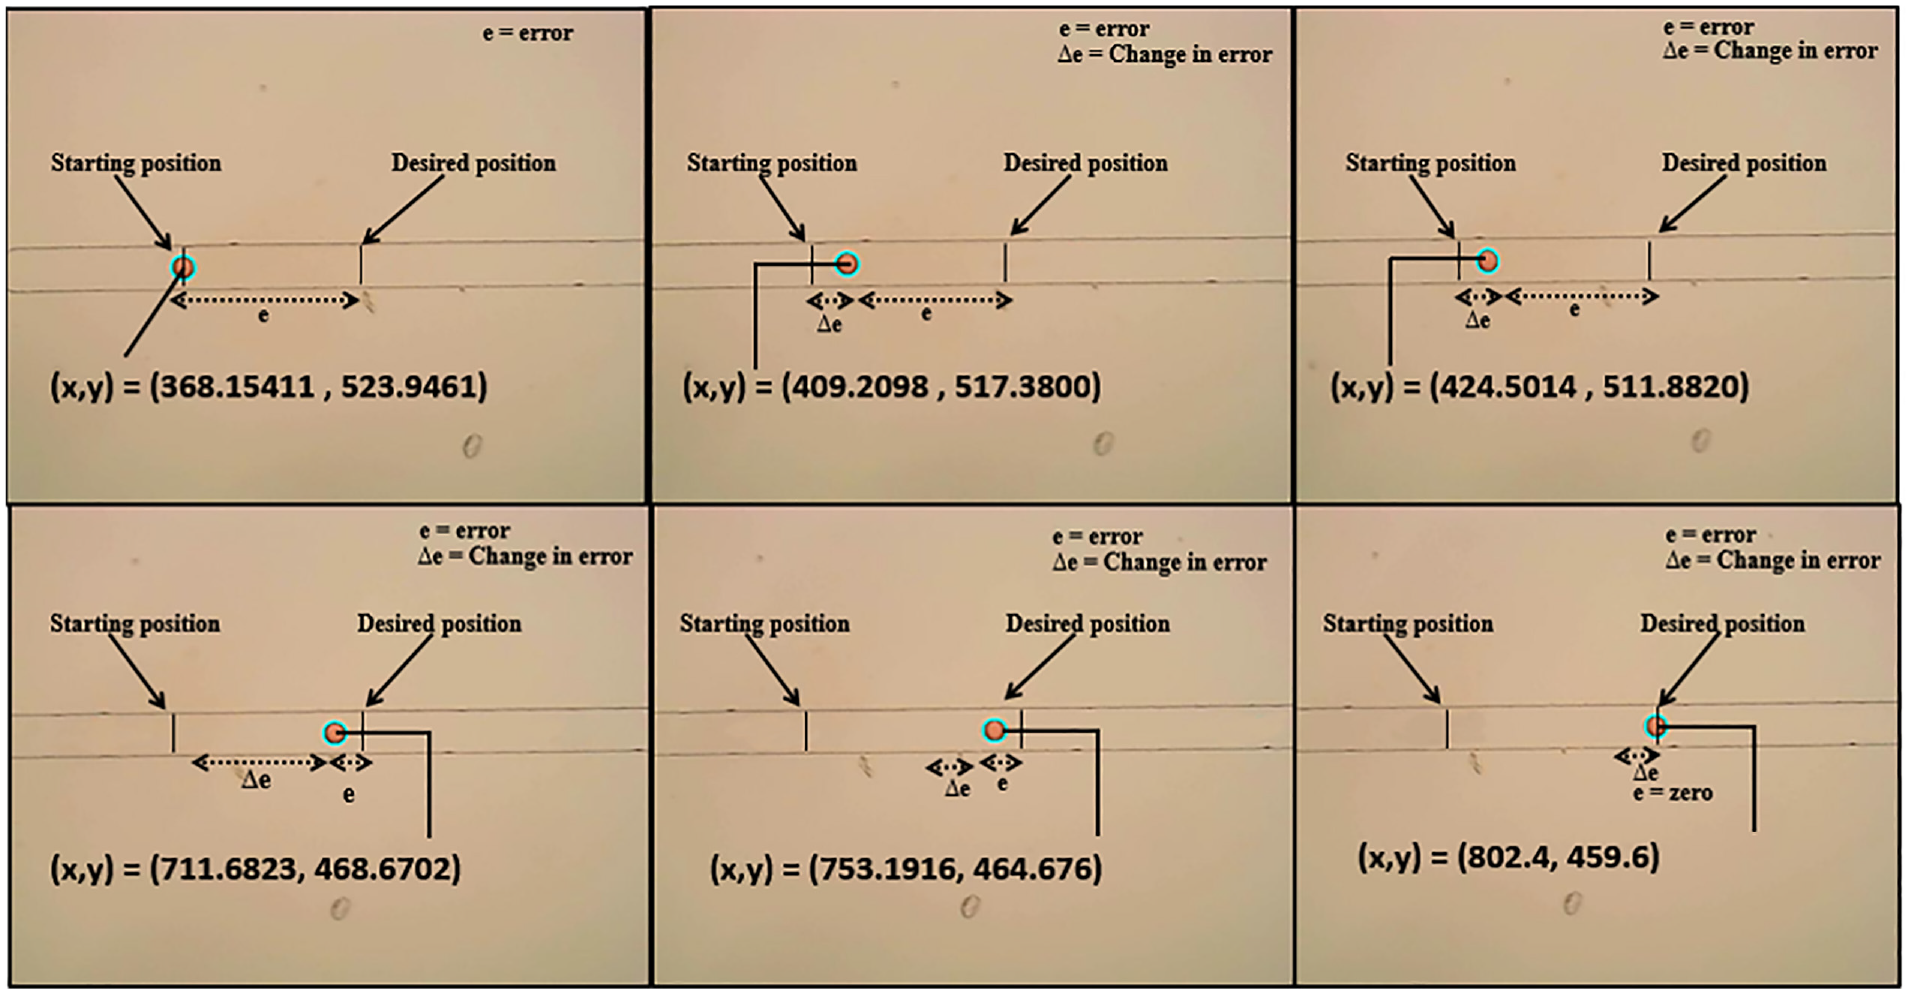
Results of greedy algorithm for tracking the position of droplet inside the channel obtaining the droplet center, error (difference from the reference position) and change in error (the difference from the previous droplet position to next frame droplet position).
MATLAB Simulink has been used to test the performance of fuzzy controller. Performance comparison between two controllers PID and fuzzy logic controller has been made.
For comparison between two controllers, that is, FLC and PID, we have developed the whole feedback control system in MATLAB as shown in Figure 13. The results are shown in Figure 14(c). It is evident that fuzzy logic controller reacted more efficiently and almost have zero steady-state error while on the other hand PID controller is slow and have a large steady-state error.
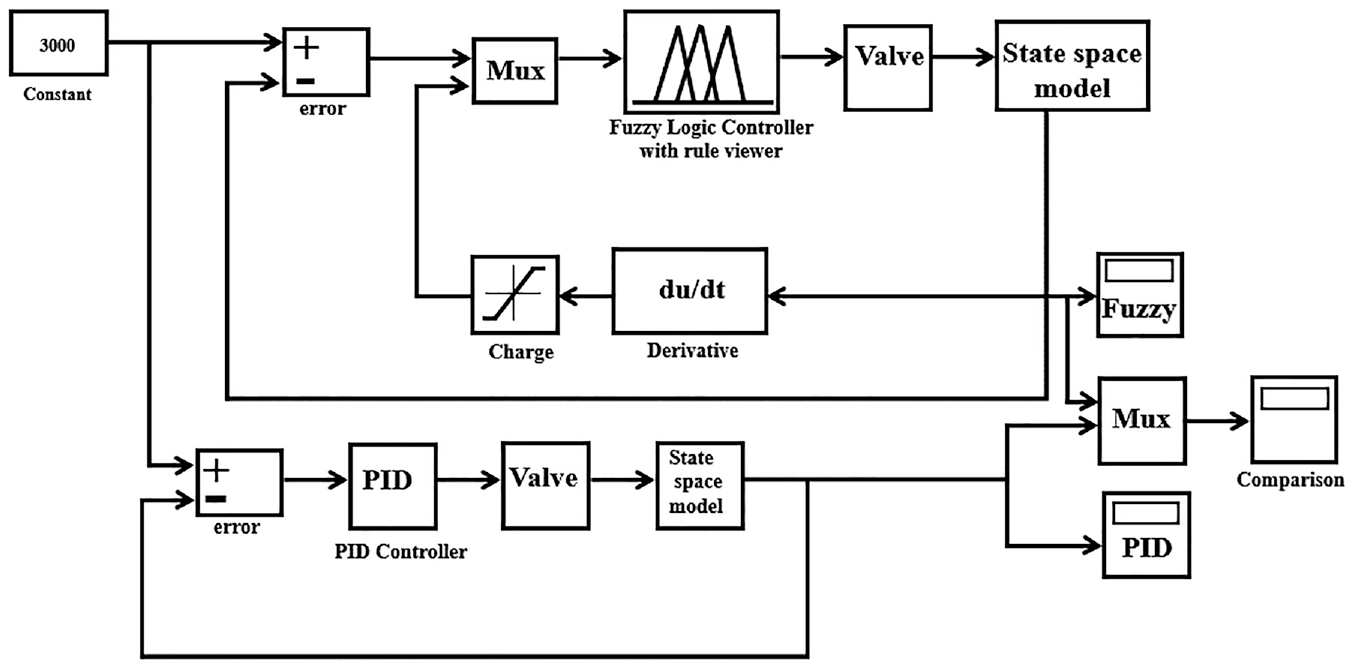
Comparing the performance of fuzzy logic controller with PID controller through feedback loop for position control.
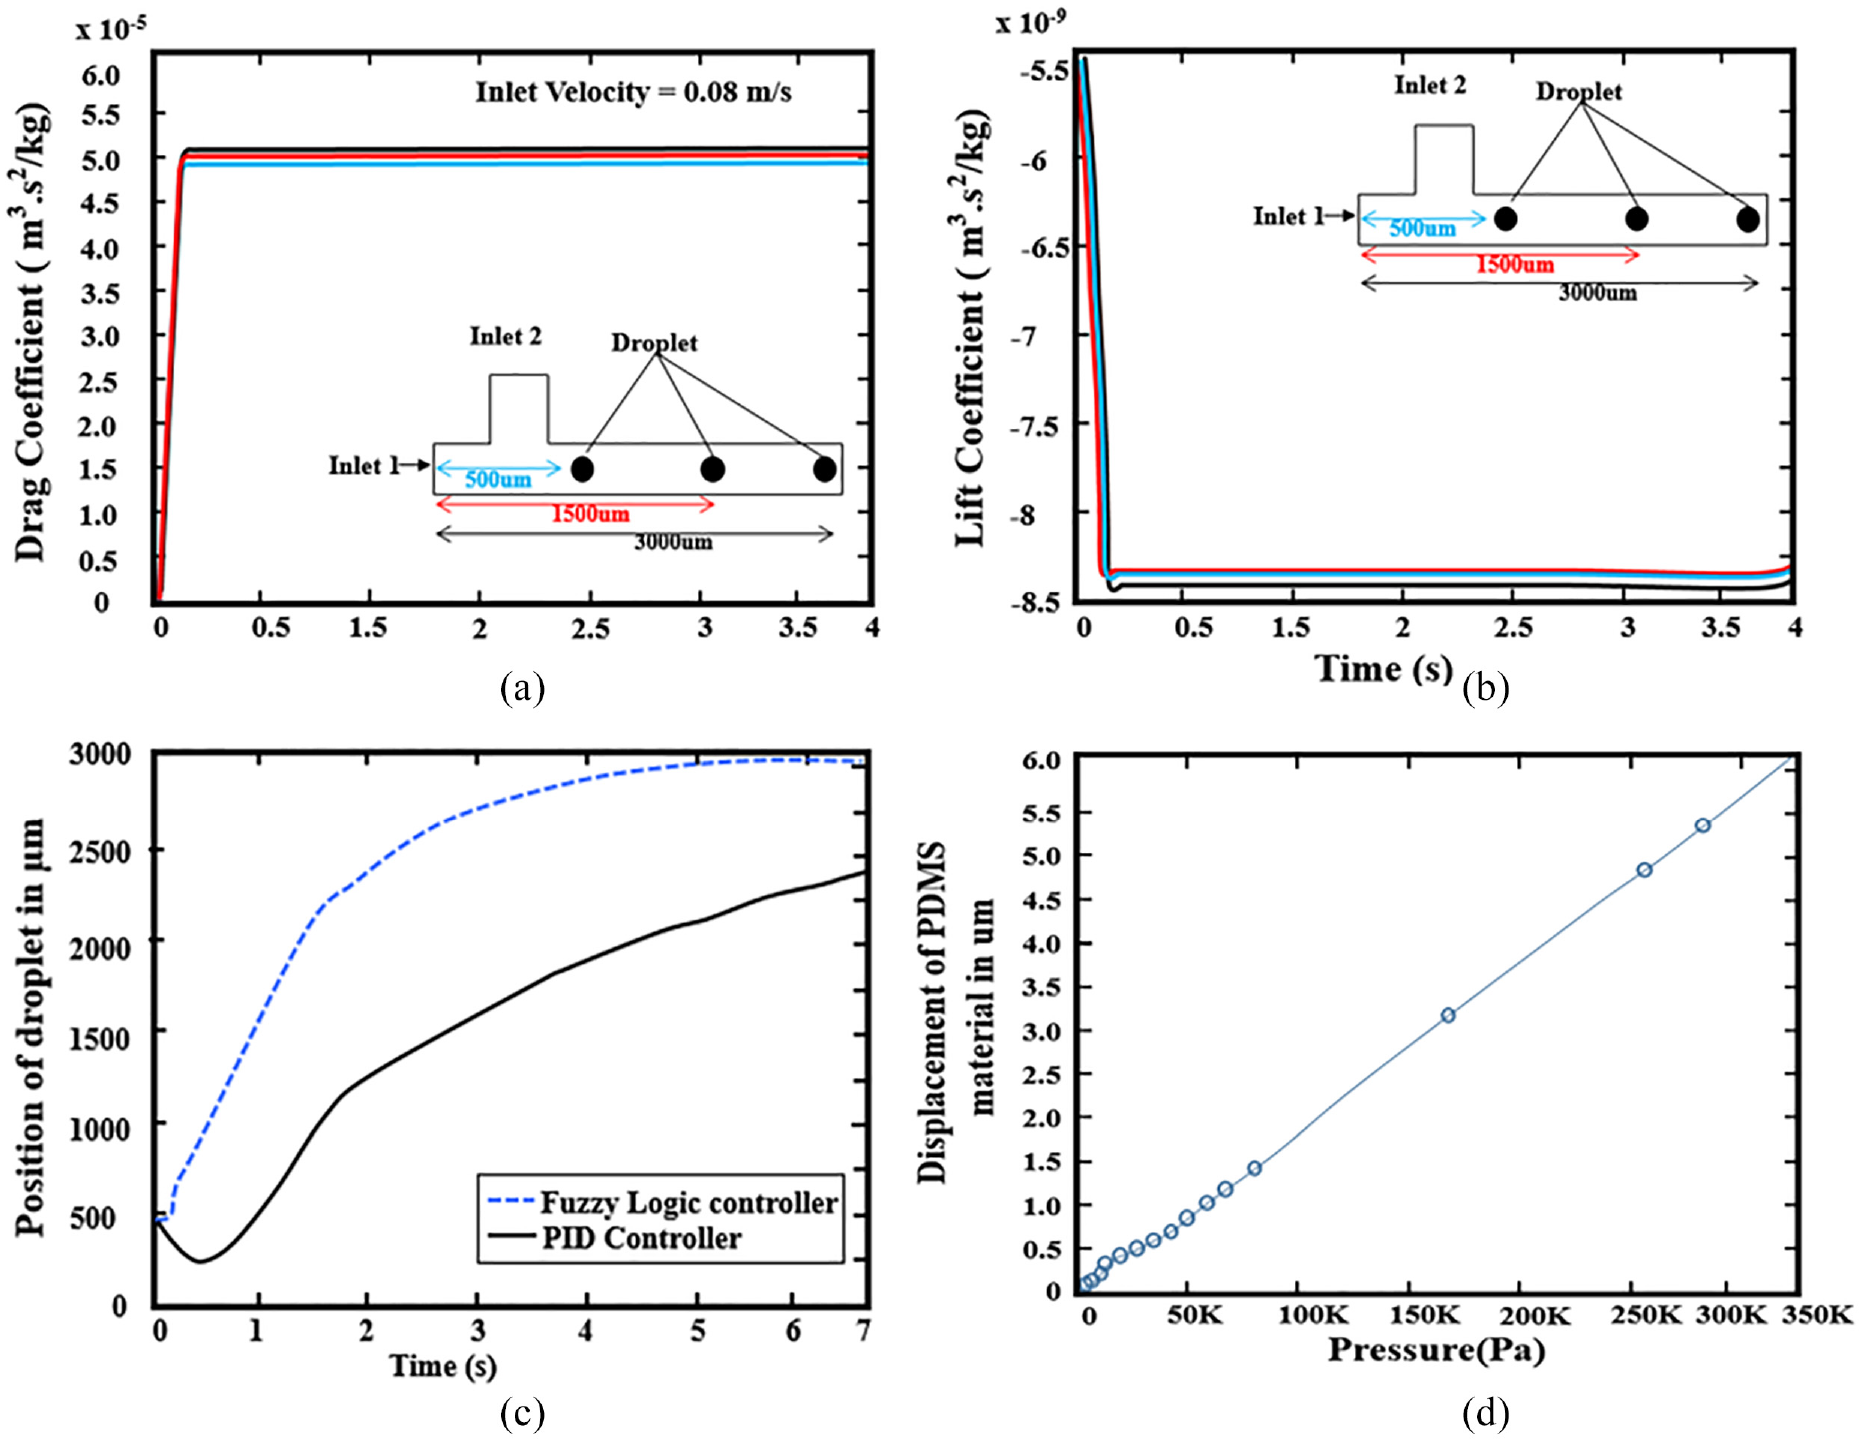
(a) Drag coefficient of droplet at different positions from the inlet at 500, 1500, and 3000 µm, respectively. (b) The lift coefficient of the droplet at different positions from the inlet at 500, 1500, and 3000 µm, respectively. (c) The comparison result of fuzzy logic controller and PID controller. As it is obvious from the graph that fuzzy logic controller reaches at steady-state position faster than PID controller and the steady-state error is almost zero in case of fuzzy logic controller. (d) The displacement of PDMS channel with respect to the applied pressure which is a linear line, because it is within the elastic limit of the material so it obeys hooks layer and when the pressure is released the PDMS goes back to its original position.
Conclusion
In this study, we have presented a novel structure of a complete system capable of controlling the droplet movement inside microfluidic channel. We have designed a fuzzy logic controller which regulates the flow rates and also control valve ON/OFF for stopping droplet at desired position inside fluidic channel. For real-time settings, greedy image processing algorithm has been designed which is used to detect droplet position and track its movement inside the channel. Parameters like current droplet center/position, error, and the change in error are provided to the controller for making precise decision. The output of controller is connected to the pressure pump which in turn applies pressure on control layer of PDMS material, designed to block the channel, and droplet will stop at the desired position. Controller performance has been tested in MATLAB and results indicate that fuzzy logic controller behaved in a more efficient way as compared to other controllers like PID. In COMSOL Multiphysics, two-phase conventional method is used to generate the droplet in T channel. Pressure on the pin valve by four different inlet velocities and three different positions has been studied. Furthermore, drag and lift coefficients are also investigated at different velocities and positions of droplet inside microfluidic channel.
Footnotes
Declaration of conflicting interests
The author(s) declared no potential conflicts of interest with respect to the research, authorship, and/or publication of this article.
Funding
The author(s) received no financial support for the research, authorship, and/or publication of this article.