
Abstract
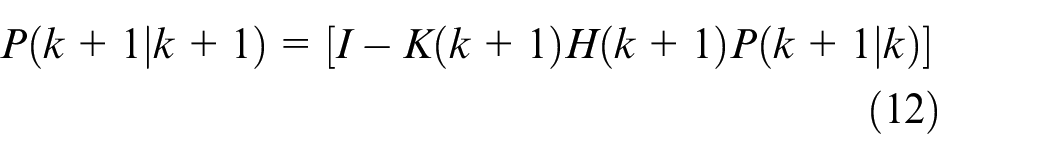
The content of this study is based on the background of sonochemistry processes. First, the hydrophone is used to measure the sound pressure in the reactor (the experimental ultrasonic frequency range is 20 ± 1 kHz). The sound pressure signals are processed by threshold method, Kalman filter algorithm, and five-point three-time smoothing method. These methods eliminate singular items in the sound pressure signal, filter noise, smooth burrs, and so on. In addition, the sound intensity value is calculated by dual hydrophone method. In this paper, the average intensity of ultrasonic cavitation is studied. The radial distribution and longitudinal distribution of cavitation intensity of the same tool head are studied, and the effects of different power and different tool heads on cavitation intensity are also discussed in this paper. The experimental results show that the instrument designed in this paper can effectively measure the distribution of ultrasonic sound field and evaluate the performance of the tool head. We can infer from the experiments that the performance of the diamond tool head is better than that of the nine-section whip and the dumbbell tool head.
Introduction
Sonochemistry is an emerging discipline in which chemical reactions are accelerated or new reaction channels are triggered by ultrasound to increase the chemical reaction rates or produce newly acquired chemical reactants.1–4 Relevant studies have pointed out that the ultrasonic cavitation phenomenon is the active force used in sonochemistry.5–12 Cavitation effects such as small, local, and instant high temperature and high pressure, free radicals, impact waves, and microjet offer extreme conditions for chemical reactions. 13
Underwater ultrasonic intensity measurement technique is one of the effective methods to study the acoustic radiation characteristics of underwater ultrasonic source and structure vibration. 14 The method can be used for near-field measurement of ultrasonic sound sources and measurement of sound power of sound source radiation. The method has wide application prospects in evaluating ultrasonic and implementing effective control methods, because it can simultaneously obtain the sound field intensity and the direction of sound energy flow. At present, the commonly used methods for measuring the intensity of sound field are dual hydrophone method and vector hydrophone method. 15 For near-field measurement of underwater sound intensity and radiated sound power, the dual hydrophone is more suitable. Therefore, the paper uses the dual hydrophone method to measure the sound intensity.
Currently, the acoustic method, thermal probe method, film etching method, and chromosome method are common methods to recognize cavitation states. Some of these methods measure the parameters of acoustic fields directly, whereas others use the ultrasonic effects of acoustic field. Yu 4 from Tianjin University of Science and Technology collected real-time images of hydraulic cavitation using a high-speed camera; observed the formation, swelling, shrinkage, and collapse of cavitation bubbles; and introduced the average gray value to evaluate cavitation effects on tubes. In 2014, Liu et al. proposed the use of a weak acid test paper to measure cavitation acoustic fields on oilstone surfaces in grinding zones. This work provided a simple and easy-to-operate method for evaluating the qualitative measurement of the intensity and distribution of cavitation acoustic fields in the grinding zone of power ultrasonic honing. 16 Considering that harmonics and subharmonics correspond to the energy of steady-state cavitation and nonlinear effects, Liu et al. used the median fit of continuous waves. After the integration, the energy values of the separated parts are obtained. The separation results are interpolated to obtain a reconstructed three-dimensional sound field, and the cavitation is characterized by nonlinear energy. 17 Many foreign studies on the evaluation methods for ultrasonic cavitation effects have been reported. In 2016, Koda et al. 18 analyzed the performance evaluation of cavitation effects by the calorimetric method that is based on three chemical dosages of Fricke, KI, and TPPS. Gogate et al. 19 studied the influences of geometric parameters, ultrasonic driving power, and frequency of the sonochemistry reaction stills on the cavitation effect. They evaluated the cavitation effect by iodometry.
In this paper, the dual hydrophone is used to measure the ultrasonic cavitation sound intensity, and the measured sound pressure is processed by threshold method, Kalman filter, and five-point three-time smoothing algorithm. The processed data are interpolated with MATLAB. And the effect of ultrasonic cavitation is analyzed by calculating the average sound intensity and standard deviation of sound intensity. The paper evaluates the performance of sonochemical application characteristics of various types of ultrasonic tool heads, which provides a theoretical basis for the design of the tool head.
Materials and methods
Sound intensity measurement algorithm
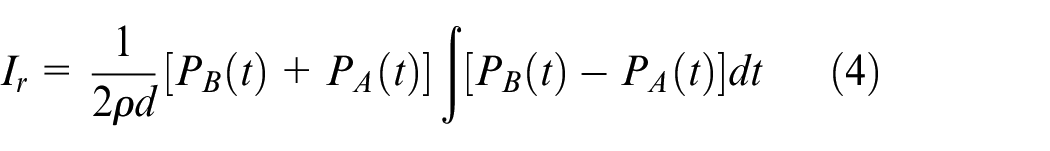
At a certain point in the sound field, the sound energy passing through a unit area perpendicular to the particle velocity direction per unit time is called instantaneous sound intensity. According to the acoustic theory, the acoustic intensity
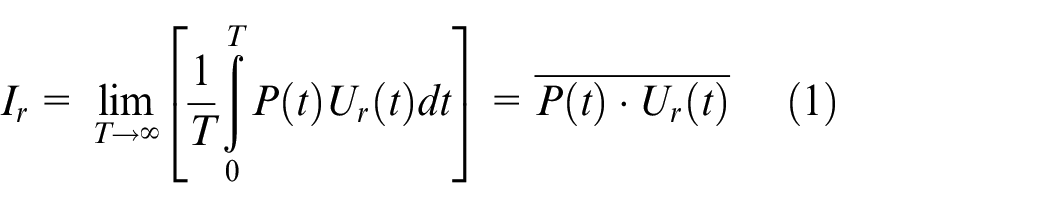
where T is the period or much longer than the period,
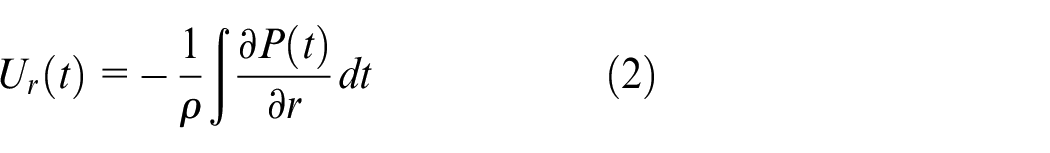
where
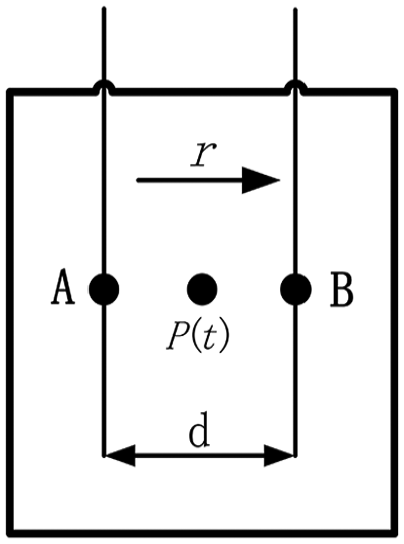
Schematic diagram of double hydrophones.
Assume that the wavelength of sound wave is
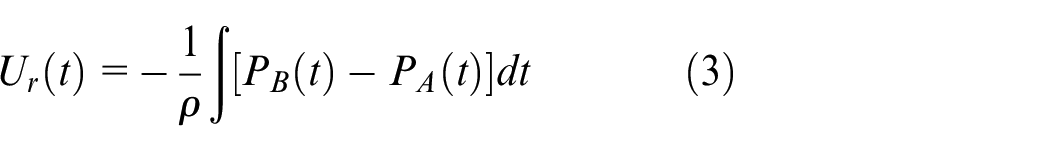
where
The sound pressure in the middle of the sensors can be approximated as the average values of
Filter algorithm
The data measured by the oscilloscope (Agilent MSOX2022A oscilloscope) show that the sound pressure value directly measured by the hydrophone has a large noise interference, and there are obvious singular value points, and there are also white noise and colored noise. According to the characteristics of the measured data, the filtering algorithm is decomposed into three steps: excluding singular items, Kalman filtering, and data smoothing.
Singular points refer to the measured data points which are quite different from the overall distribution. From the mechanism analysis, the singular point is caused by the interference of the measurement site, and the normal sound pressure value is due to the ultrasonic sound pressure of the hydrophone. The value of sound pressure changes with the change of ultrasonic power and presents a continuous change. The generation of singular points is not affected by these factors. Its generation and disappearance are random and instantaneous. Therefore, the threshold method is used to eliminate singular points

where
The singular point satisfying formula (5) is eliminated, and

White noise is defined as a signal with constant power spectrum density in infinite frequency range. Gauss white noise is the instantaneous value of the probability distribution that obeys the Gaussian distribution, and the power spectral density is uniformly distributed. And the probability distribution and power spectral density distribution are the criteria for judging Gauss white noise. Compared to white noise, the power spectral density function of colored noise is not flat. Gaussian white noise and colored noise are more common in ultrasound signals. The paper uses Kalman filtering to filter noise. The principle is as follows


Formulas (7) and (8) are the representations of linear discrete systems where
The paper uses orthogonal theorem and mathematical induction to deduce. The predicted recursive equations are as follows
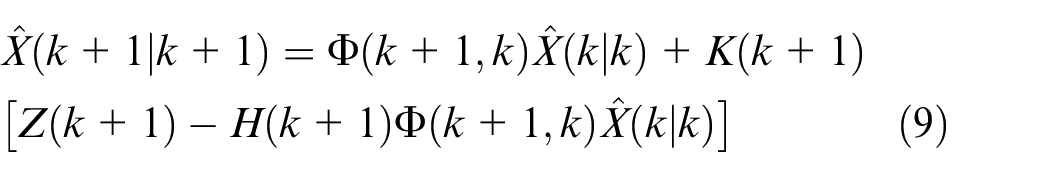
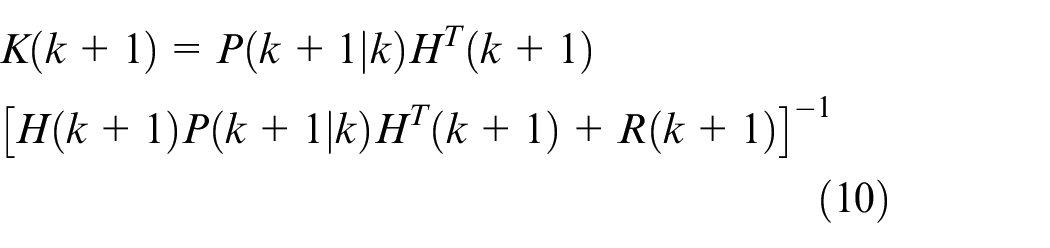
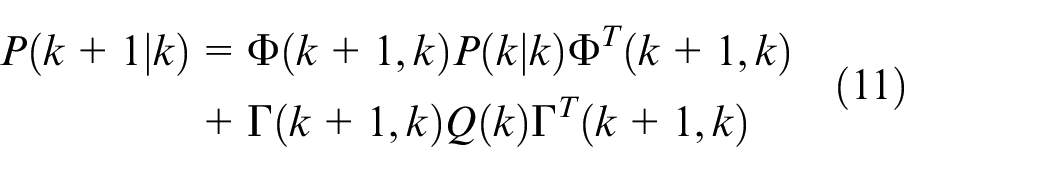
where
The main characteristic of Kalman filtering algorithm is that it can revise the estimate of the previous moment according to the latest measurement value, and it has the characteristics of dynamic weighted correction.
Due to interference in the measurement process, the data curve is a folded line. After the above processing, the smoothness of the data curve can be improved. The principle of data smoothing is to eliminate the interference signal in the data as much as possible, and the curve can maintain the original change law. The data smoothing process uses a five-point three-time smoothing algorithm.
The data are sampled at equal intervals; X represents equidistant nodes and Y represents experimental data, and the following data are obtained
Next, we set the equidistant distance between two nodes to h for

Substituting all points into the above formula, there are
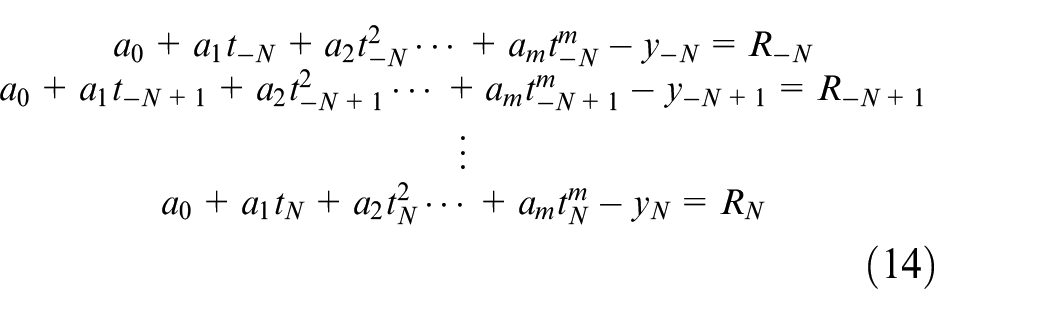
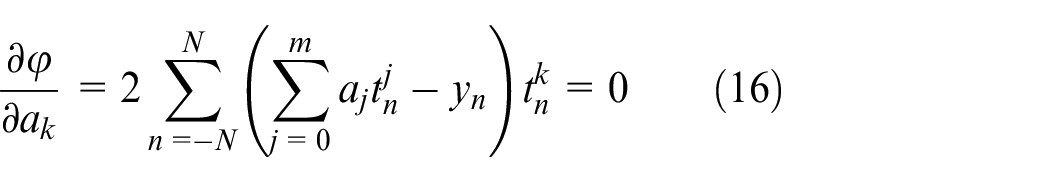
According to the least square theorem, we can find the optimal coefficient solution of (2N + 1) equations, that is, the formula can satisfy sum of errors
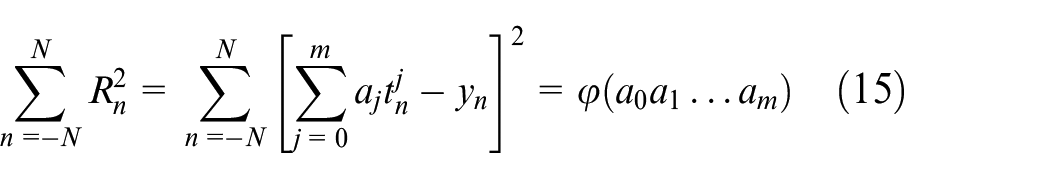
In order to minimize the above equation, the partial derivatives of
After data processing, the “sawtooth phenomenon” has been significantly improved, which shows that smoothing can effectively eliminate the impact of interference signals.
Experimental apparatus
The experimental apparatus was mainly composed of a stainless reaction still, an ultrasonic vibration host, and an ultrasonic generator (Figure 2). To study the effects of different ultrasonic tool heads on cavitation intensity, we used three types of tool heads, namely, diamond tool head, nine-section whip, and dumbbell tool head. The model of the ultrasonic generator is GBP-USC20A (Frequency range: 19—21 kHz; Rated power: 2000 W; Linear power range: 450–2000 W). The model of the hydrophone is RHS-10 (Frequency range: 1—200 kHz; Sensitivity: 20 dB).
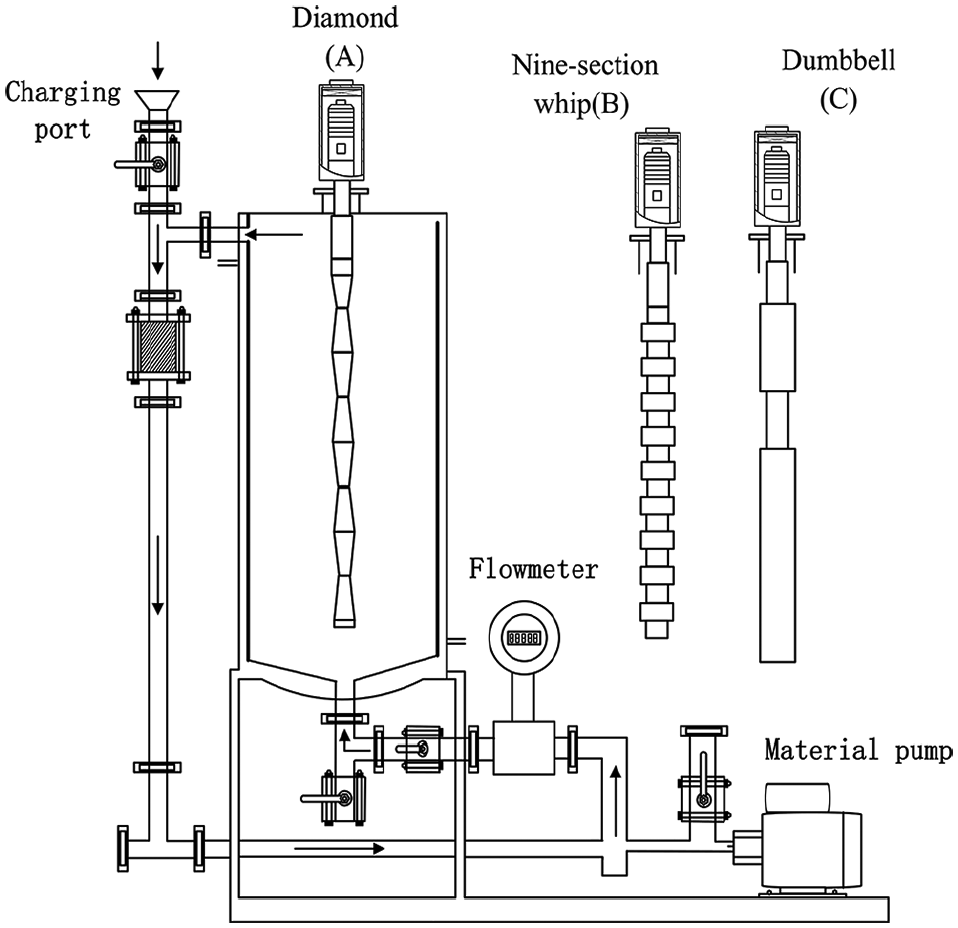
Diagram of sonochemistry devices.
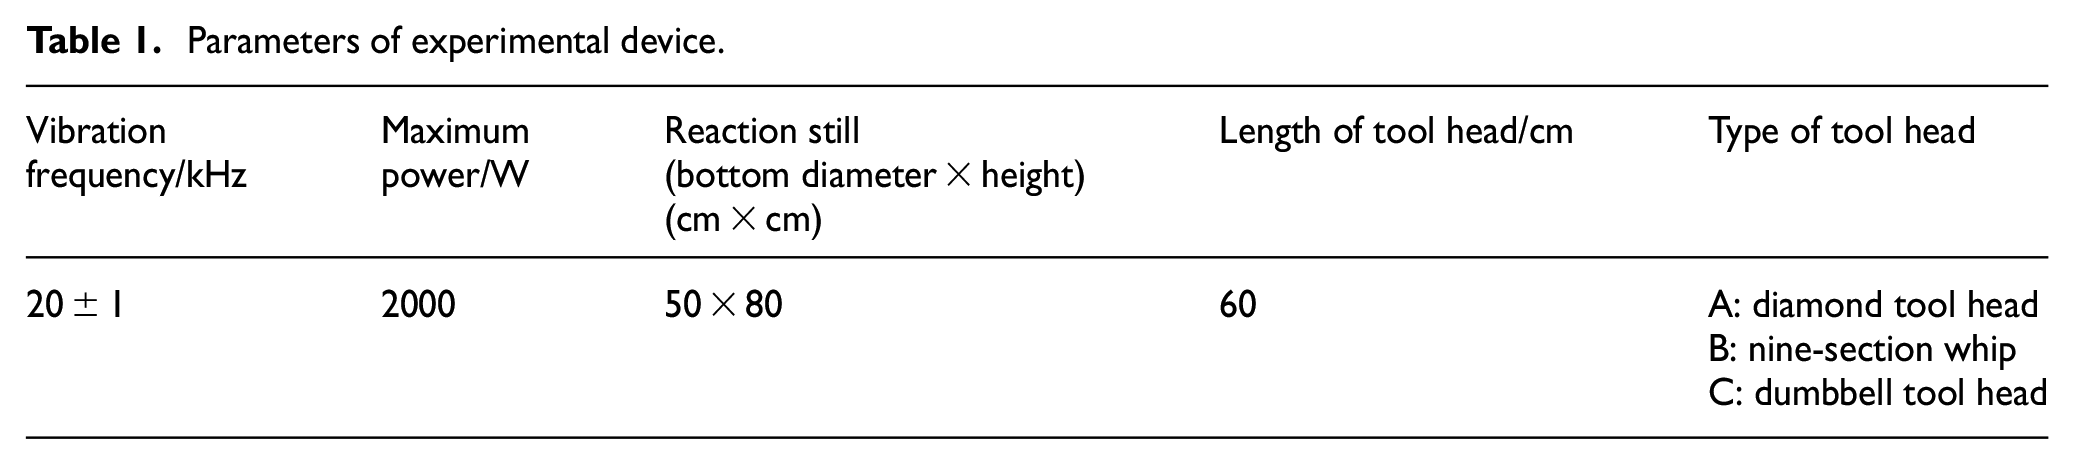
The specific parameters of the experimental device are shown in Table 1.
Parameters of experimental device.
Experimental method
An ideal tool head should have good performances in the following aspects: the intensity of ultrasonic sound and the uniformity of ultrasonic field. This section mainly describes the measurement of sound field. In the measurement, the sound intensity is measured by the method of fixed hole position, so as to study the sound field distribution law of ultrasonic tool heads. In the circular reactor, there are 8 measurements of sound intensity, and there are 48 measuring points in each plane. As shown in Figure 3, a1 is the stereogram of the reaction kettle, and a2 is the plane diagram of the reaction kettle. In the experimental environment with ultrasonic frequency of 20 kHz and working power of 800, 1100, and 1400 W, respectively, the hydrophone measures the sound intensity values of the three tool heads according to the above measurement methods. And reads the data from hydrophone every 2 s.
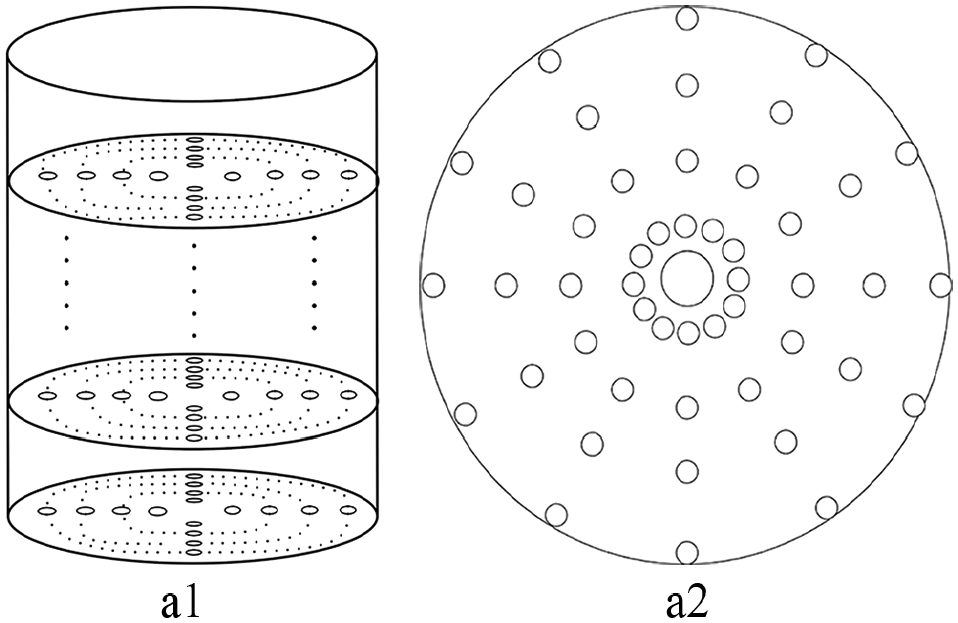
Survey point distribution diagram.
Results and discussion
Average acoustic intensity
In this section, we mainly analyze the average acoustic intensity of three types of tool heads. The average acoustic pressures of 48 measuring points in each measuring layer were calculated. The measurement data of acoustic intensity of the tool heads on different planes are shown in Figures 4–6. Curve A represents the diamond tool head, Curve B represents the nine-section whip, and Curve C represents the dumbbell tool head. The y-axis is the acoustic intensity (
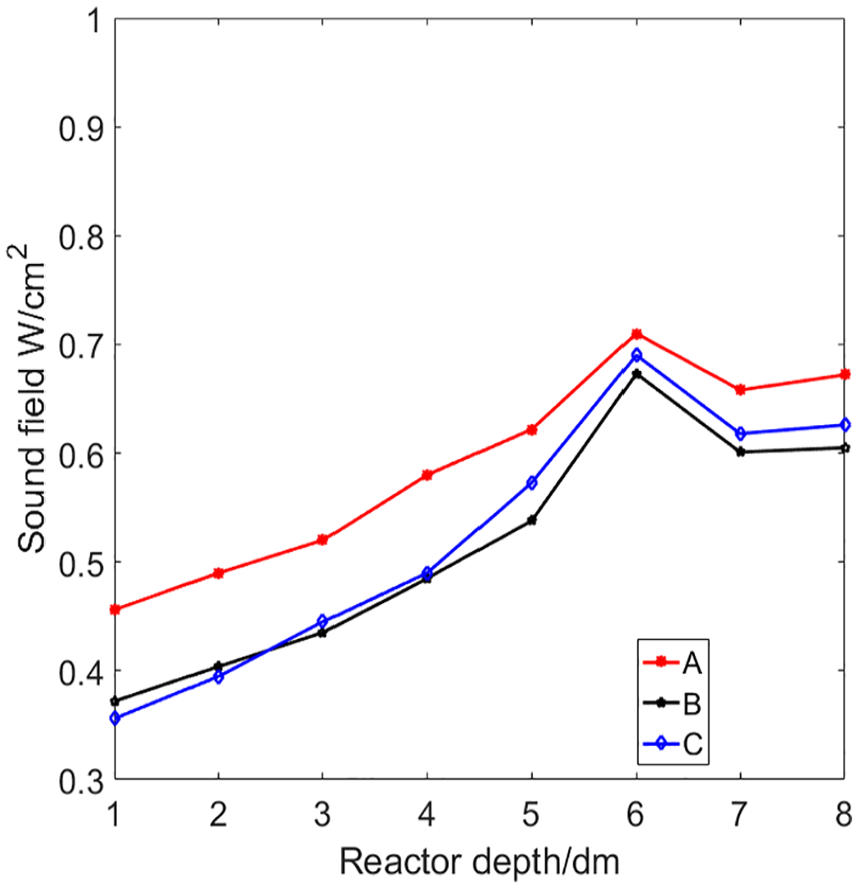
Average acoustic intensity at different layers of three tool heads (800 W).
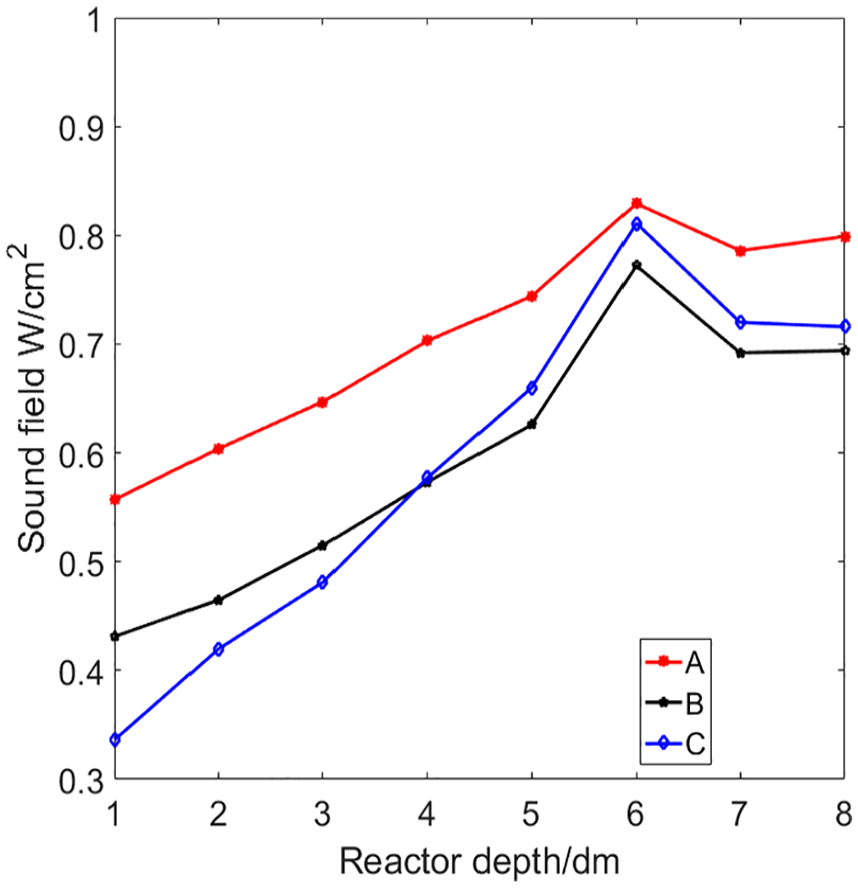
Average acoustic intensity at different layers of three tool heads (1100 W).
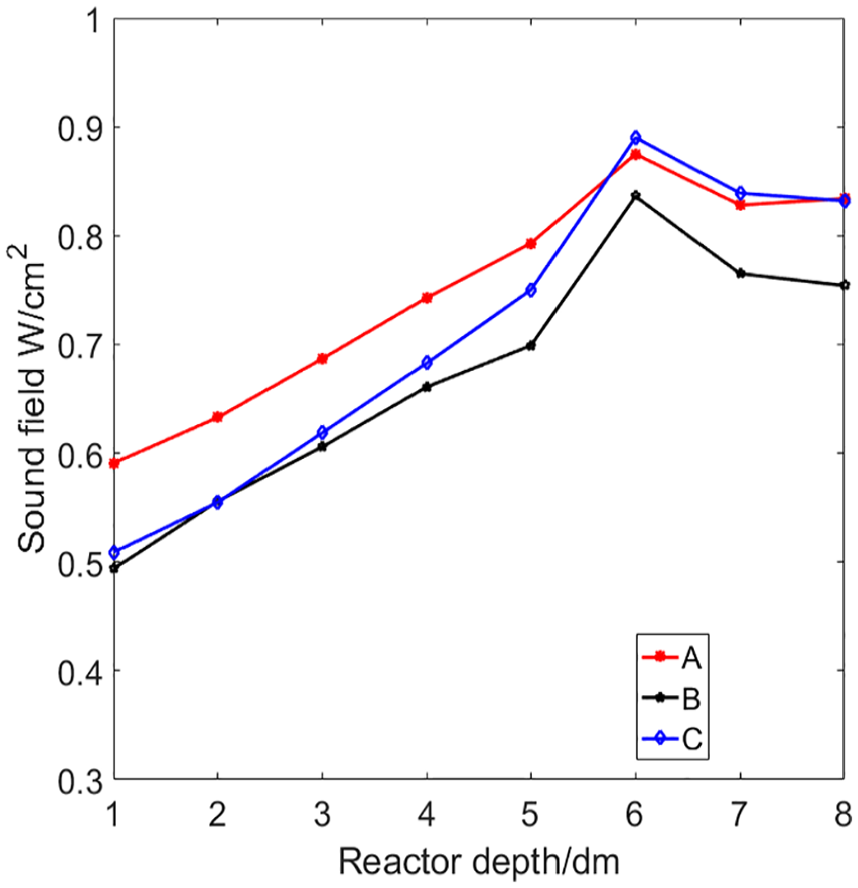
Average acoustic intensity at different layers of three tool heads (1400 W).
Cavitation intensity at different depths
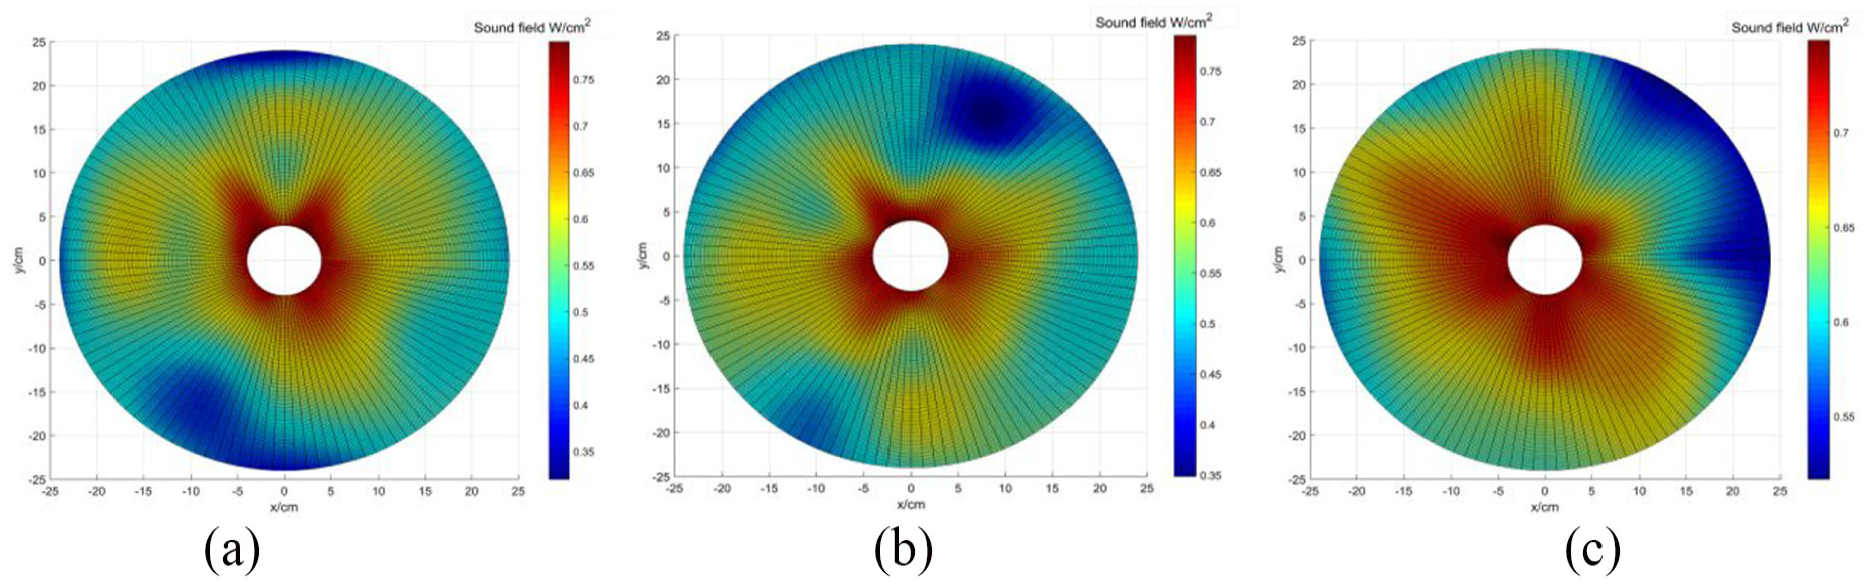
This section mainly discusses the cavitation of the reaction still at different depths. First, previous studies on the influences of depth on cavitation intensity were mainly theoretical and experimental studies and were based on the cleaning machine model. 21 The transducer of a cleaning machine is mainly a wall type. This working mode is conducive to the uniformity of the ultrasonic acoustic field distribution in the cleaning machine. Differences in the cavitation effects at different positions are mainly caused by water level. Different water levels generate different environmental pressures. According to traditional results, liquid environmental pressure is one of the primary influencing factors of the cavitation effect. Nevertheless, only a few studies have investigated the influences of water depth on the performance of amplitude-variable sonochemistry devices. Furthermore, the working mode of amplitude-variable sonochemistry devices is significantly different from that of the traditional cleaning machine. Therefore, previous studies had few references for the design of similar devices. In this paper, the distributions of ultrasonic fields in the dumbbell tool head, nine-section whip, and diamond tool head were measured when the reaction still was under a fixed frequency (20 kHz) and different driving powers (800, 1100, and 1400 W). A three-dimensional (3D) reconstruction of nonlinear energy was also performed. The results are shown in Figures 8–10. Figure 7 is the schematic diagram of longitudinal distribution of measuring points in the reactor. The section is indicated by the dashed line, and the tool head are on the same plane. In those figures, X denotes the horizontal distance from the center and Y denotes the vertical distance from the center.
Schematic diagram of longitudinal distribution of measuring points in the reactor.
Longitudinal section of cavitation energy under 800 W: (a) dumbbell tool head, (b) nine-section whip, and (c) diamond tool head.
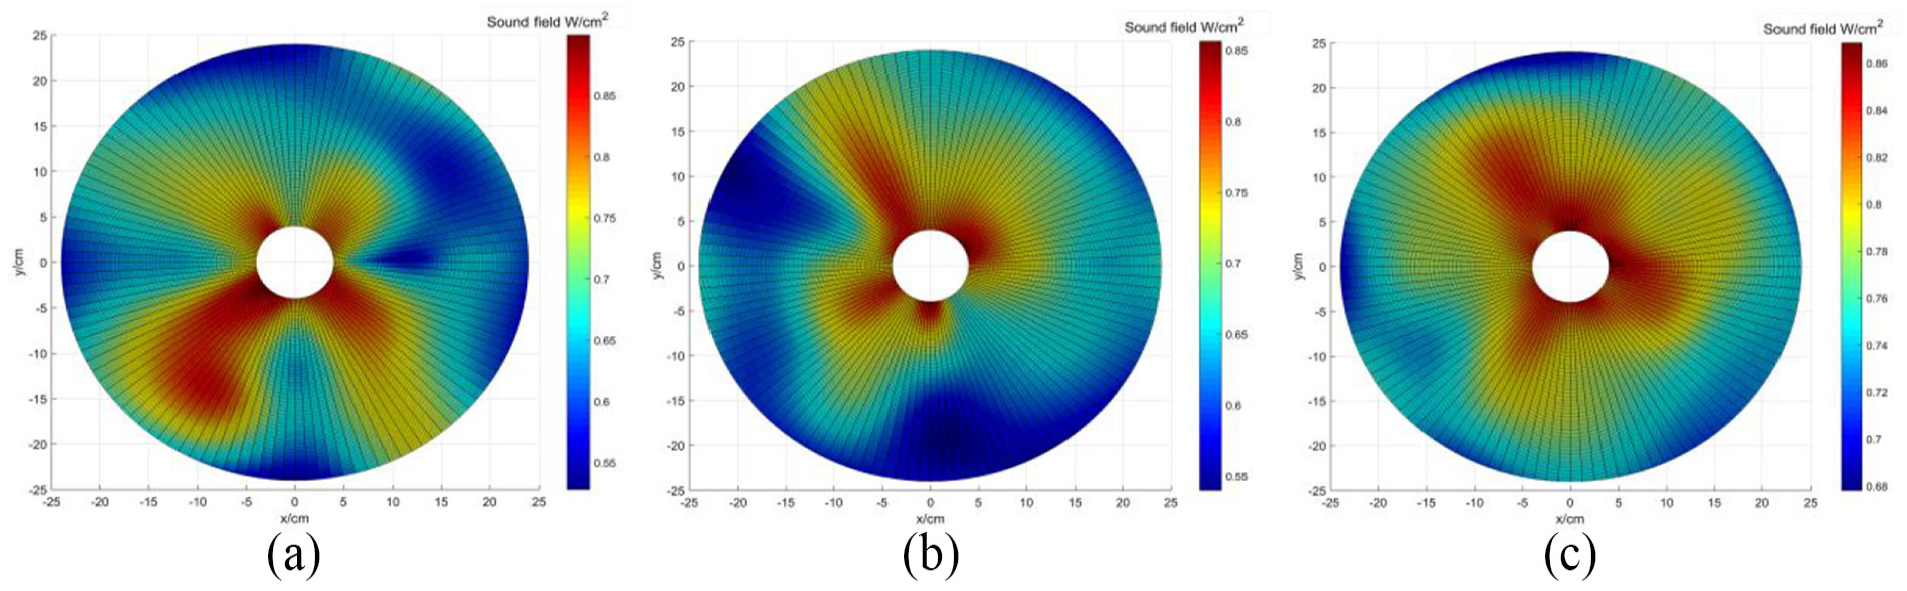
Longitudinal section of cavitation energy under 1100 W: (a) dumbbell tool head, (b) nine-section whip, and (c) diamond tool head.
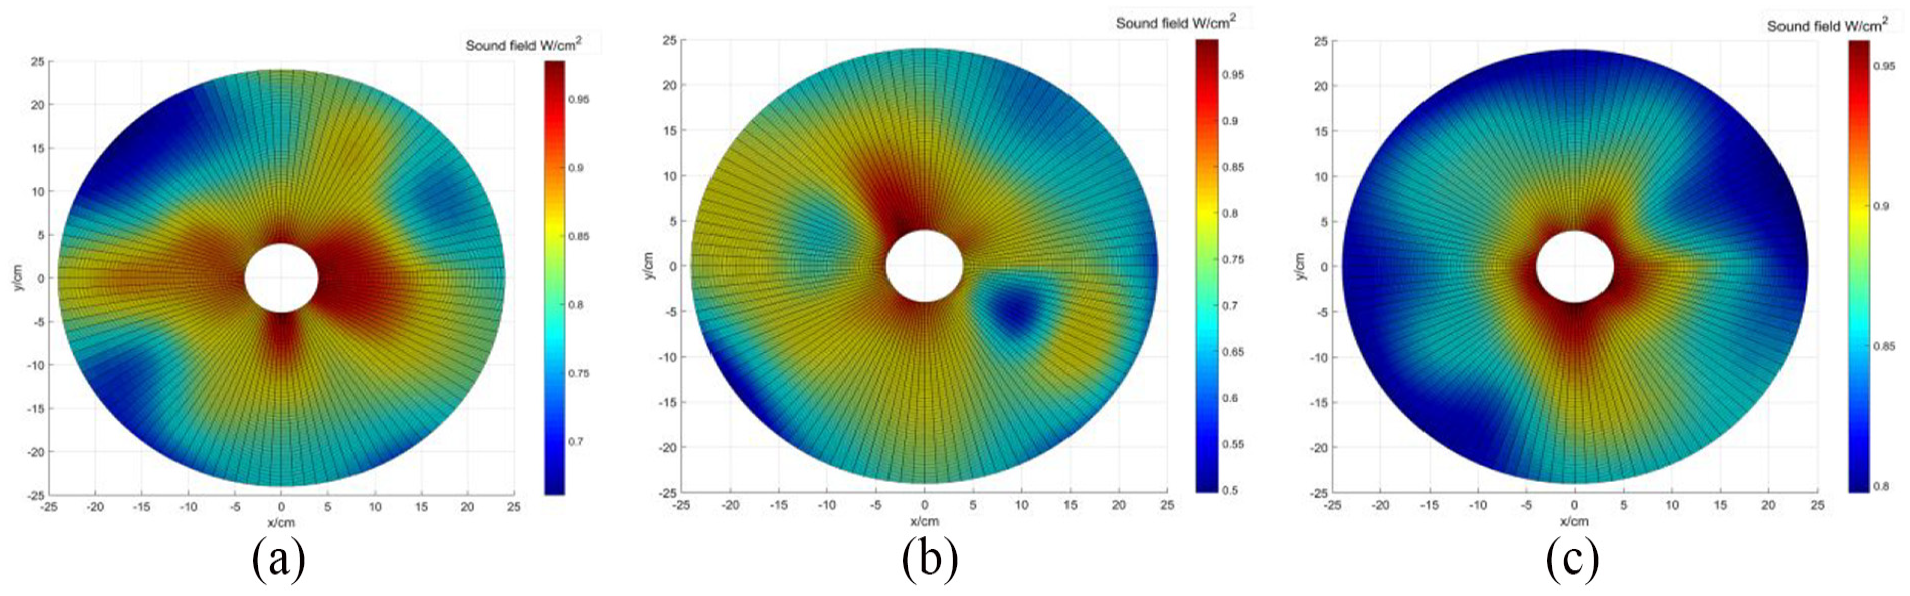
Longitudinal section of cavitation energy under 1400 W: (a) dumbbell tool head, (b) nine-section whip, and (c) diamond tool head.
By comparing Figure 8(a), (b), and (c), we found that the horizontal distributions of the energies of the three tool heads tend to concentrate at the central axis of the rinse tank. The phenomenon is consistent with the previous simulation results, but in the degree of attenuation, the experimental results are significantly more gradual, which is due to the superposition of the ultrasonic reflection, whereas the longitudinal distributions concentrate at the water depth of about 60 cm, which is located at the end of the tool head. The amplitude output at the end of the tool head reaches the maximum, resulting in the maximum energy at this position. In addition, the differences in the shape of tool heads may also have impact on this, which will be the focus of our research later. At the reaction still plane at 60 cm, the relative energies of the acoustic fields of the three tool heads attenuate slowly toward the surrounding places. However, as the depth of the reactor increases, the relative energy of the sound field decreases faster toward the periphery. Among the three tool heads, the dumbbell one presents the largest attenuation degree, whereas the diamond tool head shows the smallest attenuation degree. This result further proves that the acoustic field uniformity of the diamond tool head is better than those of the dumbbell tool head and nine-section whip.
Acoustic field uniformity
The section mainly introduces the sound field uniformity analysis of the three tool heads, which are mainly divided into two parts. The first part is the overall analysis of the ultrasonic field of three tool heads. The average sound intensity and the standard deviation of sound intensity are calculated, respectively. Figure 11(1) is a histogram analysis of the average sound intensity of three tool heads, and Figure 11(2) is a histogram analysis of the sound intensity standard deviation. The second part is to select the sixth plane of the reactor for local analysis under the ultrasonic power of 800, 1100, and 1400 W. The measurement results are interpolated by MATLAB.
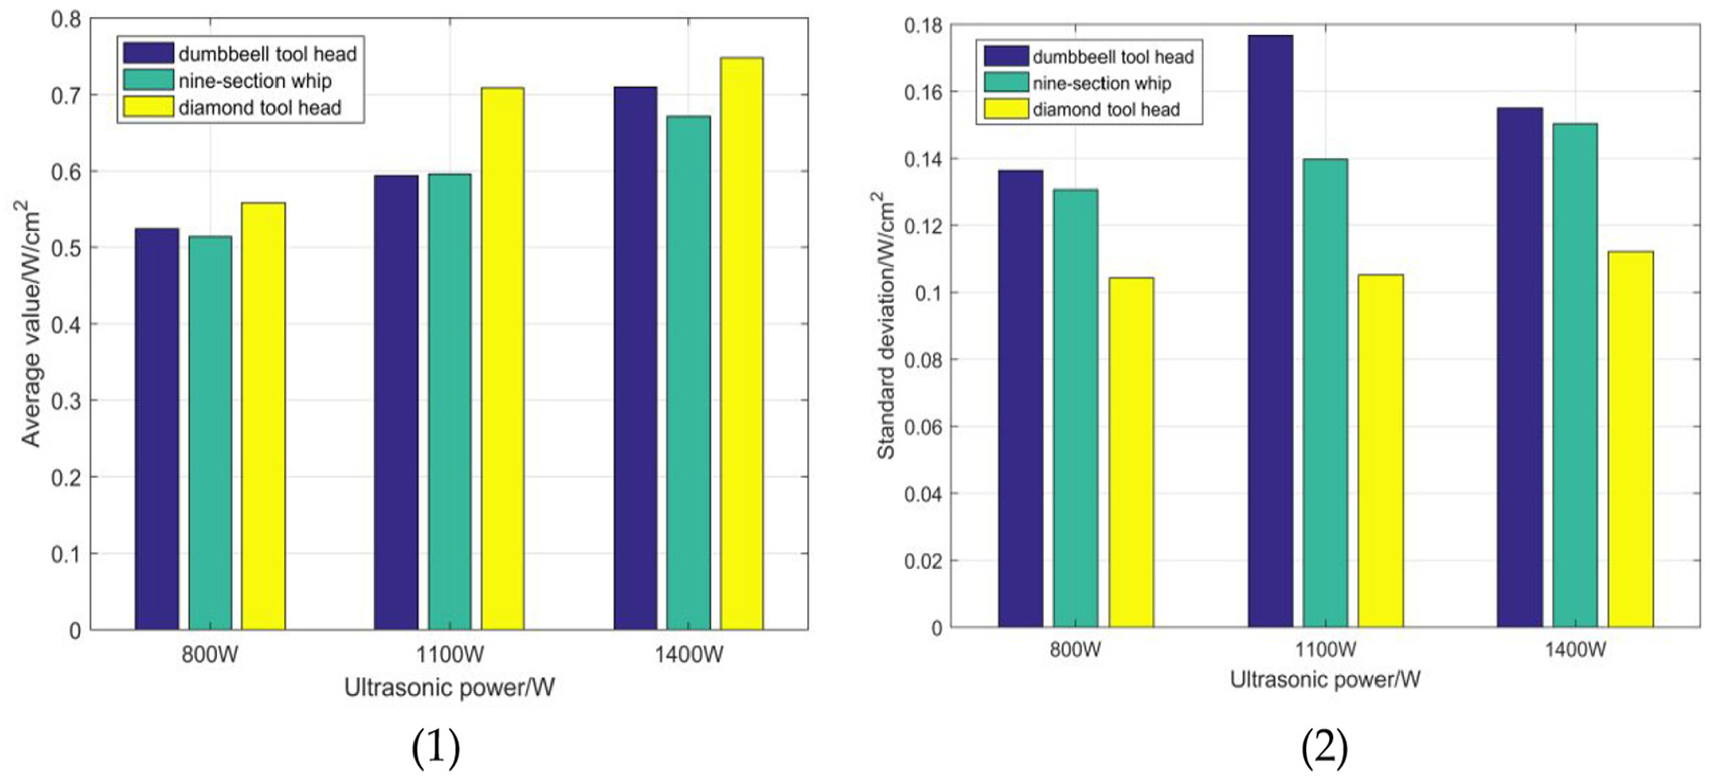
Overall sound field analysis of three tool heads.
From Figure 11, the value of the diamond tool head is significantly lower than the value of the dumbbell tool head and the nine-section whip in the standard deviation of sound intensity. In addition, in terms of average sound intensity, the performance of the diamond tool head is also significantly better than others. The dumbbell tool head has the worst performance on the standard deviation of sound intensity. Especially, at 1100 W ultrasonic power, its standard deviation is much larger than the other two tool heads. It can be concluded that the structural design of the dumbbell tool head is not reasonable in terms of sound field uniformity. The conclusion is that the uniformity and energy consumption ratio of the diamond tool head are the best among three tools. In order to observe the uniformity of the sound field more intuitively, the local sound intensity in the reactor was also analyzed. The three tool heads data are processed by interpolation algorithm. The results are shown in Figure 12–14. In these figures, (x, y) is the position coordinates the horizontal sections. Next, the plane reconstruction images of the three tool heads at different powers are analyzed. Compared with other two tool heads, the reconstructed image of the diamond tool head has a slower downward trend from the center to the periphery.
Horizontal sections of three tool heads under 800 W: (a) dumbbell tool head, (b) nine-section whip, and (c) diamond tool head.
Horizontal sections of three tool heads under 1100 W: (a) dumbbell tool head, (b) nine-section whip, and (c) diamond tool head.
Horizontal sections of three tool heads under 1400 W: (a) dumbbell tool head, (b) nine-section whip, and (c) diamond tool head.
Conclusion
Based on the current research, threshold method, Kalman filter algorithm, and five-point three-time smoothing method can effectively process the ultrasonic signal, and eliminate the interference signals in the measurement data. The results obtained by the dual hydrophone method are accurate and reliable. The acoustic field uniformity and average acoustic intensity of three tool heads are analyzed by preparing a sonochemistry experimental apparatus and obtaining experimental measurements under three power levels. The result of the three tool heads show that the diamond tool head is significantly better than the other two tool heads in terms of average sound intensity and sound intensity uniformity. Although the differences between tool heads are more obvious, there are still some common features. In the reactor, the sound intensity distribution of the three tool heads has the fast attenuation region. With the increase in power, the average sound intensity of the three tool heads increases linearly, and the end sound intensity values of the three tool heads reach a maximum value. Whether the maximum value at the end of the tool head is related to the shape of the tool head will be the focus of our future research.
Footnotes
Declaration of conflicting interests
The author(s) declared no potential conflicts of interest with respect to the research, authorship, and/or publication of this article.
Funding
The author(s) received no financial support for the research, authorship, and/or publication of this article.