
Abstract
The industrial progress has reached a level in which it is necessary to understand the behavior of mechanical components and to monitor their conditions without disassembling them. Nowadays, a suitable methodology is based on vibrational analysis usually performed through acceleration signals measured directly on the system to be tested. However, in the last years, the industrial scenario has deeply changed due to the need for time reduction, in particular, for the control operations at the end of the productive line. The genuine methods based on acceleration measurements, for example, through piezoelectric accelerometers, came into conflict with the industrial need as the sensors used for the quality control have to be easily and fastly mounted and unmounted. A valid alternative is represented by the exploitation of laser triangulation sensors that are able to measure the dynamic displacement in a contactless way, strongly reducing the (un)mounting time. The target of this paper is to highlight pros and cons of the contactless displacement analysis through laser triangulation sensors with respect to the contact one through genuine accelerometers by means of a comparison between the results obtained both for experimental modal analysis and vibrational diagnostics of rotating machines.
Keywords
Introduction
The industrial need for product development, related to the reduction of production costs in order to survive inside the market, brought the research to very high levels. Nowadays, this research is increasingly focused on the study of the vibrational behavior of mechanical components, particularly in order to understand their possible performance, by means of experimental modal analysis (EMA), and to monitor their health state for preventing catastrophic failures, exploiting the vibrational diagnostics.
The conventional EMA is based on measurements of acceleration, velocity and displacement as well as excitation forces. Modal testing has been practiced for over 60 years; in fact, the first documented method, with the aim to predict the behavior of a structure under dynamic loads, dated back to the 1940s. 1 An enormous literature regarding the EMA has been published, and among them, a special mention must be given to the works of Ewins 2 and Delli Carri et al. 3 and Heylen et al. 4
Regarding the vibrational diagnostics, with a particular focus on rotating machines, the target of the analysis is to monitor their conditions through the detection and the identification of incipient faults directly from the acquired vibration signal. 5 Over the years, several signal processing techniques for the condition monitoring of rotating machines have been proposed such as the following: order tracking,6,7 time synchronous average8,9 for removing the influence of rotation speed, amplitude and frequency demodulation 10 for detecting gear faults and envelope analysis for identifying bearing faults.11,12
Usually, vibrational analysis is performed through acceleration measurements, for example, by means of piezoelectric accelerometers. However, in the last years, the industrial scenario has changed due to the need for time reduction and for the minimization of rejected products, particularly, during the control operations at the end of the productive line. On the one hand, for time reduction issue, the sensors used for the control have to be easily unmounted from the component already tested and quickly mounted to the one to be tested, for example, by means of a robotic arm on which the sensor can be mounted. On the other hand, for cost issue, the measures have to be done without the contact with the component surface in order to not damage and consequently to not alter the surface itself.
A valid solution can be represented by the exploitation of laser triangulation sensor (LTS). This kind of sensor, in fact, is able to measure the dynamic displacement of a generic surface without contact, satisfying both the need to speed up the final quality control and to keep the component conditions in intact state. It has to be noted that an alternative contactless solution can be achieved by the laser Doppler vibrometer for measuring vibrations, as proposed by Senatore. 13 The laser Doppler analysis presents a few cons with respect to the LTS: the higher cost of the sensor and the tedious and difficult pointing operations. On the other hand, the very high frequency range and the high measurement precision make the laser Doppler vibrometer useful in several fields. An enormous literature about vibrational analysis by means of acceleration signal can be found, but any alternative solution has not been exhaustively studied. In this direction, Mucchi 14 proposed piezoelectric strain sensors as alternative to piezoelectric accelerometers by the comparison of the results obtained by the application of both sensors on modal testing.
This research work focuses on a comparison between the application of LTS and piezoelectric accelerometers to the classic vibrational analysis, that is, EMA and vibrational diagnostics, in order to highlight their advantages and disadvantages. The main target of this paper is to demonstrate the effectiveness of LTS for vibrational analysis in order to justify the possible replacement of the classic accelerometer, for example, for productive line applications according to the industrial needs.
As these authors are aware, this kind of analysis has not been discussed yet in the literature.
Laser triangulation sensor
The measure of dynamic displacement by means of laser triangulation methodology is based on simply geometric relations. A laser beam is emitted by a laser diode toward the surface of which the displacement has to be measured. The reflected beam is then transferred through a lens to a position-sensitive detector (PSD) element, as shown in Figure 1(b), that is able to measure the position of a light spot. The distance of the component surface is measured by means of simple trigonometric calculations starting from the known position of both the laser source and PSD element inside the sensor, as well described by Zhang et al. 15
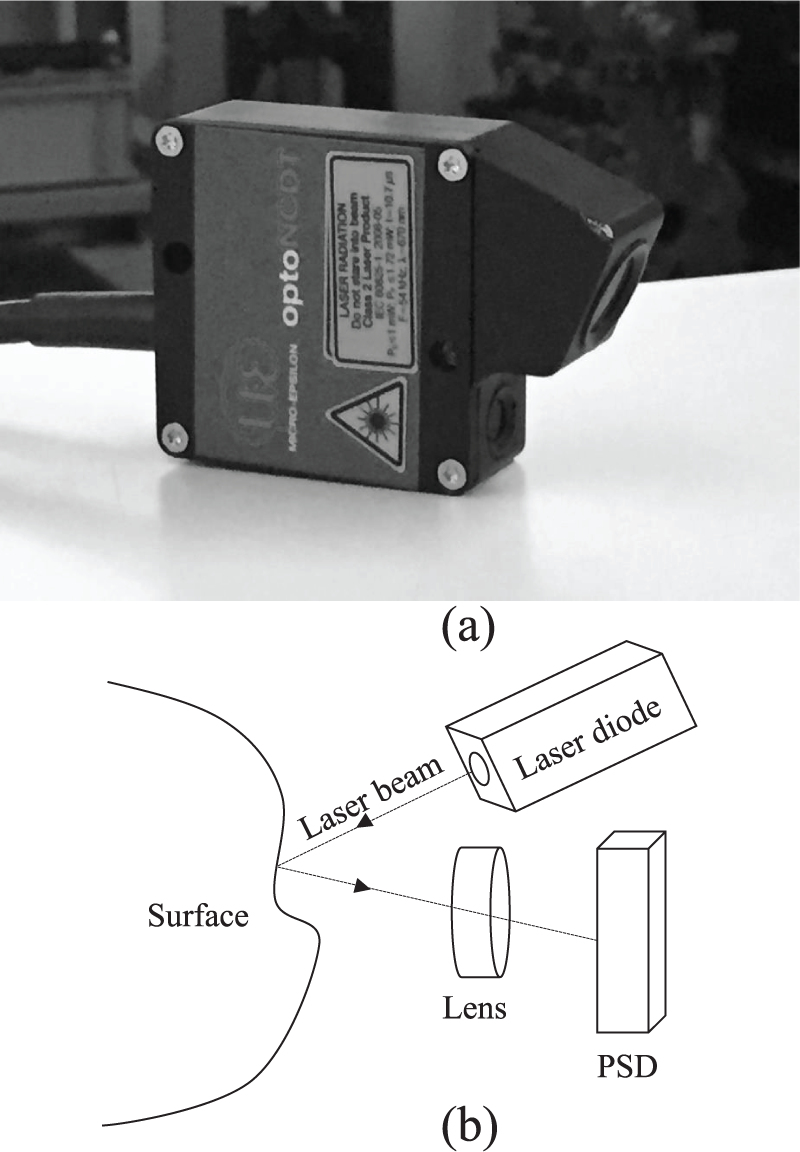
(a) Laser triangulation sensor and (b) measurement principle.
This technology has the advantage to enable the measurement of contactless displacement with very high precision but inside a restricted length range depending by the transducer itself. The laser reflection represents other issues for the measure because the surface has to present specific characteristic of roughness and opacity in order to make the most of the sensor. In fact, the measurements can be done on surfaces with a minimal reflection of
The comparison between the displacement and acceleration analysis proposed in this work has been performed with an LTS model Micro-Epsilon Opto NCDT 1610-20 which shown in Figure 1(a).
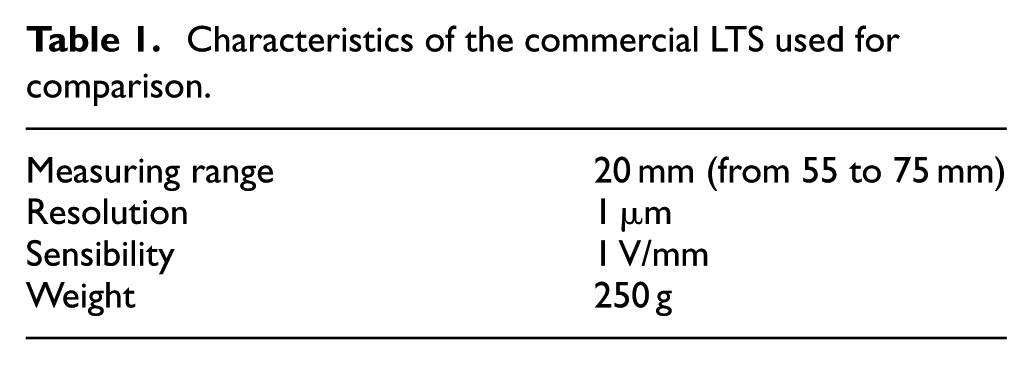
The characteristics of this commercial transducer are summarized in Table 1. This sensor permits to obtain results with constant quality within the measuring range 55–75 mm (distance between the sensor and measuring surface). For this reason, due to the low amplitude of the displacement of the common mechanical components, the sensor can be placed at any distance within the measuring range from the surface, making it very adaptable for several applications. A particular attention has to be pointed out on the low weight of the sensor; thus, it can be easily mounted on support structures, useful for automated applications with robotic arms.
Characteristics of the commercial LTS used for comparison.
Application on EMA
The EMA is based on the measurement of the system response by means of acceleration, velocity or displacement as well as excitation force, in order to estimate the dynamic behavior through modal parameters, that is, natural frequencies, mode shapes and damping. 16
In this kind of analysis, LTS can represent a valid solution to measure the dynamic response of the system, that is, the displacement, because it does not require the contact with the surface. Besides the speed up of the (un)mounting operations and the preservation of the surface conditions, the LTS permits to avoid the dangerous effect of the mass loading, 17 caused by adding an extra mass on the structure that modifies its dynamic behavior, especially in lightweight systems.
The EMA by means of acceleration measurements can be performed in different constrain conditions, for example, freely supported or in operative conditions. The main problem of LTS analysis is that it cannot be applied in freely supported conditions, that is, structure suspended with elastic bands. In fact, the displacement related to the structure response to the excitation, given, for example, by means of an impact hammer, has a very high amplitude and may exceed the measure limits of the sensor. This is one of the main disadvantages related to the exploitation of LTS from the EMA standpoint. For this reason, the EMA campaign described in this section has been carried out by using both piezoelectric accelerometer and LTS on a system in clamped condition in order to compare the results obtained, in terms of modal parameters.
Experimental setup
The system studied by means of the following EMA campaign has been designed so that its first natural frequency can be found in the low-frequency range, that is, around 100 Hz, due to the good operation of the displacement analysis at low frequency.
The chosen structure is composed by a circular cross-section beam with a circumferential groove near one end. One end has been clamped by a gripping system, and on the other end, a cylindrical mass has been fixed, as shown in Figure 2.
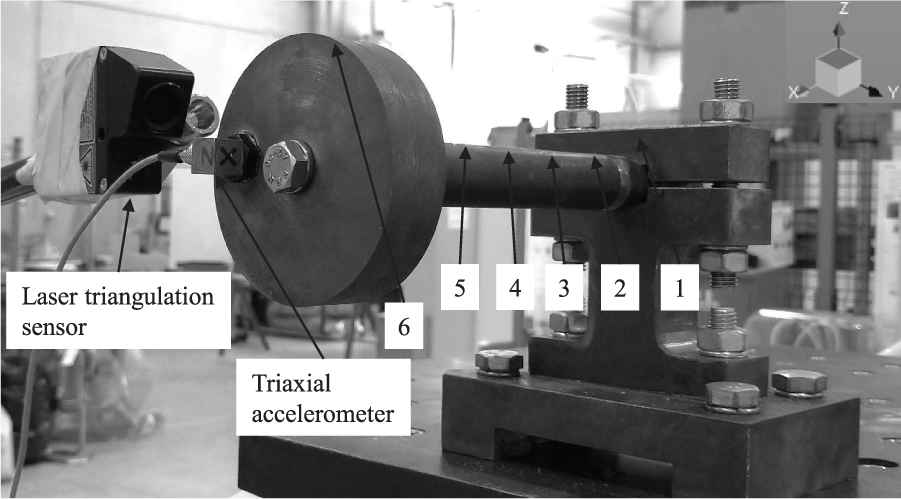
Experimental setup of EMA and description of excitation points.
An impact hammer model PCB 086D05 has been used in order to excite the different measurement points, well described by Figure 2, and the responses have been measured in point 6 through both LTS and triaxial piezoelectric accelerometer model PCB 356B21 (frequency range 1–10,000 Hz), in order to obtain the frequency response function (FRF) of the system, that is, the ratio between the spectra of the response and excitation.
During the EMA, one point at time has been excited, while the response has been measured in the same place in order to extract the FRFs among all the considered points (the roving hammer method). According to the reference system illustrated in Figure 2, the excitation has been applied in the Y direction, this being the measurement direction of the laser. The signals have been acquired with a sample frequency of 4096 Hz and a frequency resolution of 0.1 Hz.
Results
Once the experimental modal test has been performed, the modal parameters of the analyzed system are available for all modes in the frequency range of analysis. In order to prove the effectiveness of the displacement analysis by means of LTS, natural frequencies, mode shapes and modal damping estimated from both analyses have been compared, taking the accelerometer one as reference. To perform the modal analysis and to extract the modal parameters of the system, the PolyMAX 18 algorithm has been used.
Figure 3 reports the FRFs calculated by exciting the system in all the considered points and measuring the response in the same point, starting both from displacement and acceleration analysis (namely, compliance and inertance, respectively) in order to compare the natural frequencies of the structure detected in the frequency range between 0 and 700 Hz. The natural frequencies are defined by the peaks clearly shown in figures, and it can be immediately observed that the displacement analysis is able to extract only the first one with respect to the acceleration analysis that extracts all the natural frequencies in the considered band.
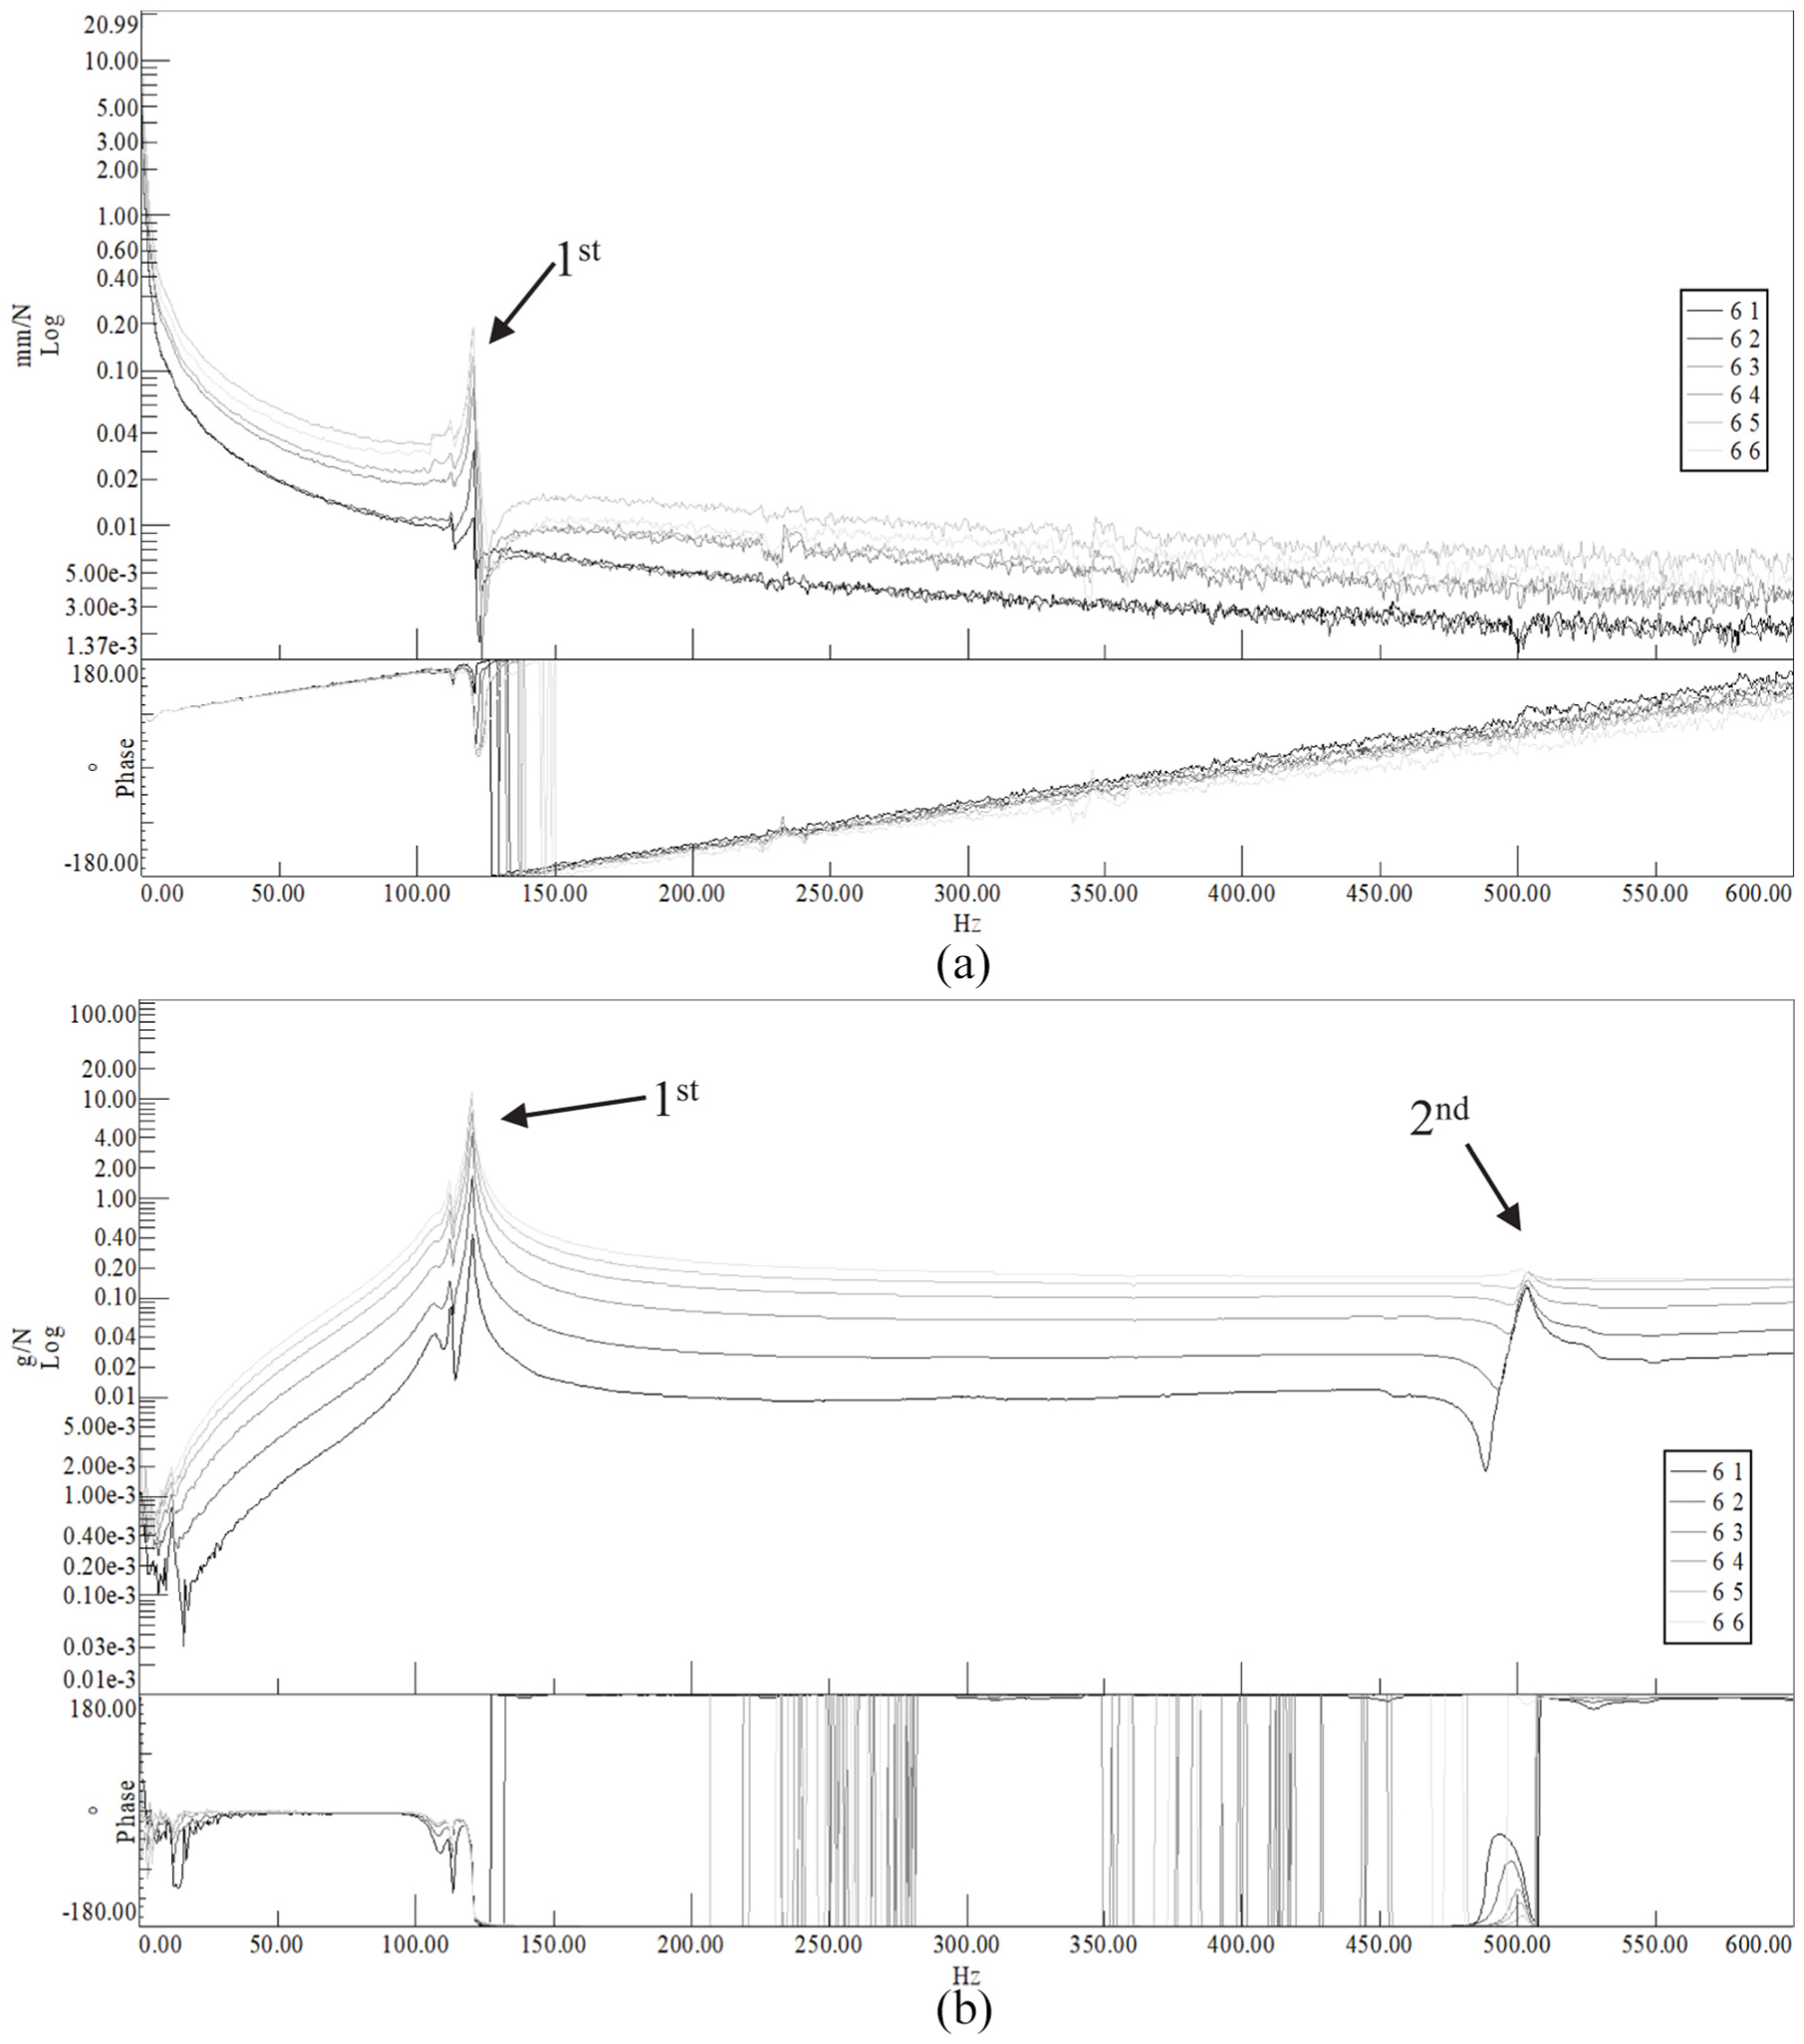
FRFs (amplitude) from (a) displacement signal (compliance) and (b) acceleration signal (inertance).
The direct comparison between the two FRFs shown in Figure 3 highlights the frequency range restriction that represents the main issue related to the exploitation of displacement analysis instead of acceleration analysis. This low frequency restriction is directly related to the resolution of the LTS. In fact, starting from the amplitude of the acceleration spectrum, it is possible to calculate the respective amplitude of the displacement spectrum, as described by Bendat and Piersol 19

where
This relation clearly explains the frequency variable scaling factor between acceleration and displacement. In particular, at an increasing frequency, the amplitude of the inertance has to be high enough in order to give a related compliance with sufficient amplitude; in fact, the FRF is directly related to the spectrum of the response that must have sufficient amplitude to be measured by the LTS, taking into account of its resolution. The response spectrum calculated from acceleration has an amplitude of 1.7 and 0.025 g associated with the first and second natural frequencies, respectively. By applying equation (1), the amplitude of the displacement spectrum at the first two natural frequencies is 29.3 and 0.025 μm, respectively. Due to the LTS resolution, 1 μm, the transducer is able to detect only the first natural frequency, as already shown in Figure 3.
Table 2 collects the natural frequencies and the modal damping for the system being tested both from displacement and acceleration analysis. The values of the first natural frequency from the two different analyses are the same, and the difference between the two modal damping factors is quite negligible, around 18%. 20 This can be considered satisfactory, taking into account the uncertainties related to the damping estimation in experimental tests.
EMA results.
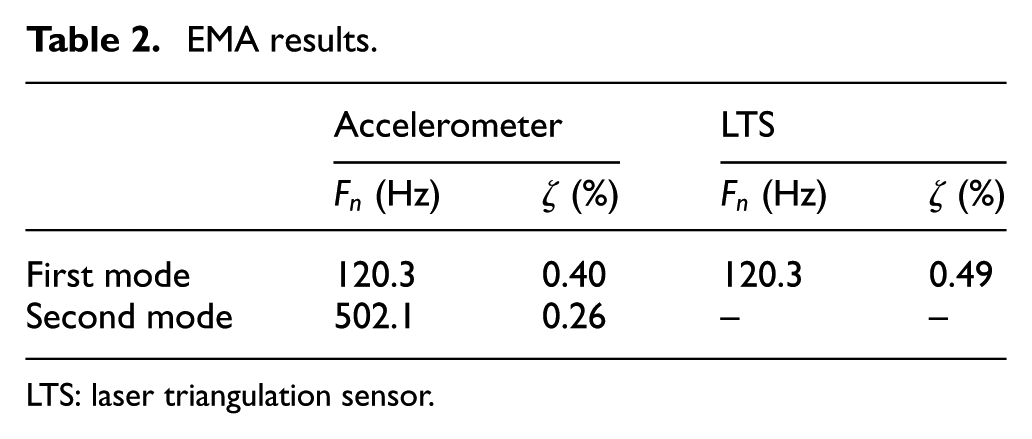
LTS: laser triangulation sensor.
Figure 4 depicts the coherence functions computed for each excitation point in case of displacement and acceleration signal (from top to bottom). This function shows how the output signal, that is, displacement and acceleration, is related to the input signal, that is, force. The value of coherence should be near 1 everywhere except in proximity of antiresonances; the coherence function can be considered an indicator of the measurement quality. Figure 4(a) clearly shows that for the displacement signal, the coherence function at increasing frequency tends to deteriorate and to move away from the ideal value of 1. Once again, this behavior demonstrates the good operation of the displacement signal at low frequency and consequently the frequency restriction related to the exploitation of the LTS for EMA.
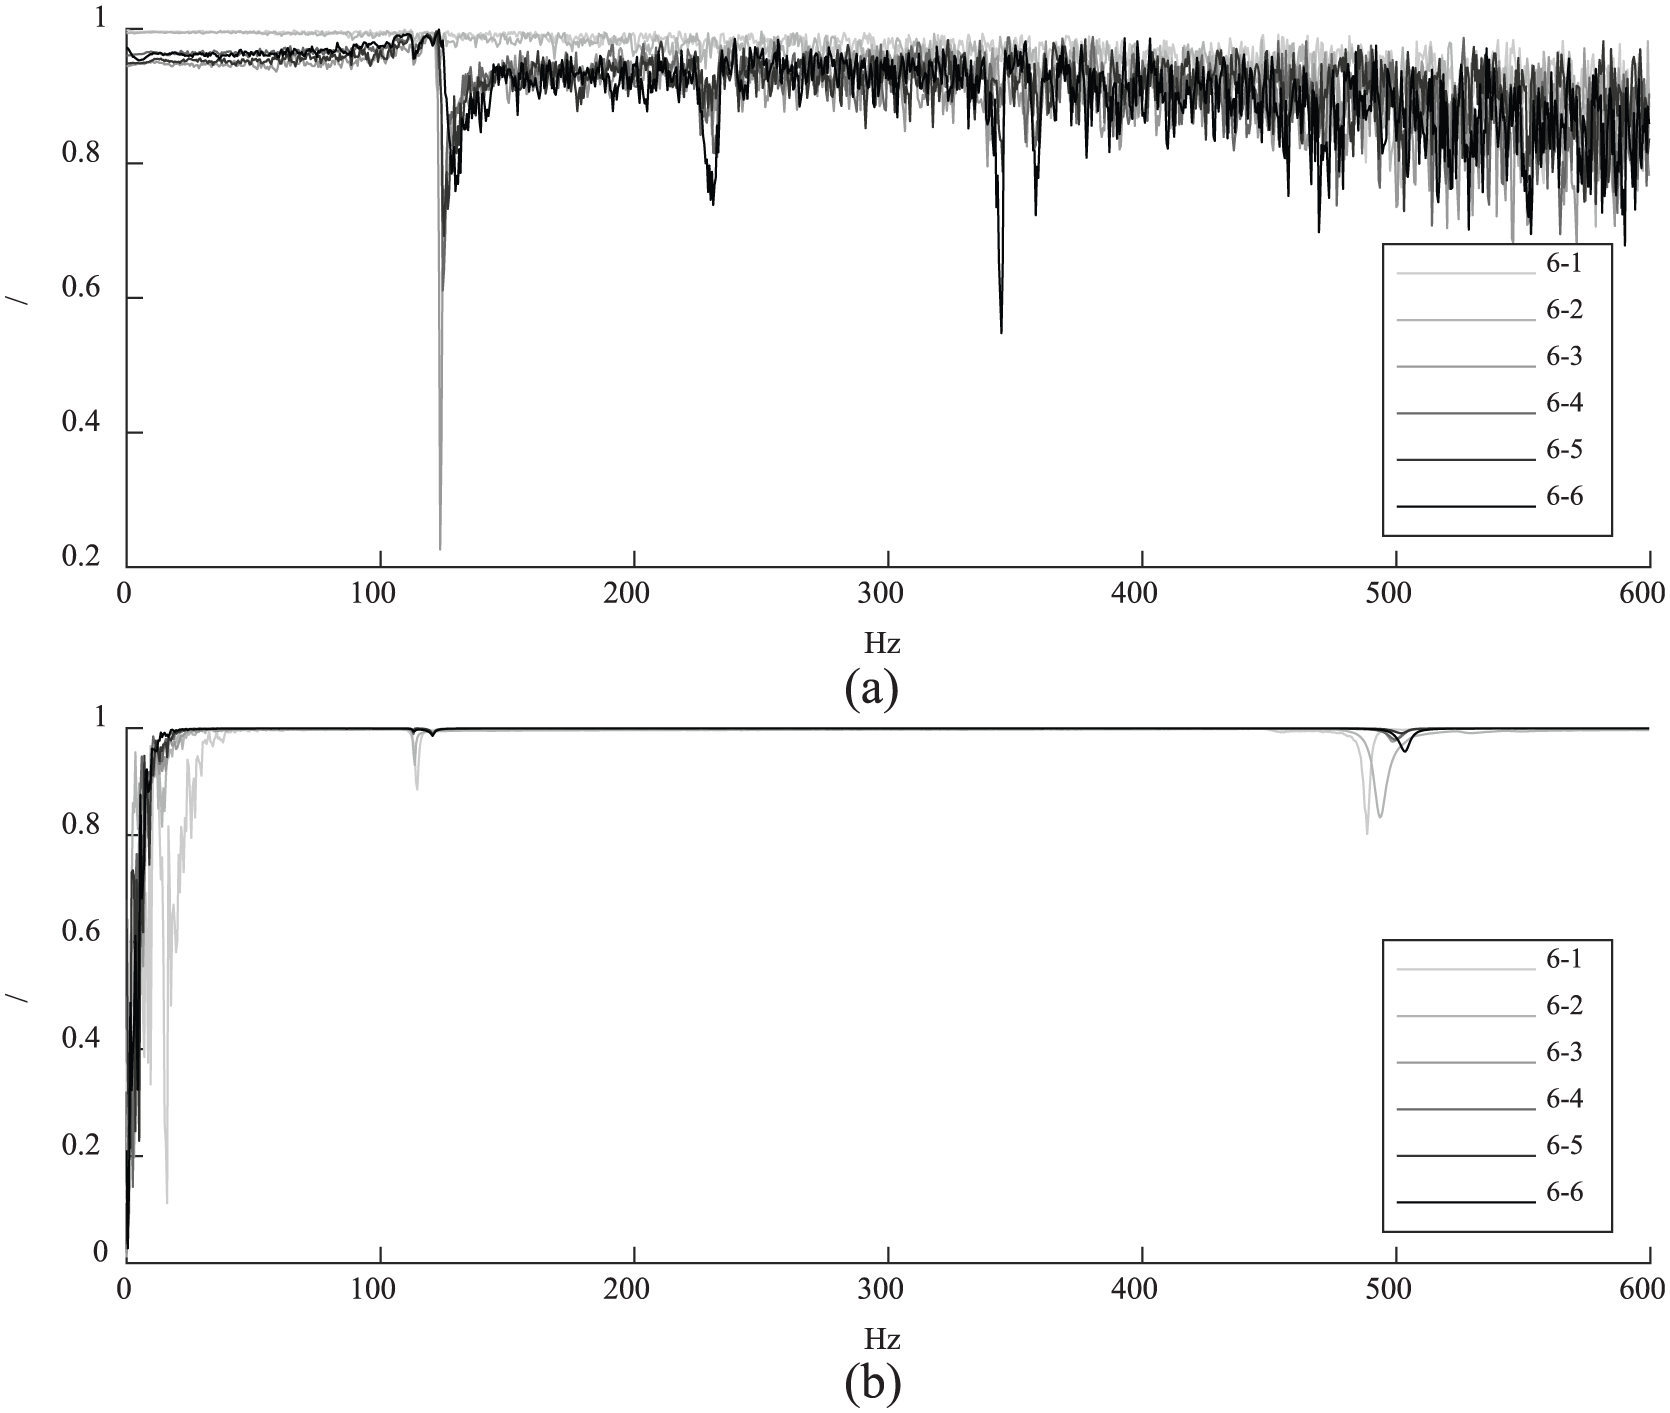
Coherence functions from (a) displacement signal and (b) acceleration signal for excitation in points 1-2-3-4-5-6 and response in point 6.
Figure 5 describes the mode shape associated with the first natural frequency of the structure. The figure clearly shows as in both displacement and acceleration analysis, the first natural frequency is related to a bending mode along the Y direction with the maximum displacement located in point 6 and with point 1 fixed, being it clamped. It has to be noticed that due to the symmetry of the analyzed structure, two bending modes are expected, one perpendicular to each other with the same natural frequency. However, in a real case, these two perpendicular modes may be related to slightly different natural frequencies due to an imperfect symmetry given by manufacturing process and/or different constrain conditions along the two directions. According to this assertion, the first natural frequency is related to two bending modes, one along the Y direction and the other along the Z direction. Nevertheless, for the purpose of this work, only the bending mode along the Y direction has been considered during the analysis. For the sake of clarity, the second natural frequency is detected both by the acceleration analysis and the displacement analysis as it can be seen in Figure 3 (small peak close to the first natural frequency).
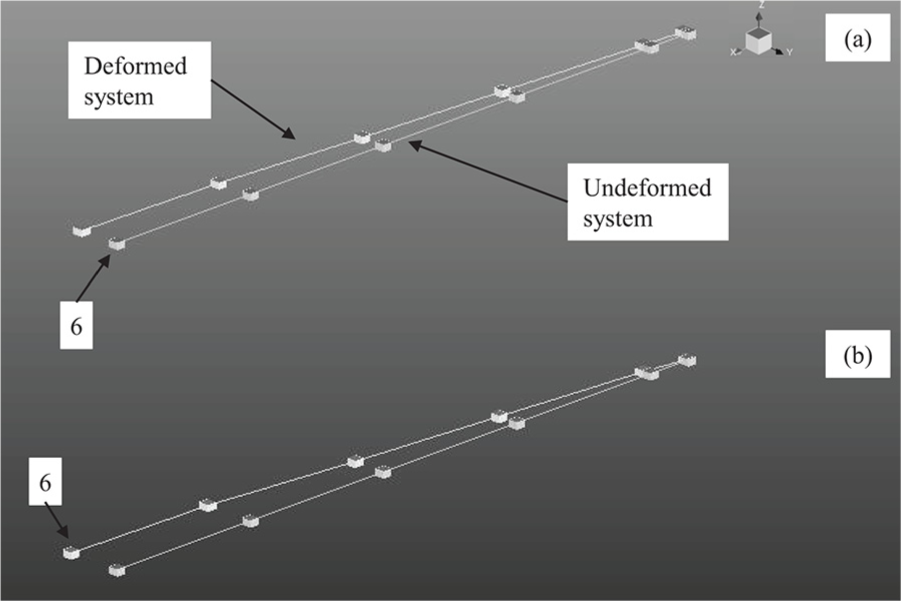
Representation of the first mode shape at 120 Hz from (a) displacement signal and (b) acceleration signal.
The direct correlation between the modes is also underlined by Table 3 that depicts the Modal Assurance Criterion (MAC) 21 calculated between the mode shapes obtained from the displacement and acceleration analysis. This parameter represents a measure of the degree of correlation between two mode shapes: MAC values close to 0 indicate that two modes present different shapes and values higher than 0.7 indicate good correlation. The table shows a MAC value of 0.98, and consequently, the two results can be considered equivalent.
MAC values between displacement and acceleration EMA.
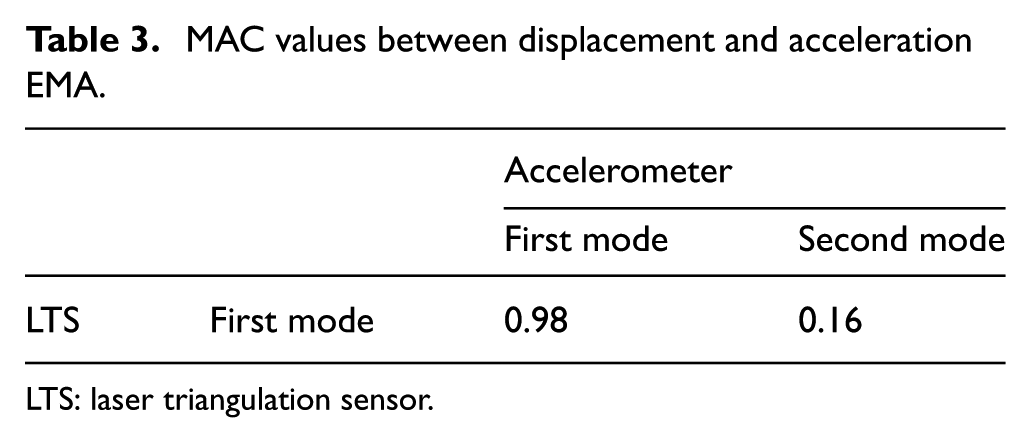
LTS: laser triangulation sensor.
The comparison presented in this section demonstrates that the displacement analysis by means of LTS can replace the classic acceleration analysis for EMA application in the low-frequency range.
On the other hand, another disadvantage related to the use of LTS for EMA is represented by the possibility of studying the behavior of the system only along one direction at time, the sensor being a uniaxial one with respect to the triaxial accelerometer used for the comparison.
Once the relation between displacement and acceleration has been explained in equation (1), a comparison between the sensitivity and accuracy of the sensors used for the analysis can be done in order to verify their real comparability from this point of view. Figure 6 compares the sensitivity and the accuracy of both LTS and piezoelectric accelerometer used for the comparison in terms of displacement in the frequency range up to 200 Hz. The figures clearly show that the sensitivity of LTS does not depend on the frequency range, being it given in terms of displacement. The accelerometer sensitivity (and consequently the accuracy) in terms of displacement is a function of the frequency. In fact, this sensitivity is given in terms of acceleration, that is, 10 mV/g; thus, it has to be scaled according to the frequency variable scaling factor given by equation (1). It is possible to note that in the frequency range of analysis, the sensitivity and the accuracy of both sensors are comparable; thus, the transducers permit to obtain results under the same measurement conditions, that is, the measures are not affected by performance differences between the sensors.
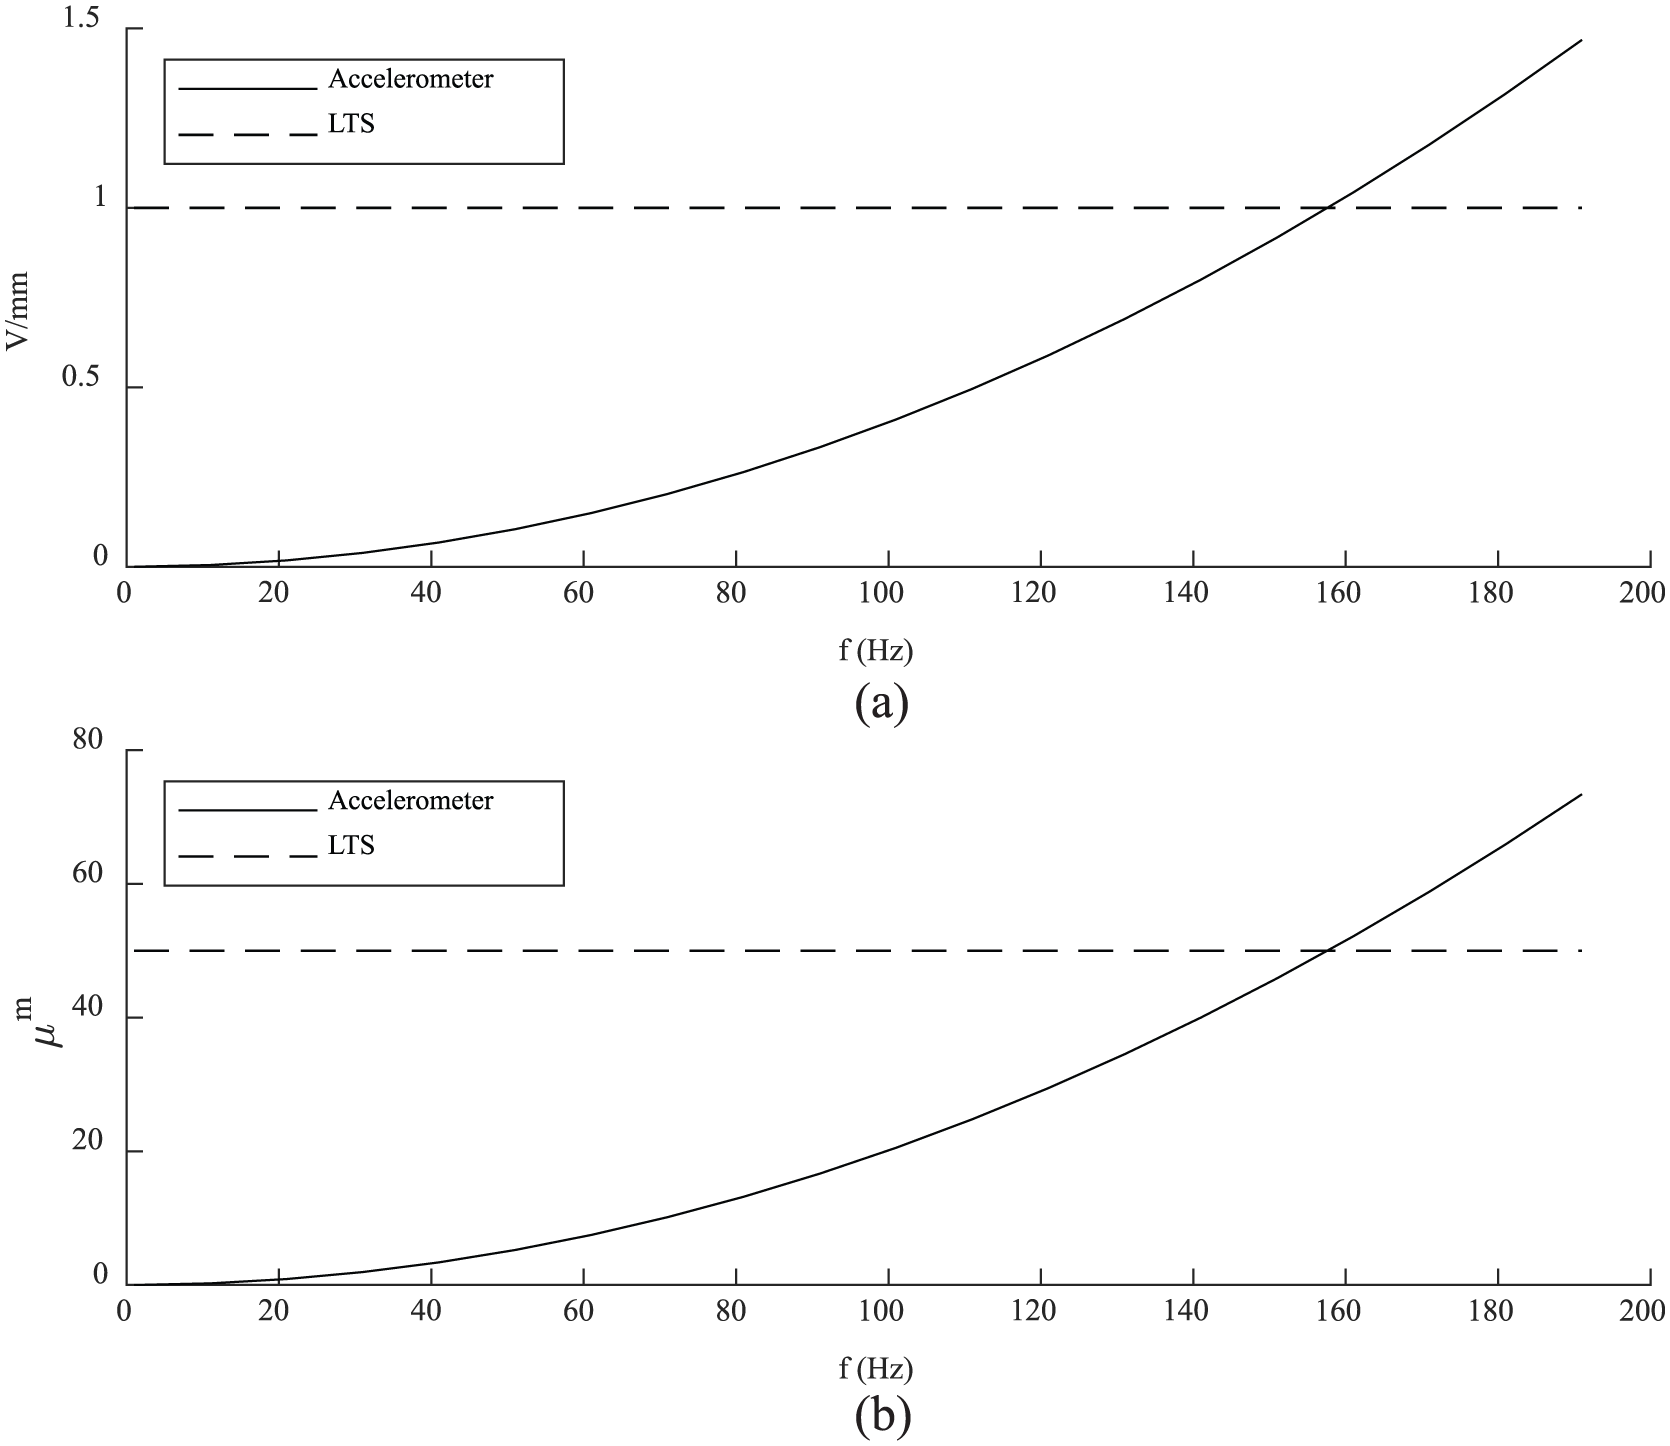
Comparison between (a) sensitivity and (b) accuracy of LTS and piezoelectric accelerometer in terms of displacement.
Application on vibrational diagnostics
Vibrational diagnostics aims to extract information regarding the healthy state of rotating machines from the acquired vibration signals. The term vibrational diagnostics includes the detection and identification of several anomalies such as bearing and gearbox faults 11 and imbalance or misalignment of rotating shafts.22,23 This work focuses on the analysis of an unbalanced rotor and of a gear tooth spall in order to compare the results obtained by the application of the genuine signal processing techniques from both displacement and acceleration signals.
Unbalanced rotor
The identification of the imbalance of a rotor is pivotal in the vibrational analysis due to the induced rotating forces that excite the entire structure and consequently increase the overall vibratory level of the machine. The imbalance of the rotor can be identified directly through the observation of the spectrum of the acquired signal. In fact, due to the rotating forces induced by the imbalance, the spectrum of the signal clearly shows the component related to the rotational frequency, this being the excitation frequency of the system. Thus, the frequency restriction related to the exploitation of LTS for this kind of analysis can be underlined by increasing the rotational speed of the unbalanced shaft. As a matter of fact, according to what has been stated in the previous section, at increasing speed, the fundamental frequency may be no longer detectable by the displacement spectrum.
Hereafter, the unbalanced rotor, shown in Figure 7, with imbalance generated by an applied additive mass, has been analyzed at increasing rotation speed through both LTS and triaxial piezoelectric accelerometer model PCB 356B21.
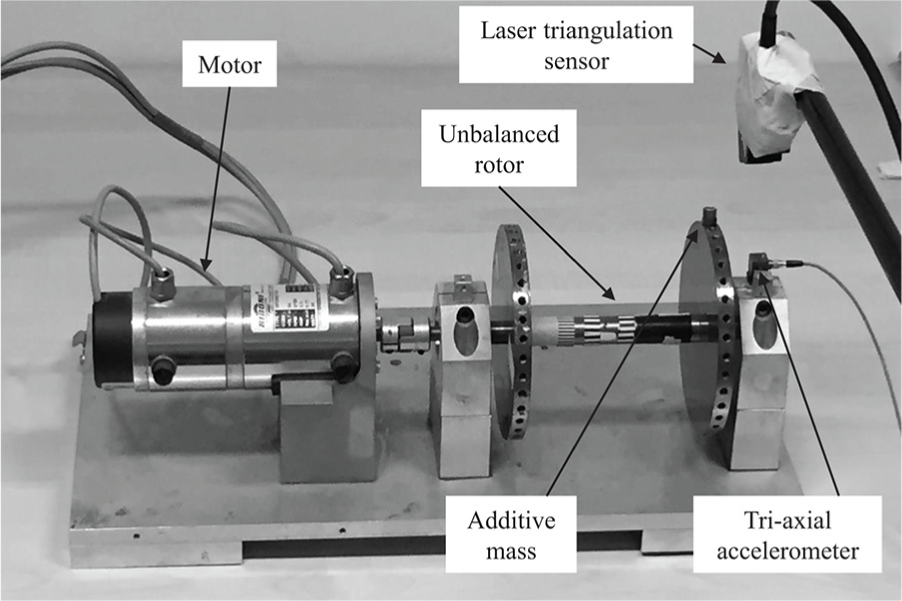
Experimental setup of unbalanced rotor analysis.
Figure 8 depicts the spectra calculated by the acceleration (a-c-e-g) and displacement signals (b-d-f-h) at 30, 40, 45 and 48 Hz (from top to bottom). The first aspect to be noticed is that the displacement signal spectrum is able to extract, at each speed step, only the rotational frequency, instead of the acceleration signal that also identifies the other harmonics.
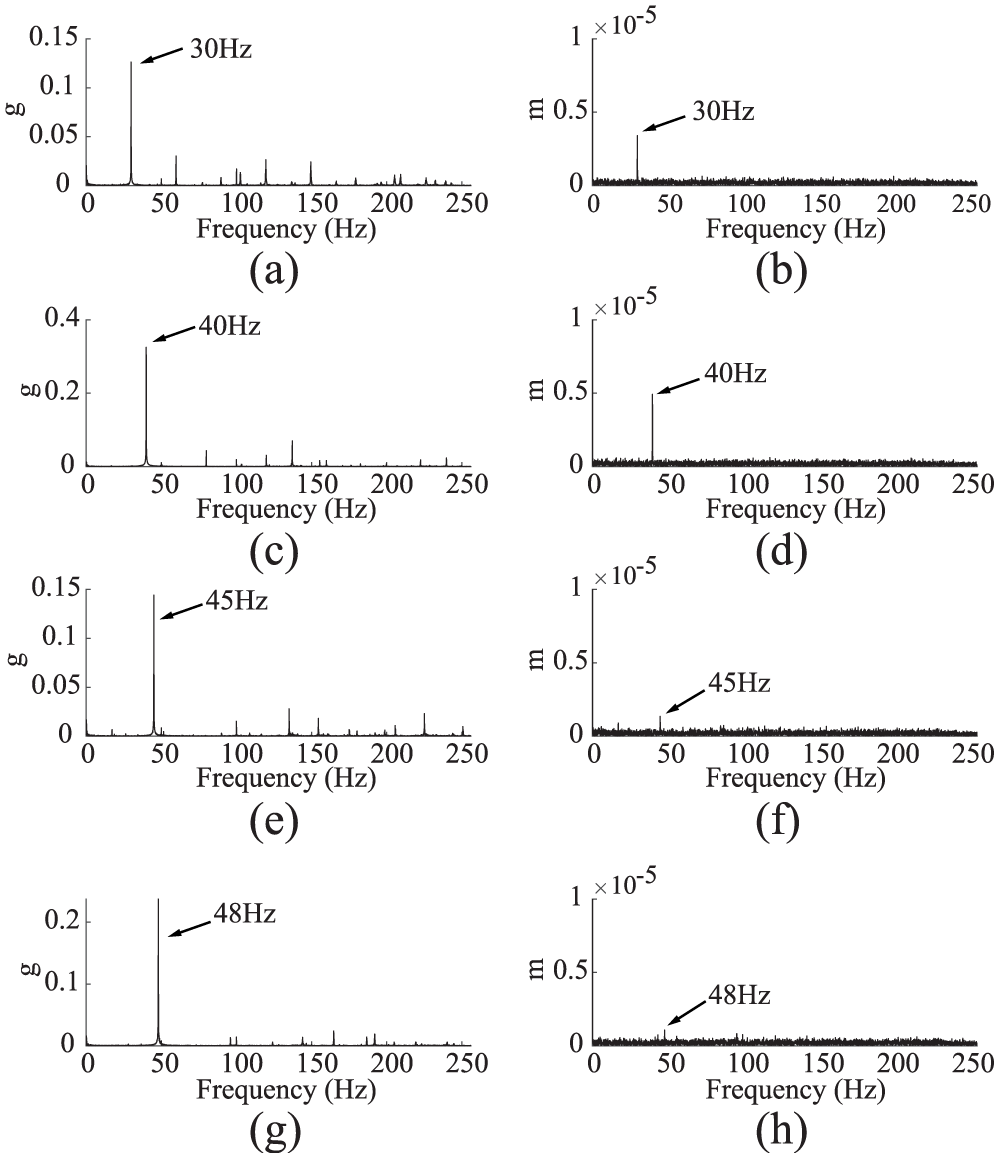
Spectrum of unbalanced rotor at increasing rotation speed from acceleration signal (a-c-e-g) and displacement signal (b-d-f-h).
Moreover, Figure 8(b)–(d) shows how at very low frequencies, that is, 30 and 40 Hz, the fundamental frequency is easily identifiable with respect to the background noise contributions. On the other hand, in the last steps of the tested speed shown in Figure 8(f)–(h), that is, 45 and 48 Hz, the first harmonic has a weak magnitude, strongly masked by the background noise; this behavior disables the detection of the imbalance, difficult to identify.
The low amplitude of the frequency contribution related to the rotation speed, in terms of displacement, further reduces the operating range of the LTS. This means that the additive mass produces a low magnitude imbalance; thus, starting from the amplitude of the first harmonic in the acceleration spectrum, the respective amplitude in the displacement spectrum calculated with equation (1) already falls below the resolution of the LTS at 50 Hz.
According to the results described above, the LTS can be seen as a low-pass filtering transducer, and the cut frequency depends on both sensor resolution and system characteristics. The operative frequency range can be enlarged with system characterized by high response amplitude, for example, rotors with high imbalance or analyzing system in condition of critical speed. In fact, if the rotational speed meets the critical speed of the considered shaft, the amplitude of the response increases significantly, thus may give a component that can be detected by the LTS even at higher frequencies, according to its resolution.
Gear tooth fault detection
For the analysis described below, the two-stage gearbox described in Figure 9(b) with a faulty gear (milled tooth) has been tested. The machine configuration, as shown in Figure 9(a), is composed of an electrical motor, a gearbox and a brake. The test has been carried out with a 10% load and a rotational frequency of the input shaft of 5.5 Hz. The value chosen is very low in order to obtain a gear mesh frequency, defined as the product between the rotational frequency and the number of teeth, in the very low-frequency range, that is, around 100 Hz.
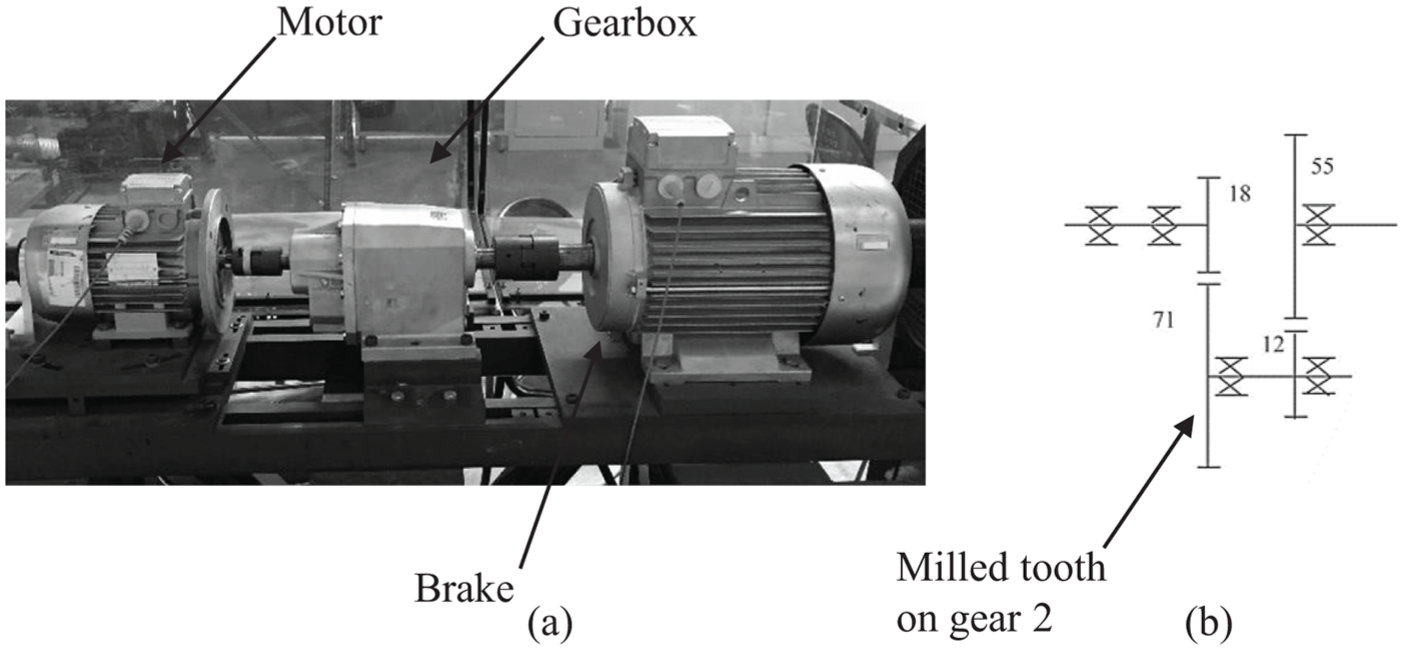
(a) Diagnostic analysis experimental setup and (b) gearbox scheme.
The diagnostic analysis has been performed through both acceleration and displacement signals, acquired with a triaxial piezoelectric accelerometer model PCB 356B21 and the LTS, respectively. This part of the comparison aims to demonstrate that the displacement analysis by means of LTS gives the same results of the acceleration analysis for the gear fault detection. For this purpose, the classic diagnostic techniques, for example, order tracking, time synchronous average, amplitude and phase demodulation, have been applied directly from the acquired signals.
Figure 10 compares the spectrum of the faulty gearbox in the range between 0 and 350 Hz obtained starting from both acceleration and displacement signals. In the first one, related to the acceleration, it is possible to clearly identify the gear mesh frequency at 99 Hz and its harmonics, besides the harmonics of the rotational frequency. The second one shows only the rotational frequency and its first harmonics, but it is not able to extract the gear mesh frequency. For this reason, the entire analysis cannot be performed with the LTS because all the techniques mentioned above are based on the identification and extraction of this characteristic frequency of the gear.
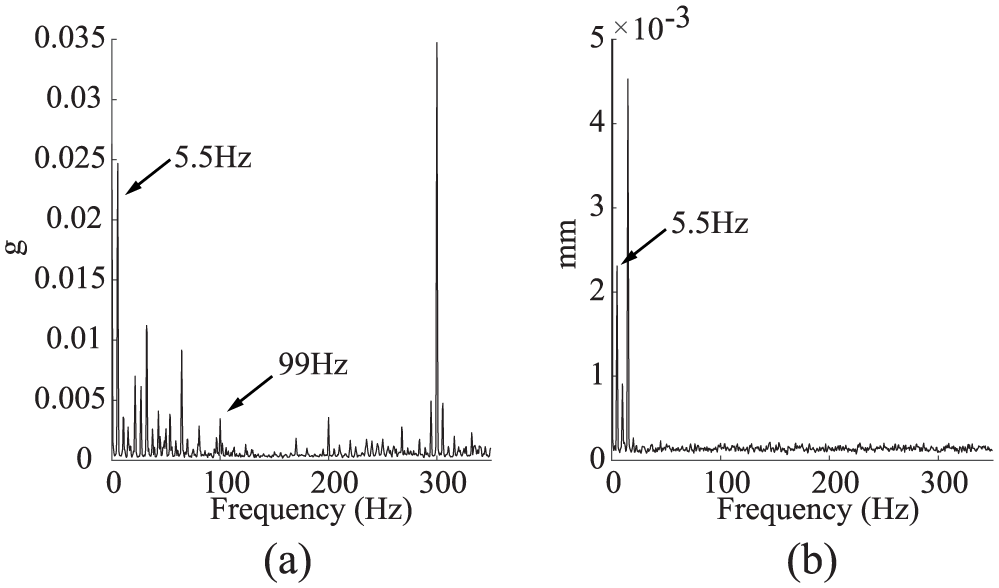
Spectrum of faulty gearbox from (a) acceleration signal and (b) displacement signal.
The gear mesh frequency cannot be detected due to the low amplitude of its component in the acceleration spectrum. In fact, starting from a value of 0.0035 g in the acceleration spectrum and applying equation (1), the amplitude obtained in the displacement spectrum is 0.087 µm. This value is lower than the resolution of the tested sensor, 1 µm, so the laser cannot detect the gear mesh frequency.
This result confirms what stated in the previous section regarding the behavior of the LTS as a low-pass filter that reduces the operative range of analysis. Thus, the main issue for the exploitation of LTS for vibrational analysis is not represented by the type of sensor used for the analysis, but it is related to the technical features of the laser and to the characteristics of the studied system.
Final remarks
This work demonstrates the effectiveness of the use of LTS for vibrational analysis in order to present this transducer as a valid alternative to the accelerometer, in particular from the industrial standpoint. The comparison between the results obtained in two different fields, that is, structural dynamics and vibrational diagnostics, from both acceleration and displacement signals highlights pros and cons of this alternative transducer.
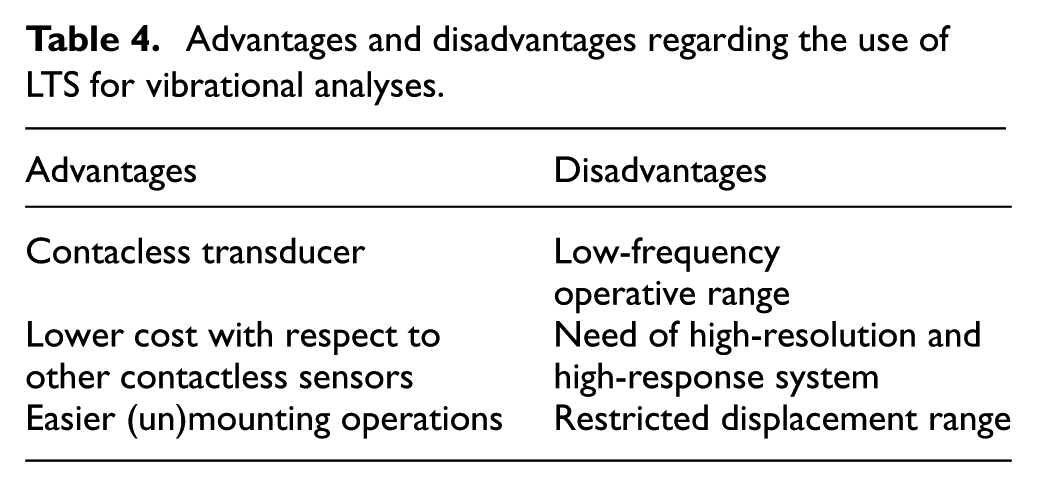
Table 4 collects the main pros and cons related to the exploitation of the LTS for vibrational analysis. The main issue of the exploitation of LTS is represented by the strict relation between the transducer resolution and the operative frequency range in which the displacement analysis can be carried out. In fact, due to the correlation between acceleration and displacement signals in the frequency domain, at high frequencies, the amplitude of the interest components in the acceleration spectrum has to be large enough in order to determine a related component in the displacement spectrum with amplitude sufficient to be acquired by the LTS, taking into account of its resolution.
Advantages and disadvantages regarding the use of LTS for vibrational analyses.
From the structural dynamics point of view, the EMA campaign has stated that the LTS can replace the piezoelectric accelerometer with the only restrictions represented by the limited operative range of analysis and the need to perform the analysis only in clamped conditions.
The same issue has been stated by the application of displacement analysis on the vibrational diagnostics. For the unbalanced rotor, the transducer can measure the rotational frequency only in a low-frequency range due to the low magnitude of this component in the spectrum and to the low imbalance generated by the additive mass. The gear fault, instead, cannot be detected by means of LTS due to the low amplitude of the gear mesh frequency component in the acceleration spectrum of the considered systems.
These problems can be overcome with higher resolution LTS or analyzing system with higher amplitude response, for example, higher dimension system, in order to extend the frequency operative range of the transducer. Nowadays, it is possible to find LTS with resolution up to 0.01 µm. However, the need of higher resolution comes into conflict with the measuring range of the transducer. In fact, the LTS with higher resolution determines a lower amplitude of the displacement measuring range.
On the other hand, the main pros of LTS regard the cost of the sensor, rather low if compared to the standard laser Doppler vibrometer, and the easier (un)mounting operations with respect to the piezoelectric accelerometer, for example, on productive lines for the control operations in industrial plants.
Footnotes
Acknowledgements
This works has been developed within the Laboratory of Advanced Mechanics (MechLav) of Ferrara Technopole.
Declaration of conflicting interests
The author(s) declared no potential conflicts of interest with respect to the research, authorship and/or publication of this article.
Funding
The author(s) received no financial support for the research, authorship and/or publication of this article.