
Abstract
This work presents an experimental study to investigate the influence of step volute tongue on aerodynamic performance and aeroacoustic behavior of a forward-curved fan. The noise characteristics are analyzed and controlled based on measured acoustic pressures for various stepped tongues; meanwhile, fan performance is detected and optimized. The design parameters of the stepped tongues are presented to provide significant physical insight into increasing the static pressure as well as the efficiency of static pressure and reducing the fan noise generation. The comparison of the test results indicates that the improved static pressure and its efficiency of the HLHL model have increased by 15.67 Pa and 3.57%, respectively, by comparing with those of the baseline model. At 740 m3/h, a great correlation between different arrays of stepped tongue and the noise generation was observed. The tonal noise level of the HLHL model is a better optimization scheme because it decreases as much as 1.2 dB for the noise generation of forward-curved fan. In particular, it is found that some stepped tongues of the volute tongue achieved the goal of reducing noise generation and improving the performance of fan by experimental measurement at the same time.
Introduction
Forward-curved fans are used in the air supply of central air conditioning widely requiring relatively low noise and high flow rate.1,2 In general, the main concern is the noise and performance of the forward-curved fan. Especially, reducing the noise of fan is a great potential and a great challenge. 3 The generation of noise of the fan mainly includes three mechanisms: noise is generated aerodynamically which comprises impact noise and turbulent noise; the blade is moving periodically when the wheel is rotating at a high speed and gives a periodic force, which affected the movement trajectory of gas particles; the noise is generated by pushing the pressure waves at the sound speed. The noise of fans is also generated due to turbulence. In particular, it is well known that the most disgusting component to the perception of the tone of human is the blade passing frequency tonal noise. An overview of the generation mechanisms of fan noise and the controlling methods is presented by Neise. 4
Computational fluid dynamics (CFD) method is a solution for classical hydrodynamic problems such as convection and heat transfer.5–8 It is also an important means to simplify the design process of turbomachinery, such as fans and pumps, as well as improve the design level.9–12 However, it is more important to analyze and verify the optimal design products through experiments to achieve better performance and noise control.13–15
Cau et al. 16 argued that a severely distorted primary flow with early flow separation on the suction side at both low and design flow rates occurs due to the poor design of the flow channel in these fans. Zhang et al. 17 conducted an experimental study on a centrifugal fan by a half vane diffuser which can improve fan performance and reduce noise. Sorguven et al.18,19 calculated the acoustic sources of a forward-curved fan using the boundary element method. Velarde-Suárez et al. 20 argued that the main source of the noise is closely related to the distance between the impeller and the volute tongue of fan. Chen et al.21,22 published passive control of centrifugal fan noise using open-cell metal foam by experimental investigation. Qi et al. 23 studied the effects of inclined tongues on the noise of forward-curved fan with an unusual shape. Heo et al. 24 studied the near-field fluctuations of a backward-curved radial fan. Jeon 25 calculated the effects of design parameters on the performance and noise of a centrifugal fan. Few researchers26–28 have studied the tonal noise sources in centrifugal fans by experimental test.
The above brief review of the literature suggests that the interaction between the volute tongue of forward-curved fan and the rotating wheel is the major source of noise generation of fans. Although forward-curved fans generate comparatively a lower level of noise, there is still a great potential to enhance their acoustic comfort by changing the structure of volute tongue. This work presents an experimental study, which has been carried out to investigate the influence of step volute tongue on aerodynamic performance and aeroacoustic behavior of forward-curved fan. The main objective of the study is to establish a certain step tongue volutes of the fan to control the noise generated from the airflow between the volute tongue and the rotating wheel. A large number of experimental measurements are performed to study the effect of step tongue volutes on fan performance and acoustic pressure. It is obtained that some stepped tongues of the volute tongue can provide significant physical insight into improving fan performance and reducing the noise of fan. The rest of the paper includes three parts as follows. In section “Experiment scheme and experiment method,” the experiment scheme and experiment method of fan testing will be briefly described. In the next part, some important phenomena and results of the noise and performance of fan are obtained. Finally, some conclusions are addressed.
Experiment scheme and experiment method
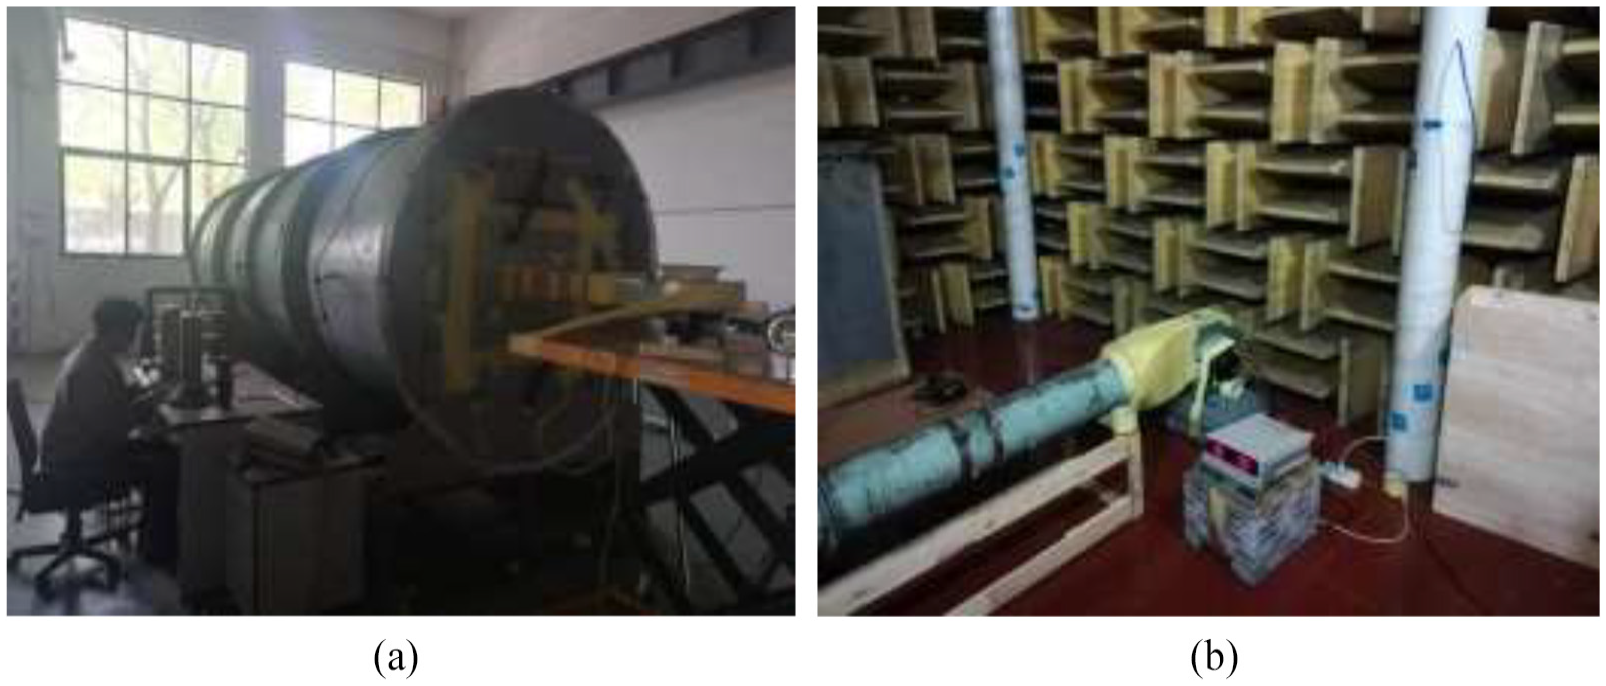
In general, the experimental approach is an ideal choice for any centrifugal fan to investigate the noise and performance characteristics. The baseline model and different modified models are tested by the following performance measuring device and noise measurement device in the state-of-the-art testing laboratory of Yilida, which is constructed based on the standard from Air Movement and Control Association International, Inc. (AMCA). Air performance testing, including airflow performance testing, inlet and outlet sound testing, can be operated at the same time in the anechoic room and reverberation room, which are newly constructed in Yilida.
Performance measuring device for testing centrifugal fan
The devices used here are illustrated in the following sections. The performance measuring device for testing centrifugal fan is illustrated schematically in Figure 1. The measuring device for testing centrifugal fan is manufactured by AMCA International standard. The centrifugal fan is placed at the entrance of the performance measuring device, and an auxiliary fan is placed at the outlet, as shown in Figure 1. Steady flow network in the chamber can provide stable flow patterns for measurement. Pairs of nozzles are installed in the chamber to obtain various flow rates. A throttling device with an auxiliary fan to control the operating point of the testing centrifugal fan is used at the outlet of the test chamber. The notation and position of each instrument are plotted in Figure 1.
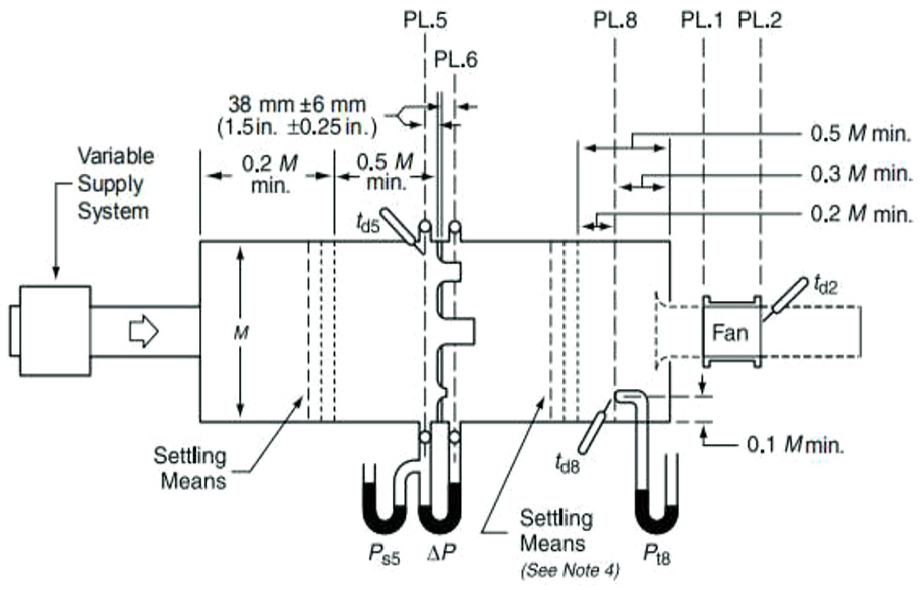
Sketch of the fan performance test installation.
Noise measurement device of testing centrifugal fan
Before the sound measurements are implemented, the device should be calibrated in a chamber to test the noise floor, that is, 31 dB, including test rig priori of the sound measurements. The schematic illustration of the test rig in the laboratory is shown in Figure 2, which is used for the noise measurements. The tested centrifugal fan is put in the middle of the semi-anechoic chamber, where the microphone is the unit placed 1 m away from the inlet of the tested fan to receive signals accurately. Besides, vertical distance between microphone and floor is fixed at 0.8 m to avoid the noise floor and disturb the flow around microphone. The sound pressure is obtained by an electric signal got through the microphone. Then the required noise characteristic is analyzed by the fast Fourier transformation.
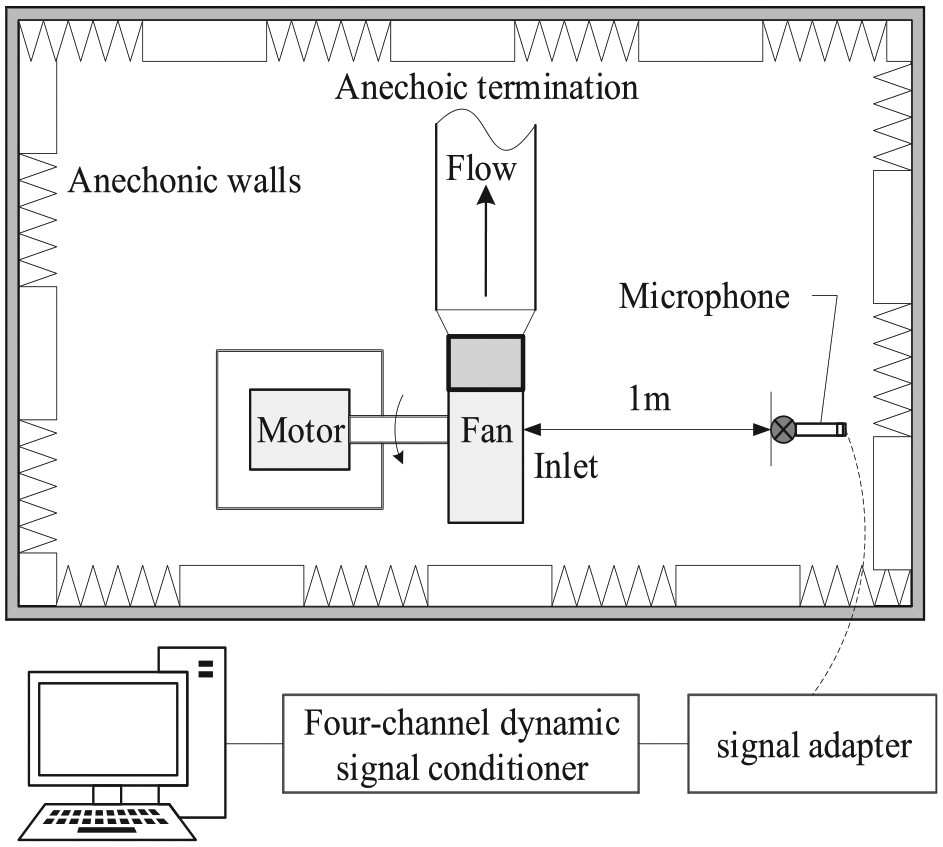
Schematic illustration of the test rig used for the noise measurements.
In general, there are two approaches about measurement of aerodynamic noise of centrifugal fan. The first method is the A-weighted sound pressure level (SPL, in decibel). The A-weighted sound pressure level reflects the two factors of the objective intensity and frequency of noise and is also an approximation to how the human ear perceives the noise. A network of weighting sound pressure level is obtained by the sound signal. The sound pressure level is adjusted by a weighting network. The unit of the A-weighted sound level LA is dB(A). The expression of the A-weighted sound level is obtained by the following equation
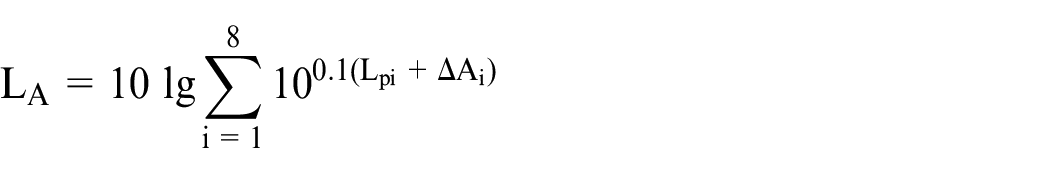
in which L denotes octave sound pressure level. Ai denotes the value of weighting. The LA value of the fans is not only associated with the centrifugal fan size and the speed of centrifugal fan, but also depended on the pressure and the air flow rate.
The second method is the linear sound pressure level, which describes objectively the size of sound pressure. The linear sound pressure level shows that the decibel readings measured without weighting characteristics and are recorded as dB. At present, the A-weighted sound pressure level and linear sound pressure level are considered correspondingly to evaluate the noise of the baseline model and the four modified models.
The baseline model and different modified models
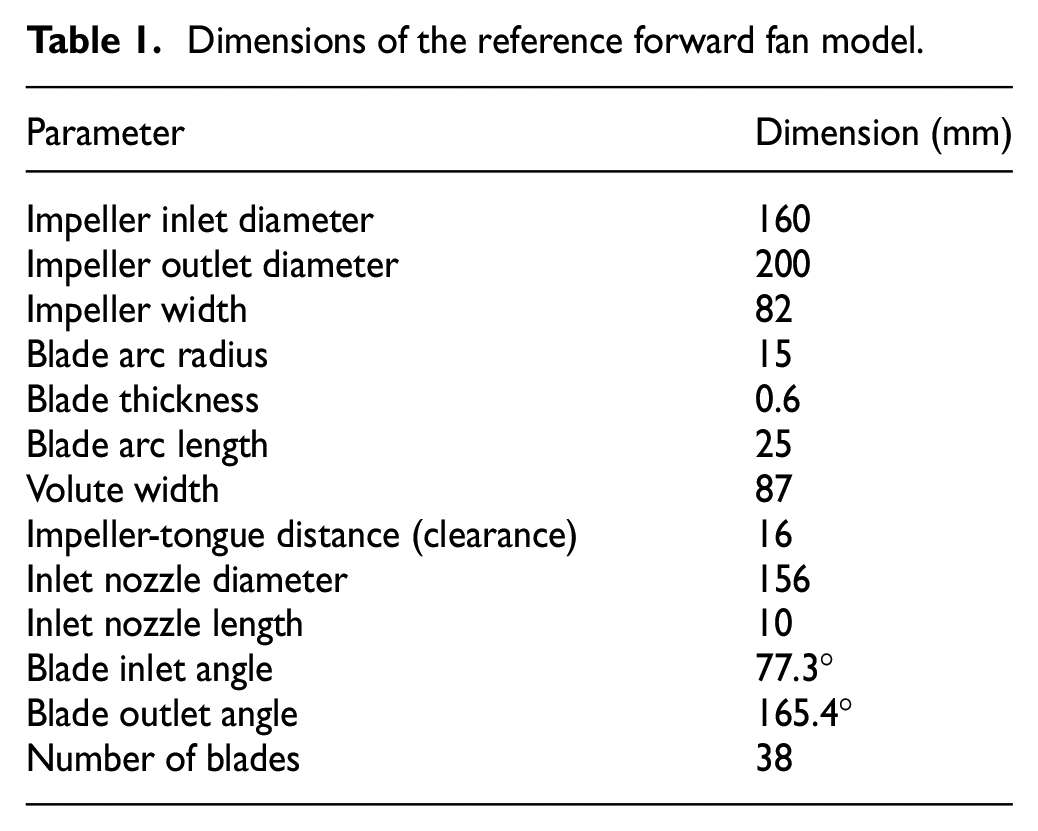
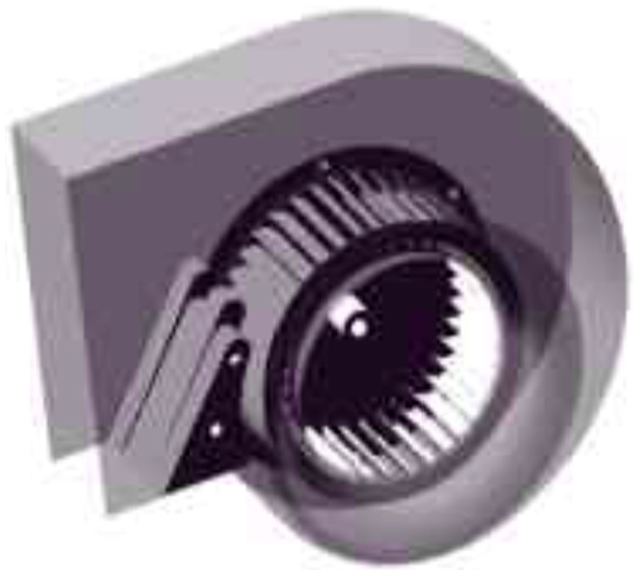
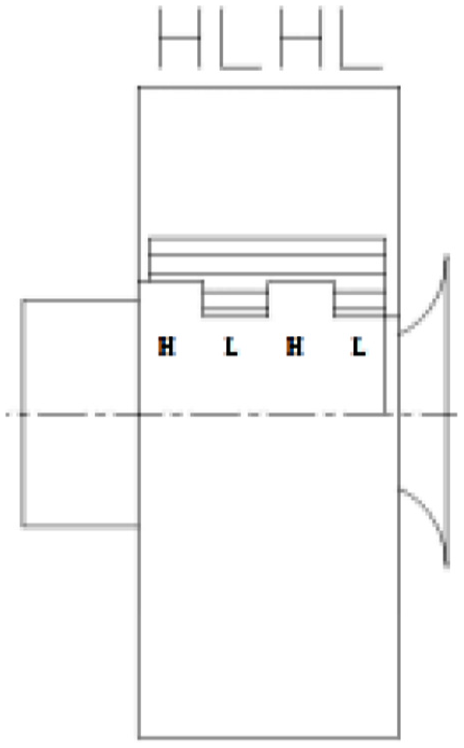
Different modified models are designed by various geometries termed stepped tongues. Several primary dimensions of the baseline forward-curved fan (the baseline model) are represented in Table 1 (the baseline model named “HHHH”). H stands for high with a height of 16.5 mm and L stands for low with a height equal to half of H. Figure 3 shows the geometrically modified model (a stepped volute tongue, “HLHL”). Figure 4 illustrates the straightforward serial number of cut-off geometries. As plotted in Figure 4, a stepped volute tongue named “HLHL” is represented to study the effects on the noise characteristics with various cut-off geometries of the fan. The “HLHL” means the relative position, from the shroud side toward the hub side of each segment, where H denotes high and L denotes low.
Dimensions of the reference forward fan model.
Fan cut-off geometries.
Description of the serial numbers.
Results and discussion
Performance of different fans
The impeller of the fan consists of 38 forward-curved blades, which is considered for both the baseline model and the geometrically modified models. The forward-curved fan is driven by an electrical motor at a speed of 1000 r/min. The performance characteristics of various models are obtained by performing on a chamber test rig. For a range of flow rates, the performance data, such as static pressure (Ps), total pressure (Pt), static pressure efficiency (ηs) and total pressure efficiency (ηt), are obtained. The flow rates of various models are measured by a chamber test rig. Figure 5 shows images of the anechoic termination for the performance (Figure 5(a)) and the noise measurement (Figure 5(b)) in the testing laboratory of Yilida. The baseline model (HHHH) and the four modified models (HHLL, HLHL, LHLH and LLLL) are performed to obtain its performance and acoustic pressure measurements.
Schematic illustration of (a) the test rig used for the performance and (b) noise measurement.
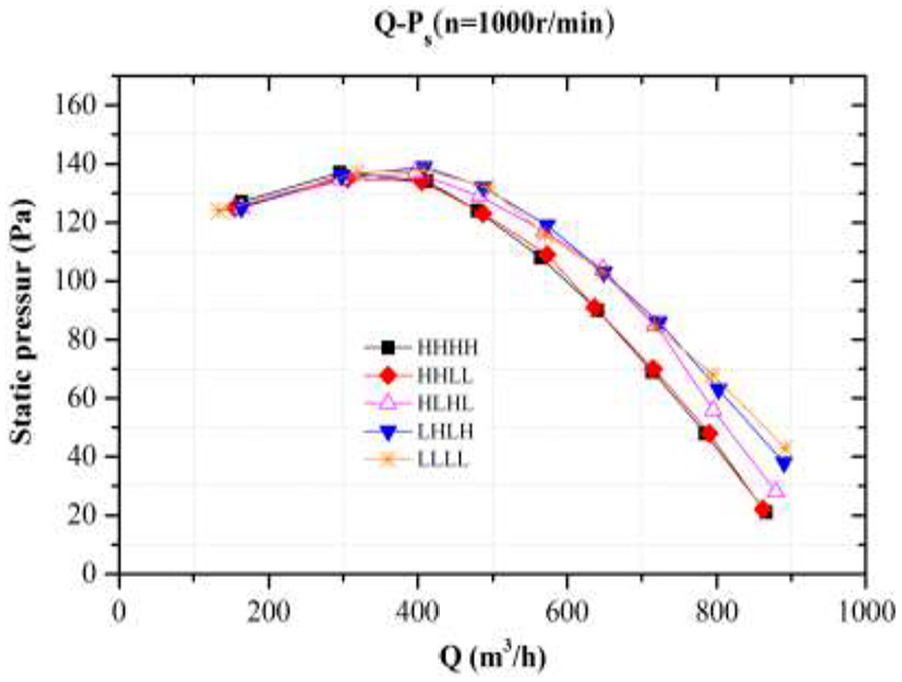
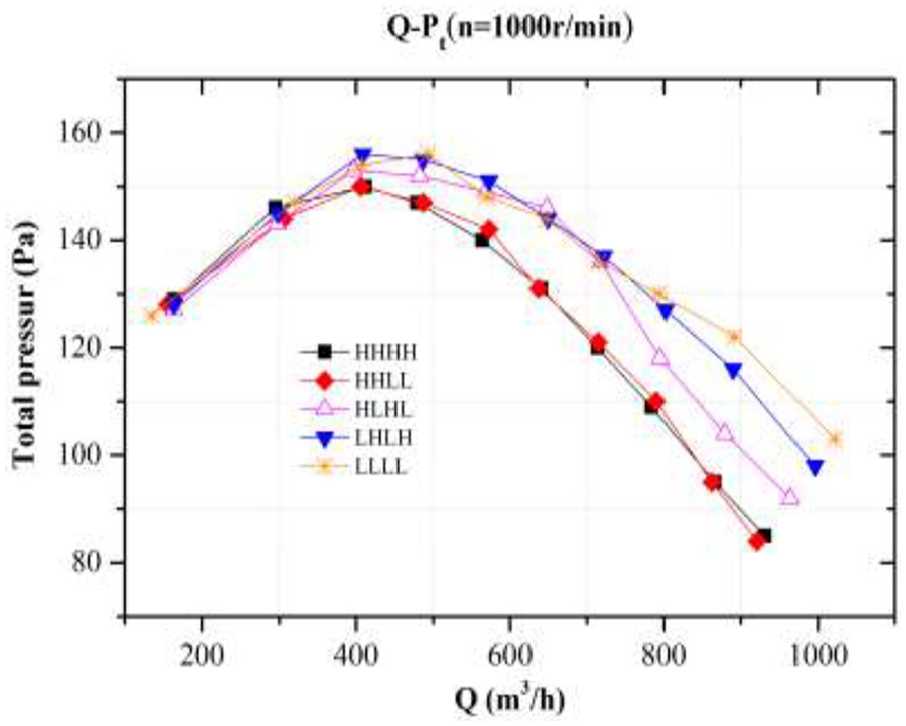
Figure 6 shows the influence on the Ps value at different rates of flow performance curves with the change of volute tongue. It is observed that the static pressure curve of HHLL model is consistent with that of the baseline model (HHHH). It is observed that the Ps value increases with the increase of the outlet section of the fan at high flow rates, although for HLHL model the difference is minimal. The LLLL, LHLH and HLHL models produce an improvement of the Ps value with both medium and high flow rates, and the values are consistent with the baseline model for low flow rates. Especially, the static pressure and the flow rate for the LLLL and LHLH models increase considerably at high flow rates. Compared with the baseline model, it can be concluded that the static pressure of the LHLH model rises as much as 14.12 Pa, whereas the static pressure of HLHL model rises as much as 6.67 Pa at high flow rates. Maximum growth as much as 18.59 Pa of static pressure has been achieved by LLLL model.
Influence of the different stepped tongues on the static pressure.
Figure 7 gives the influence on the ηs value with the change of volute tongue where the influence of the motor is not removed. As shown in Figure 7, the modified volute tongue has affected the ηs value. It exhibits that as the flow rate is larger than 400 m3/h, the LLLL, LHLH and HLHL models produce an improvement of the ηs value. However, as the flow rate is lower than 400 m3/h, the values are close to the baseline model. Especially, the ηs values of the LLLL, LHLH and HLHL models considerably increase and the maximum ηs value can be obtained for the LLLL model at high flow rates. It is further found that ηs value of the LHLH model rises as much as 3.45%, whereas ηs value of HLHL model rises as much as 2.25% at high flow rates compared with the baseline model. The maximum ηs value of the LLLL model rises as much as 4.50%.
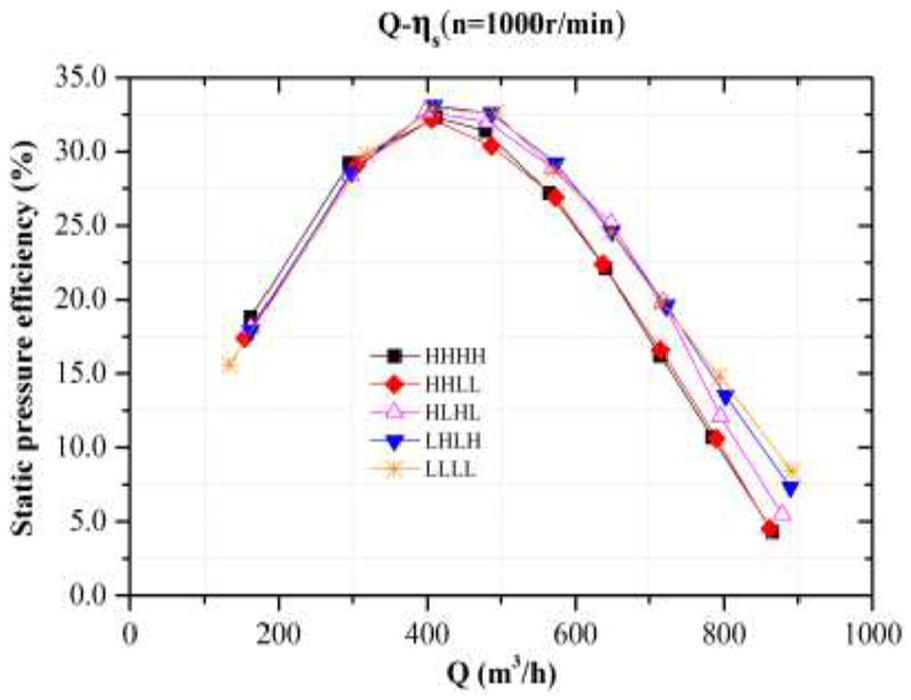
Influence of the different stepped tongues on the static pressure efficiency.
Figure 8 shows the effect on the total pressure with the change of volute tongue. The effect of geometric variation is almost similar to that of changing static pressure as compared with Figure 6. Figure 9 illustrates the influence on the total pressure with the change of volute tongue. As given in Figure 9, it is concluded that the ηt value with the change of volute tongue is almost consistent with ηs value with the change of volute tongue as compared with Figure 7.
Influence of the different stepped tongues on the total pressure.
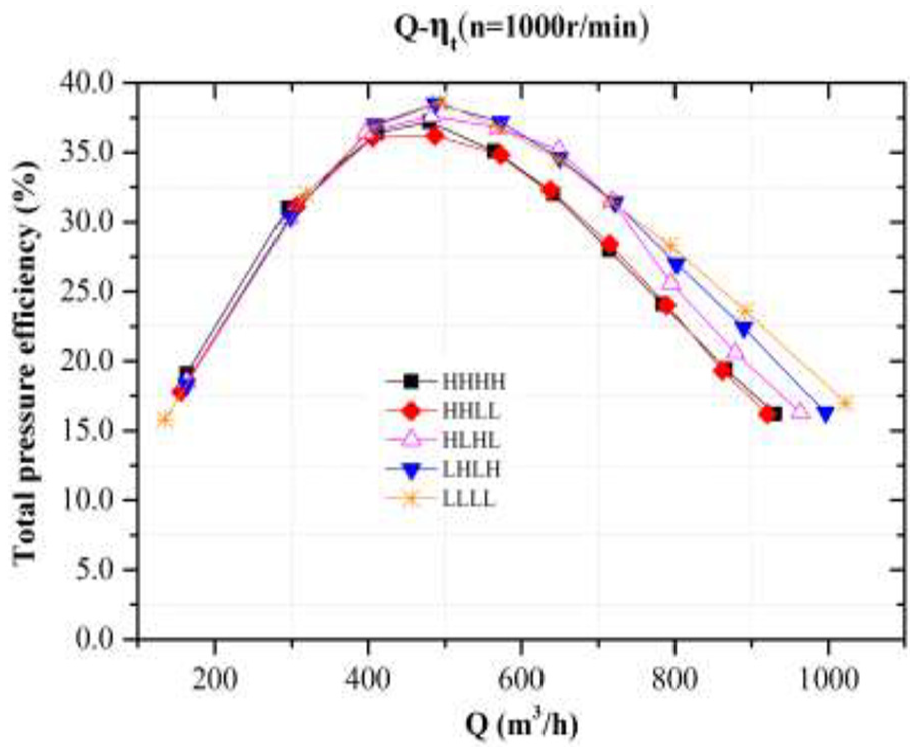
Influence of the different stepped tongues on the total pressure efficiency.
Noise of different fan
The baseline model (HHHH) and the four modified models (HHLL, HLHL, LHLH and LLLL) are tested to obtain its acoustic pressure measurements at three flow rates. According to Figure 10, the influence in reducing the tonal noise of the fan is presented at three flow rates, which also depicts the ability of the tonal noise reduction with the stepped volute tongue. It is also observed that the tonal noise of the fan also gradually increases with the increase of the flow rate. At 1010 m3/h, there is no obvious change between the baseline model and different stepped volute tongues. The best effect is only that the tonal noise level of the HLHL model is reduced as much as 0.5 dB by comparing with that of the baseline model at 1010 m3/h. However, it is observed that at 740 m3/h, the tonal noise level of the stepped volute tongues is always obviously lower than that of the baseline model. Especially, the tonal noise level of the HLHL model is reduced as much as 1.2 dB by comparing with that of the baseline model at 740 m3/h. The trend of variation at 409 m3/h between the stepped volute tongues and the baseline model is consistent with that of 740 m3/h. The tonal noise level of the HLHL model is reduced as much as 1.0 dB by comparing with that of the baseline model at 409 m3/h. It is found in Figure 10 that the HLHL model is effective at most of the flow rates to reduce the tonal noise level.
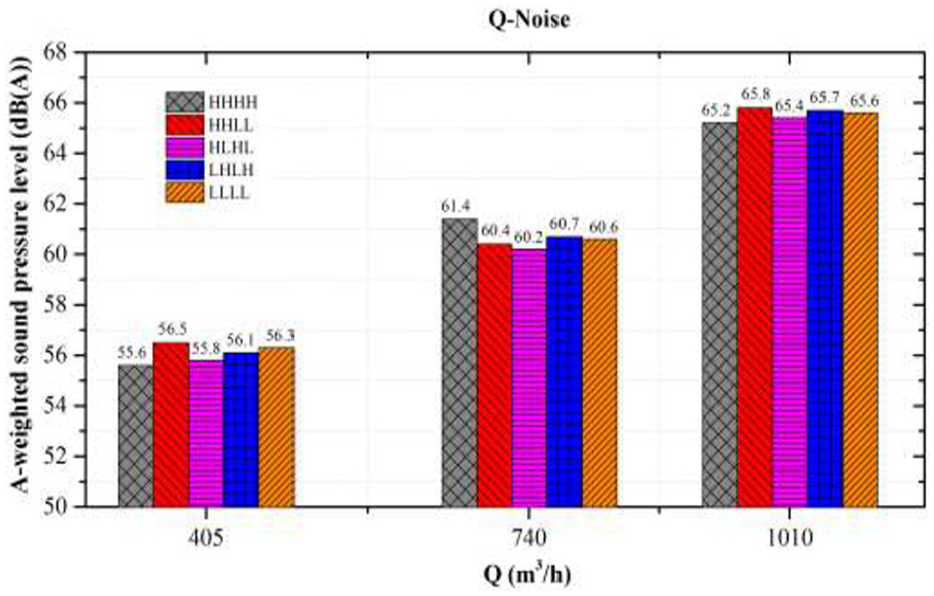
Influence of the different stepped tongues in reducing the tonal noise of the fan.
Figure 11 shows the influence of the different stepped tongues on the A-weighted sound pressure level at Q = 1010 m3/h, in which the X-coordinate represents the logarithmic frequency and Y-coordinate denotes LA value. As shown in Figure 11, it is observed that as the frequency increases at two ranges from 50 to 315 Hz and from 500 to 2000 Hz, the LA value also gradually increases. Nevertheless, a valley of LA value at 400 Hz appears for LHLH, HLHL, HHLL and HHHH models. And for the LLLL model, a valley of LA value appears at 500 Hz. As the frequency increases from 2000 to 10,000 Hz, the LA value gradually decreases. It is also obtained that the LA value of the LLLL model is obviously lower than that of other models within the range from 50 to 315 Hz. At 400 Hz, the LA value of the LLLL model is 48.9 dB, the LA value of the LHLH model is 43.7 dB and the LA value of HLHL, HHLL and HHHH models is 40.7 dB. The LA value of the HLHL model at a range from 50 to 2000 Hz is slightly lower than that of other models.
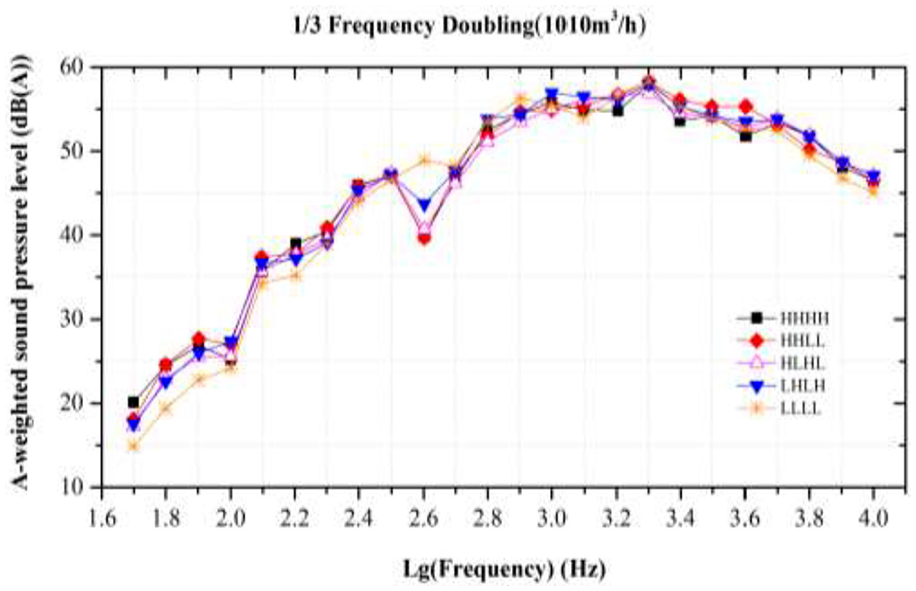
Influence of the different stepped tongues on the A-weighted sound pressure level at Q = 1010 m3/h.
Figure 12 shows the influence of the different stepped tongues on linear sound pressure level at Q = 1010 m3/h. As shown in Figure 12, it is obvious that as the frequency increases within the range from 50 to 315 Hz, linear sound pressure level increases at a range from 47.5 to 53.5 dB. A valley of linear sound pressure level at 400 Hz appears and the value of linear sound pressure level is about 45.5 dB for LHLH, HLHL, HHLL and HHHH models. However, for the LLLL model, a valley of linear sound pressure level at 500 Hz appears and its value is at about 51.4 dB. As the frequency increases within the range from 500 to 2000 Hz, linear sound pressure level increases within the range from 49.4 to 55.7 dB. It is also seen that as the frequency increases within the range from 2500 to 10,000 Hz, linear sound pressure level decreases within the range from 53.4 to 48.6 dB. It is also obtained that linear sound pressure level of the HLHL model is mostly lower than that of other models within the range from 400 to 10,000 Hz.
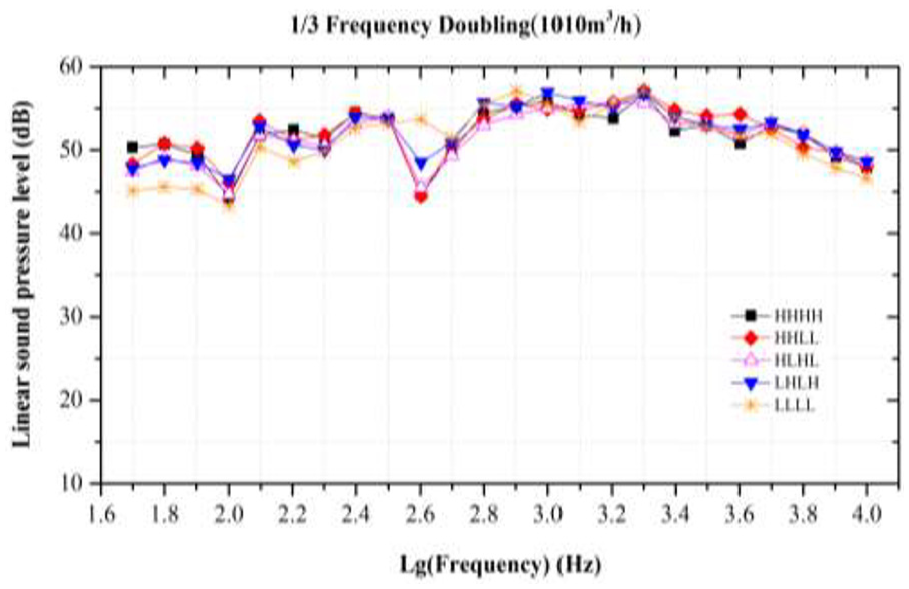
Influence of the different stepped tongues on linear sound pressure level at Q = 1010 m3/h.
The influence of the different stepped tongues on the A-weighted sound pressure level at Q = 740 m3/h is presented in Figure 13. It is seen that as the frequency increases at two ranges of 50–315 and 500–800 Hz, the LA value also gradually increases. Nevertheless, a valley of the LA value at 400 Hz appears for all models and also a peak of the LA value at 800 Hz appears. As the frequency increases within the range from 1000 to 10,000 Hz, the LA value gradually decreases. It is also obtained that the LA value of the LLLL model is obviously lower than that of other models within the range from 50 to 400 Hz. At 400 Hz, the LA value of the LLLL model is 35.5 dB. The LA value of the HLHL model within the range from 500 to 10,000 Hz is mostly lower than that of other models.
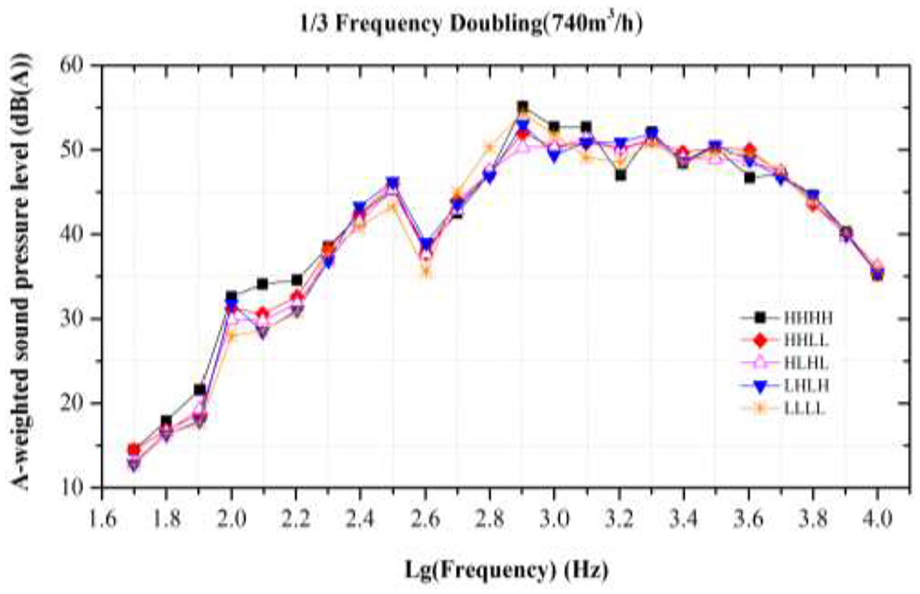
Influence of the different stepped tongues on the A-weighted sound pressure level at Q = 740 m3/h.
Figure 14 presents the influence of the different stepped tongues on linear sound pressure level at Q = 740 m3/h. According to Figure 14, it is observed that as the frequency increases within the range from 50 to 315 Hz, linear sound pressure level increases within the range from 43.5 to 51.9 dB. A valley of linear sound pressure level at 400 Hz appears and the value of linear sound pressure level is about 42.5 dB for all models. As the frequency increases within the range from 500 to 800 Hz, the linear sound pressure level increases within the range from 46.1 to 55.3 dB. Nevertheless, a peak of linear sound pressure level at 800 Hz appears, and the value of linear sound pressure level is 51.1, 52.8, 53.8, 55.2 and 55.3 dB for the HLHL, HHLL, LHLH, LLLL and HHHH models, respectively. It is also seen that as the frequency increases within the range from 1000 to 10,000 Hz, linear sound pressure level decreases within the range from 50.3 to 37.8 dB. It is also obtained that linear sound pressure level of the HLHL model is mostly lower than that of other models within the range from 500 to 10,000 Hz in Figure 14.
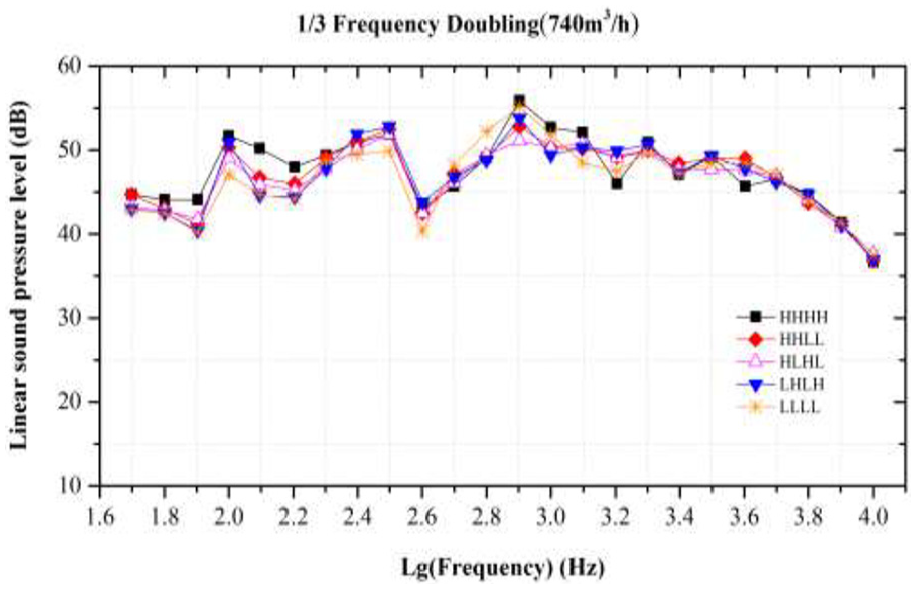
Influence of the different stepped tongues on linear sound pressure level at Q = 740 m3/h.
The influence of the different stepped tongues on the A-weighted sound pressure level at Q = 405 m3/h is given in Figure 15. It is observed that as the frequency increases within the range from 50 to 3150 Hz, five valleys of the LA value successively appear and five peaks of the LA value also alternately appear. Nevertheless, as the frequency increases within the range from 4000 to 10,000 Hz, the LA value gradually decreases. It is also obtained that the LA value of the HLHL model within the range from 500 to 10,000 Hz is mostly lower than that of other models in Figure 15.
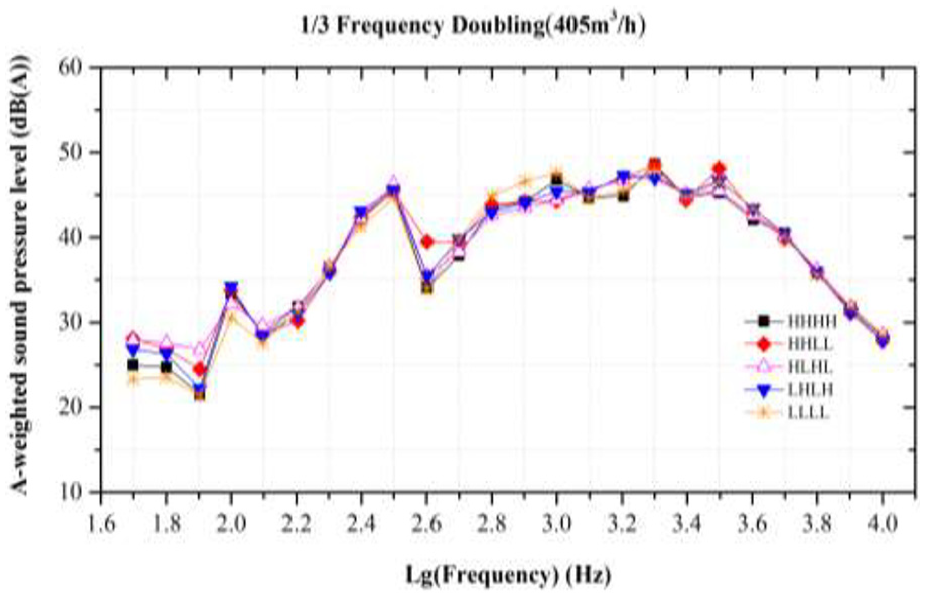
Influence of the different stepped tongues on the A-weighted sound pressure level at Q = 405 m3/h.
Figure 16 illustrates the influence of the different stepped tongues on linear sound pressure level at Q = 405 m3/h. It is obvious that as the frequency increases whole within the range from 50 to 10,000 Hz, linear sound pressure level decreases. The maximum value of linear sound pressure level at 50 Hz appears for all models. Within the range from 50 to 3150 Hz, five valleys of linear sound pressure level successively appear and also five peaks of linear sound pressure level alternately appear. Nevertheless, as the frequency increases within the range from 4000 to 10,000 Hz, linear sound pressure level gradually decreases. In the meantime, it is obtained that linear sound pressure level of the HLHL model within the range from 500 to 10,000 Hz is mostly lower than that of other models. It is also shown in Figure 16 that the noise of the motor dominates and the noise of the motor is usually reflected in the middle and low frequency at Q = 405 m3/h.
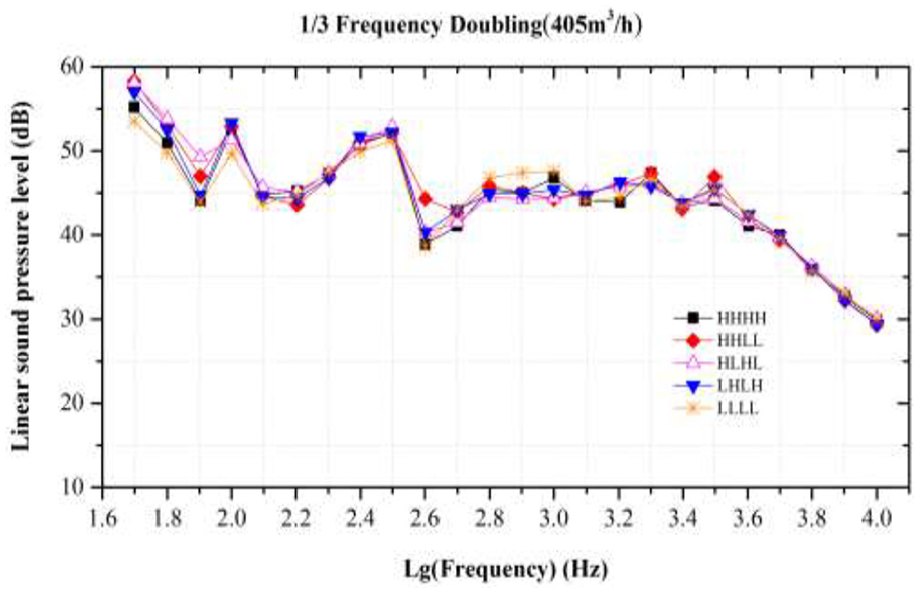
Influence of the different stepped tongues on linear sound pressure level at Q = 405 m3/h.
From Figures 11–16, it is concluded that as the flow rate increases, the aerodynamic noise dominates, covering the noise of the motor. However, the noise of the motor intensifies and dominates at low flow rate. From the curves plotted in Figures 11–16, the noise of the motor is usually reflected in the middle and low frequency. Nevertheless, the aerodynamic noise is reflected at high frequency.
Conclusion
The influence of step tongue volutes on the aeroacoustic behaviors of a forward-curved fan was investigated by performance testing and inlet sound testing. The HHHH (baseline model), HHLL, HLHL, LHLH and LLLL models are performed to obtain its performance and acoustic pressure measurements. It is found that some stepped tongues of the volute tongue achieved the goal of reducing noise generation and improving the performance of fan at the same time.
The LLLL, LHLH and HLHL models produce an increase of the static pressure for both medium and high flow rates, whereas the values are consistent for low flow rates with the baseline model. Especially, at high flow rates, the static pressure and the flow rate for the LLLL, HLHL and LHLH models are increased considerably.
The Ps and ηs values of the HLHL model rise as much as 15.67 Pa and 3.57% by comparing with that of the baseline model at 740 m3/h. The static pressure and its efficiency of the LLLL and LHLH models are almost consistent with that of the HLHL model efficiency at 740 m3/h.
It can be further stated that at 740 m3/h, the tonal noise level of the HLHL model is the better option which can reduce as much as 1.2 dB for the noise generation in the case of the forward-curved fan. Experimental results demonstrated that a good noise reduction effect is achieved of the HLHL model in most operating conditions.
As a conclusion, as the flow rate increases, the aerodynamic noise dominates, covering the noise of the motor. However, the noise of the motor intensifies and dominates at low flow rate. The noise of the motor is usually reflected in the middle and low frequency. Nevertheless, the aerodynamic noise is reflected in high frequency.
Footnotes
Appendix 1
Declaration of conflicting interests
The author(s) declared no potential conflicts of interest with respect to the research, authorship and/or publication of this article.
Funding
The author(s) disclosed receipt of the following financial support for the research, authorship and/or publication of this article: This work was supported by the National Natural Science Foundation of China (11872337, 51906223 and U1709209), the Natural Science Foundation of Zhejiang Province (LY18A020010) and the Fundamental Research Funds of Zhejiang Sci-Tech University (2019Y004). The referees’ valuable comments and suggestions on our work are sincerely appreciated by the authors.