
Abstract
As an important means of transportation, urban rail transit provides effective mobility, sufficient punctuality, strong security, and environment-friendliness in large cities. However, this transportation mode cannot offer a 24-h service to passengers with the consideration of operation cost and the necessity of maintenance, that is, a final time should be set. Therefore, operators need to design a last train timetable in consideration of the number of successful travel passengers and the total passenger transfer waiting time. This paper proposes a bi-level last train timetable optimization model. Its upper level model aims to maximize the number of passengers who travel by the last train service successful and minimize their transfer waiting time, and its lower level model aims to determine passenger route choice considering the detour routing strategy based on the last train timetable. A genetic algorithm is proposed to solve the upper level model, and the lower level model is solved by a semi-assignment algorithm. The implementation of the proposed model in the Beijing urban rail transit network proves that the model can optimize not only the number of successful transfer directions and successful travel passengers but also the passenger transfer waiting time of successful transfer directions. The optimization results can provide operators detailed information about the stations inaccessible to passengers from all origin stations and uncommon path guides for passengers of all origin–destination pairs. These types of information facilitate the operation of real-world urban rail transit systems.
Introduction
Motivation and incitement
With the continuous expansion of urban traffic demand, the urban rail transit plays an increasingly important role in the urban public transport system because of its effective mobility, sufficient punctuality, strong security, and environment-friendliness.1–3 As one of the most important stages in operation management, the timetable has a significant effect on the quality and efficiency of urban rail transit systems. Therefore, the issue of timetable synchronization and optimization in urban metro networks is attracting considerable interests.4–6
A special case of timetable synchronization and optimization problems is the last train timetable problem. Due to the necessity of maintenance and saving operation cost, urban rail transit usually does not provide services to passengers during mid-night, that is, the final time need to be set for passengers to take the train or transfer.7,8 The last train may be the last chance for passengers to complete their travels in an urban rail transit system. Therefore, the accessibility rather than travel time becomes the first-order consideration for passengers which makes detour routing strategy being available for passengers to complete their travel through the last train service. We use an illustrative example to explain the detour routing strategy in the following. As shown in Figure 1, passengers from the marked origin to the destination can intuitively select Route 1 or Route 2 to minimize their total travel time. However, if the passengers fail in the transfer at S2 in Route 1 and the transfer at S3 in Route 2, they are willing to choose a detour route (Route 3) and successfully transfer to the destination at S4, as it is their last chance to travel via the urban rail transit network at night. If passengers cannot reach their destination by the urban rail transit network, they will spend much more money on the taxi ride or give up their travel because there is no alternative to traveling at night.
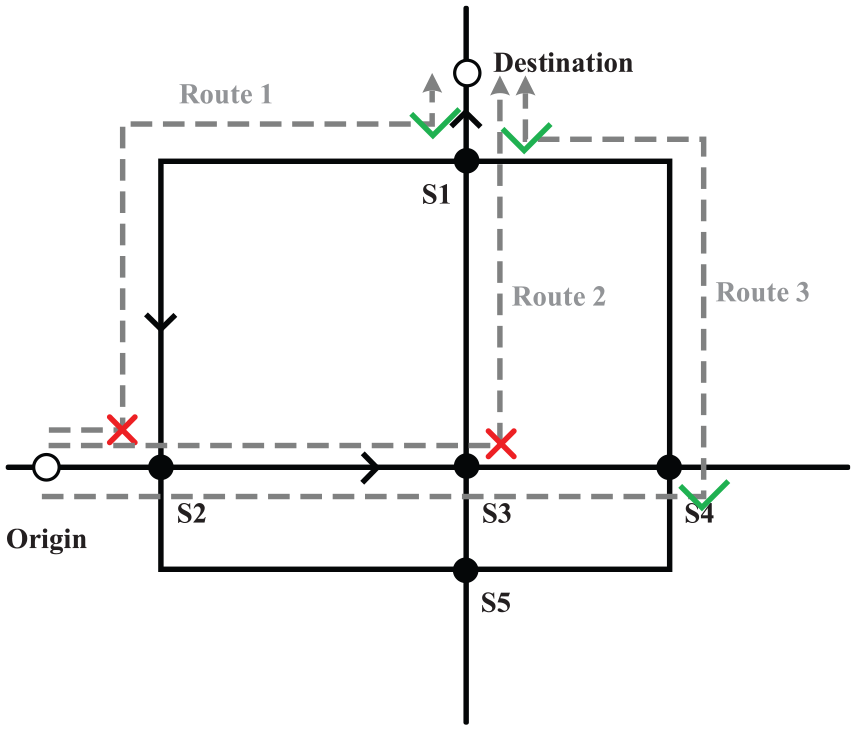
Detour routing strategy choice for passengers by the last train service.
Besides the detour routing strategy, the origin–destination (OD) based passenger demand should also be considered to assess the network accessibility for the last train service.9,10 This is because the independent transfer optimization cannot guarantee that most of the passengers can complete their travel through the last train service under network operation. For example, Figure 2 shows a route from the origin station to the destination station containing two transfer directions. If one or two transfer directions are unsuccessful (Situations (a), (b), and (c) in Figure 2), then the passengers cannot complete their travel by this route. Therefore, this study further considers the OD-based passenger demand, and transfer directions are not optimized independently in this study but integrated into the passenger route choices.
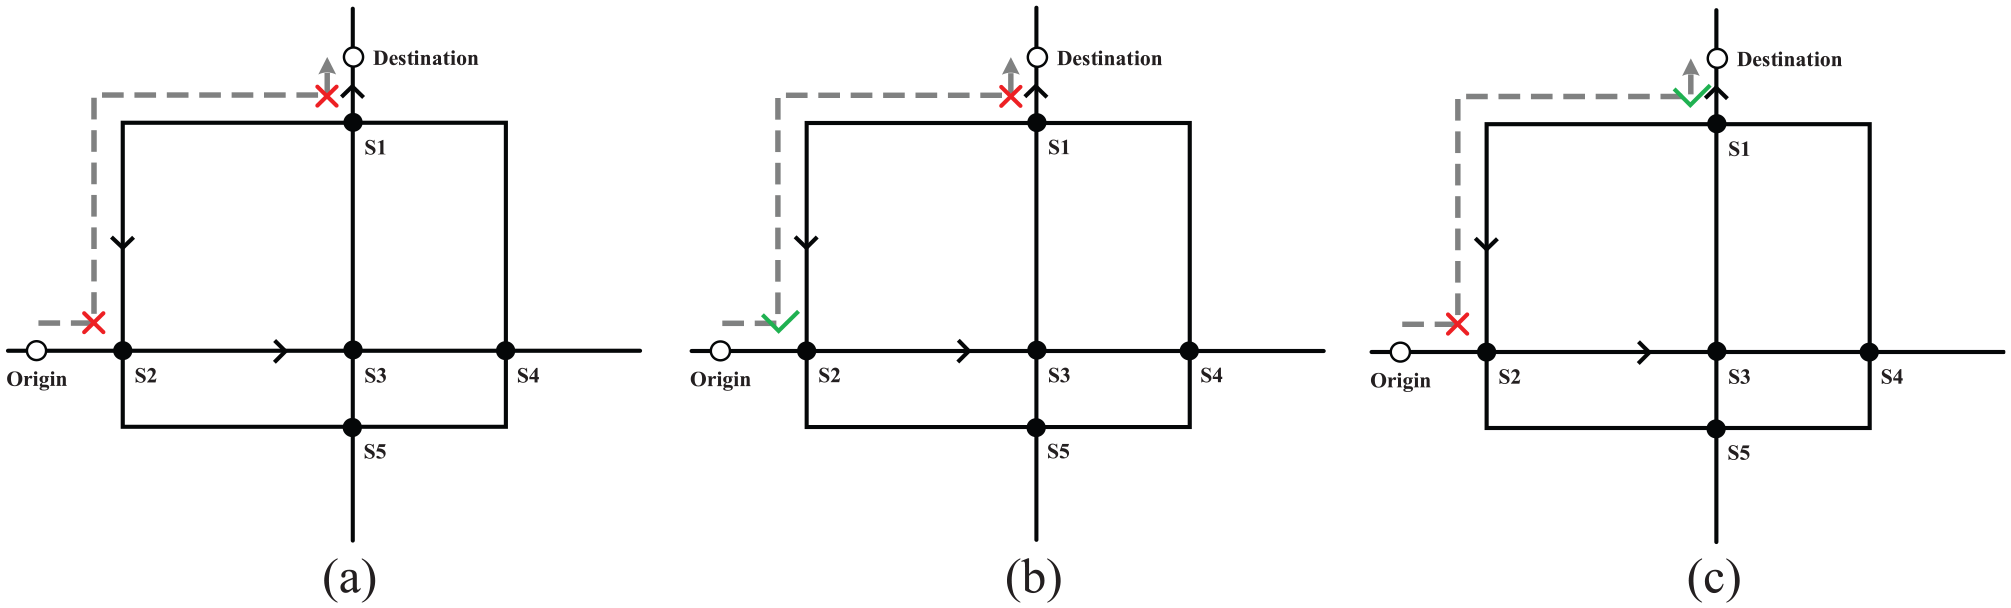
Three situations of unsuccessful travel: (a) Situation 1, (b) Situation 2, and (c) Situation 3.
In conclusion, we aim to propose a last train timetable optimization model in this study to maximize the number of successful travel passengers and minimize their transfer waiting time, while the OD-based passenger demand and the detour routing strategy are mainly considered for the particular last train services in an urban rail transit network.
Literature review
This study belongs to a special class of urban railway train timetable optimization problem (TTP), namely the last train timetable optimization problem (LTTP). One significant difference between the LTTP and general TTP is the objectives. Specifically, the optimization objective of TTP usually is to minimize the total traveling time or total waiting time of the passengers. In contrast, in the LTTP, the main objective is to ensure that maximum number of passengers can finish their trip successfully, while the traveling time and waiting time can just be viewed as a secondary objective. As LTTP is a special case of TTP, we discuss these two closely related streams of literature as follows.
Literature review on train TTP
TTP has received significant attention from the urban rail transit field.4,5,11 Specifically, many researchers focused on timetable optimization problems which aim to minimize the total passenger transfer waiting time at transfer stations. For instance, Domschke 12 proposed an optimization model for minimizing the total passenger transfer waiting time by optimizing train dispatch time, while the passenger demand has not been considered. Wong et al. 13 formulated the timetable synchronization problem as a mixed-integer programming model that minimizes the total transfer waiting time of passengers. Wu et al. 14 considered the waiting time equitably and developed a timetable synchronization optimization model to balance the transfer waiting time in all transfer stations.
Besides the transfer waiting time at transfer stations, studies have also resolved passenger total waiting time or total travel time. Vansteenwegen and Van Oudheusden 15 developed a linear programming model that aims to minimize the total waiting times and the late arrivals, and a real-world case for a small part of the Belgian railway network has been solved. Sun et al. 16 proposed three optimization models for designing demand-sensitive timetables to reduce passenger total waiting time. They also assessed the performance of the three models on a metro line in Singapore. Barrena et al.17,18 and Shang et al. 19 proposed models under dynamic passenger demand and a single railway corridor for minimizing passenger average/total waiting time. Niu et al. 20 and Gao et al. 21 studied the skip-stop pattern in urban rail lines and proposed optimization models applied in normal and disruption situations to minimize total passenger waiting time. Siebert and Goerigk, 22 Schmidt and Schöbel, 23 and Wang et al. 24 took the passenger demand into consideration and focused on the integration of train timetable and passenger routes; optimization models are proposed to minimize passenger total travel time.
Literature review on the first or last train timetable optimization problem
With the development of urban rail transit networks, the first or last train timetable optimization problems are attracting much more attention. Kang et al. 7 studied LTTP and proposed models to maximize passenger transfer connecting headways and transfer redundant time of the key directions in an urban rail transit network. Using the proposed model, they aimed to improve connectivity and reduce passenger transfer waiting time. A rescheduling model for last trains was also proposed by Kang et al., 25 which considered the train delays caused by incidents. Dou et al. 26 studied the bus and last train coordination problem; a mixed integer nonlinear programming model was proposed to reduce transfer failures on the basis of the given last train schedules. Kang et al. 27 studied the first train timetable problem in an urban rail transit network and proposed suggestions to improve the operation and management of the urban rail transit network in Beijing. Yang et al. 28 considered the transfer demand variability within passengers’ decision-process for LTTP and developed a model with consideration of the decision-makers’ risk preferences in subway systems under uncertainty.
However, few studies for optimizing last train timetable have not considered the detour routing strategy, which can considerably improve the possibility of successful travel. One of the main differences between the last train and regular time train is that accessibility instead of travel time becomes the most important factor passengers consider. Therefore, the OD-based passenger demand and detour routing strategy should not be ignored in the LTTPs.
Contributions and paper organization
The contributions of this study are summarized as follows:
We make a comparison in Table 1 to show the differences between previous last train studies and this paper. To further optimize the last train timetable, we take the OD-based passenger demand and possible detour routing strategy into consideration and propose a bi-level last train timetable optimization model.
To solve the proposed model efficiently and make it practical enough to be applied to the large urban rail transit network, a genetic algorithm (GA) is proposed for solving the upper level model. To solve the lower level model, we design a semi-assignment algorithm, which can offer successful travel variables based on a last train timetable generated from the upper model.
The implementation of the proposed bi-level last train timetable optimization model to the Beijing urban rail transit network proves that the model can optimize the number of successful transfer directions, the number of successful travel passengers, and the passenger transfer waiting time of successful transfer directions.
The comparisons of the previous last train studies and this paper.
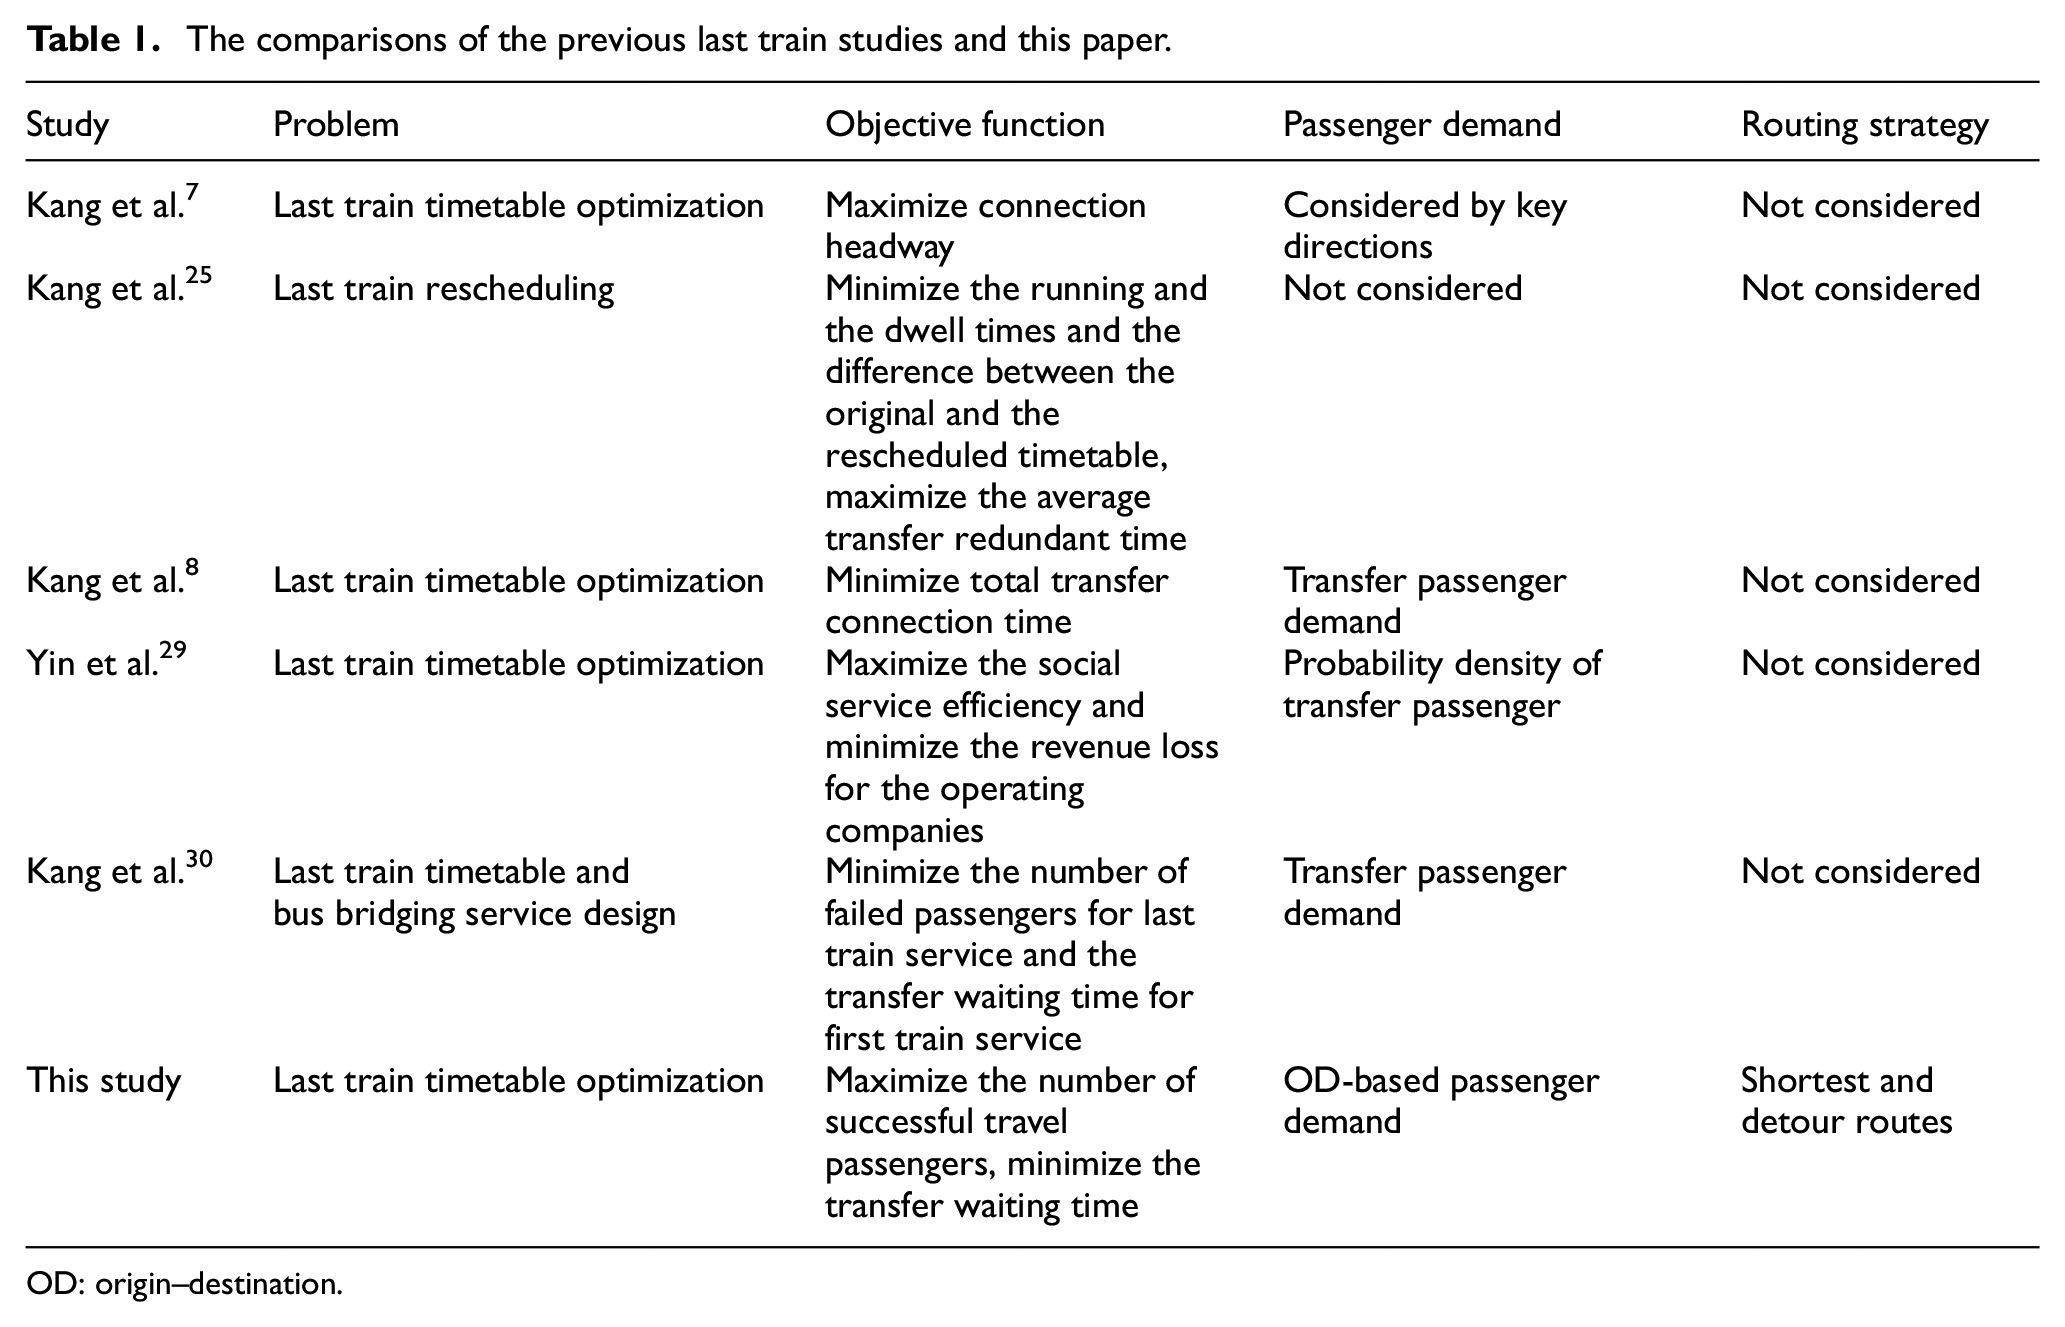
OD: origin–destination.
The remainder of this paper is organized as follows. In section “Bi-level last train timetable optimization model and solution approach,” the LTTP is stated. In section “Solution algorithm,” we proposed the bi-level model and the solution approach. In section “Simple network test,” the proposed model and algorithm test on a simple network. Further implementation of the proposed model into a case study based on the Beijing Subway Network is conducted in section “Case study.” Finally, we give our conclusion in section “Conclusion.”
Bi-level last train timetable optimization model and solution approach
Assumptions
The model is constructed based on the following assumptions.
Assumption 1
Only passengers who arrive at system right before the last trains arriving are considered. These passengers are selected because they are at the highest risk of not completing their travel. In other words, if this group of passengers can complete their travel by the last train service, then the other passengers arriving earlier can complete their travel as well.
Assumption 2
The passengers originating from stations between a terminal station and a transfer station or between two transfer stations on the same line are regarded to be in the same origin station group. The reason is that passengers who arrive at the urban rail transit network right before the last trains arrive make choices only at transfer stations and are insensitive to the travel time. The same assumption applies to the destination station group.
Assumption 3
The passengers who arrive at the urban rail transit network right before the last trains will select the route in which all the transfer directions are successful on the basis of the published last train timetable. They will select this route even if it is circuitous because it is their last chance to complete their travel.
Notations
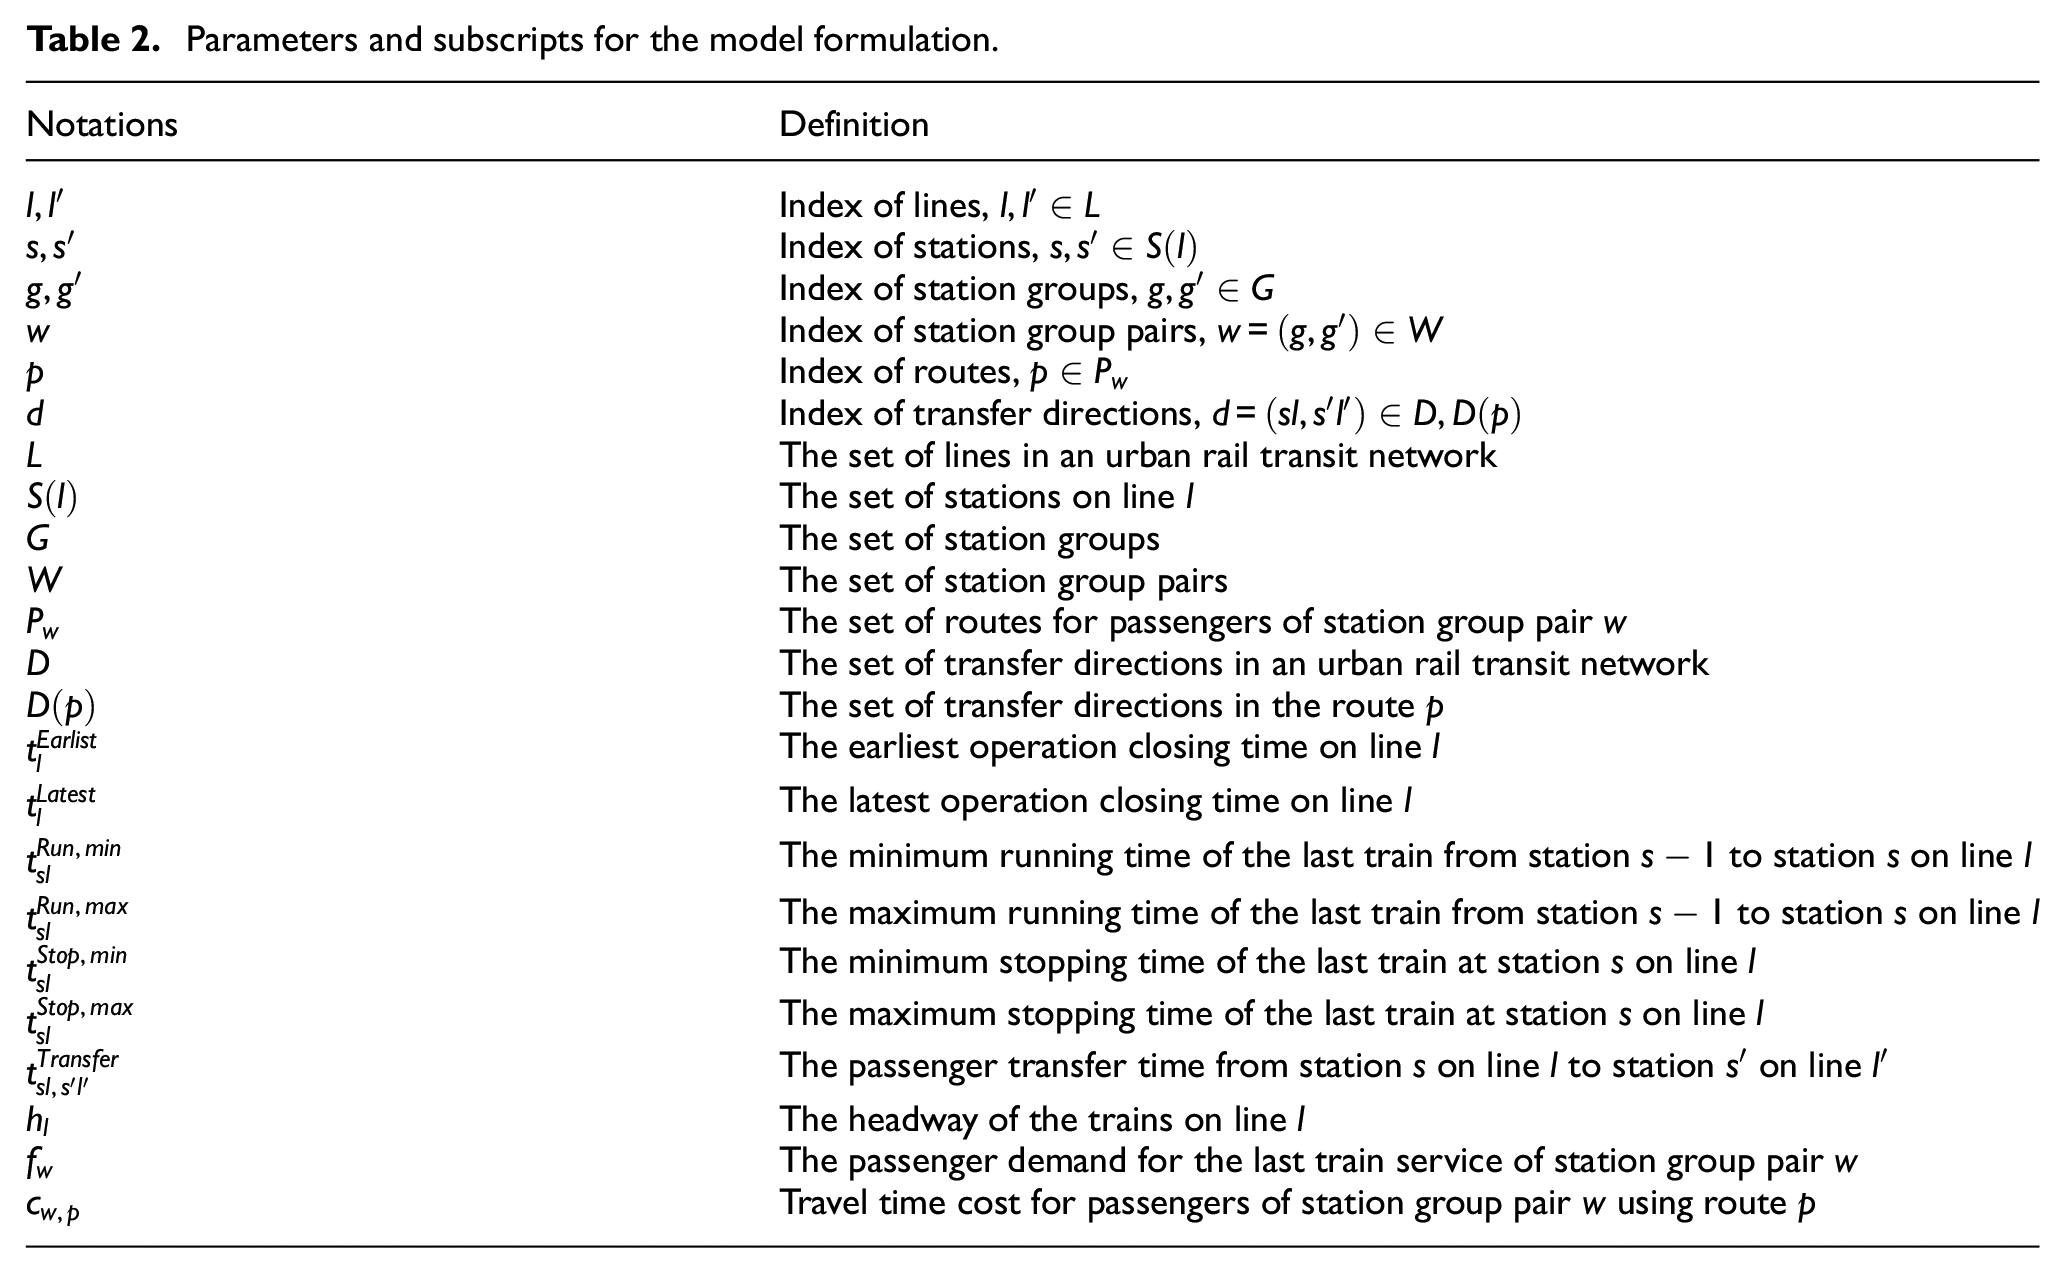
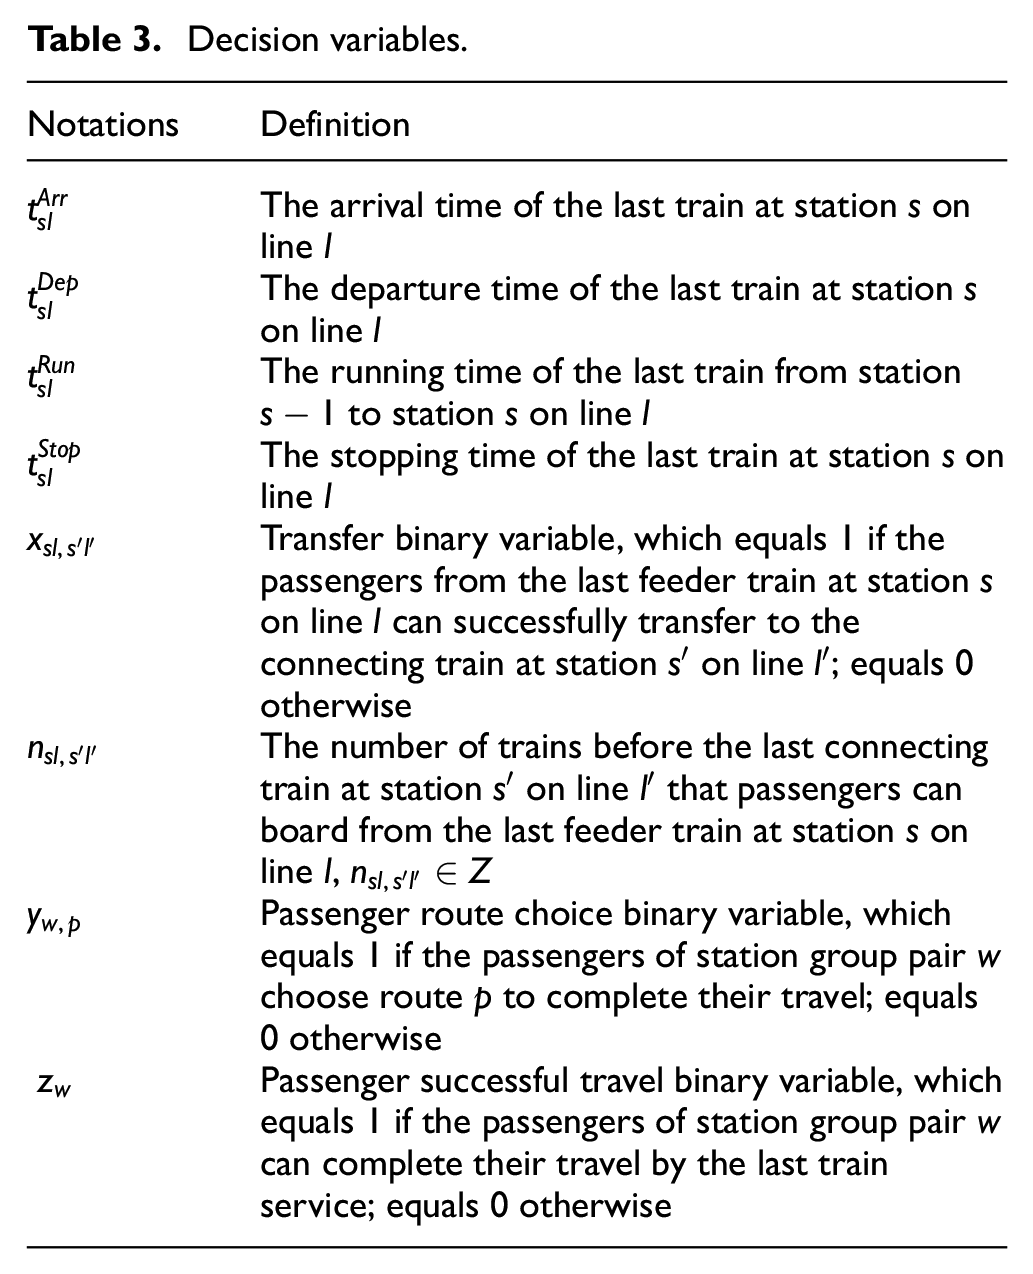
The parameters, subscripts, and decision variables are stated in Tables 2 and 3.
Parameters and subscripts for the model formulation.
Decision variables.
Upper level model formulation
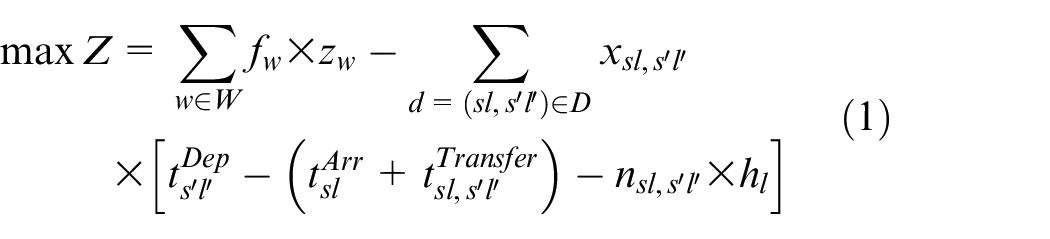
To improve the level of passenger satisfaction, an optimized last train timetable must be operationally feasible and must maximize the number of successful travel passengers and minimize passenger transfer waiting time of successful transfer directions. Along this line, the first objective function of the upper level model is to maximize the number of successful travel passengers given as the first term in equation (1). The second objective function of the upper model is to minimize passenger transfer waiting time of successful transfer directions given as the second term in equation (1). In particular, we need to minimize the passenger transfer waiting time presented by
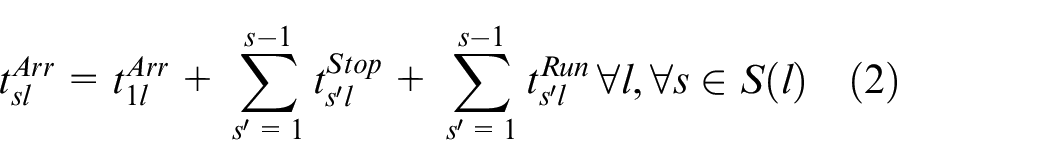
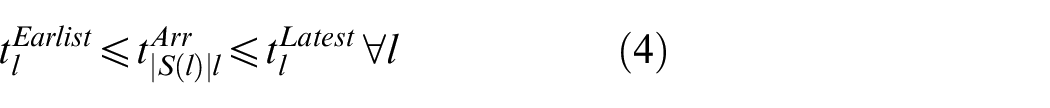
The arrival time
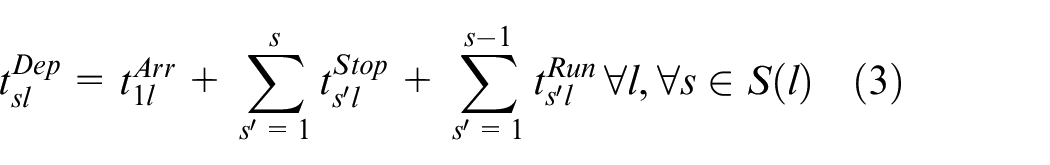
Several operational requirements must be satisfied, that is, the last train operation closing time


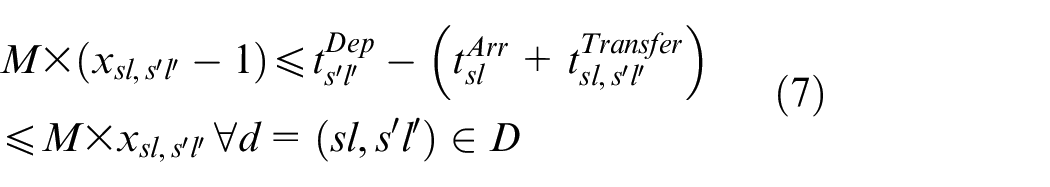
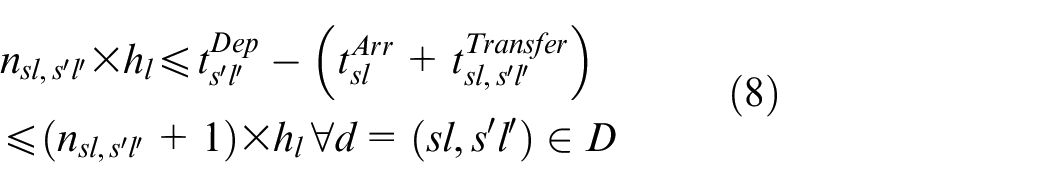
At transfer stations,
Lower level model formulation
The lower level model aims to determine whether the passengers of station group pair

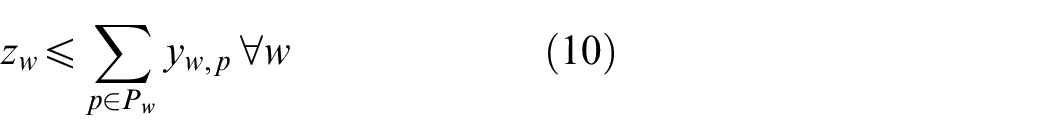
Equation (10) establishes the relation between the route choice binary variable and the corresponding successful travel binary variables for the passengers of station group pair
Equation (11) is formulated to determine whether the passengers of station group pair

Passengers of station group pair
Bi-level optimization model
In general, the proposed bi-level last train timetable optimization model can be stated as follows. The upper level model aims to maximize the number of successful travel passengers and minimize transfer waiting time of successful transfer directions under the operation constraints. The lower level model finds the corresponding best route for passengers based on the last train timetable obtained from the upper model.
Upper level model:
Objective function: equation (1).
Subject to: equations (2)–(8).
Lower level model:
Objective function: equation (9).
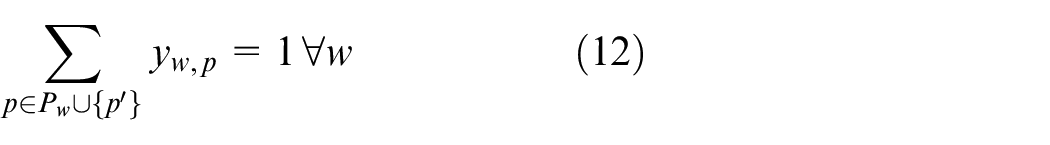
Subject to: equations (10)–(12).
Solution algorithm
Genetic algorithm for the upper level model
Ibarra-Rojas and Rios-Solis 31 have proved that the timetable synchronization problem in the network is a NP-hard problem, where the solution time will increase exponentially with the size of problems when using traditional exact optimization method. Meta-heuristic algorithms, including GA, simulated annealing (SA) algorithm, particle swarm optimization (PSO) algorithm, extremal optimization (EO) algorithm, and adaptive large neighborhood search (ALNS) are commonly used to solve large-scale NP-hard problems.32–39 Specially, GA has been widely applied on numerous transportation researches (e.g. Liu et al., 40 Niu et al., 41 and Kang et al. 7 ) due to its strong robustness, high efficiency, and practical applicability. Therefore, in this study, we intend to use GA to find high-quality feasible solutions for the proposed model.
Note that it is difficult and unnecessary for GA to obtain a global optimal solution. Especially, in the non-convex optimization problem such as this study, the global optimal solutions can be obtained only if all the combinations of specific values for the variables have been tested, which results in the memory and solution time rising exponentially with the size of the problem. Thus, in order to ensure the practical applicability of the proposed model and algorithm, we choose GA to solve the problem even though it can only obtain sub-optimal solutions. To mitigate traps in local optimality, the mutation and crossover operations in the GA are adapted to maintain diversity in a population.
The direct decision variables of the upper level model can be stated as follows: the arrival time
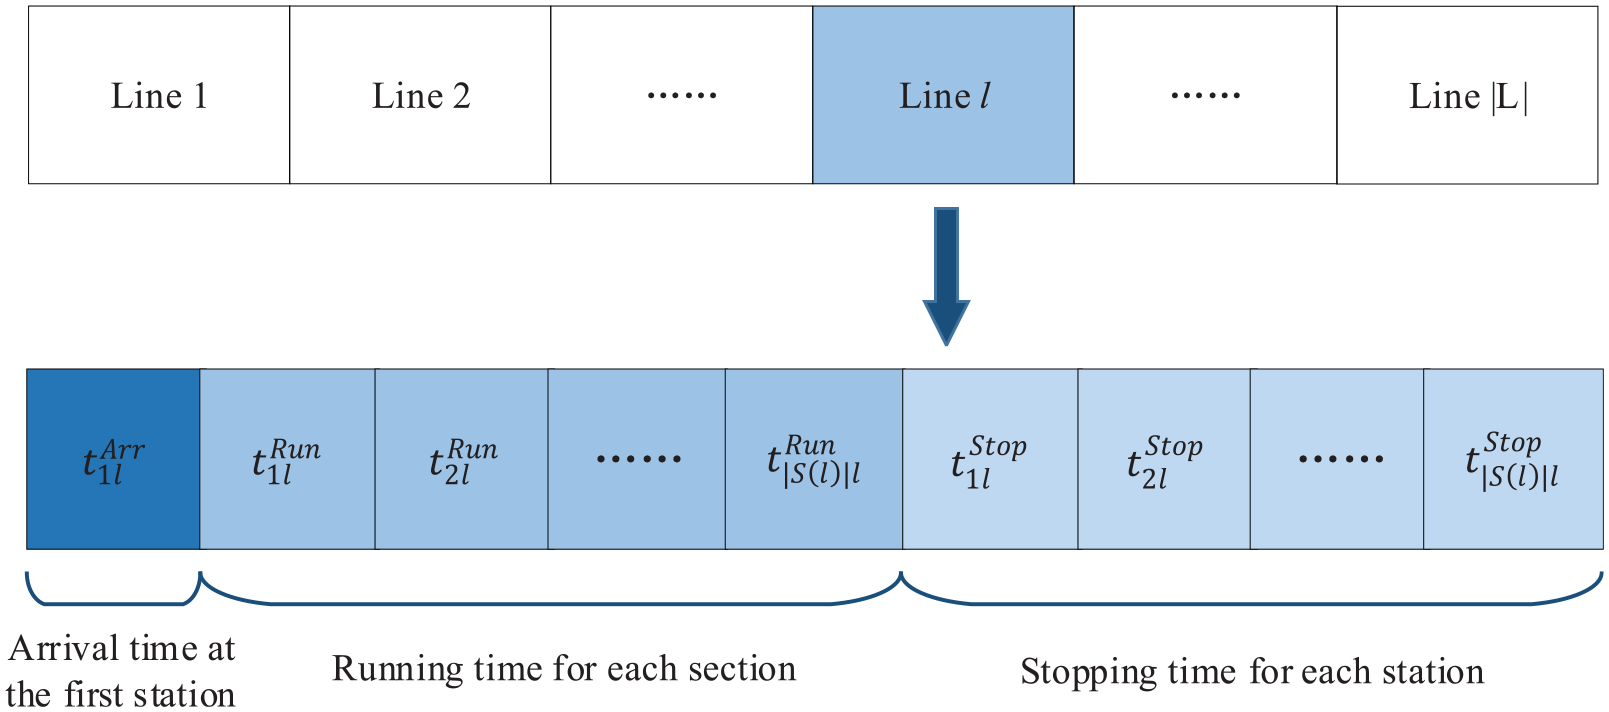
An example of chromosome.
The fitness function is the objective function presented by equation (1), in which the variable
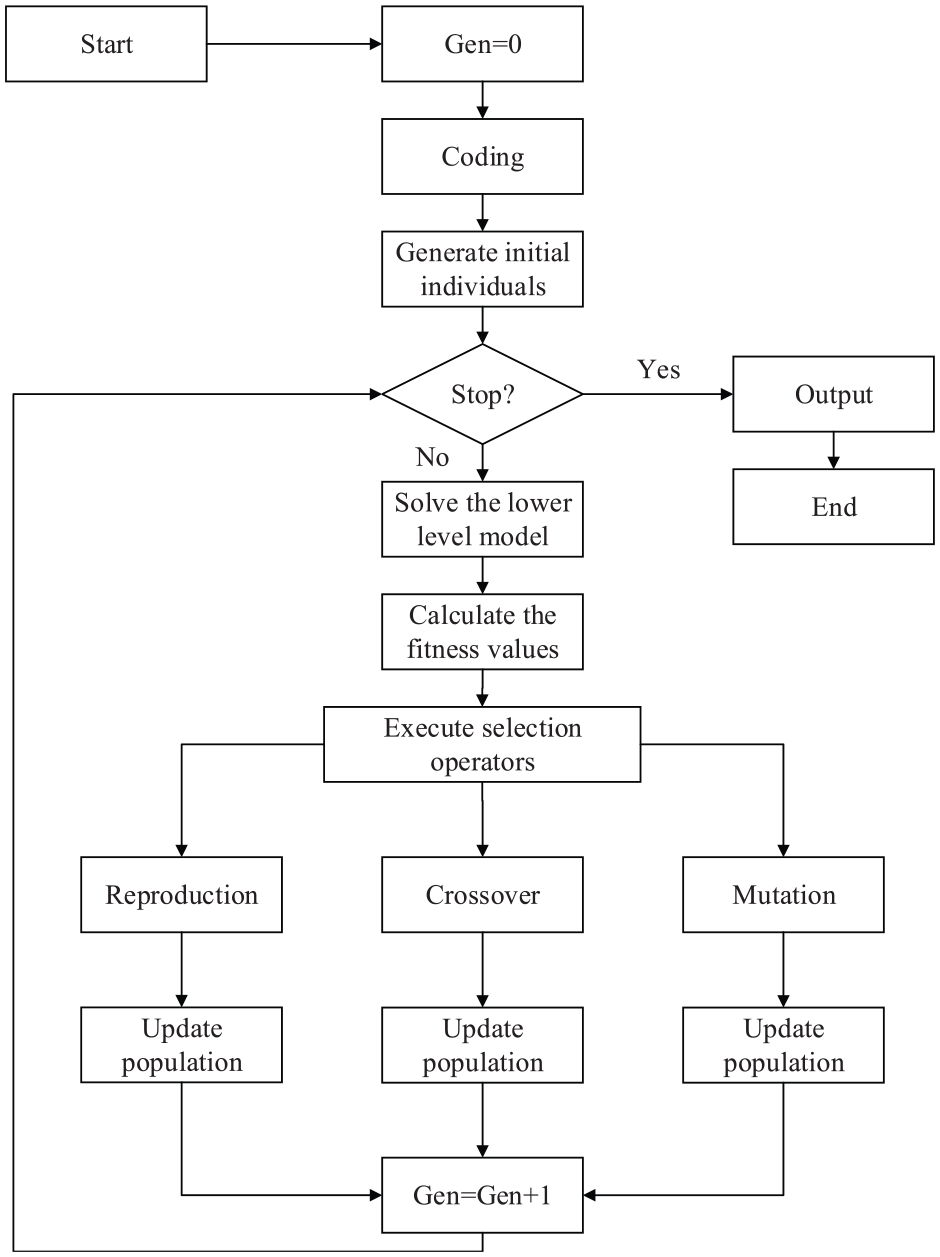
Solution framework of the generic algorithm.
In this study, we use the partially mapping crossover in the crossover operation as Figure 5. We can see that each chromosome is divided into the variables for single transportation lines and crossover positions are generated randomly to choose lines. Then, the partially mapping crossover is conducted to obtain new off-springs.
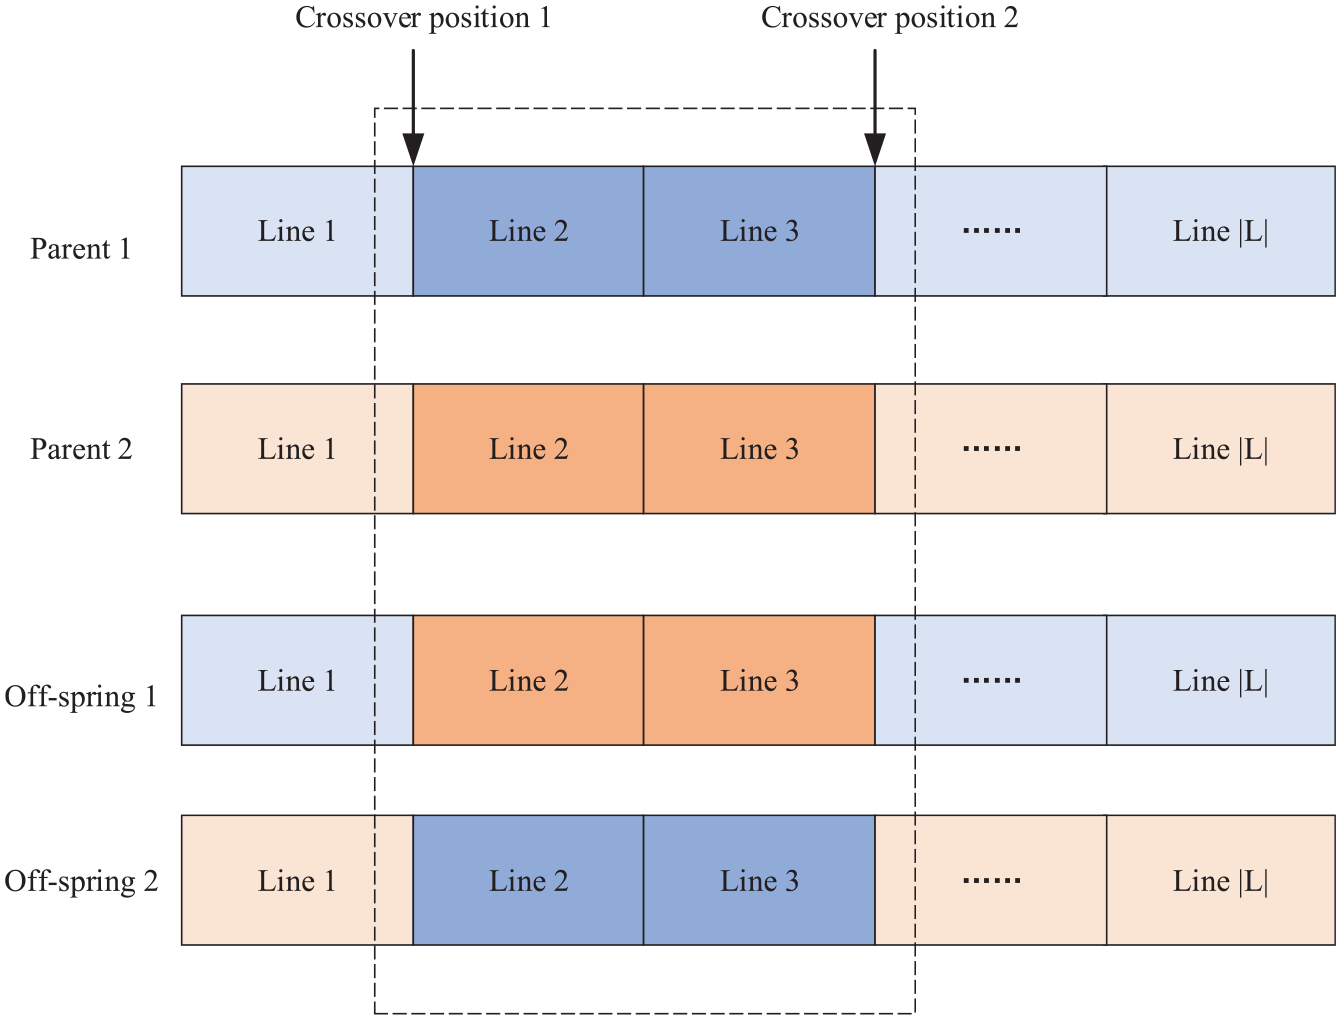
An example of crossover operation.
The mutation operation is conducted inside each line gene. First, the positions of mutation are generated randomly. Then, the gene in the selected position will be changed. Note that the updated value needs to subject to constraints (4), (5), and (6) as well. An example of mutation operation is shown as Figure 6.
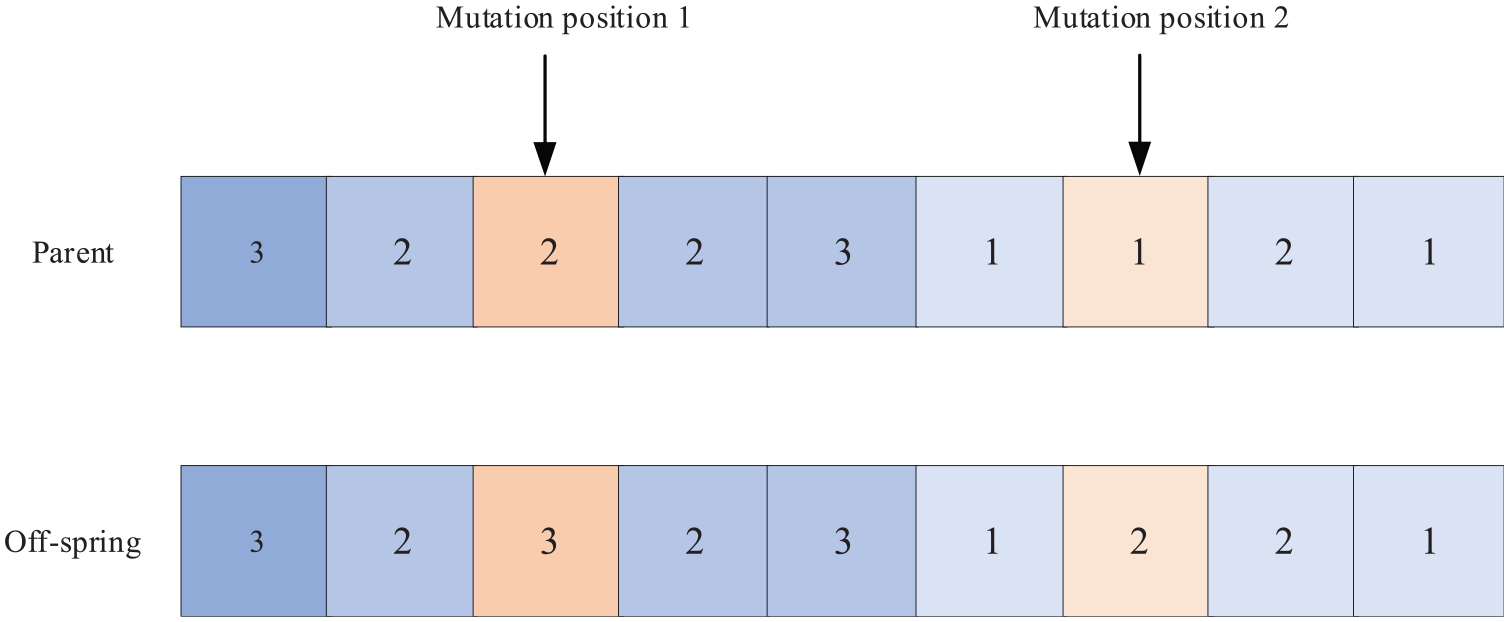
An example of mutation operation.
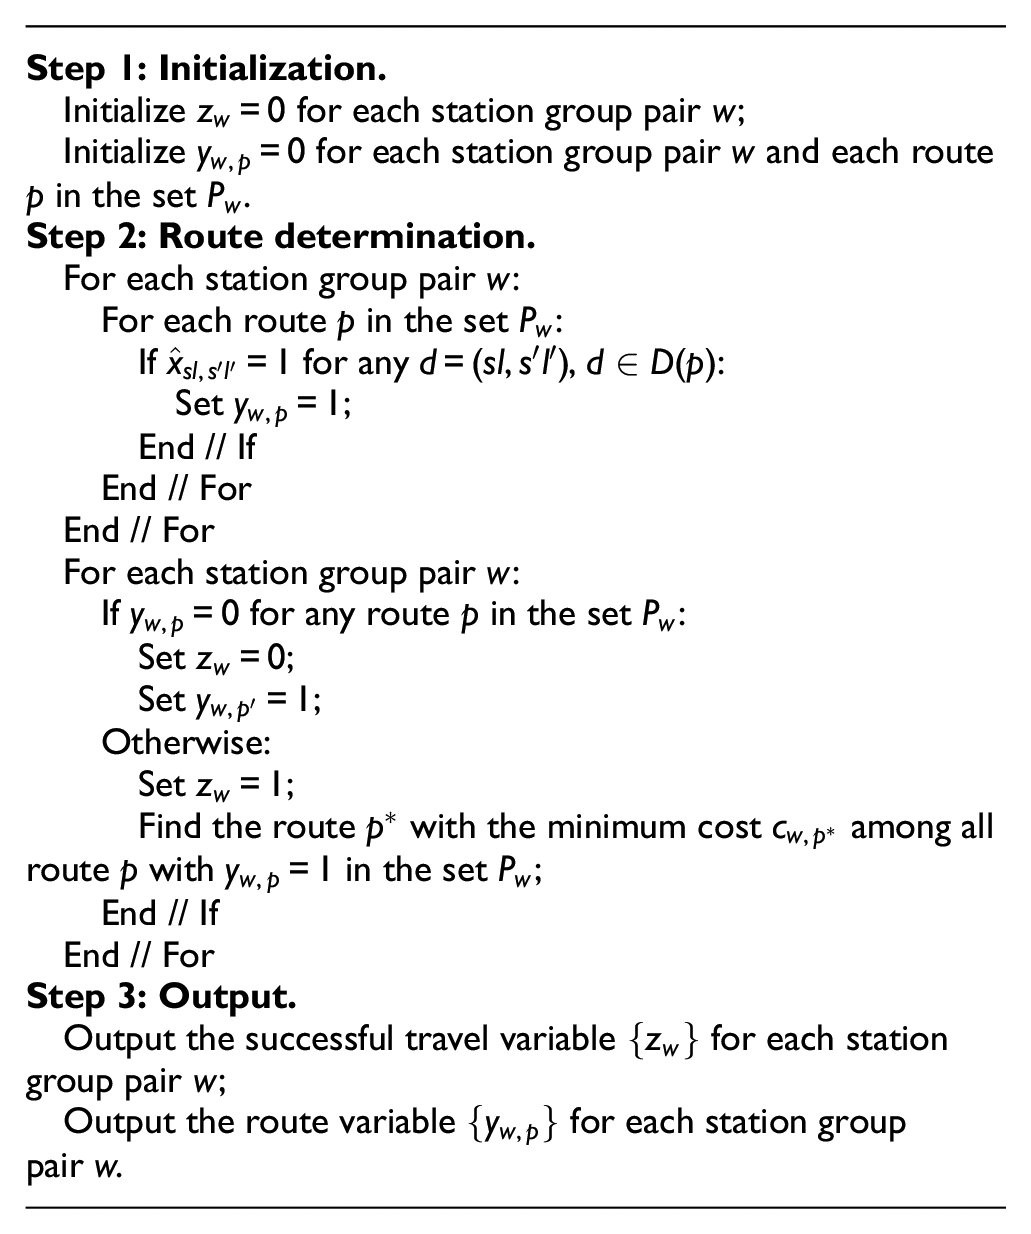
A semi-assignment algorithm for the lower level model
The lower level model aims to find the best route
Simple network test
Simple network description
In this section, the proposed last train timetable optimization model and algorithm is first tested in a simple urban rail transit network illustrated in Figure 7, which is same as the simple network used by Kang et al. 7 This network has three bi-direction lines (Lines 1, 2, and 3) and five transfer stations (S1–S5). The transfer times are all set to be 0.2 min. Lines 1 and 3 are straight lines where two terminal stations exist, and Line 2 is a loop line. Twelve station groups (station group 1 to station group 12) are marked by the red numerals in Figure 7.
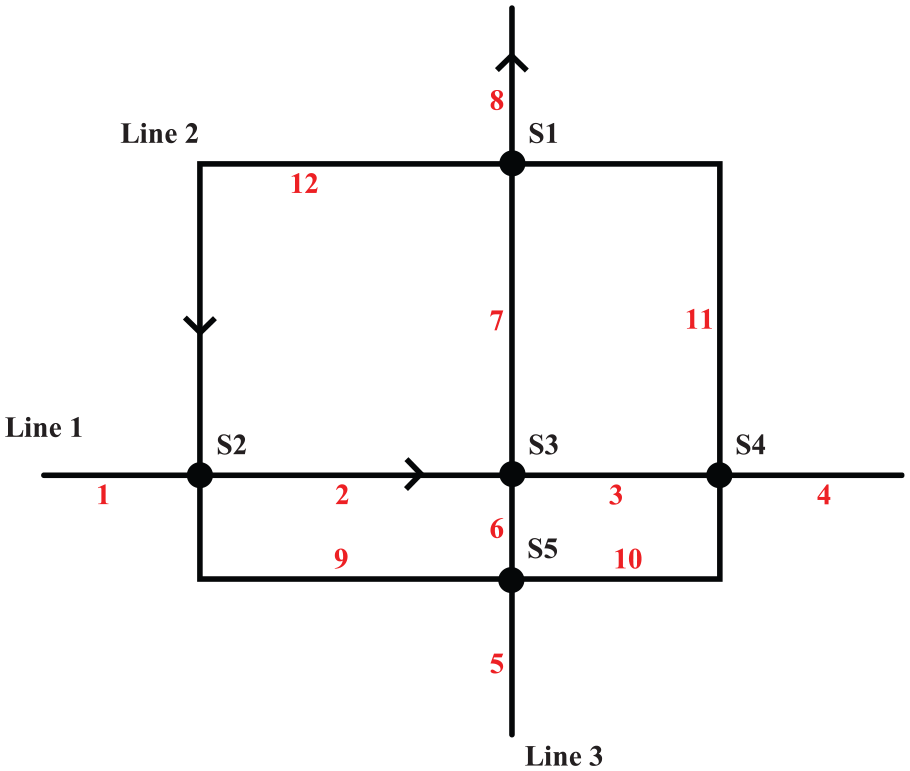
Simple urban rail transit network.
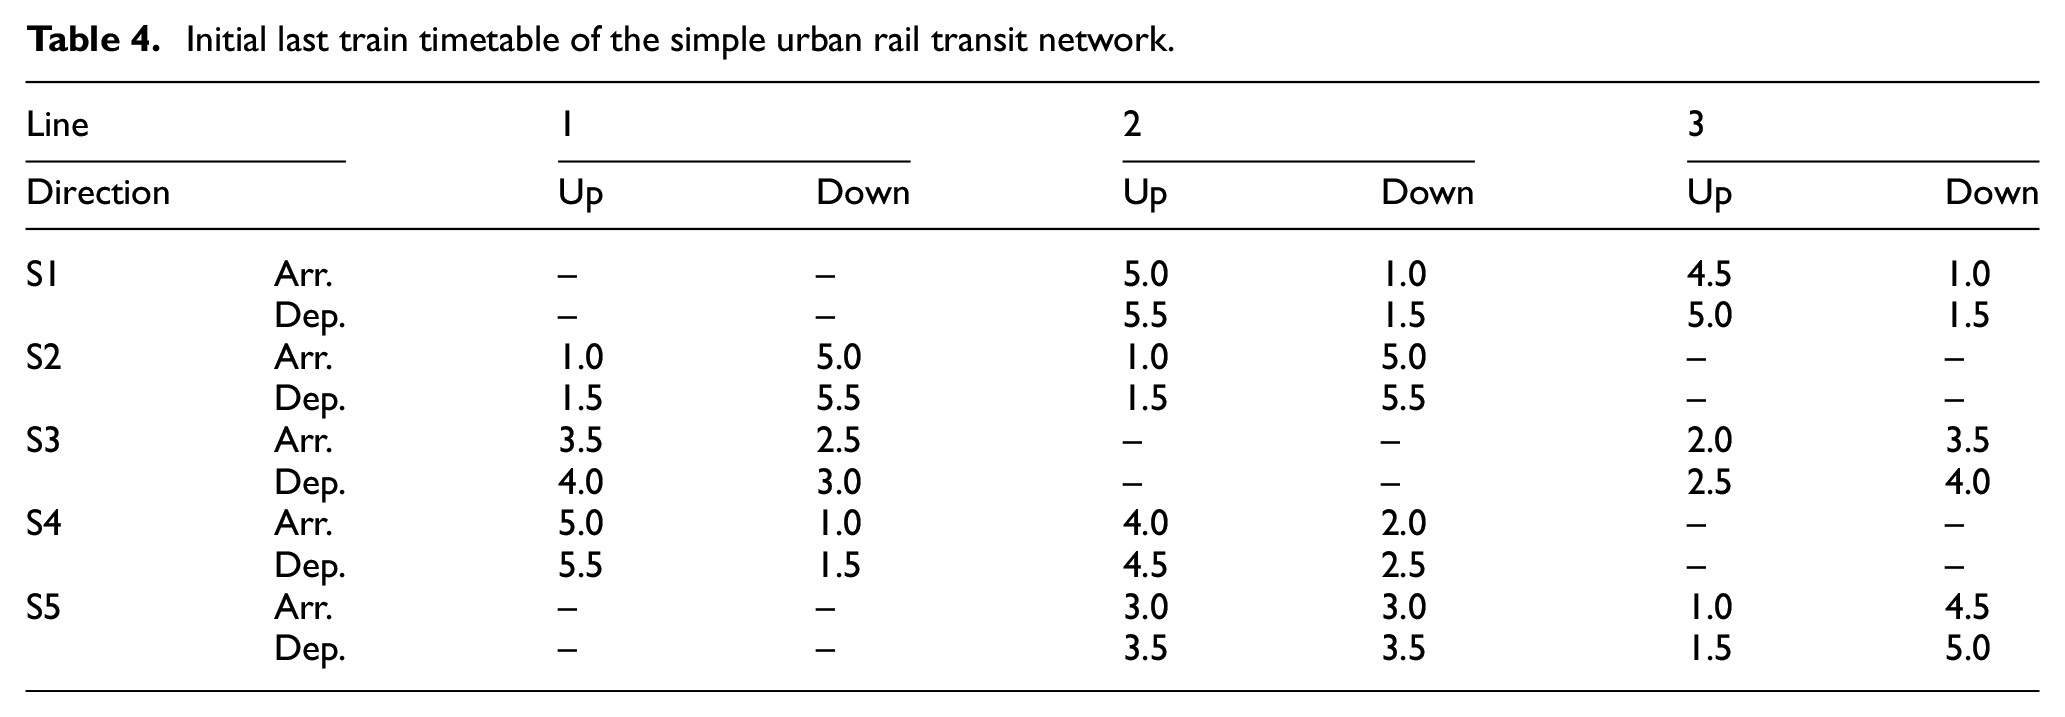
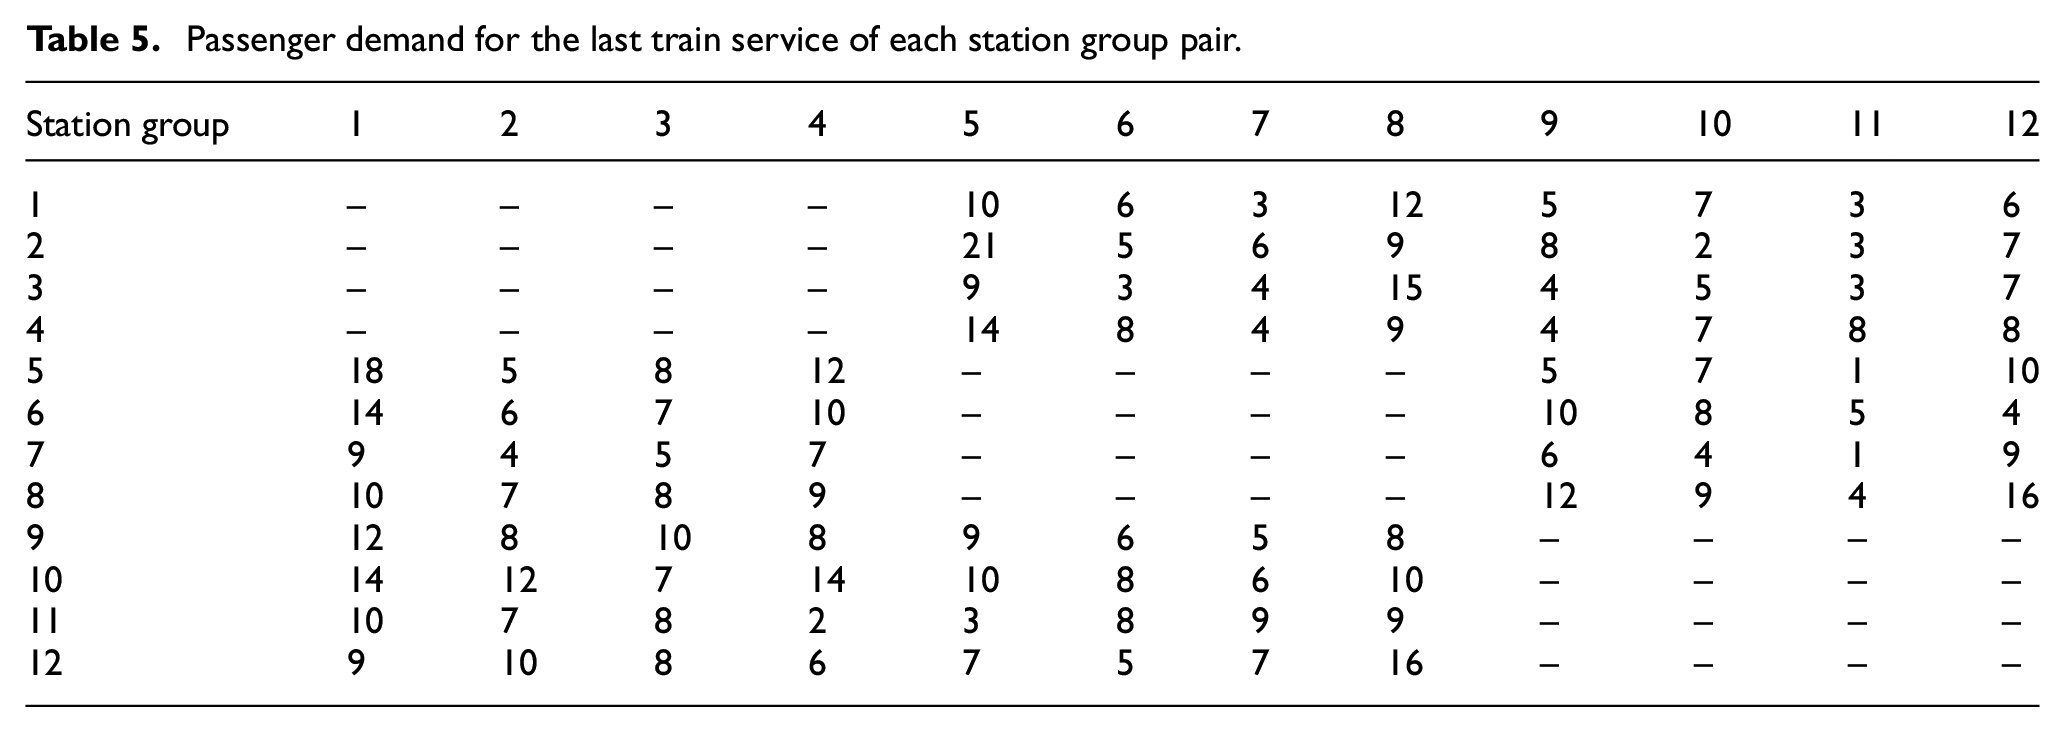
The initial last train timetable of the simple urban rail transit network is shown in Table 4. The passenger demand for the last train service of all station group pairs is shown in Table 5. The headway of the trains on each line is set to 1 min.
Initial last train timetable of the simple urban rail transit network.
Passenger demand for the last train service of each station group pair.
Optimization results
We test this case on a personal computer with Intel Core i5-4210U 2.40 GHz and 8 GB RAM. The population size, crossover probability, mutation probability, and the maximum iteration are set as 100, 0.8, 0.2, and 60, respectively. The optimization process of the genetic algorithm is shown in Figure 8, from which we can see that the best solution is obtained in 44th iteration within 2 min.
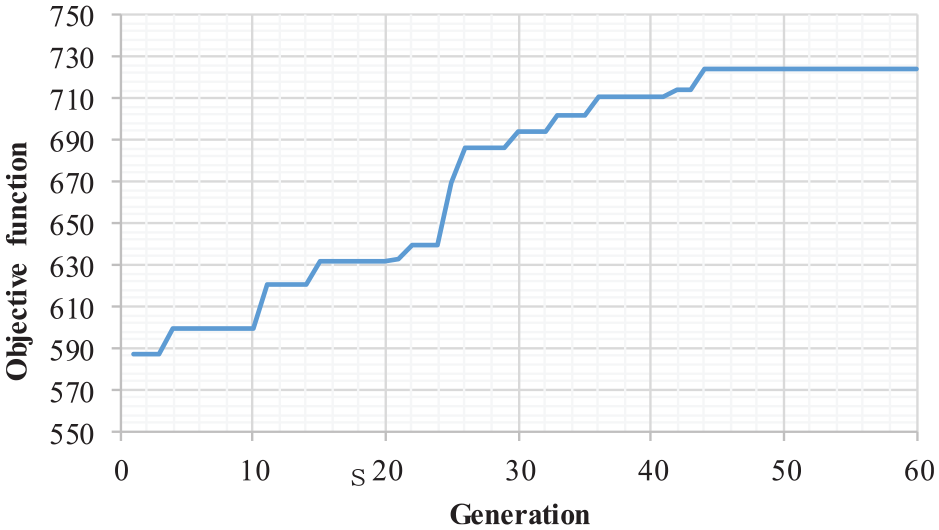
Iteration process of the GA for the simple network case.
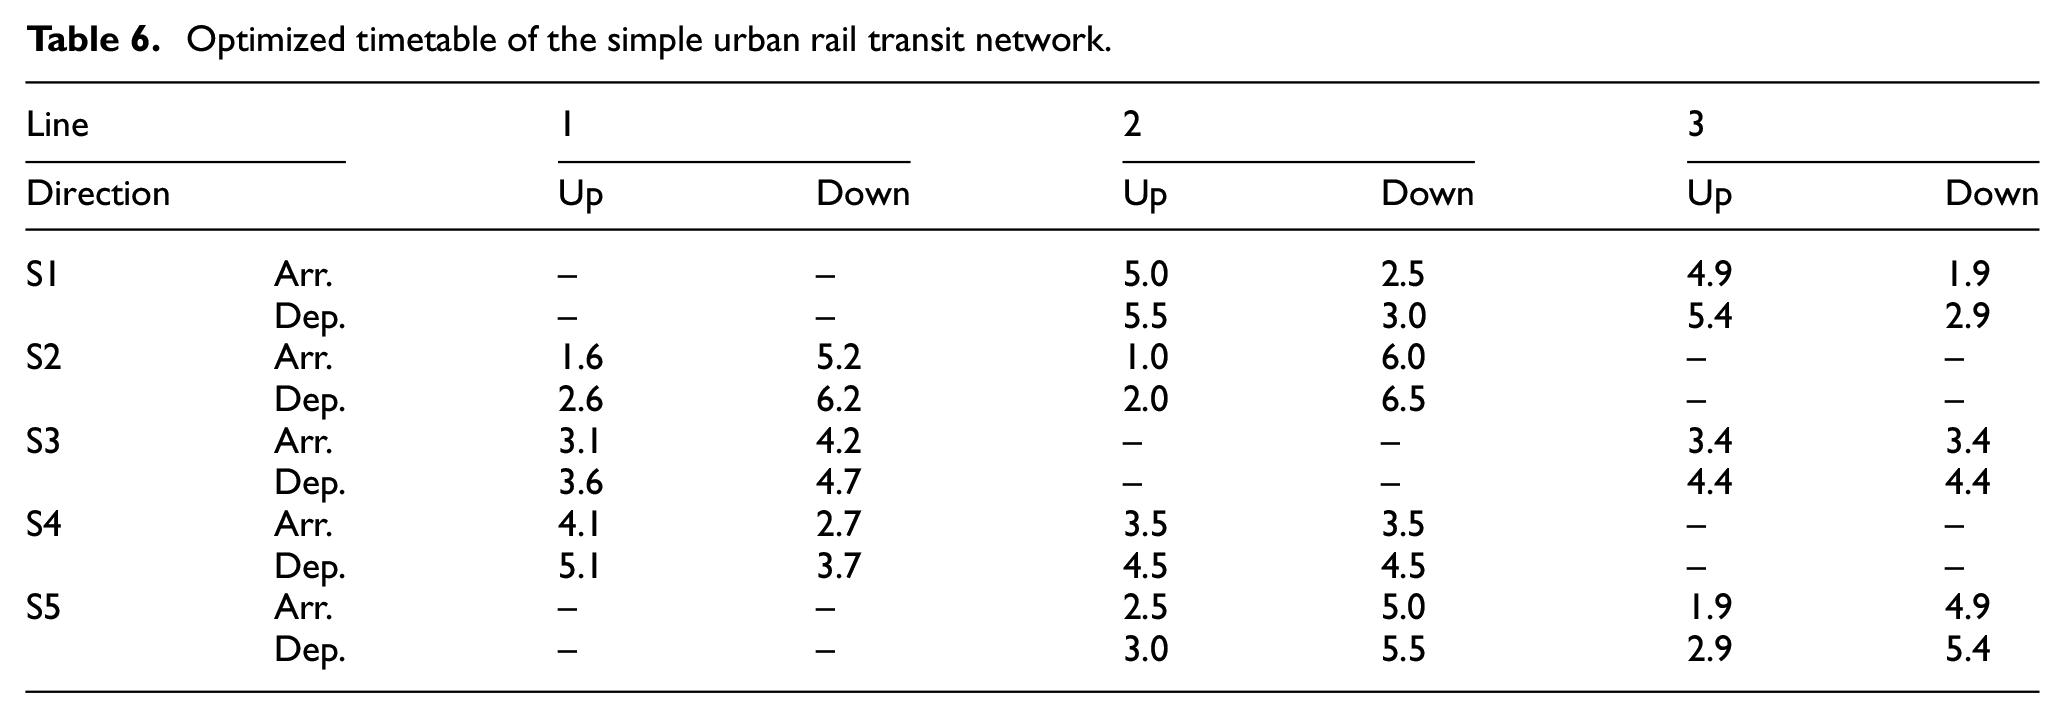
Table 6 shows the optimized last train timetable, and Table 7 lists the corresponding optimized transfer results.
Optimized timetable of the simple urban rail transit network.
Optimized transfer results of the simple urban rail transit network.
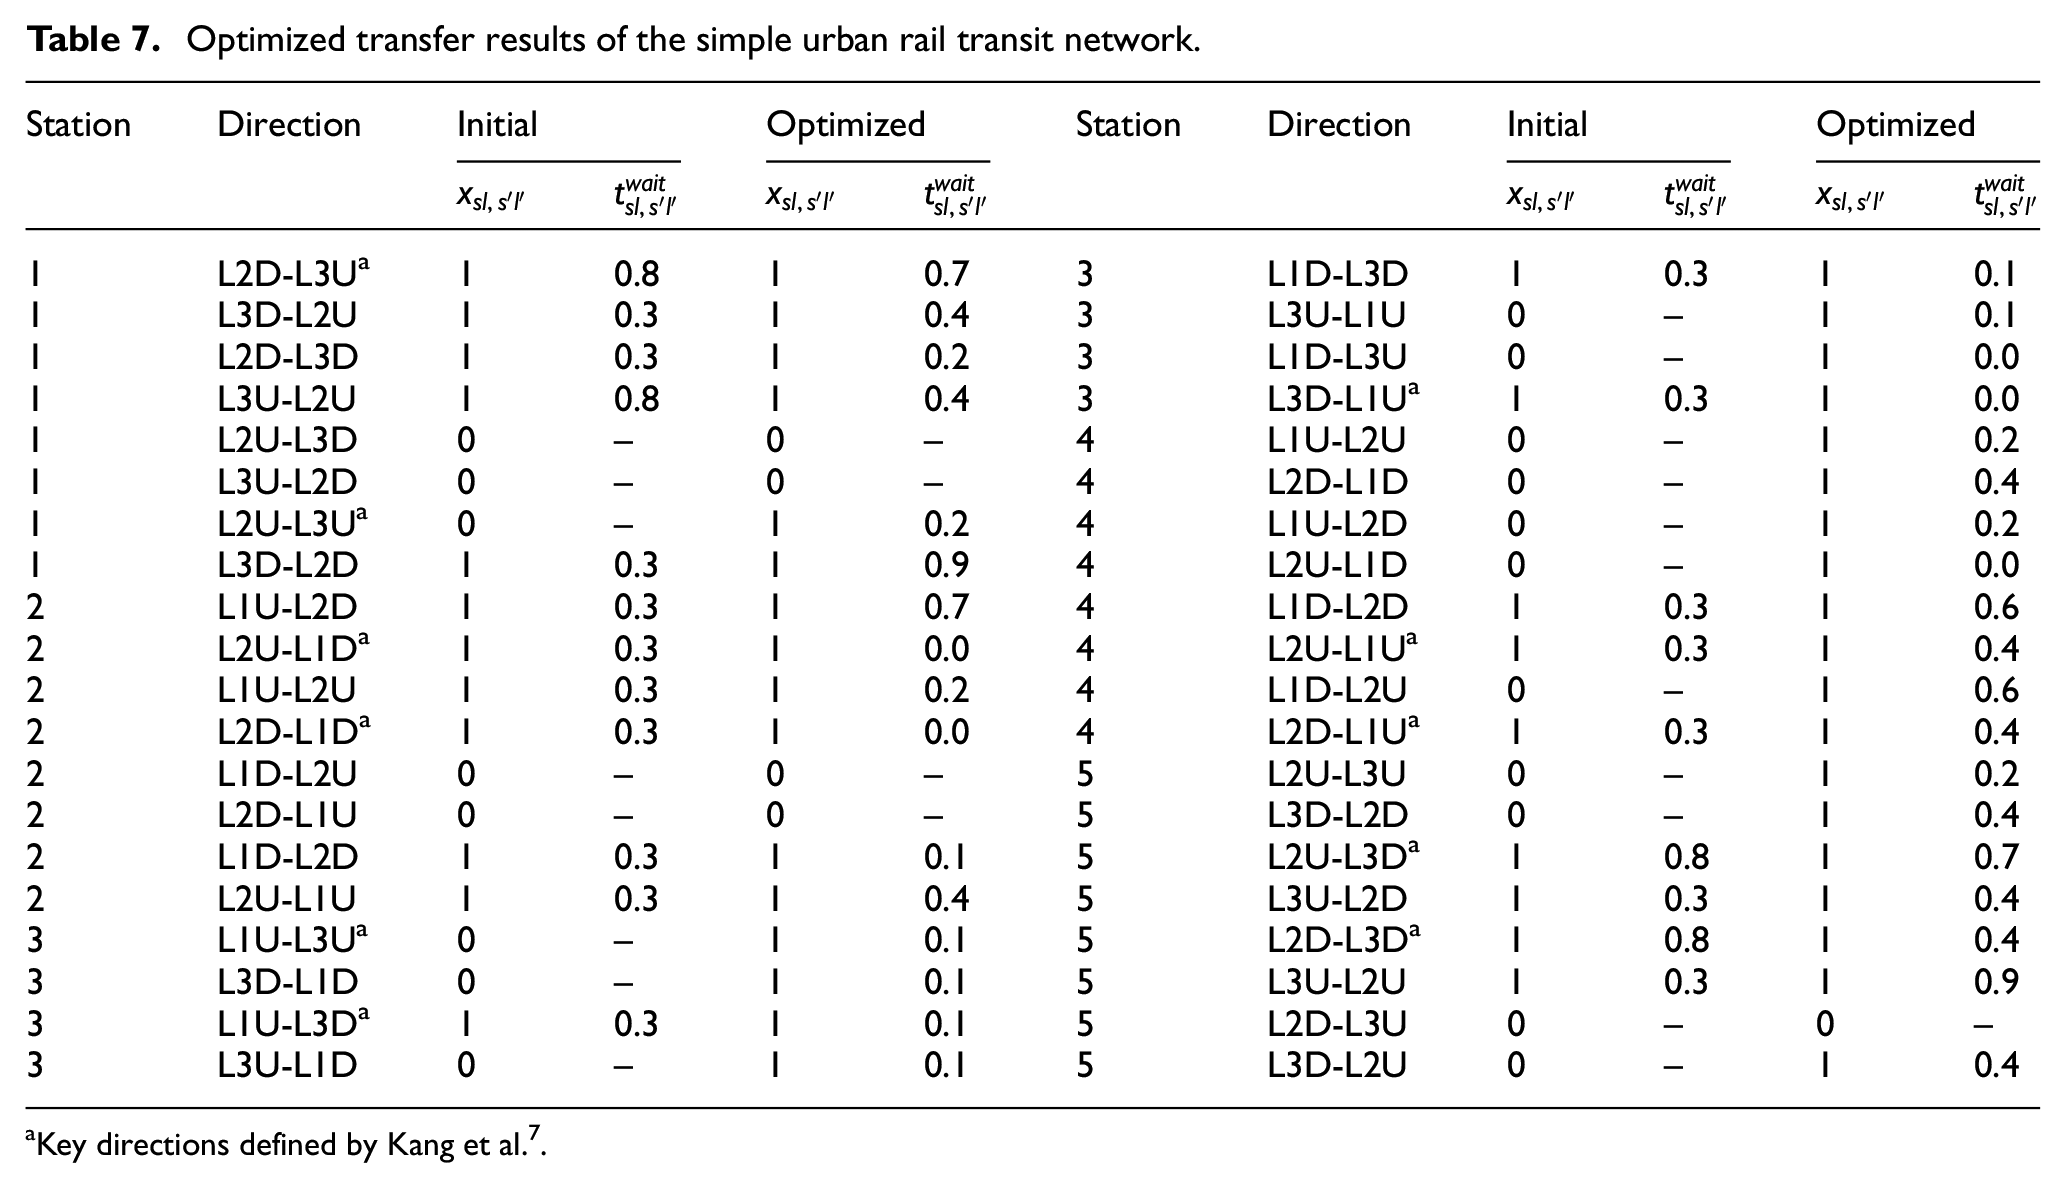
Key directions defined by Kang et al. 7
As shown in Table 7, the number of successful transfer directions in the simple urban rail transit network is increased from 21 to 35 after the last train timetable is optimized by the bi-level last train timetable optimization model. In the proposed model, 87.5% of all the transfer directions are successful, and all the key directions defined by Kang et al. 7 are optimized to successful transfer directions. Furthermore, the number of successful travel passengers between the initial timetable and the optimized timetable is shown in Table 8. The station group pairs containing the origin station group and destination station group on the same line are ignored in the model. The reason is that these passengers can complete their travel consequentially.
As shown in Table 8, the passengers of 15 station group pairs cannot complete their travel under the initial timetable. After optimizing the timetable, the number of successful travel passengers increases from 624 to 746, and 100% of all considered passengers successfully complete their travel. Although five transfer directions are not successful, as shown in Table 7, all passengers still successfully complete their travel. The reason is that some passengers can use detour routes in which all transfer directions are successful. Thus, the results of the optimized transfer directions and optimized number of successful travel passengers suggest that operators would better design an optimized last train timetable to maximize the number of successful travel passengers with appropriate numbers of successful transfer directions in an urban rail transit network.
Optimized number of successful travel passengers.
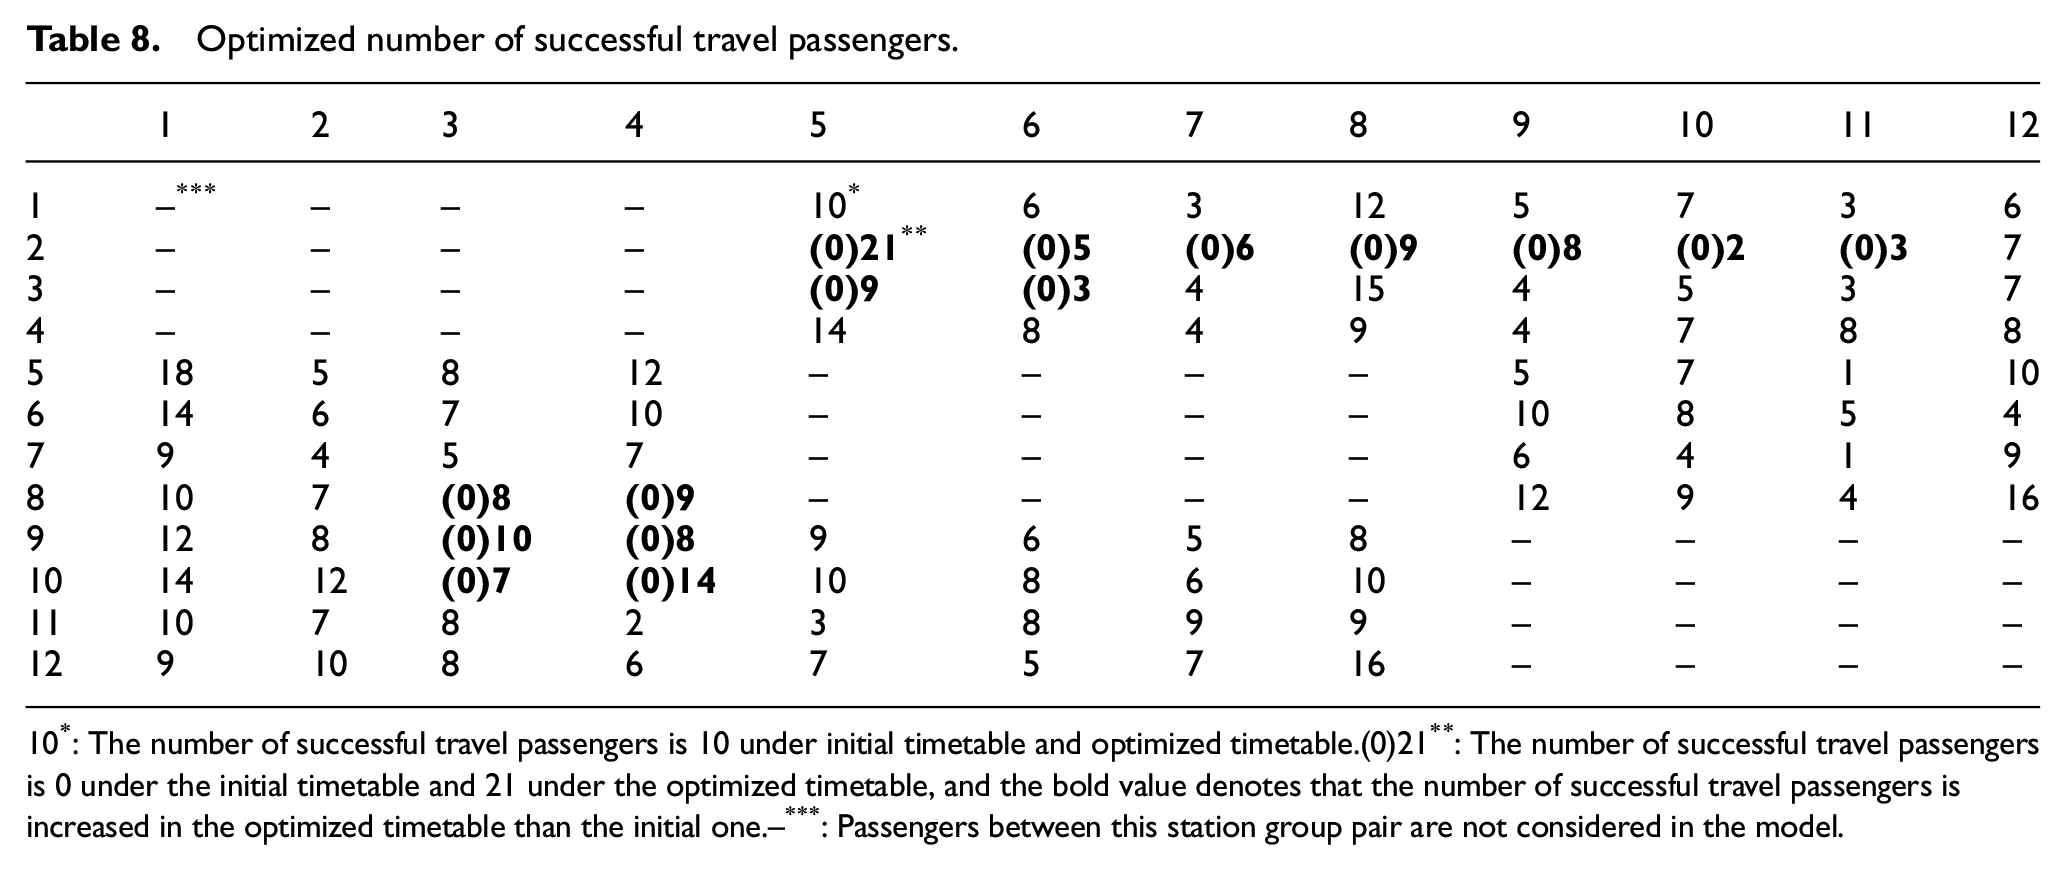
10*: The number of successful travel passengers is 10 under initial timetable and optimized timetable.(0)21**: The number of successful travel passengers is 0 under the initial timetable and 21 under the optimized timetable, and the bold value denotes that the number of successful travel passengers is increased in the optimized timetable than the initial one.–***: Passengers between this station group pair are not considered in the model.
Case study
Network description
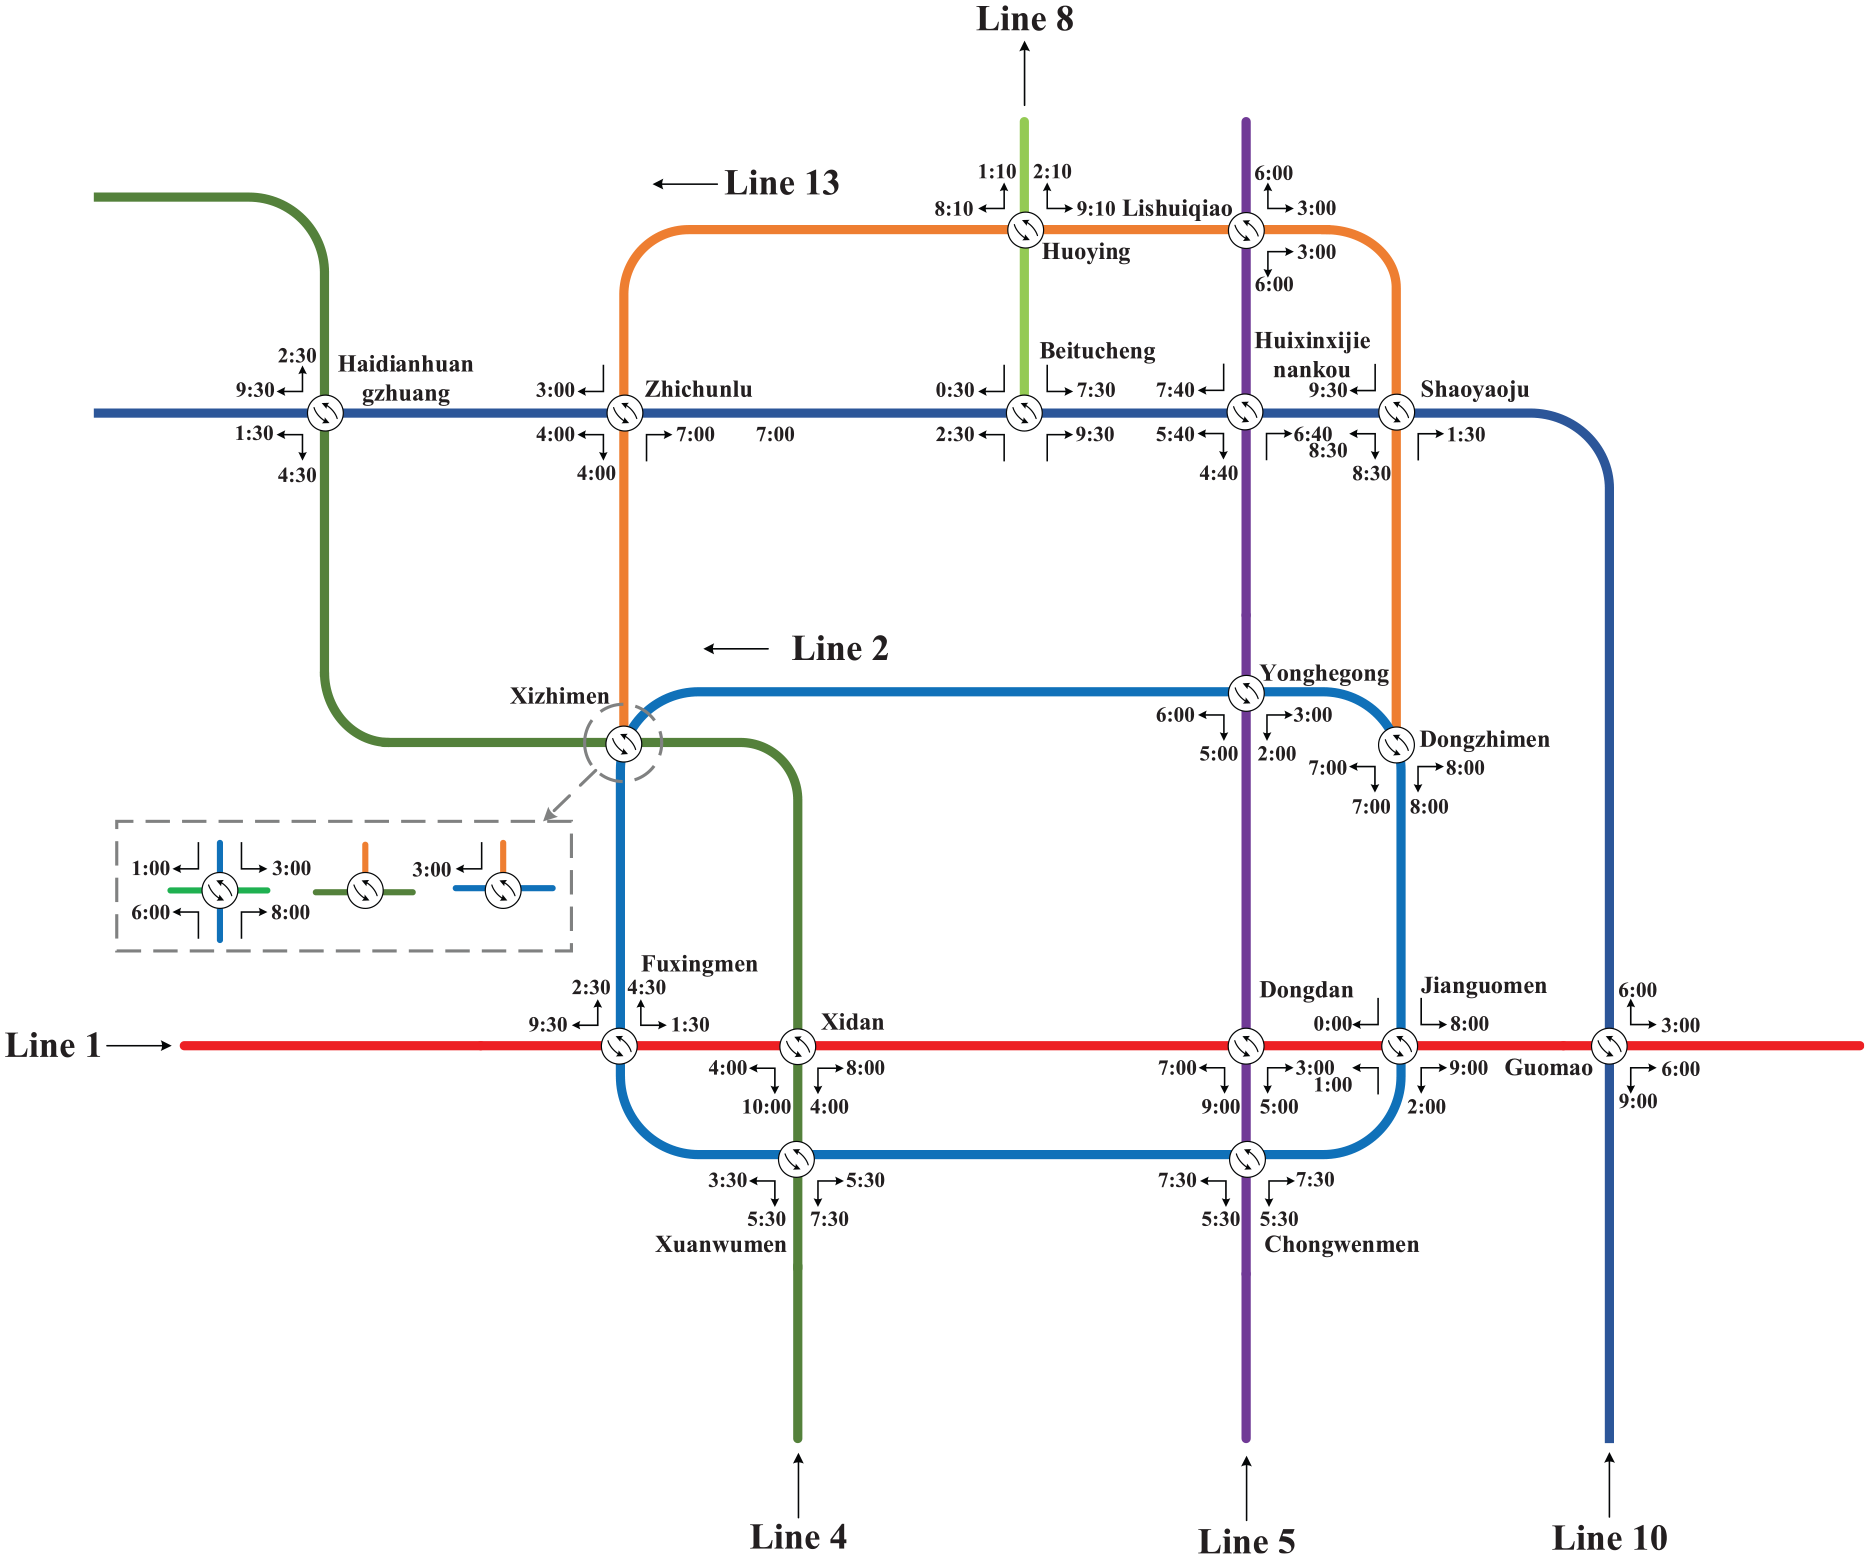
In this section, the proposed bi-level last train timetable optimization model and solution approach are validated by a real-world case, the Beijing urban rail transit network 43 as depicted in Figure 9.
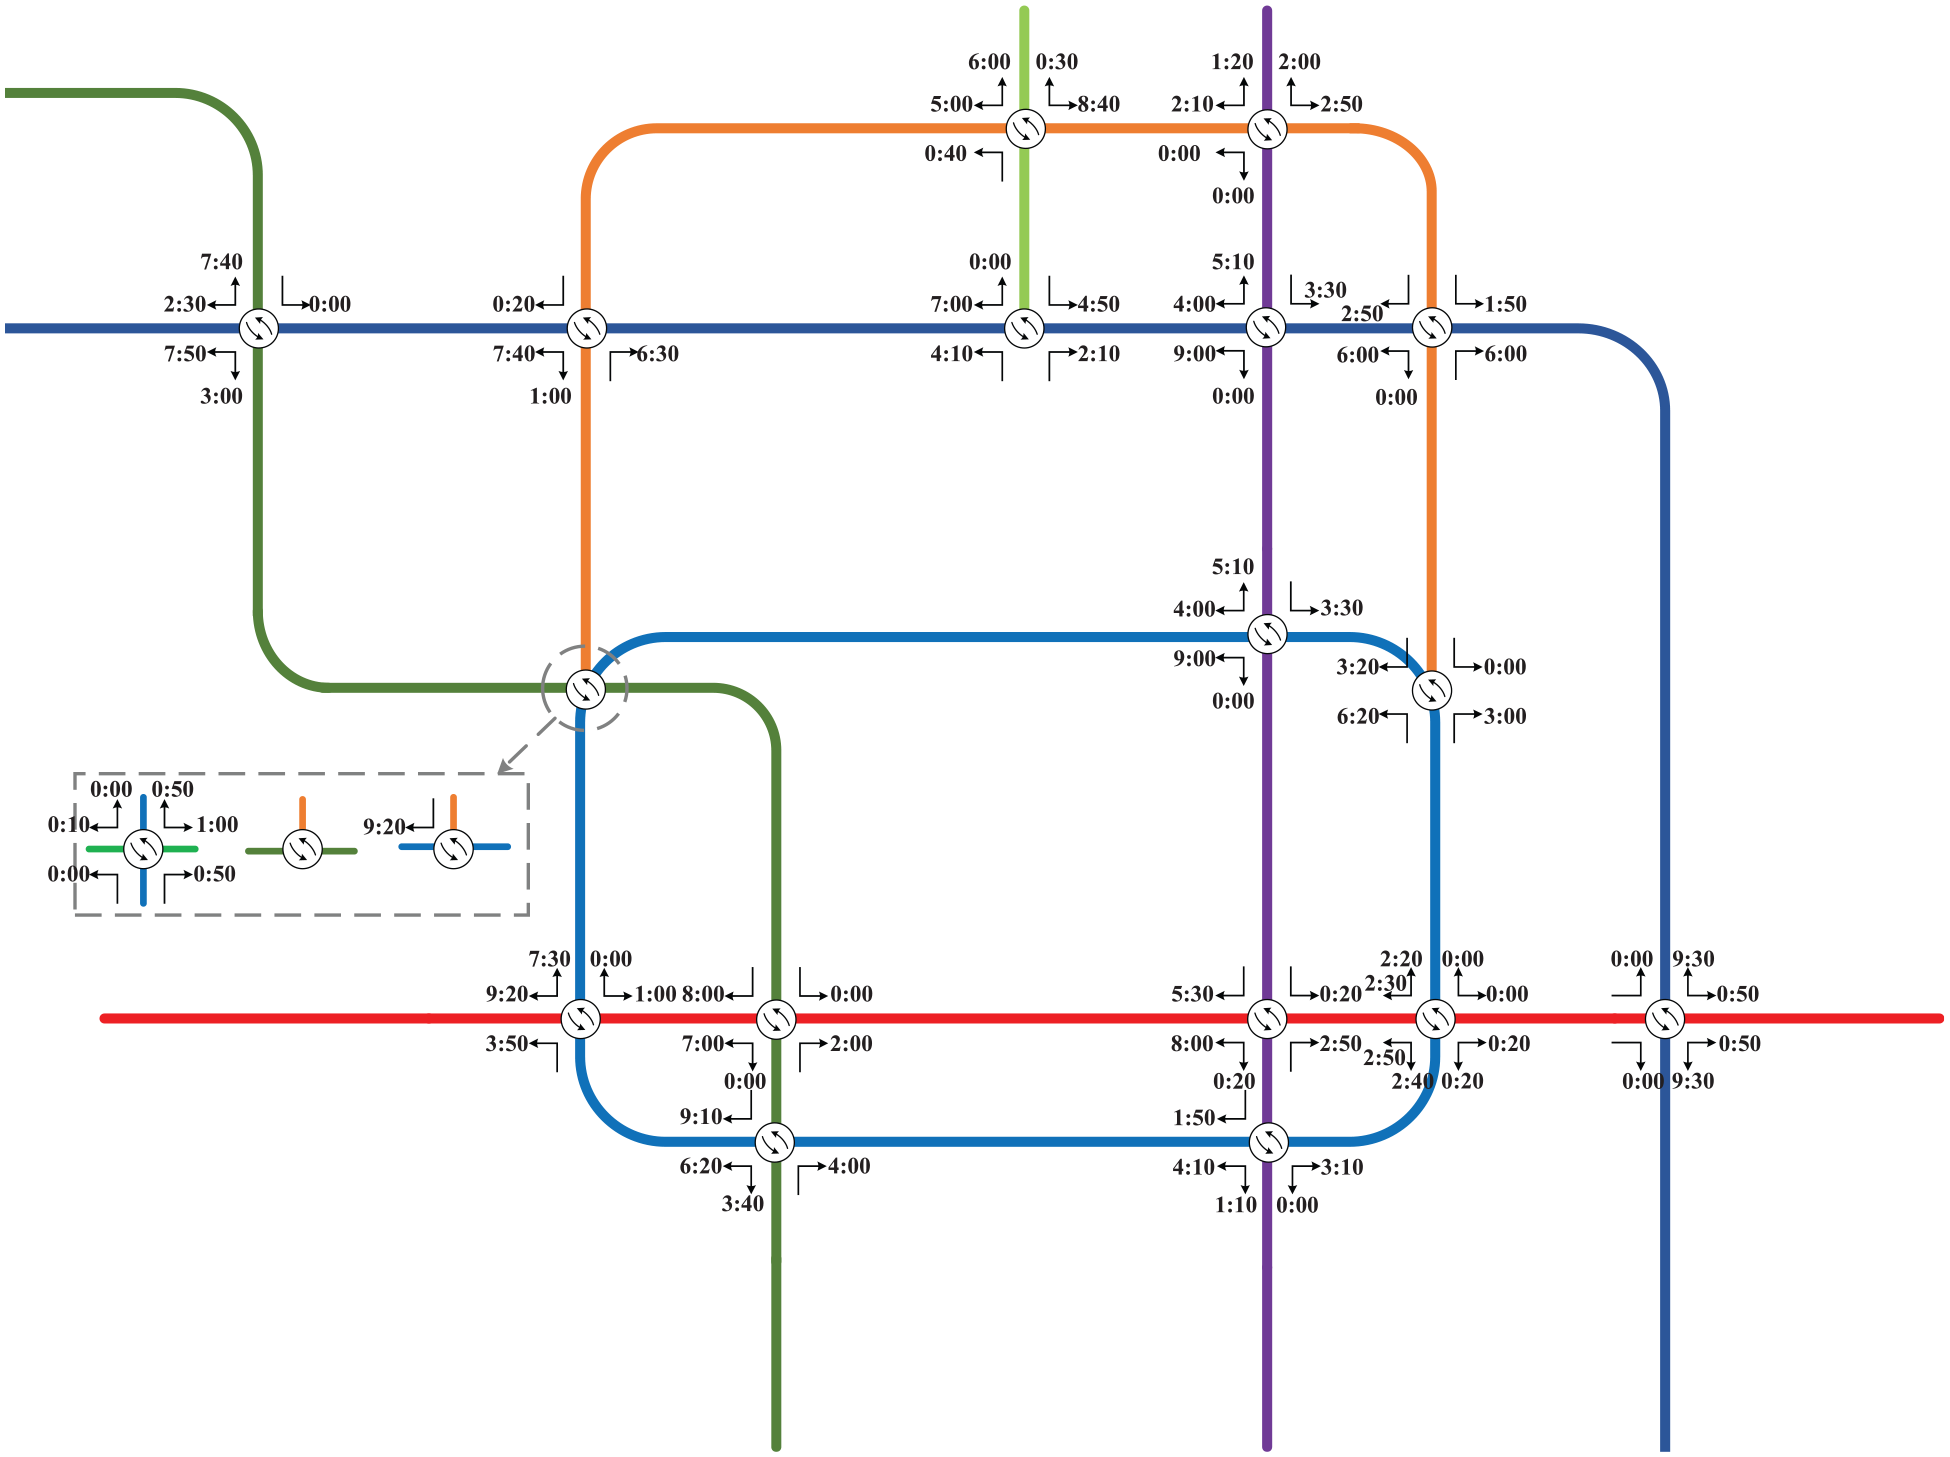
Beijing subway network.
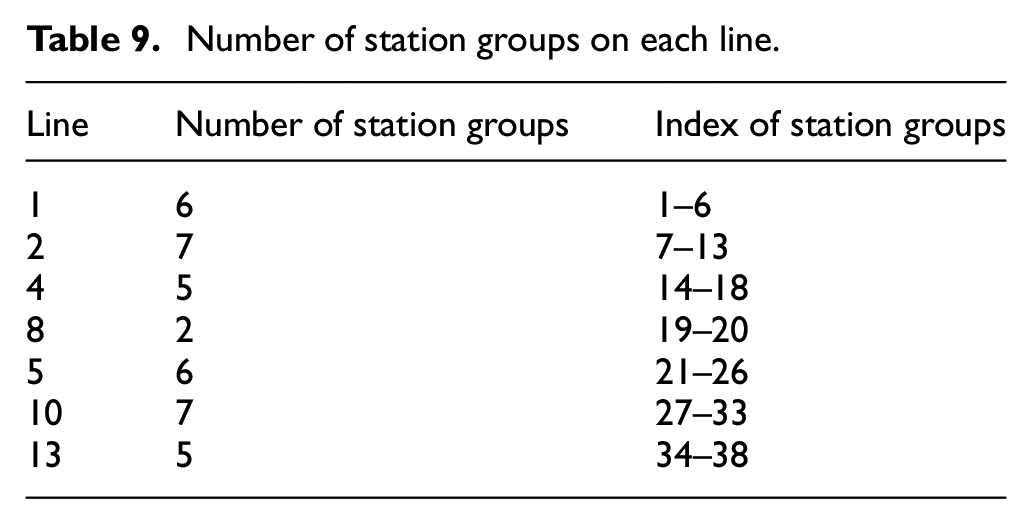
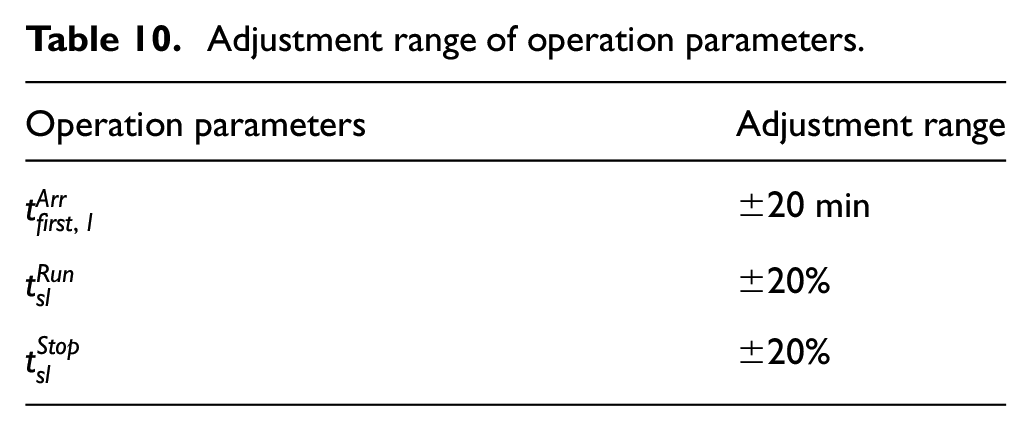
The studied network has 14 lines (7 bi-directed lines), 17 transfer stations, and 38 station groups, and the total number and the indexes of station groups on each line are listed in Table 9. The adjustment ranges of operation parameters of the studied urban rail transit network are listed in Table 10.
Number of station groups on each line.
Adjustment range of operation parameters.
In the urban rail transit network shown in Figure 9, each station group pair
The passenger demand for the last train service can be obtained from the smart card automated fare collection systems. As shown in Figure 10, the input data are represented by the number of passengers who arrive at the urban rail transit network right before the last trains and travel between all station group pairs.
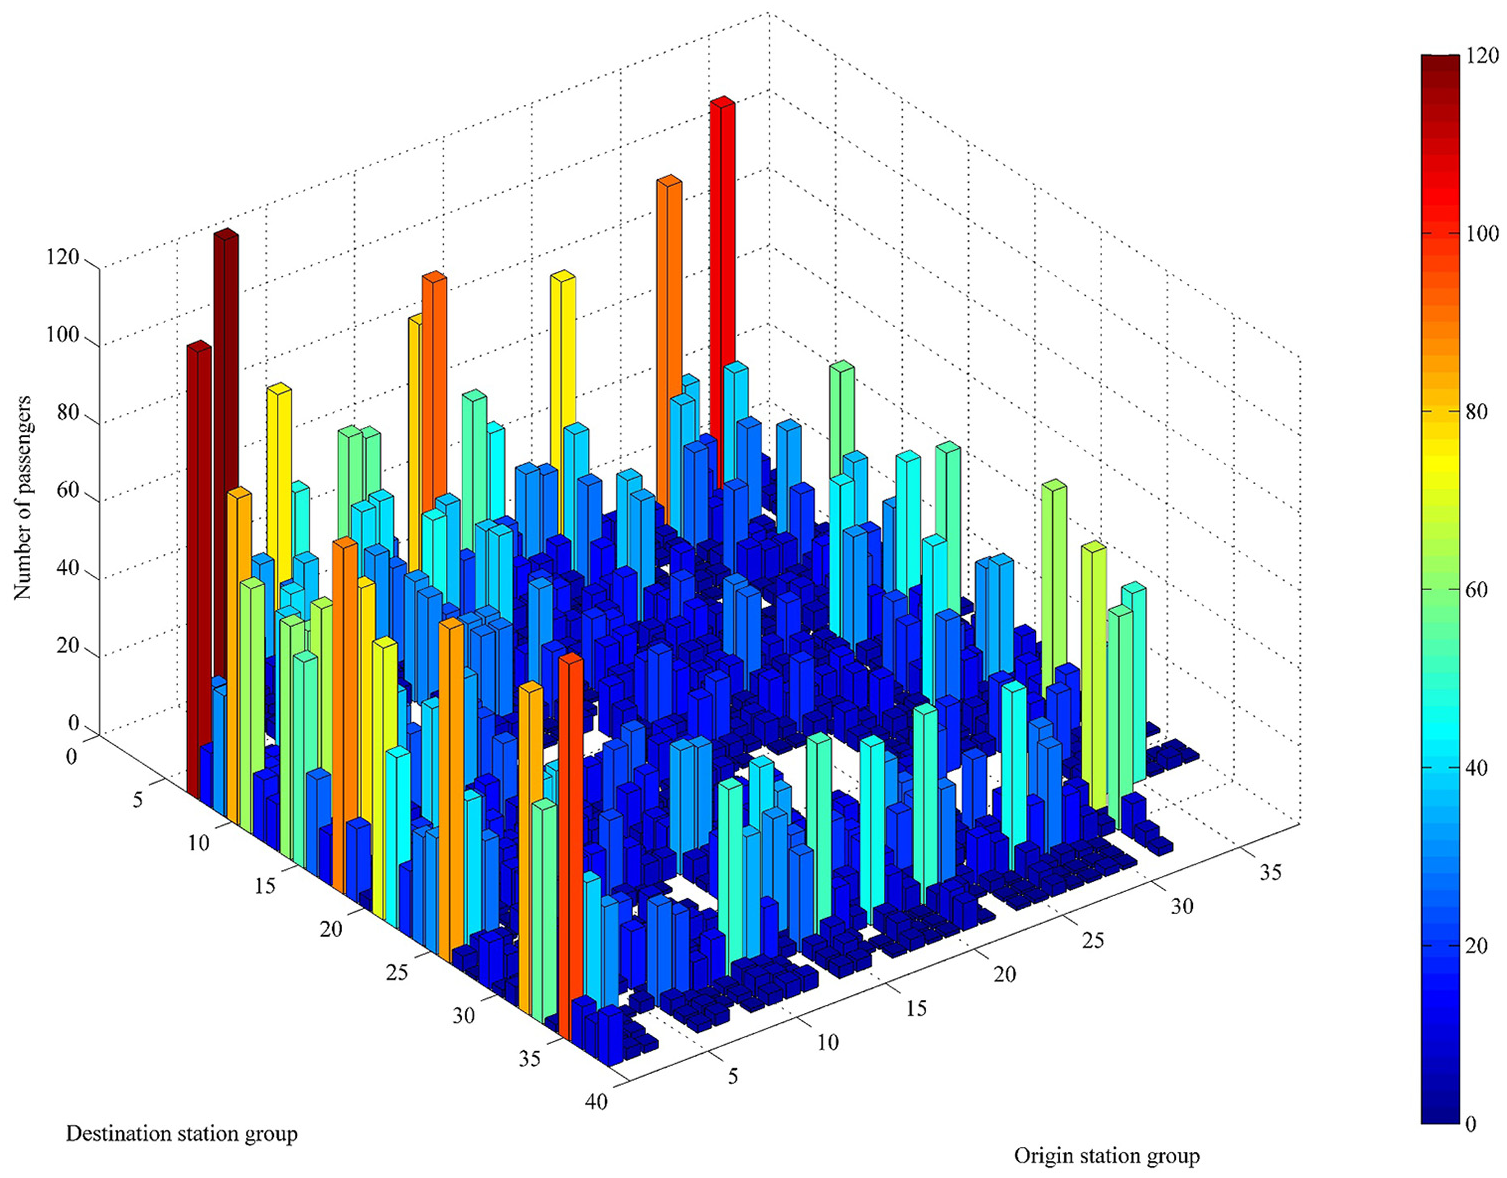
Input last train passenger demand between all station group pairs.
Optimization results
We test the case on a personal computer with Intel Core i5-4210U 2.40 GHz and 8 GB RAM. The parameters for the genetic algorithm are set as Table 11.
The parameter for the genetic algorithm.
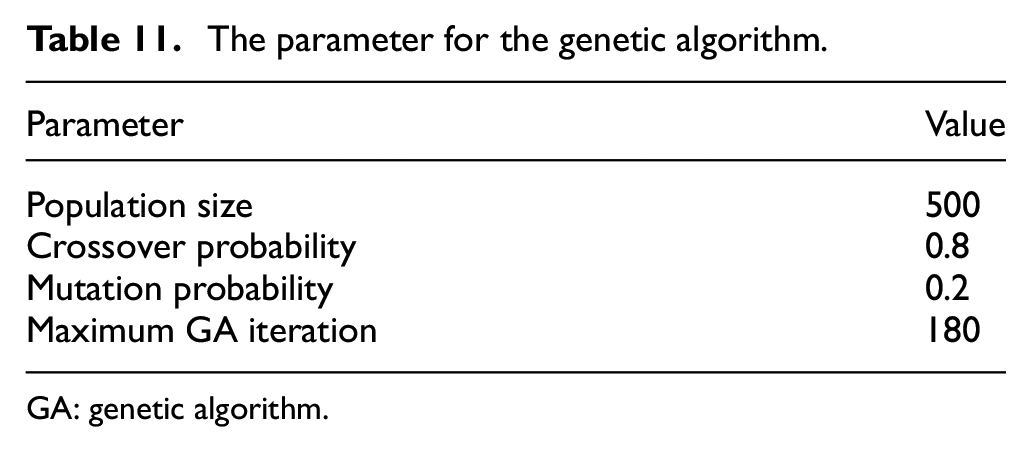
GA: genetic algorithm.
The optimization process of GA is shown in Figure 11, from which we can see that the best solution is obtained in 112th iteration within 10 min.
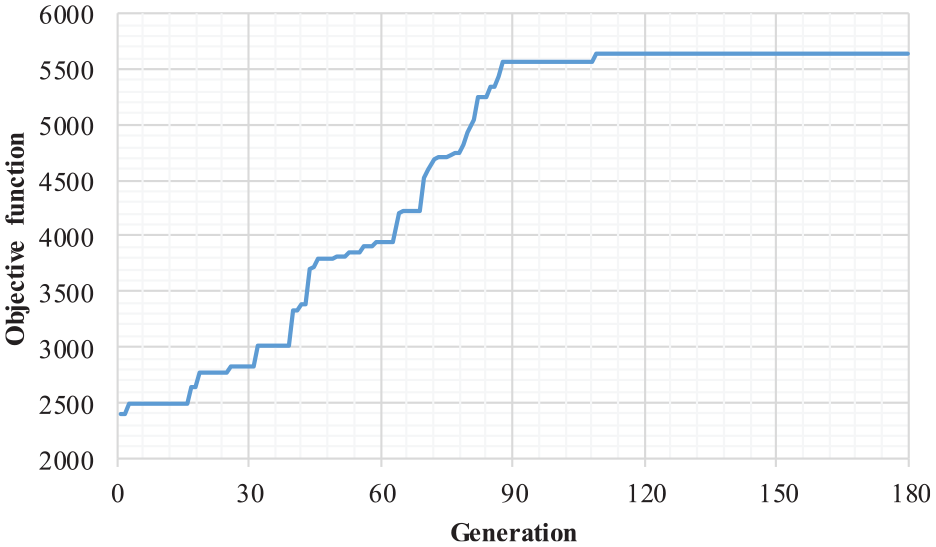
Iteration process of the GA for the Beijing subway network case.
Optimization results of successful transfer directions
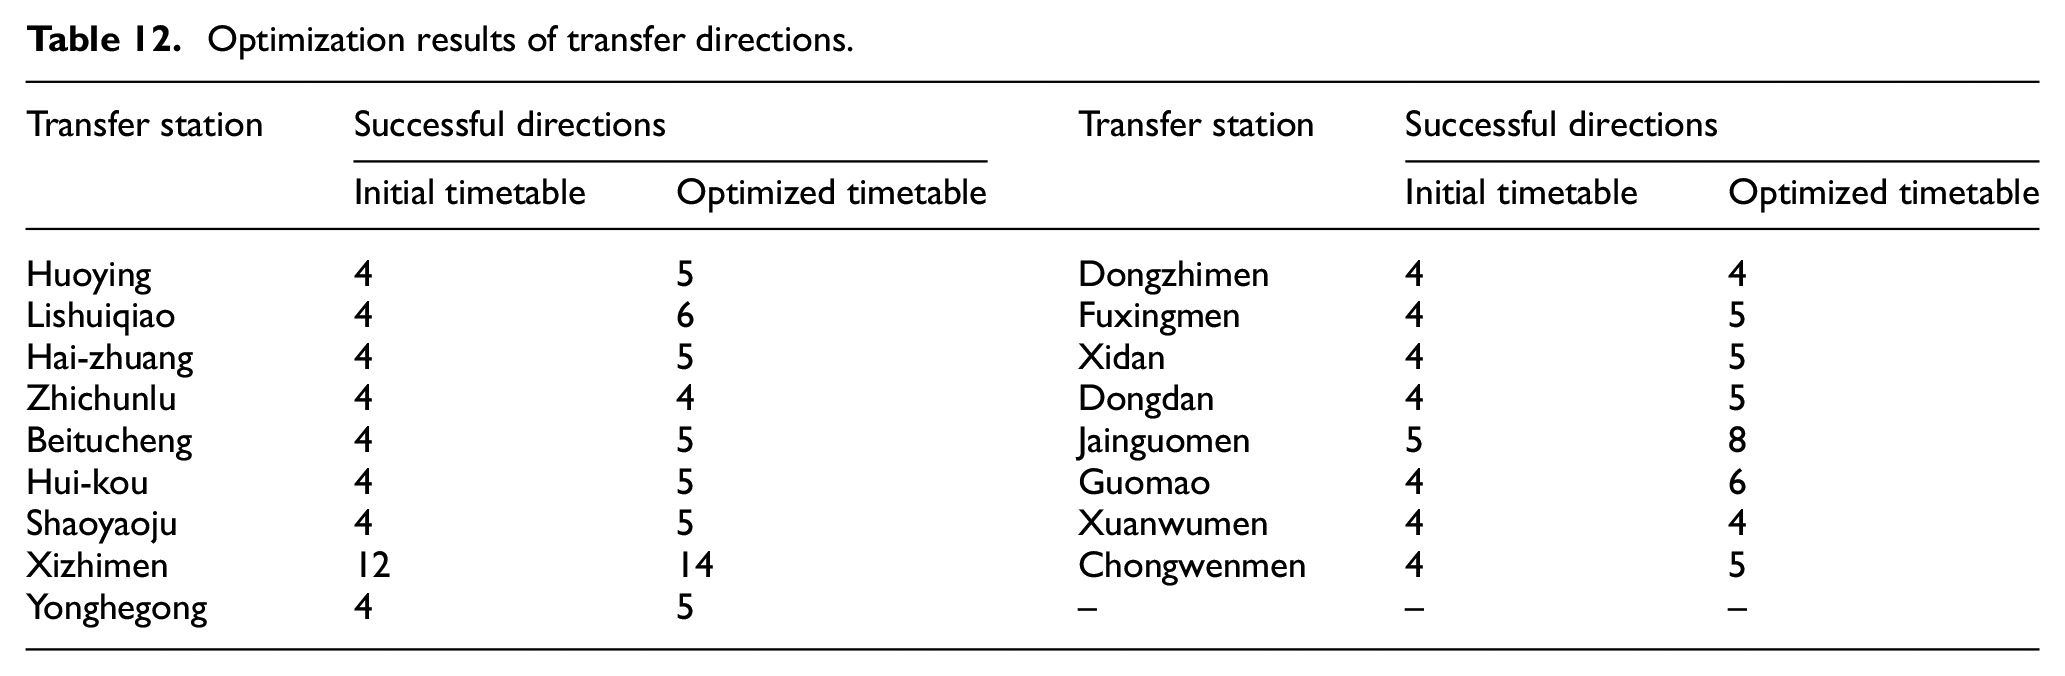
Figures 9 and 12 show the successful transfer directions and the passenger transfer waiting times under the initial timetable and optimized timetable, respectively. The detailed optimization results of the transfer directions are listed in Table 12. The number of successful transfer directions in the case Beijing subway network increases from 77 to 96 after the last train timetable is optimized. As a result, 66.7% of all the transfer directions are successful under the optimized last train timetable. Thus, the optimized last train timetable can ensure the appropriate number and reasonable distribution of successful transfer directions in the case urban rail transit network and minimize the corresponding passenger transfer waiting time for the successful transfer directions.
Successful transfer directions under the optimized timetable.
Optimization results of transfer directions.
Optimization results of the successful travel passengers
The difference between the number of successful travel passengers in the optimized last train timetable and in the initial one is shown in Figure 13, where the value higher than 0 denotes that the number of successful travel passengers increases after the last train timetable is optimized by the proposed model. Correspondingly, a value equal to 0 means there is neither increase nor decrease. And a value lower than 0 indicates that the number of successful travel passengers decreases under the optimized last train timetable compared with the initial last train timetable. Therefore, more passengers can complete their travel under the optimized timetable than under the initial timetable. The detailed optimization results of successful travel station group pairs and successful travel passengers are listed in Table 13.
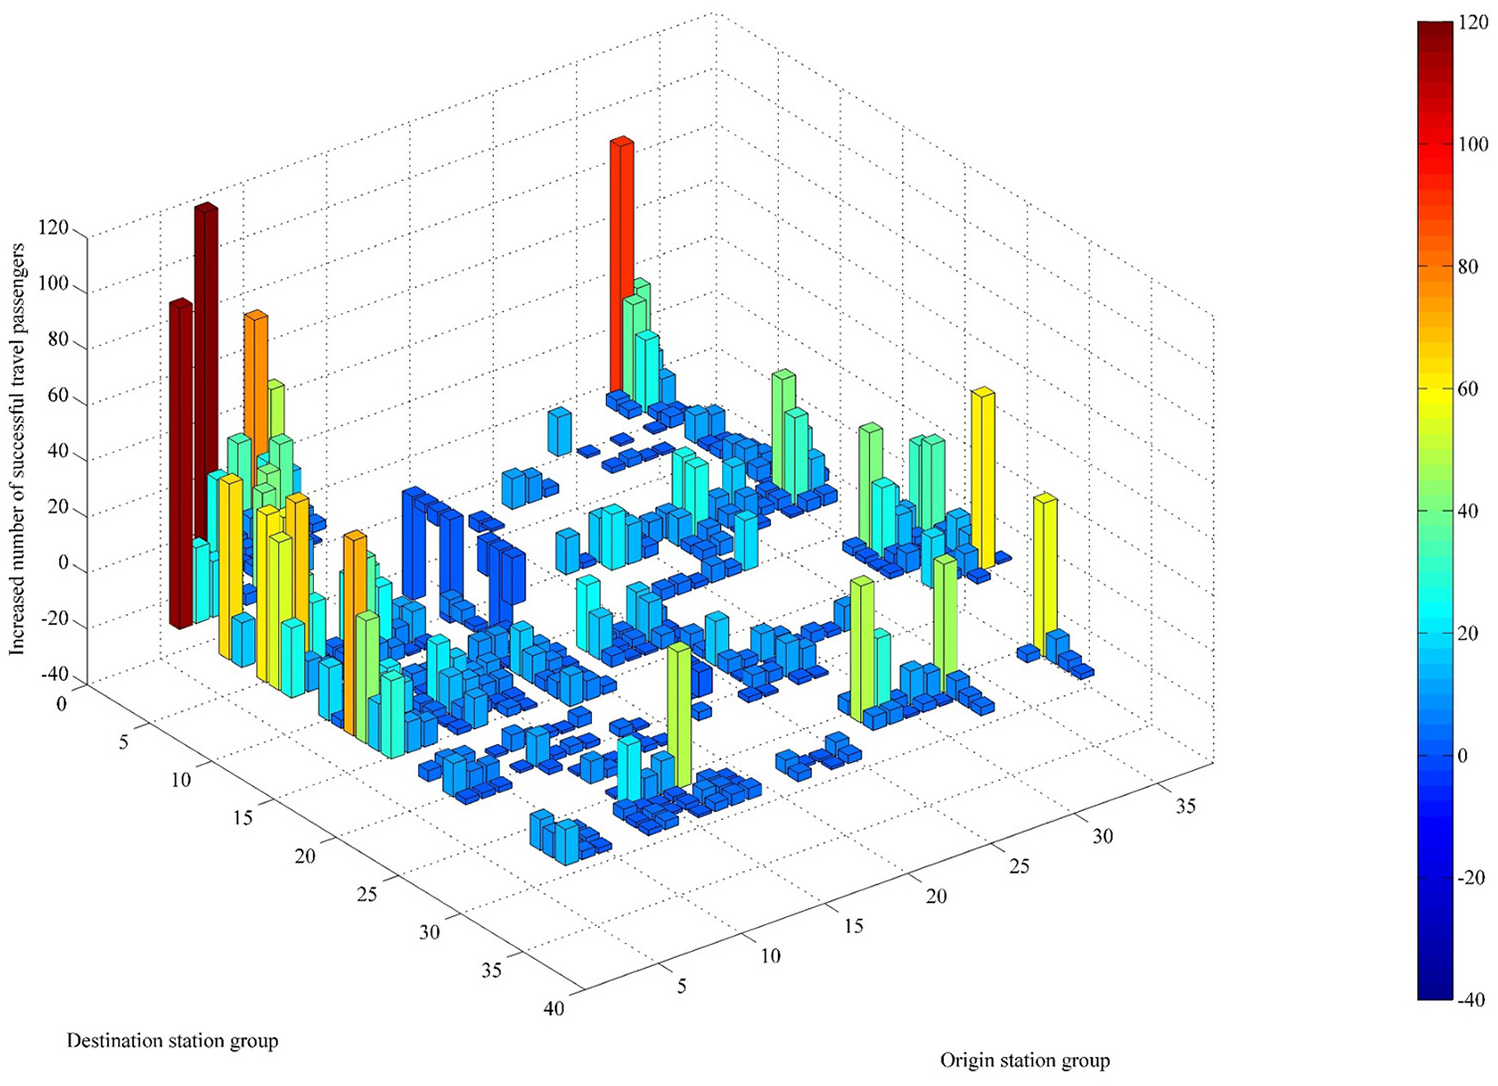
Increase in number of successful travel passengers.
Optimization results of the successful travel station group pairs and the successful travel passengers.
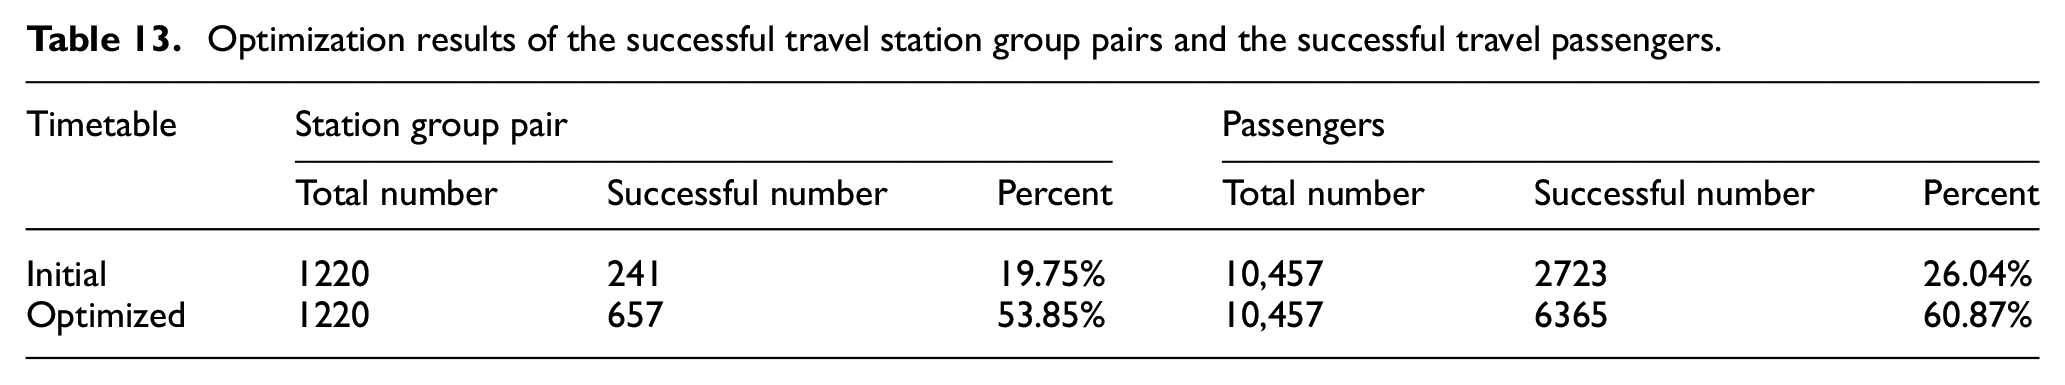
As shown in Table 13, a total of 6365 passengers (60.87% of all passengers) can complete their travel under the optimized last train timetable, compared with only 2723 passengers (26.04% of all passengers) under the initial timetable. A total of 3642 additional passengers can complete their travel after the last train timetable is optimized. The optimized last train table can significantly improve the service level of the urban rail transit network as a public transportation mode when the other transportation modes finish the operation at night. However, 4092 passengers (39.13% of all passengers) still cannot complete their travel under the optimized last train timetable. For example, the passengers from the origin stations between Fuxingmen station and Jianguomen station are inaccessible to the stations located on Lines 4, 8, and 13 and part of Line 5, as shown in Figure 14. For the convenience of passengers, the operators should inform passengers about the inaccessible destination stations in the urban rail transit network when the passengers arrive at their origin stations.
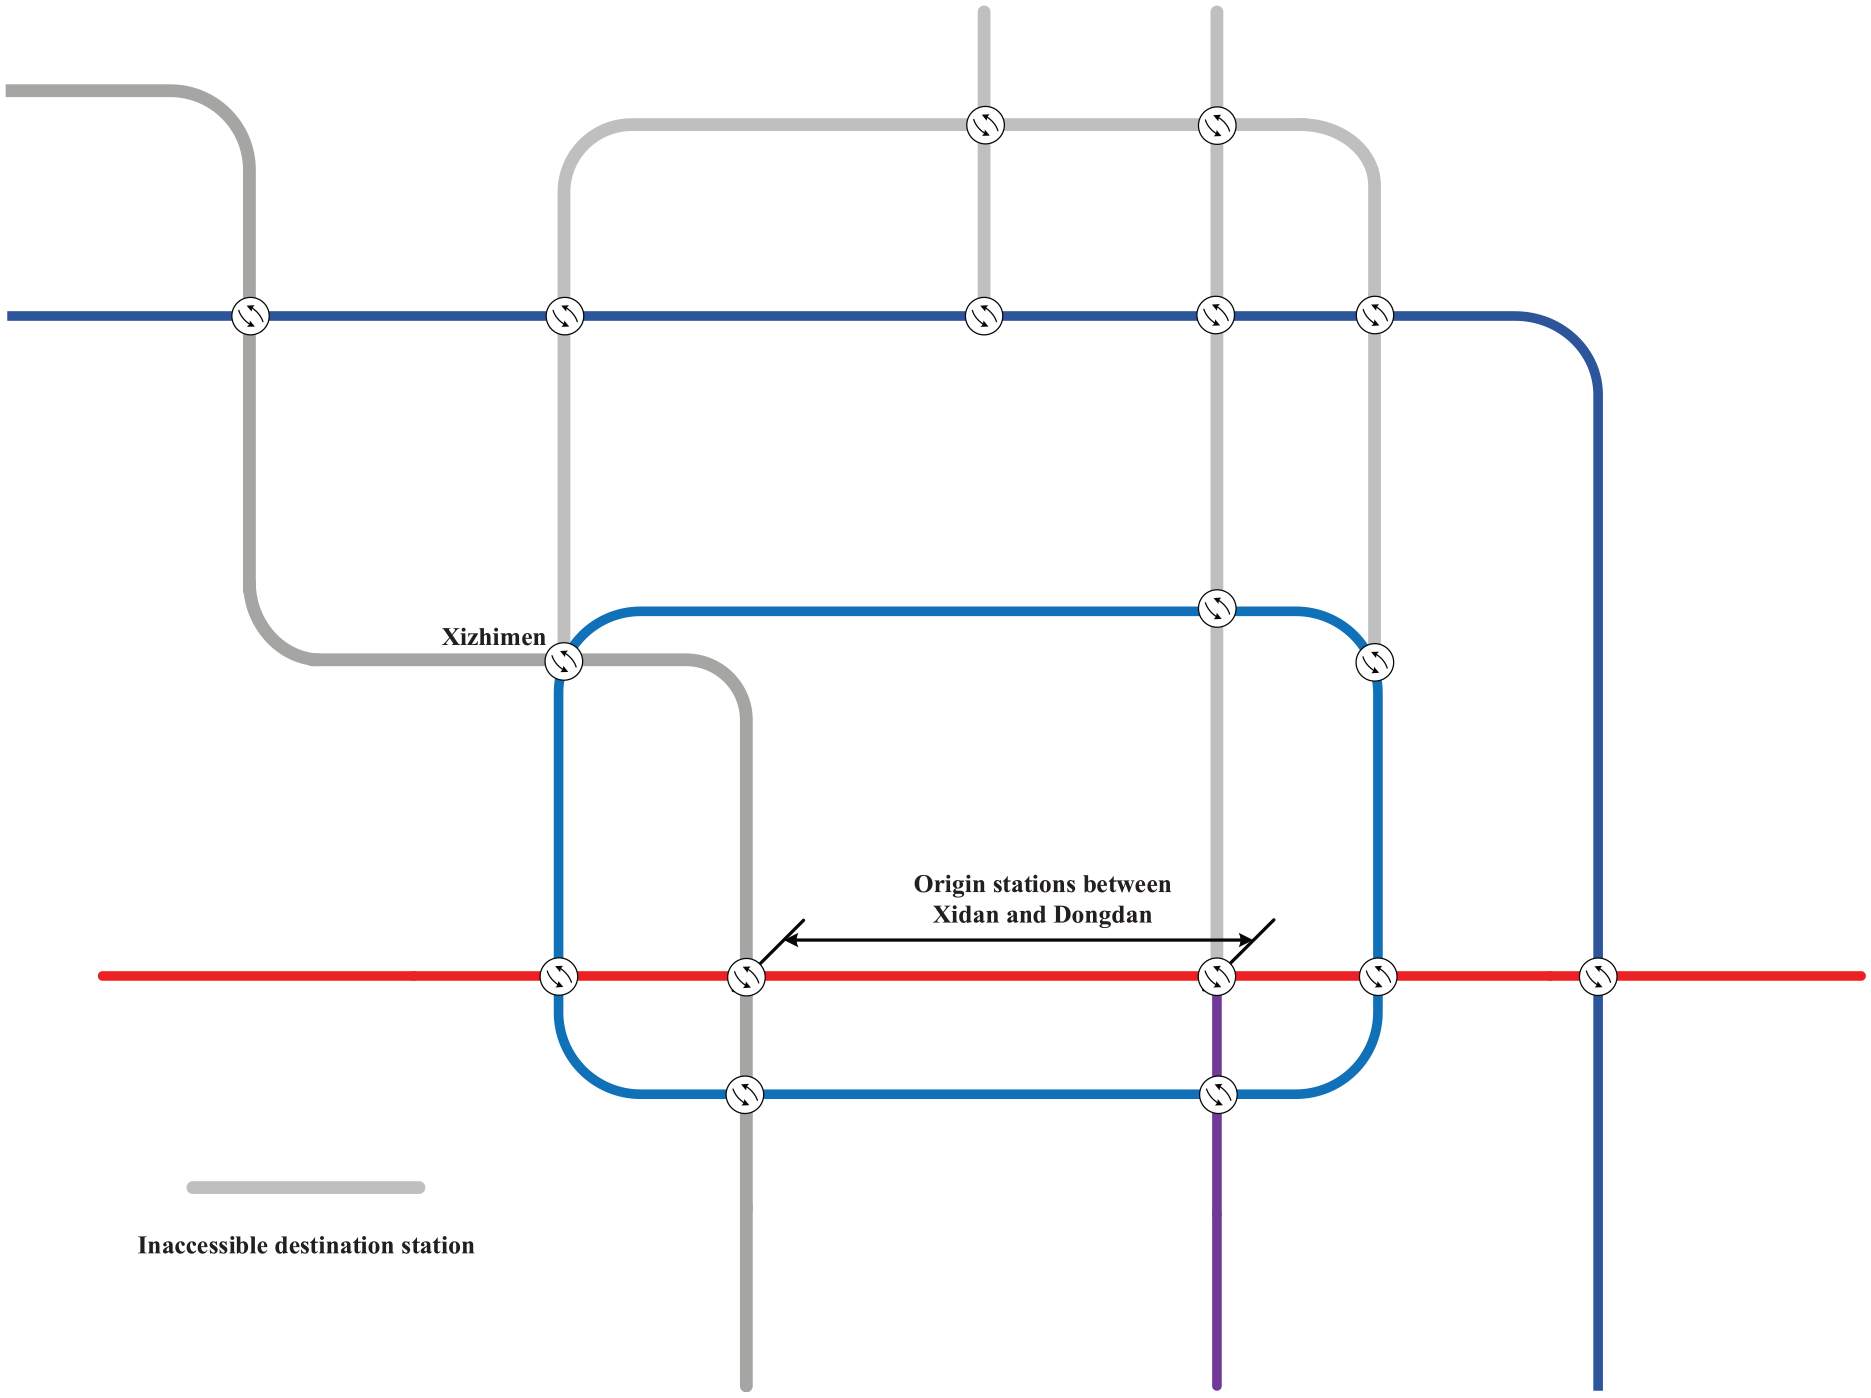
Illustration of passengers who cannot arrive at their destinations.
Parameter sensitivity analysis
Operation closing time of the last train
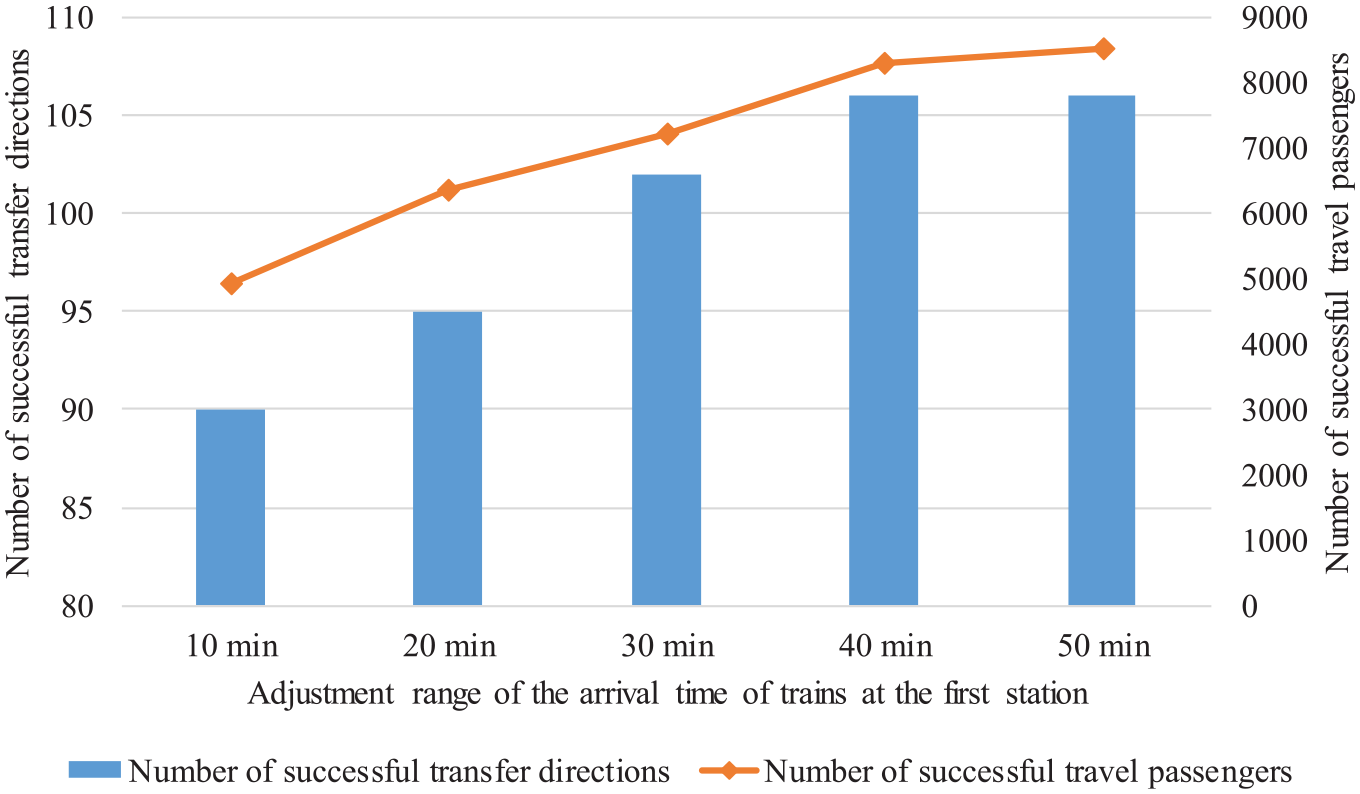
In the case study, the adjustment range of the operation closing time denoted by the departure time
Optimization results with different adjustment ranges of the operation closing time.
Numbers of successful transfer directions and successful travel passengers with different adjustment ranges of the operation closing time.
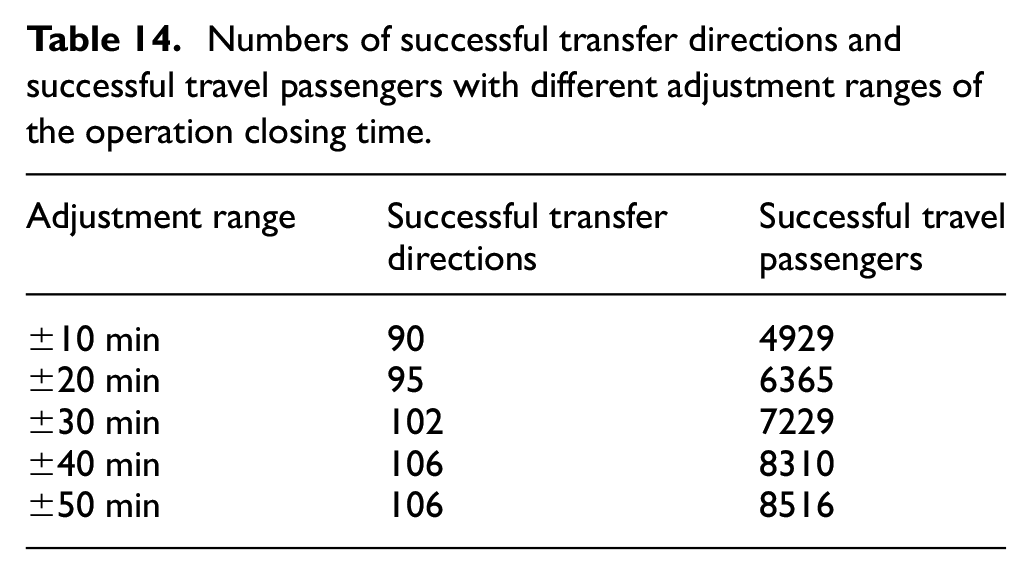
As shown in Figure 15 and Table 14, the numbers of successful transfer directions and successful travel passengers increase as the adjustment range of the operation closing time increases from ±10 to ±50 min. Therefore, with a wide adjustment range of the operation closing time, the last train can finish its operation with a high degree of freedom which leads to the increased numbers of successful transfer directions and successful travel passengers.
Train stopping time
Train stopping time is critical for both scheduling and rescheduling problems.
45
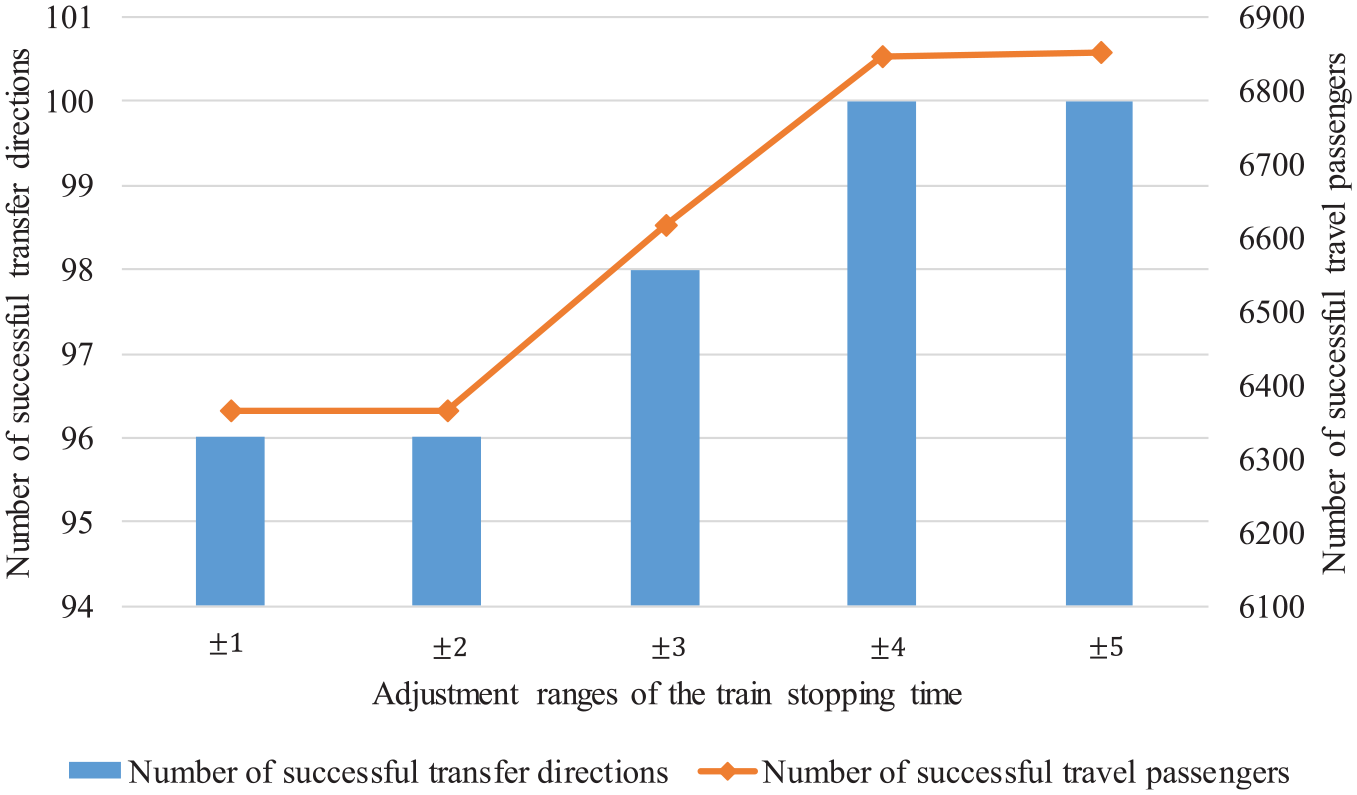
In our p model, equations (2) and (3) show that the last train timetable is determined by the train stopping time
Optimization results with different adjustment ranges of train stopping times.
Number of successful transfer directions and successful travel passengers with different adjustment ranges of train stopping times.
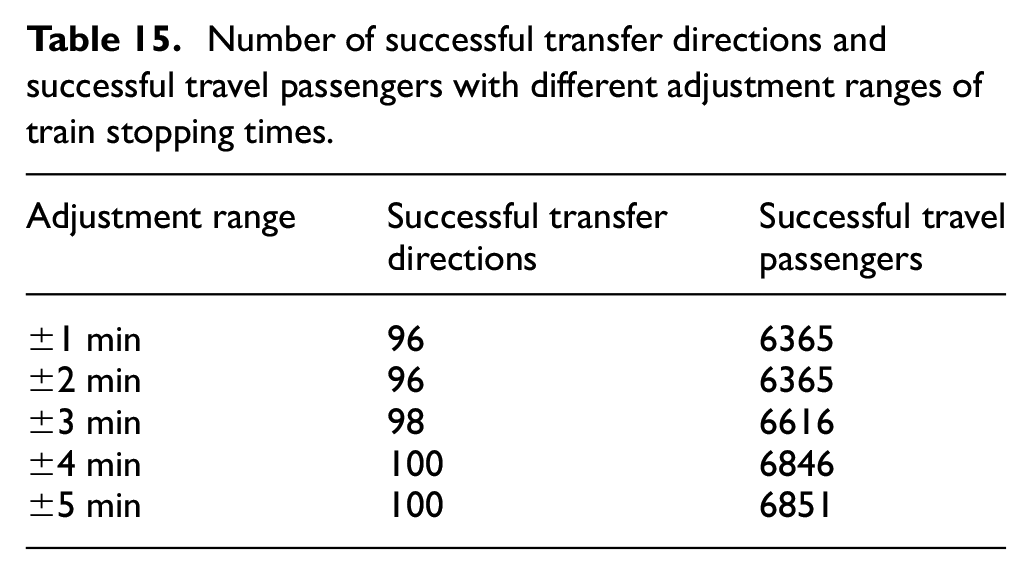
As shown in Figure 16 and Table 15, the number of successful transfer directions and successful travel passengers increase as the adjustment range of the train stopping time varies from ±1 to ±5 min. Thus, similar to the conclusion in section “Operation closing time of the last train,” the numbers of successful transfer directions and successful travel passengers will increase with a higher degree of freedom to decide the stopping time.
Discussion on the detour routing strategy
As the analysis before, passengers will select the detour routes in which all transfers are successful even if the routes are circuitous. For the discussion of this phenomenon, “shortest route” and “detour route” are first defined as follows:
Shortest route. The shortest route which has the minimum total travel time at day time.
Detour route. The detour route which has longer total travel time than the shortest route and can be selected by passengers only when the shortest route cannot complete their travel.
Figure 17 shows an illustration of the shortest route and detour route for passengers from the origin station on Line 4 to the destination station on Line 10. We listed the number of successful travel passengers who can get to their destination stations by shortest routes and detour routes in Figure 17 and corresponding results of station group pairs.
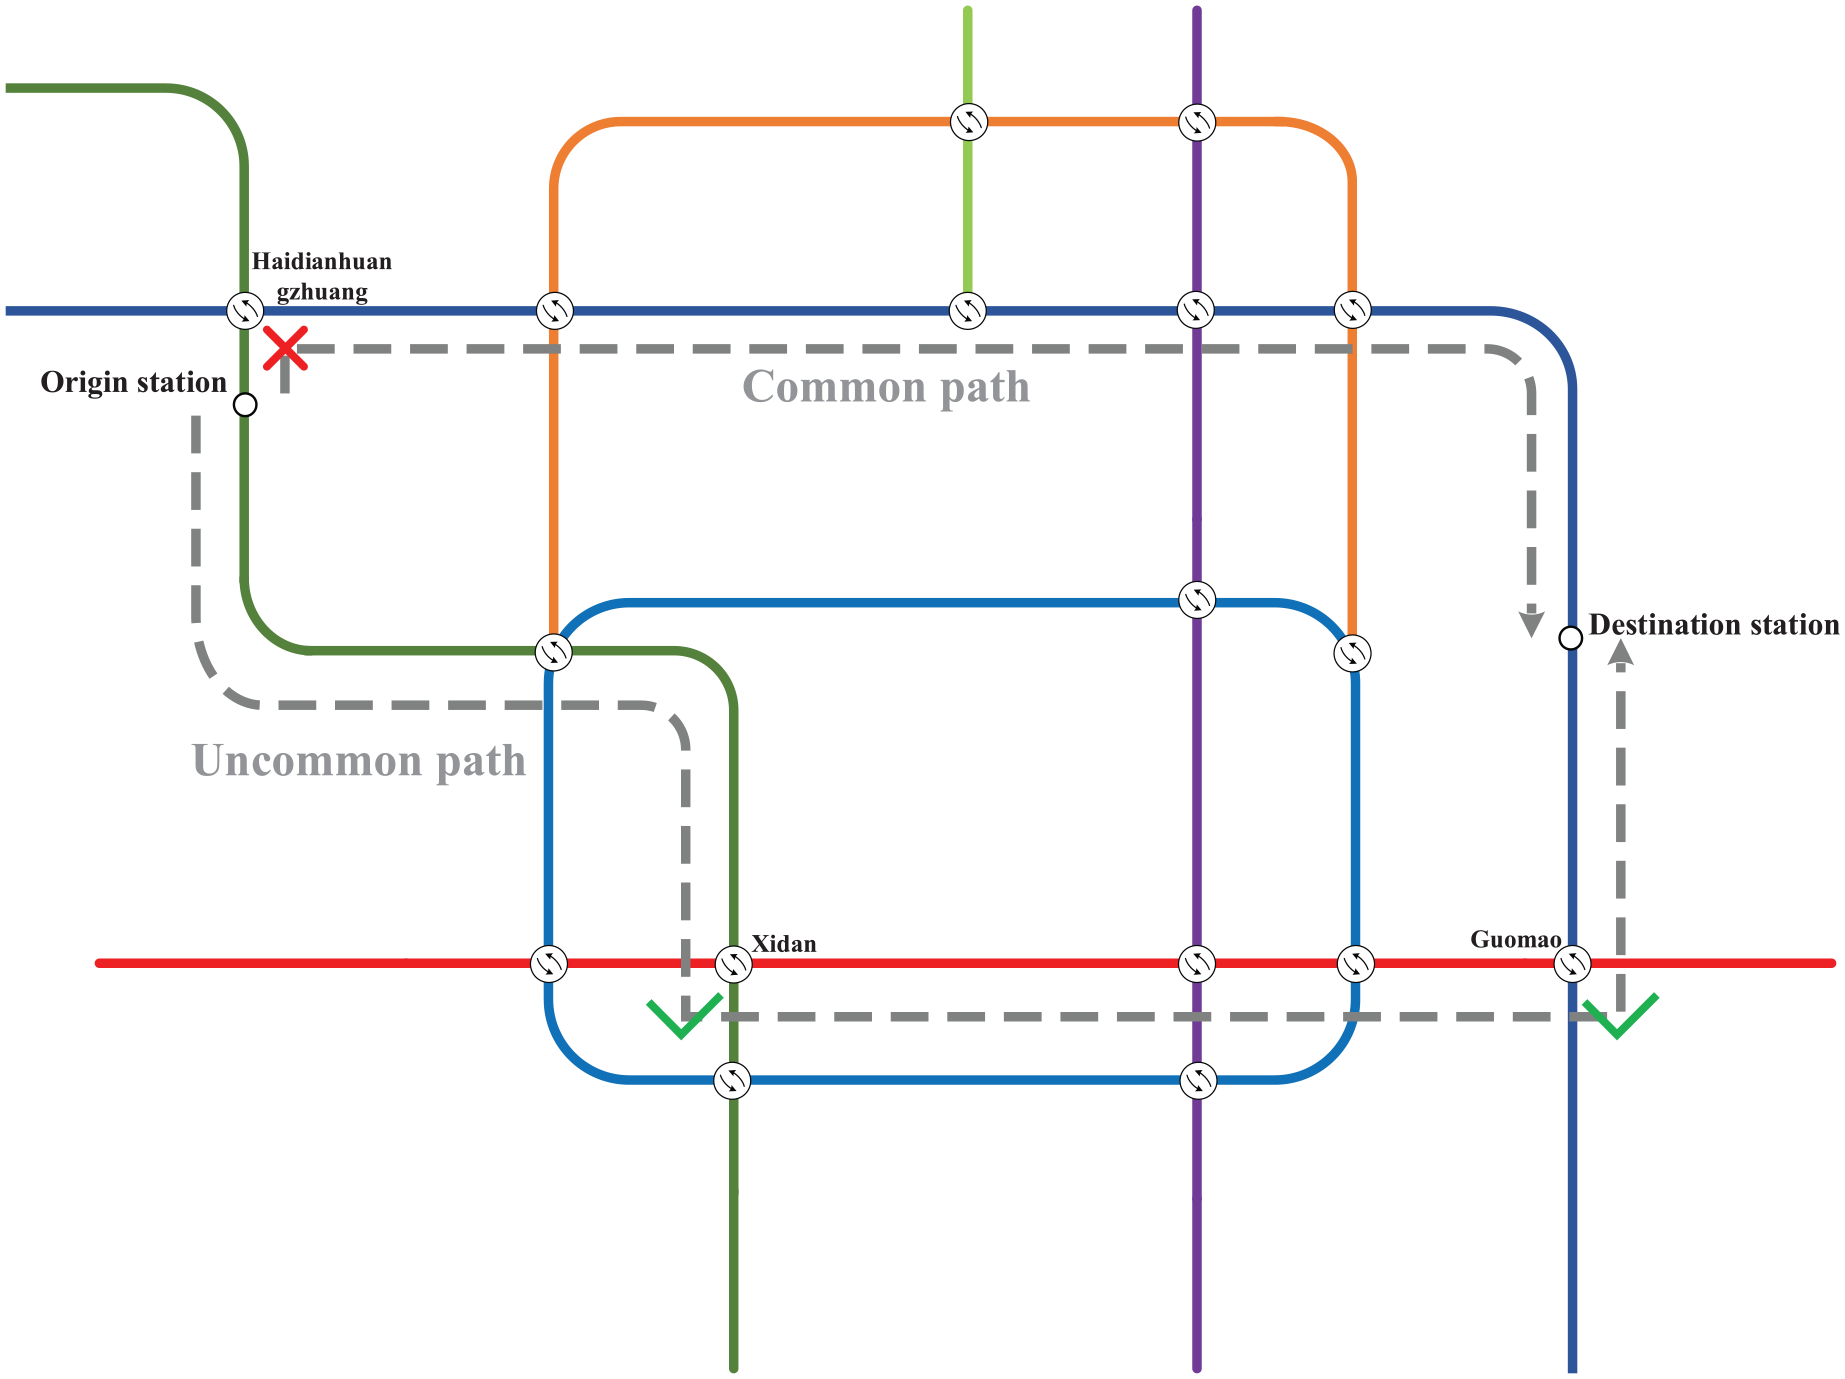
Illustration of the shortest and detour routes.
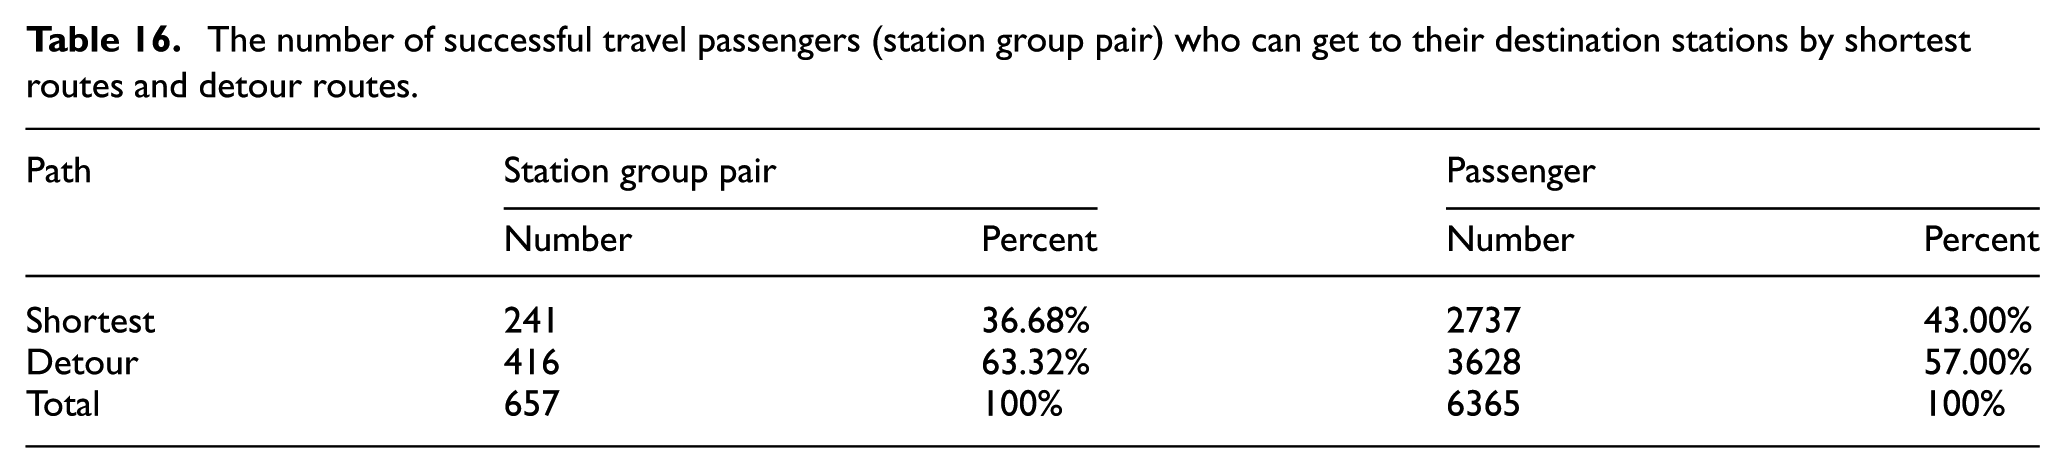
Table 16 reveals that 57% of all passengers (from 63.32% of all station group pairs) could complete their travel under the optimized last train timetable by the detour routes. Therefore, for these passengers, the route guide must be provided to assist the passengers in selecting the detour routes that will allow them to complete their travel. For example, the passengers from Renmindaxue station to Tuanjiehu station usually select the shortest path including a transfer from Line 4 to Line 10 at Haidianhuangzhuang station, which is an unsuccessful transfer direction in the optimized last train timetable. Therefore, the route guide must inform the passengers to select the detour route including two successful transfers (from Line 4 to Line 1 at Xidan station and from Line 1 to Line 10 at Guomao station) to complete their travel.
The number of successful travel passengers (station group pair) who can get to their destination stations by shortest routes and detour routes.
Conclusion
Urban rail transit is not able and unnecessary to provide 24 h service for passengers, which means the urban rail transit companies need to set a final time for each line. Therefore, the last train timetable optimization is an inevitable and challenging optimization problem to improve the service quality and reduce the operation costs of companies. However, independent transfer optimization cannot guarantee that the majority of the passengers are able to complete their travel by the last train service. Instead, the detour paths should also be taken into consideration as it is passengers’ last chance to reach their destination station via the urban rail transit. In this study, we propose a bi-level last train timetable optimization model. Its upper level model aims to maximize the number of successful travel passengers by the last train service and minimize passenger transfer waiting time of successful transfer directions, and the lower level model aims to determine passenger path choices based on the optimized last train timetable obtained from the upper model.
Genetic algorithm and semi-assignment algorithm are proposed to solve the upper level and lower level model, respectively. The bi-level last train timetable optimization model and the proposed solution approach are tested in a simple urban rail transit network and applied to the Beijing urban rail transit network. The optimization results show that the optimized last train timetable can increase the number of successful travel passengers and minimize the passenger transfer waiting time of successful transfer directions in successful transfer directions. In addition, the information about inaccessible stations from each origin station and corresponding route guide for passengers who need to select a detour route to complete their travel by the last train service can also be offered by the model. These types of information are practically useful for urban rail transit network operation.
Footnotes
Declaration of conflicting interests
The author(s) declared no potential conflicts of interest with respect to the research, authorship, and/or publication of this article.
Funding
The author(s) disclosed receipt of the following financial support for the research, authorship, and/or publication of this article: This work was supported by the Fundamental Research Funds for the Central Universities (2018YJS090), the National Key Research and Development Program of China (grant number 2018YFB1201403), and Civil Aviation Administration of China Major projects (grant number 201501).