
Abstract
In order to analyze the response characteristics of the solenoid valve in depth, the flow field of the solenoid valve is analyzed by means of the computational fluid dynamics, and the aerodynamic parameters that are difficult to be obtained by the traditional methods are obtained with software FLUENT. We also set up the mathematical model of the solenoid valve, including the aerodynamic model, the circuit model, the magnetic circuit model and the mechanical motion model. The calculation is completed in the Simulink, and the results of the calculation are analyzed. A set of the solenoid valve response characteristic test system is built, and the response characteristic parameters such as response time and maximum action frequency of the solenoid valve are tested. The experimental results are verified by comparing them with the simulation results. The final result shows that the response characteristics are basically irrelevant to the action frequency at a suitable working frequency. The open switching time of the solenoid valve decreases with the increase in the inlet pressure and the driving voltage and increases with the increase in the number of coil turns. The close switching time increases with the increase in the inlet pressure, the driving voltage and the number of coil turns.
Introduction
With the development of technology and the improvement of environmental awareness, the pneumatic control system is widely used and, especially, suitable for application in low-cost industrial automation owing to its low maintenance cost, low pollution to the environment and good weight/power ratio. The performance of solenoid valves affects the performance and safety of the pneumatic system to a large extent. Besides the static parameters such as the driving voltage, working temperature and pressure environment, the dynamic response characteristics of solenoid valves are also essential components for evaluating the performance of solenoid valves. Especially, for high-precision and high-speed pneumatic systems, the response time and maximum action frequency of pneumatic solenoid valves are particularly critical. The fast response of solenoid valves is particularly important for driving electrical control systems. 1 The relationship between the static parameters and the response characteristic parameters of pneumatic solenoid valves provides a reference for the design and improvement of solenoid valves. In view of the above, the study on response characteristics of pneumatic solenoid valves is carried out to analyze their intrinsic relationship.
Mutschler et al. 2 established a full model description by the computational fluid dynamics (CFD) method and used network simulation methods for modeling by the SABR model. The simulation results were in agreement with the experimental results. The friction behavior of new pneumatic valve spools made of advanced composite materials was analyzed in detail using the experimental approach on the basis of a large number of experimental data. 3 Gastaldi et al. 4 presented a methodology to test a pneumatic open loop proportional valve, with the description of the test bench and the experimental scheme to measure the interested magnitudes. The transient flow of a pulse width modulation (PWM)-controlled solenoid valve was simulated by CFD to investigate the pressure control performance of the solenoid valve under PWM-controlled conditions. 5 Chen et al. 6 analyzed the fault mechanism and the accelerated stress and determined the accelerated life model for a certain type of solenoid valve. A CFD simulation study was conducted to understand the hydrodynamic characteristics of this type of stirred tank under aerated and unaerated conditions. 7 Lin et al. 8 investigated the flow resistance and internal flow characteristics of gate valves at different inlet velocities by combined CFD and experimental research. Erdodi and Hos 9 focused on modeling the dynamic instability (flutter/chatter) of gas-service direct spring operated pressure relief valves (DSOPRVs). Dynamic CFD simulations using deforming mesh technology were conducted, with which the valve response can be resolved with high fidelity including also transient fluid–structure interactions.
Using CFD methods to simulate the response characteristics of solenoid valves is an important trend at present. Numerical simulation can provide a theoretical basis for the research and design of solenoid valves. The dynamic characteristics of solenoid valves used commonly are mostly based on the interaction of the electrical, magnetic and mechanical parts. However, the influence of the aerodynamic part on the dynamic characteristics of solenoid valves is not taken into account.
Kawashima et al. 10 used an isothermal chamber to determine the flow rate characteristics of pneumatic solenoid valves. Messina et al. 11 studied the dynamics of pneumatic actuators controlled by switching valves, whose response time is based on a PWM technique. The prediction error of the theoretical model for the pneumatic actuator stroke was less than 2 mm. The dynamic characteristics of micro-valves driven by electromagnetic force were studied; besides, the parameters like the natural frequency, damping coefficient and spring constant of the micro-valve were obtained by experiments. 12 Pan et al. 13 investigated the fluid dynamic behavior of a pneumatic pressure measurement method for the machining quality of servo-valve spool valves.
Micro-valve structure consists of a thermopneumatic actuation chamber, micro-channel, a thin film heater, an inlet and an outlet. Micro-valve could be simulated by means of ABAQUS program. 14 Amirante et al. 15 carried out the evaluation of the driving forces acting on a 4/3 hydraulic open center directional control valve spool by means of a comprehensive numerical analysis. Chu et al. 16 carried out modeling and simulation of anti-lock braking system (ABS) solenoid valves on the basis of MATLAB/Simulink and put forward the design principles of solenoid valves through the analysis of the results. Venkataraman et al. 17 used a cathode ray oscilloscope (CRO) to display pulse input signal and outlet pressure change. The action frequency of the coil and the response time of the solenoid valve can be calculated by observing the input voltage signal curve and the output pressure curve. Zhao et al. 18 used the finite element method (FEM) to perform a simulation of the dynamic characteristics of a high-speed solenoid valve. The simulation results indicated that as the boost voltage increases, the rising rate of the driving current at the solenoid valve increases sharply.
From the analysis of the above research status, we can see that many scholars have done corresponding research on solenoid valves; however, the study on dynamic response characteristics of pneumatic solenoid valves is relatively rare. For the detection of response time of solenoid valves, most of the test systems use the method of detecting coil current. The response characteristics of solenoid valves are not entirely determined by current but are also related to the structure and operation principle of valves. The method of measuring coil current is inaccurate in detecting the response characteristics of solenoid valves. A few of the measurements of the input pressure and outlet pressure of pneumatic solenoid valves can only be qualitatively described by observing curve. Also, these measurement methods cannot detect high-speed pneumatic solenoid valves whose response time at the MS level.
In this paper, the aerodynamic force of the valve core is calculated to obtain the aerodynamic parameters by the CFD method, and the aerodynamic model is established in Simulink. The simulation calculation is completed by analyzing the aerodynamic model, the circuit model, the magnetic circuit model and the mechanical motion model. In experiment, this paper innovatively proposes a method of detecting the response characteristics of solenoid valves by the outlet pressure and the current synchronous detection, which is more direct and accurate. A set of electromagnetic valve dynamic characteristic test system is built. The test system can measure the leakage, response time, action frequency, start-up pressure and other parameters of solenoid valve at the MS level conveniently, which ensures the real-time performance. The correctness of the numerical calculation model is verified by comparing the numerical calculation with the experimental results.
Operation principle of solenoid valve and modeling scheme
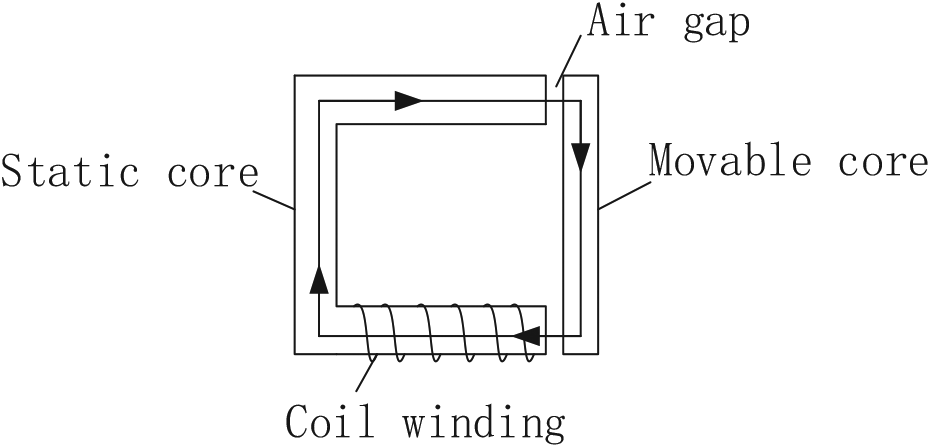
As shown in Figure 1, it is a two-position three-way direct-acting solenoid valve, consisting of the valve body, coil, static core, movable core, spring and so on. Its operating principle is described as follows: When the valve is electrified, the coil produces electromagnetic force, the static core sucks up the movable core (valve core) and the pressure port is connected with the working mouth after the valve opens. On the contrary, the movable core closes the valve to exhaust under the action of the spring when the power is cut off.
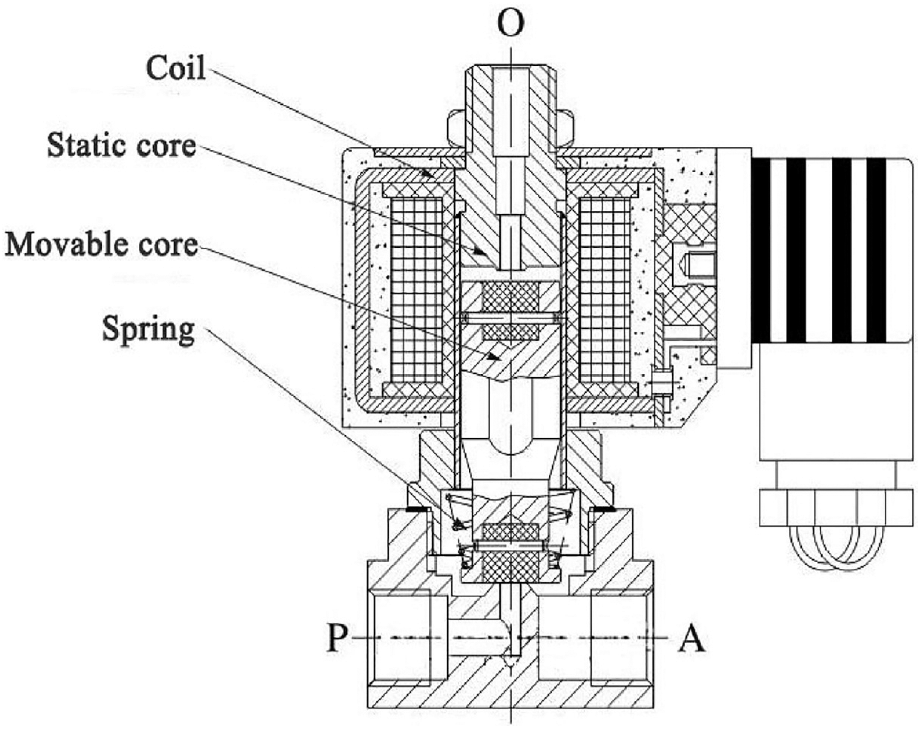
Structure of a two-position three-way direct-acting solenoid valve.
According to the operation principle of the solenoid valve, the whole model can be divided into four parts: the aerodynamic model, the equivalent circuit model, the equivalent magnetic circuit model and the mechanical motion model. As shown in Figure 2, each model is connected by variables such as current and force, where
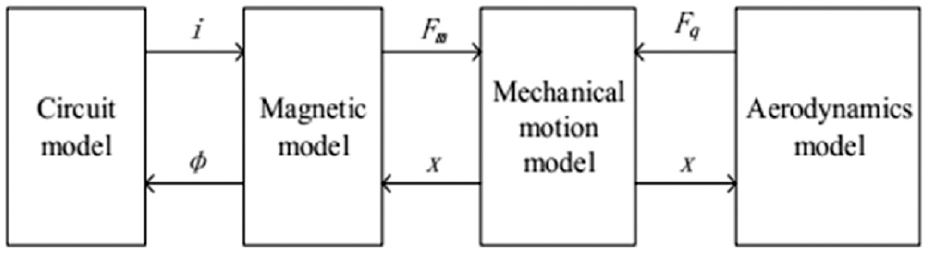
Relation diagram of numerical calculation model of a solenoid valve.
Mathematical modeling
Aerodynamic model
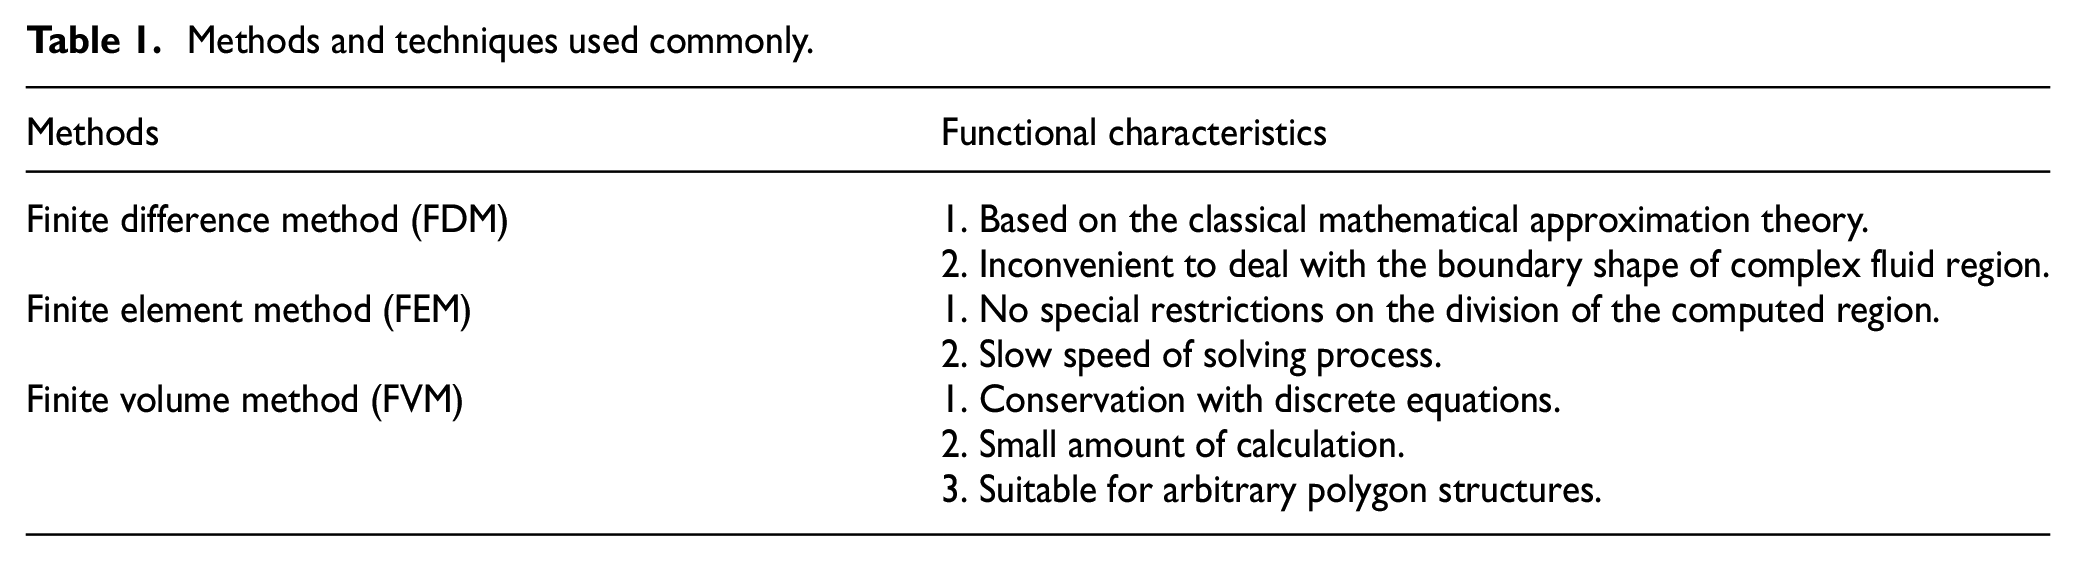
The CFD is based on the combination of fluid dynamics and numerical calculation. The numerical calculation and image display are carried out by a computer to describe the numerical solution of the flow field quantitatively in time and space. The methods and techniques used commonly19,20 are shown in Table 1.
Methods and techniques used commonly.
According to the structural characteristics and operation principle, the solenoid valve has a circumferential symmetry and can be simplified to a two-dimensional (2D) model,
21
which can effectively reduce the amount of computation. In Figure 3, the 2D flow field calculation model, model composition and boundary conditions of the solenoid valve are established in FLUENT by the finite volume method (FVM) owing to its flexibility and superiority. The valve calculation model is based on the basic control equations of fluid dynamics and the standard
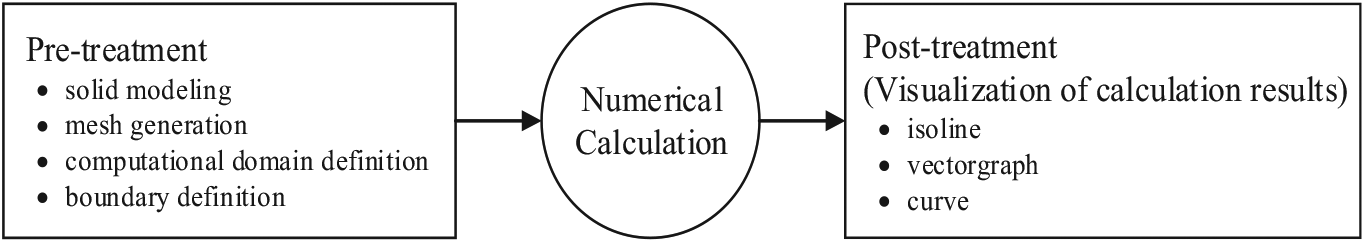
FLUENT calculation process of the solenoid valves.
Equation of turbulent kinetic energy
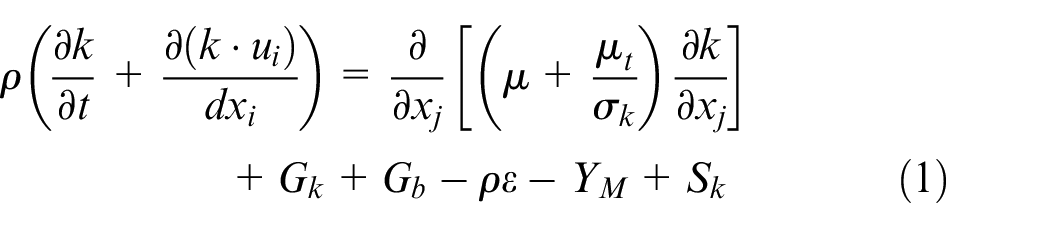
Equation of turbulent dissipation rate
where
FLUENT calculation process of the solenoid valves is shown in Figure 3. The whole process consists of pre-treatment, numerical calculation and post-treatment. Pre-treatment is the process of establishing a simulation model, and hybrid mesh generation is adopted in the simulation model. Post-treatment is a visualization process of calculation results.
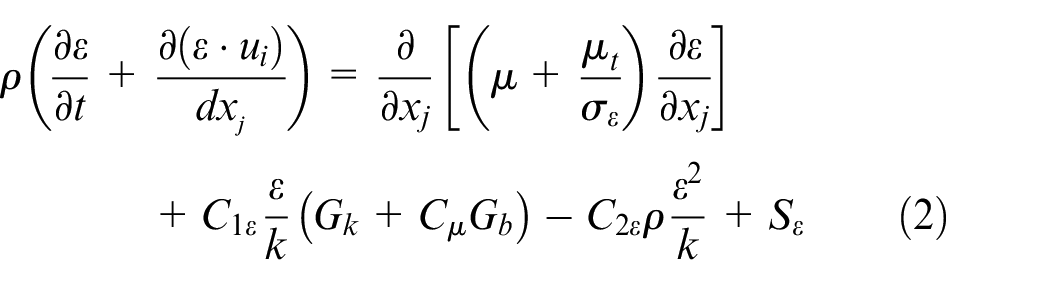
As shown in Figure 4, the gray area represents the computational domain, the green arrow identifies the direction of the air flow, the entrance of the calculation domain is the boundary condition of pressure inlet, the exit is the boundary condition of pressure outlet and the rest are the adiabatic wall. In the actual test, the solenoid valve working port is similar to the blocked state because of being directly connected to the pressure sensor. In order to facilitate comparison with test results, the boundary condition here is the adiabatic wall. The dynamic grid technology in FLUENT is used to move the valve core, and the switch of the valve port is realized through the event function in this paper. Thus, the whole process of the switch action of the solenoid valve is simulated.
Two-dimensional (2D) flow field analysis model.
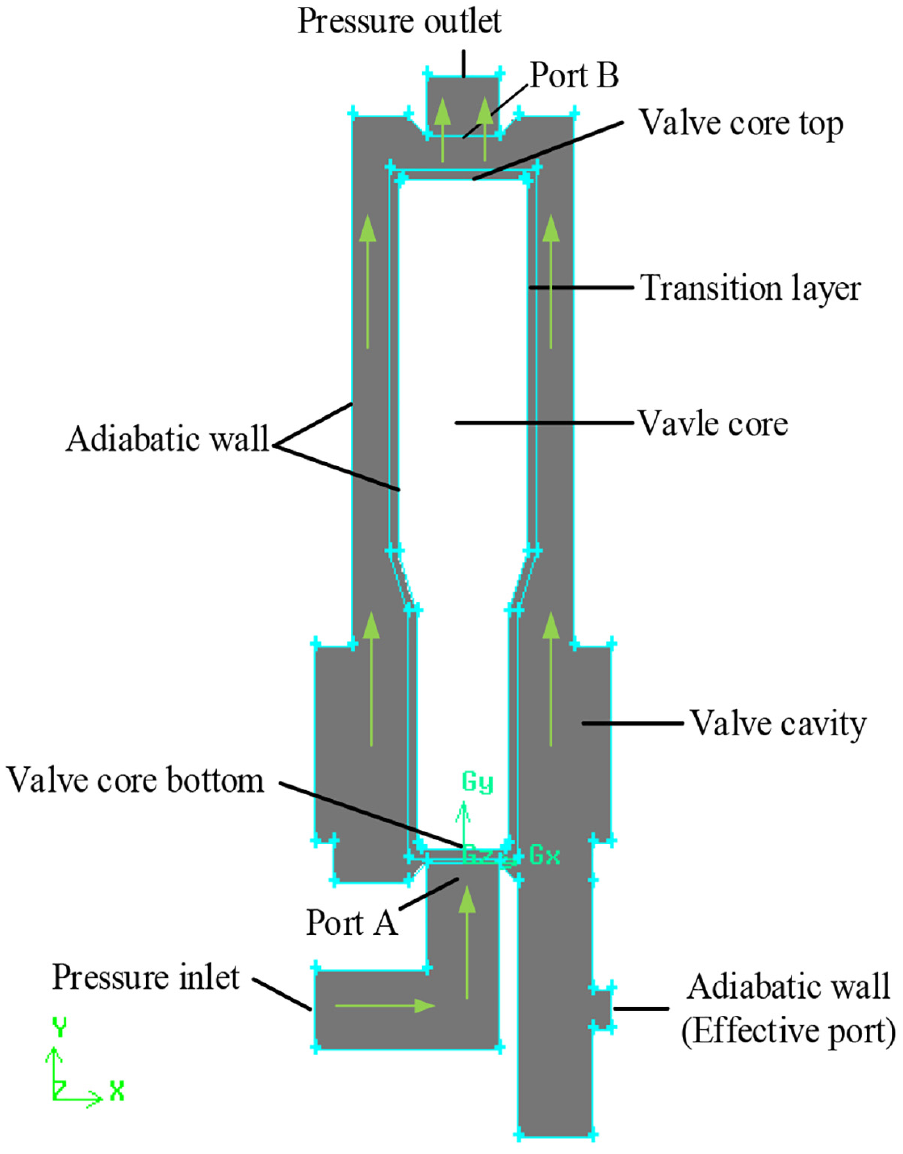
Due to the obvious pressure difference between the bottom and top of the valve core, the average pressure of the valve core bottom is large. The aerodynamic force acting on the valve core is generated by the pressure difference, which drives or blocks the movement of the valve core. According to the calculated total pressure of the bottom and top of the valve core, the aerodynamic force of the valve core can be calculated by Formula (3)

where
The change of average pressure with valve core displacement: (a) on the bottom of the valve core and (b) on the top of the valve core.
Retain the outlet relative pressure at 0, change the inlet pressure and simulate separately. The relationship of aerodynamic and valve core displacement is shown in Figure 6.
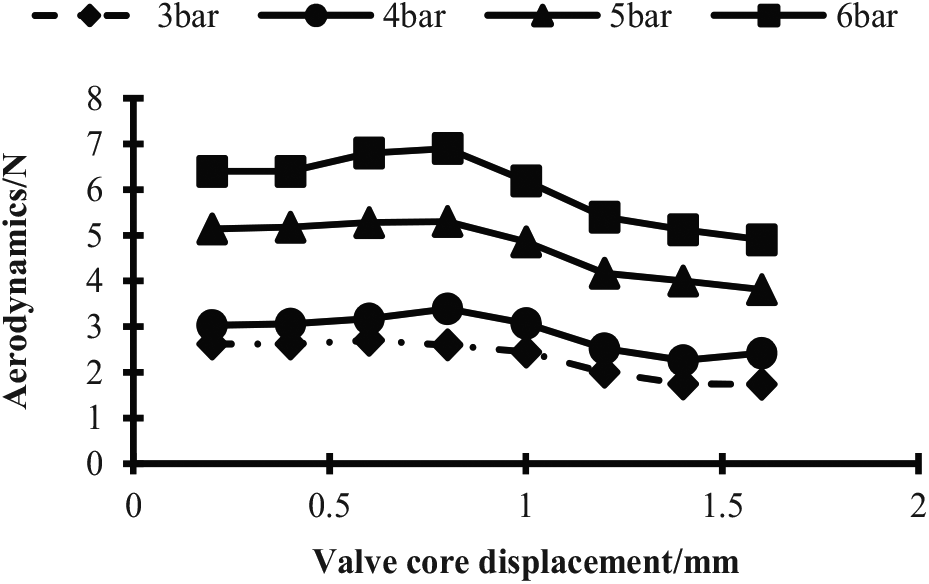
Change of aerodynamic force with valve core displacement.
In order to facilitate the subsequent establishment of the aerodynamic model, the inlet pressure and the displacement of the valve core are used as input, and the aerodynamic force is taken as output to fit equation by the method of regression analysis. The maximum error is 0.5 N, and the aerodynamic equation obtained is as follows

where
Circuit model
From the perspective of the circuit, when the solenoid valve is energized, the electromagnetic coil and the power supply form a loop. The equivalent circuit is shown in Figure 7. The circuit equation can be obtained from Kirchhoff’s voltage law
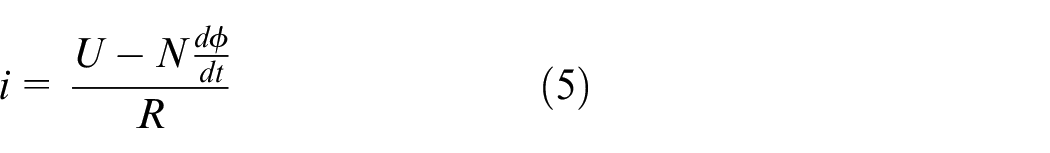
where
Equivalent circuit.
Magnetic circuit model
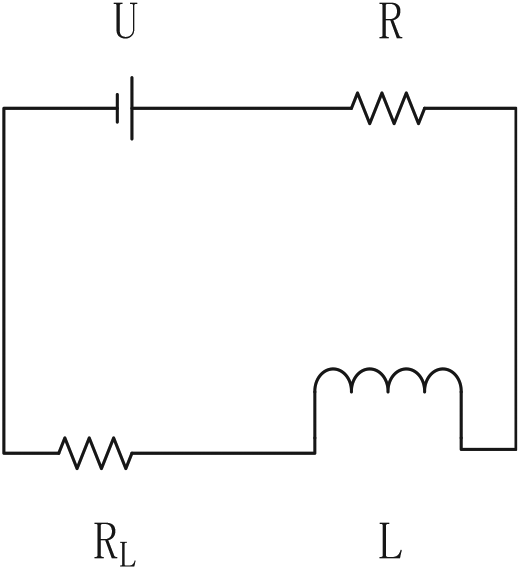
The magnetic circuit simplification of the solenoid valve is shown in Figure 8. From the perspective of the magnetic circuit, the magnetic circuit of the solenoid valve consists of three parts: 23 the static core, the air gap and the movable core. The simplified model of the equivalent magnetic circuit is shown in Figure 9. Assuming that the magnetic circuit is not saturated, the effects of magnetic resistance and magnetic field edge effect, the induced eddy current and the magnetic flux leakage in the core are not taken into account.
Magnetic circuit of solenoid valve.

Equivalent magnetic circuit.
According to Ampere’s law, the magnetic circuit equation can be obtained
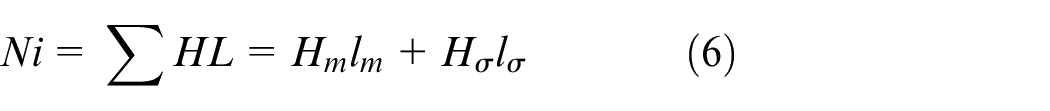
Formulas (7) and (8) are the formulas for magnetic field and magnetic flux, respectively


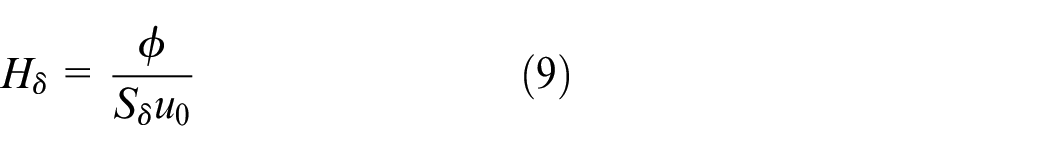
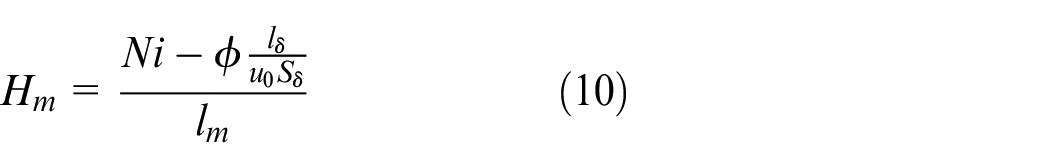
Calculating the magnetic field intensity of the air gap by Formulas (7) and (8)
Magnetic field strength of iron core
Electromagnetic suction is calculated by Maxwell electromagnetic suction formula
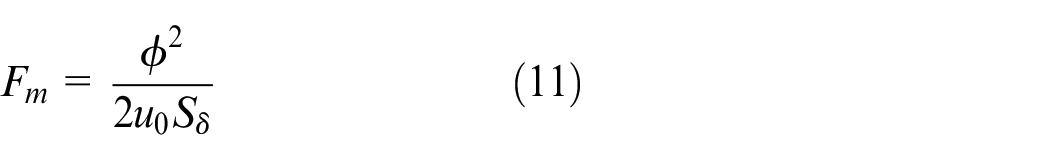
where
Mechanical motion model
When the solenoid valve is energized, the electromagnetic coil generates electromagnetic suction, and the valve core moves under the action of spring force, electromagnetic suction, gravity, friction and aerodynamic force.
Obtained from the Newton law
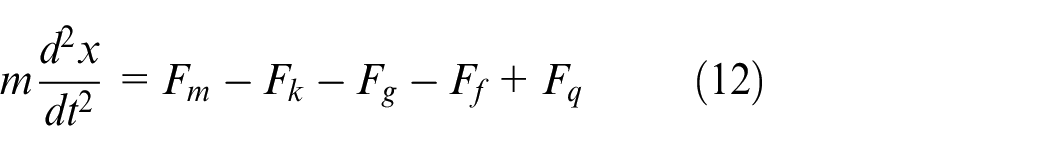
where
Whole model
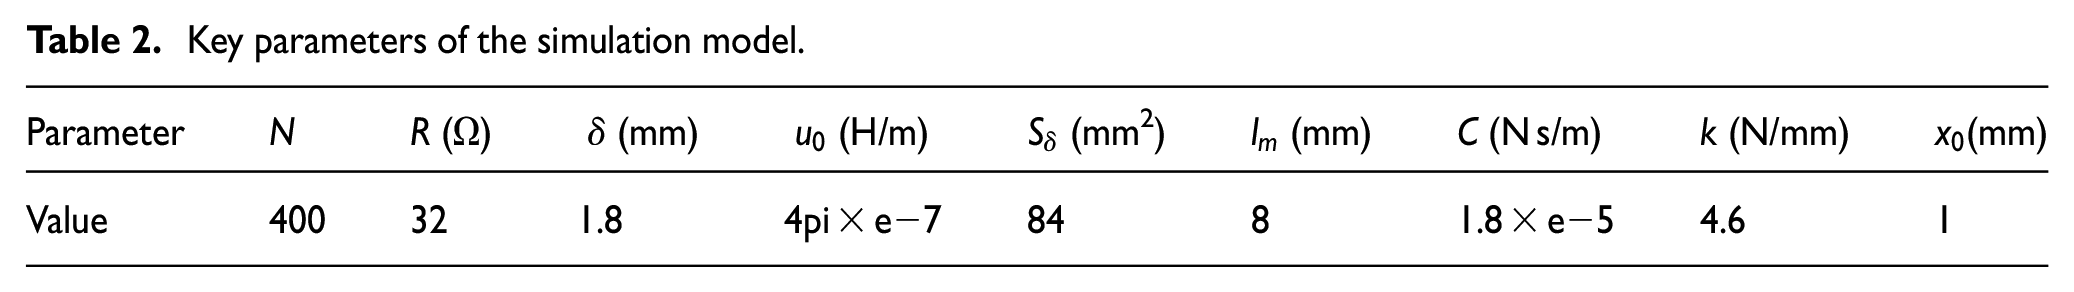
The key parameters of the simulation model are shown in Table 2.
Key parameters of the simulation model.
As shown in Figure 10, the whole numerical model for solenoid valve response characteristics is established from the aerodynamic model, circuit model, magnetic circuit model and mechanical motion model.
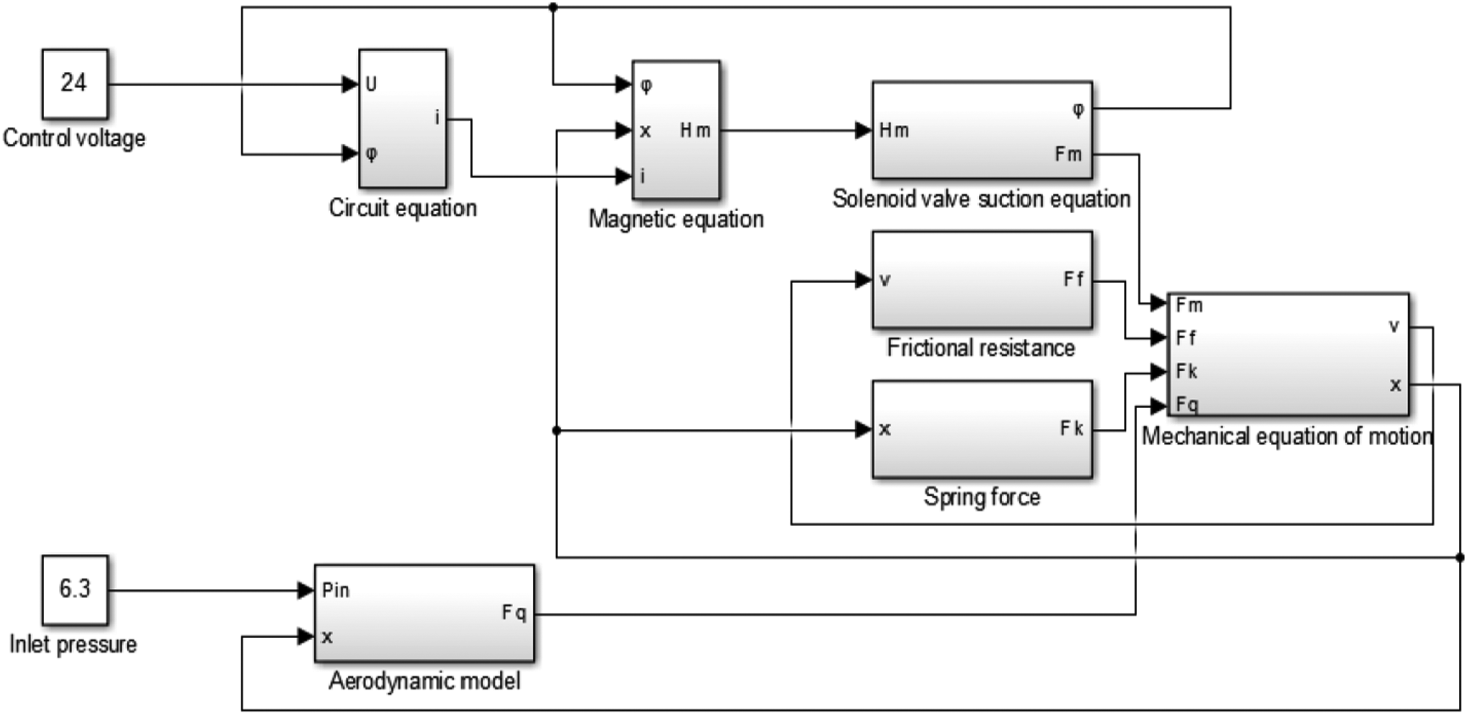
Numerical calculation model of response characteristics of solenoid valve.
Analysis of numerical results
The dynamic characteristics of the solenoid valve are influenced by many factors. The influences of inlet pressure, coil turns and driving voltage on the dynamic characteristics of solenoid valves are analyzed. According to the simulation analysis, the final result is the change of the valve core displacement varying with time. Therefore, the displacement of the valve core is taken as a basis for judging the switching of the valve when it is turned on or off. The time when the displacement increases from 0 to the maximum is recorded as the open switching time, and the time from the maximum position to 0 is recorded as close switching time.
Inlet pressure
In order to analyze the influence of inlet pressure on the dynamic characteristics of the solenoid valve, the numerical calculation is carried out by changing the inlet pressure. The results are shown in Table 3. Figure 11 shows that the open switching time decreases with the increase in the inlet pressure, while the close switching time increases with the increase in the inlet pressure.
Numerical results of the switching time of solenoid valves with different inlet pressures.
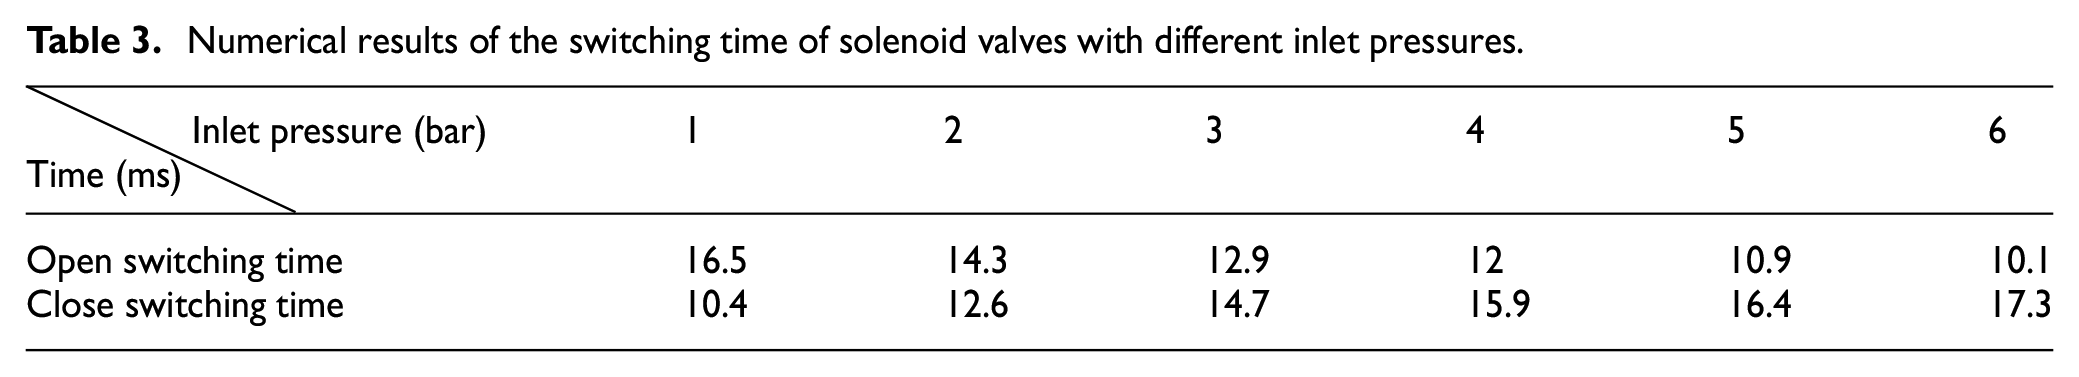
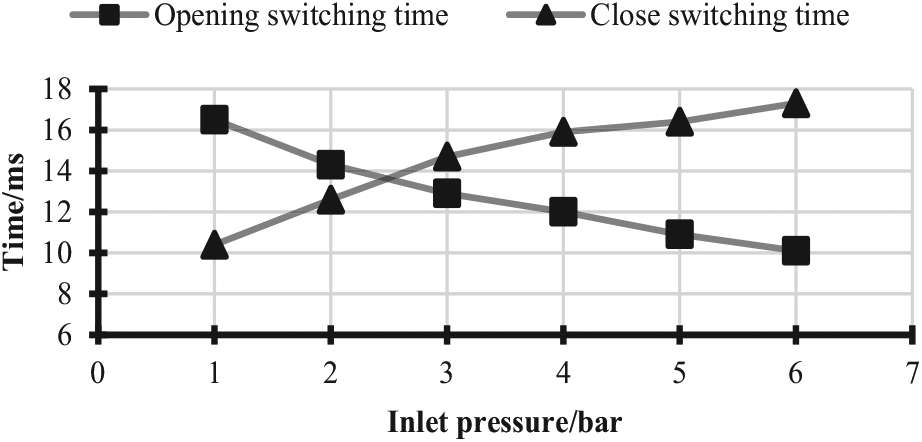
Numerical results of the switching time of solenoid valves with different inlet pressures.
Coil turns
According to the magnetic circuit model, coil turns can directly affect the electromagnetic force, which is an important factor to affect the response time of the solenoid valve. Keeping other parameters unchanged, the simulation results are calculated with the turns of 50, 100, 150, 200, 250 and 300, respectively. The results are shown in Table 4. Figure 12 shows that the open and close switching time of the solenoid valve increases with the increase in the coil turns. As a result, reducing the coil turns properly can speed up the response speed of the solenoid valve, but the number of turns should not be too small, which may cause the solenoid valve not to work.
Numerical results of the switching time of solenoid valves with different turns.
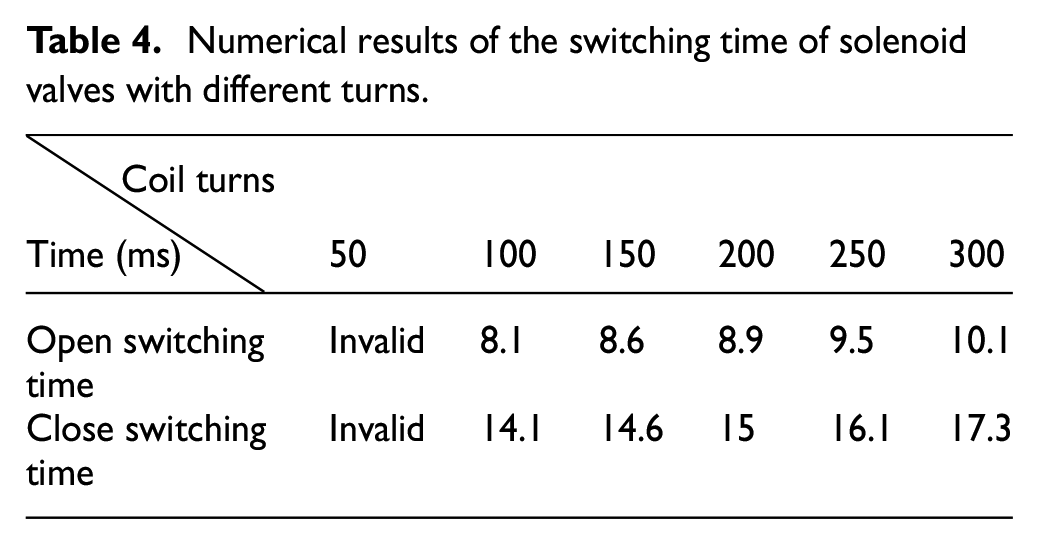
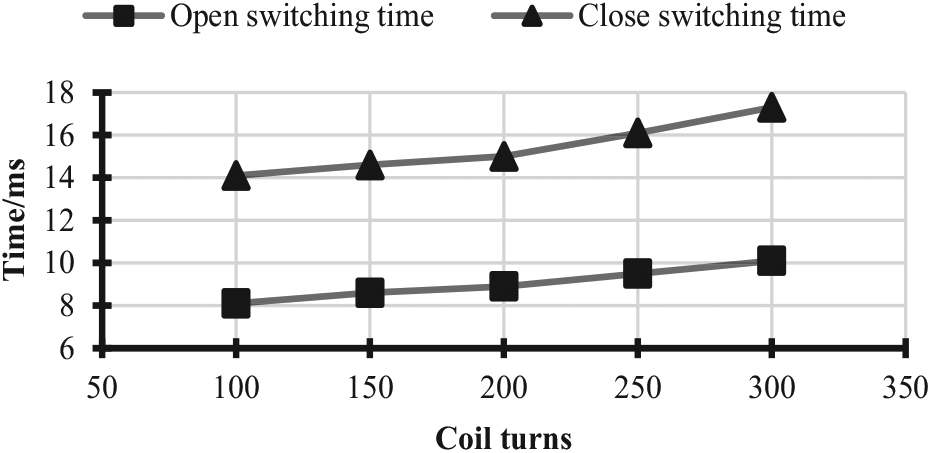
Numerical results of the switching time of solenoid valves with different turns.
Driving voltage
Retain other parameters unchanged and change the driving voltage of the solenoid valve for simulation calculation. The results are shown in Table 5. Figure 13 shows that the open switching time of solenoid valve decreases with the increase in the driving voltage, whereas the close switching time increases. Increasing the driving voltage can accelerate the opening speed of the solenoid valve, but the current of coil, the power consumption and the closing response time will also increase. Therefore, when designing the solenoid valves, the driving voltage should be selected under the consideration of various factors, such as power consumption, current and response speed.
Numerical results of the switching time of solenoid valves with different driving voltages.
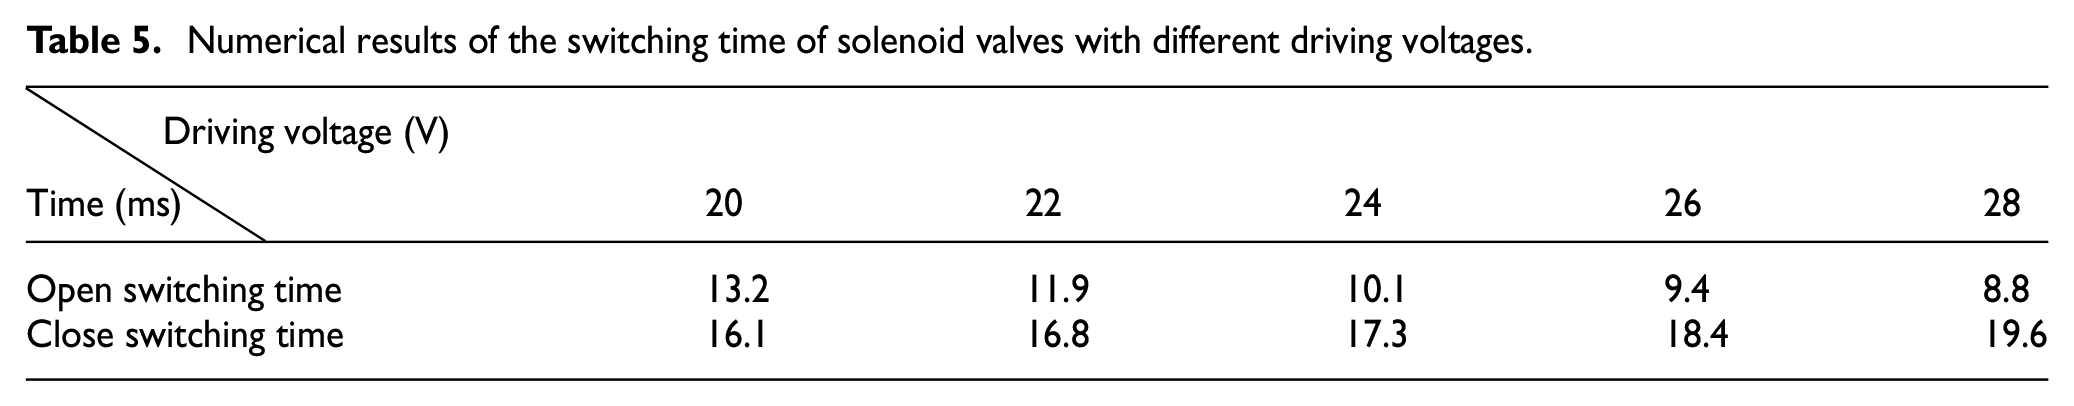
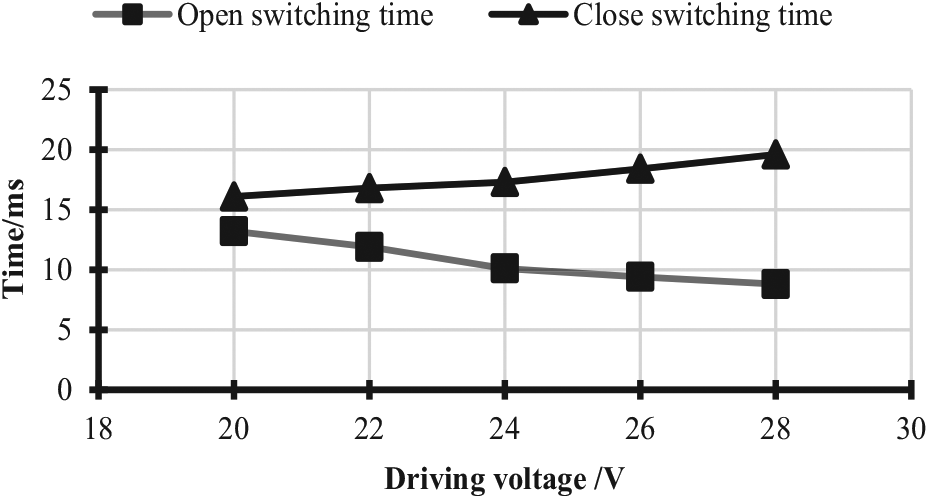
Numerical results of the switching time of solenoid valves with different driving voltages.
Experimental research
Parameter test system of electromagnetic response characteristics
For the sake of building the test system of the response characteristic parameters of the solenoid valve, the physical relationship of the system is given in Figure 14. The blue arrow is connected to each part of the gas path, and the direction of the arrow indicates the direction of gas flow during the test. The compressed gas is generated by the air compressor, followed from the filter, the proportional valve, the switch valve to the inlet pressure sensor or the tested valve and the outlet pressure sensor. The red arrow indicates the control signal channel of the system. The host computer sends control commands to the slave computer through the serial port. After acquiring and decoding, the slave computer executes the command and sends out the control signals. The driving module controls the action of the proportional valve, switch valve and tested valve. The green arrow represents the data channel used for system acquisition. The data acquisition module collects the output analog signals of each sensor, quantifies them into the digital signals and sends the digital signals to the slave computer. Finally, the slave computer sends the digital signals into the host computer by the serial port. Figure 15 shows the actual testing system.
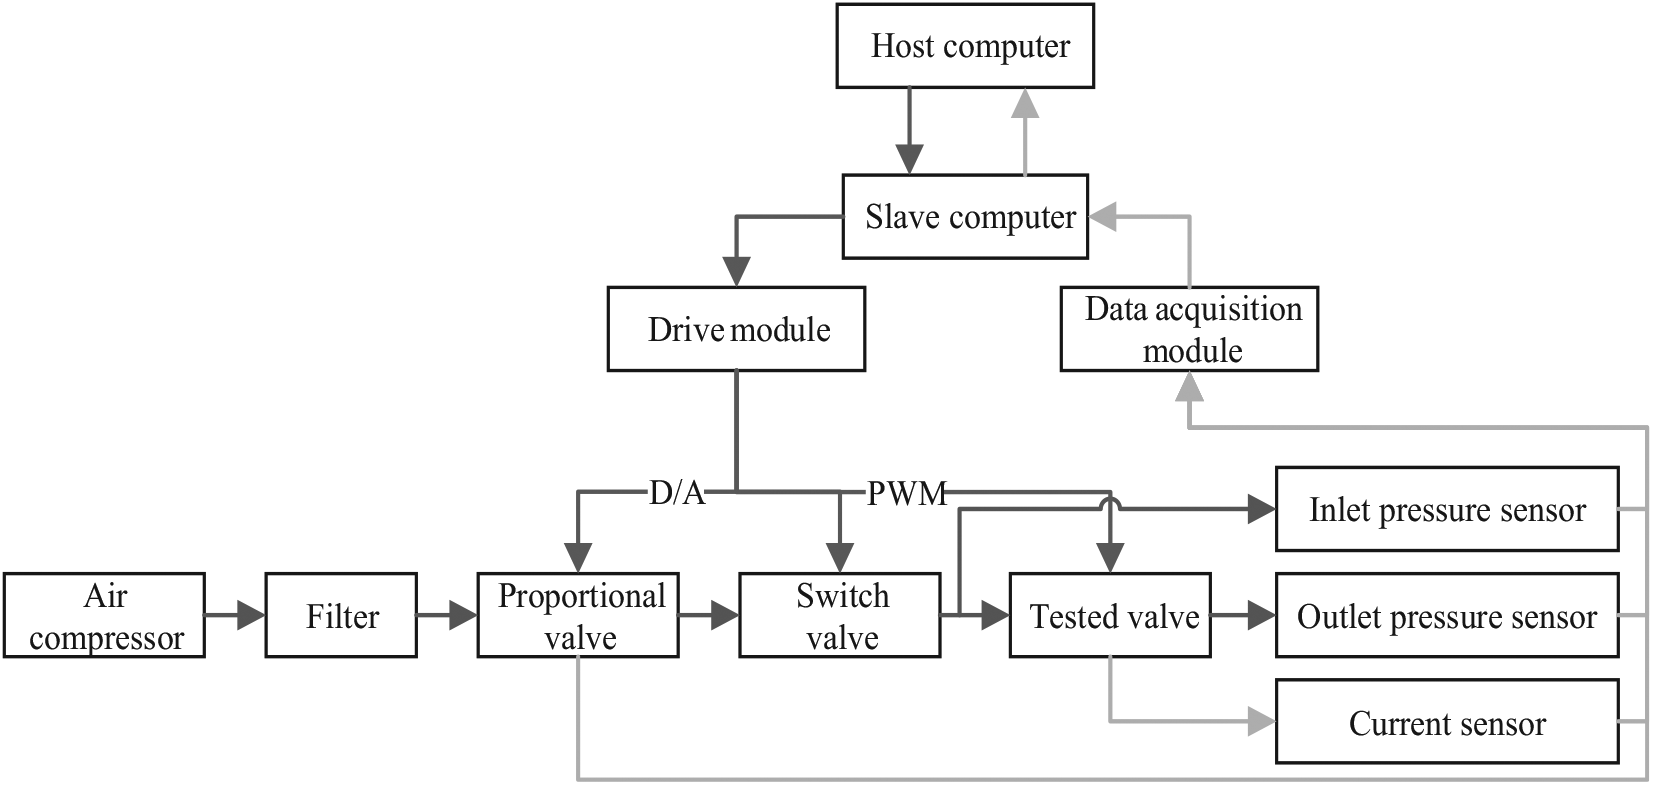
Structure of the testing system.
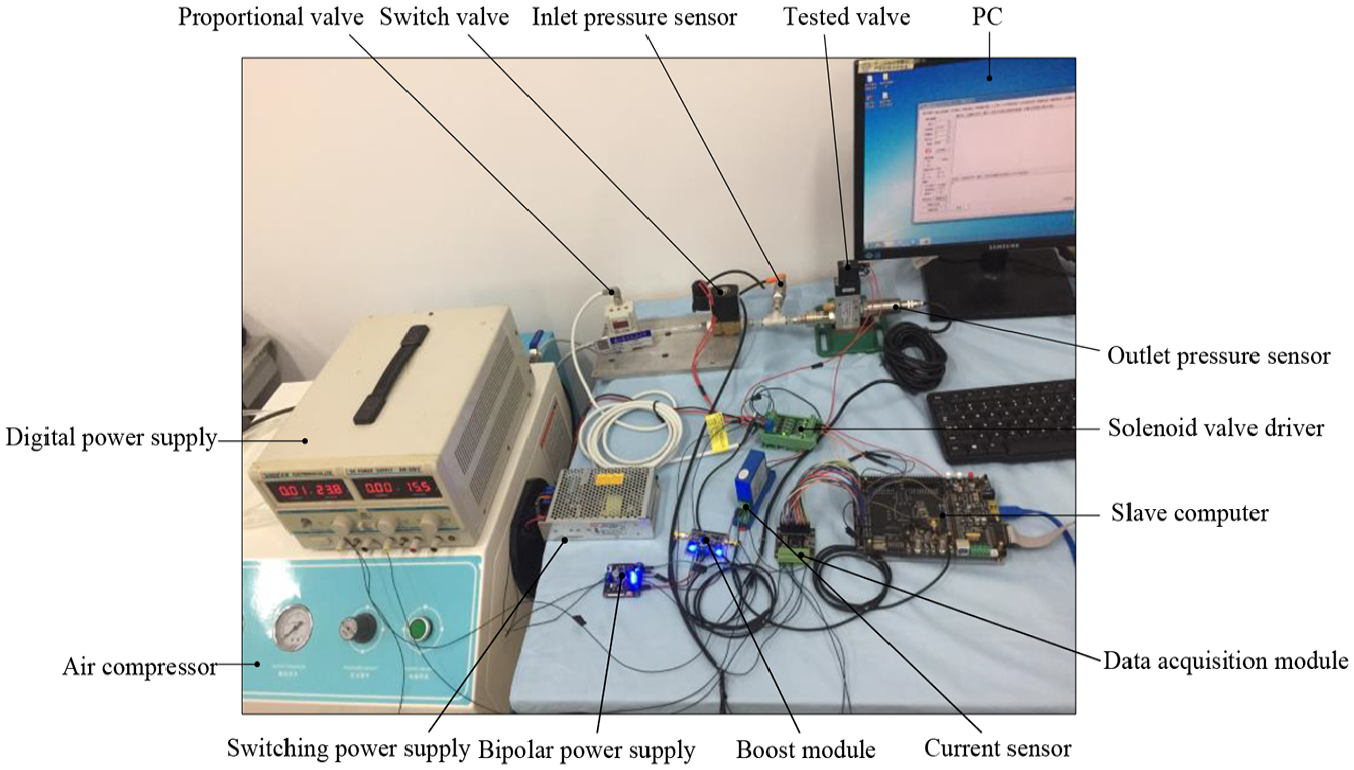
Actual testing system.
Response characteristic parameter test
Response time test
In actual test, the displacement is difficult to obtain because the valve core is located in the valve body. The response time is obtained by synchronous detection of the outlet pressure of the solenoid valve and the current of the coil. Referring to the related test standards, the delay time from the beginning of the electrical signal to the time when the outlet pressure rises to the 10% and 90% of the inlet pressure is recorded as the open response time and the open switching time, respectively. Simultaneously, it is the delay time from the end of the electrical signal to the time when the outlet pressure drops to the 90% and 10% of the inlet pressure that is recorded as the close response time and the close switching time, respectively.
Figure 16 shows the response time test of the two-position three-way direct-acting solenoid valve Z3CD. The black dashed line is the curve of the valve outlet pressure varying with time, and the red solid line is the curve of the valve coil current varying with time.
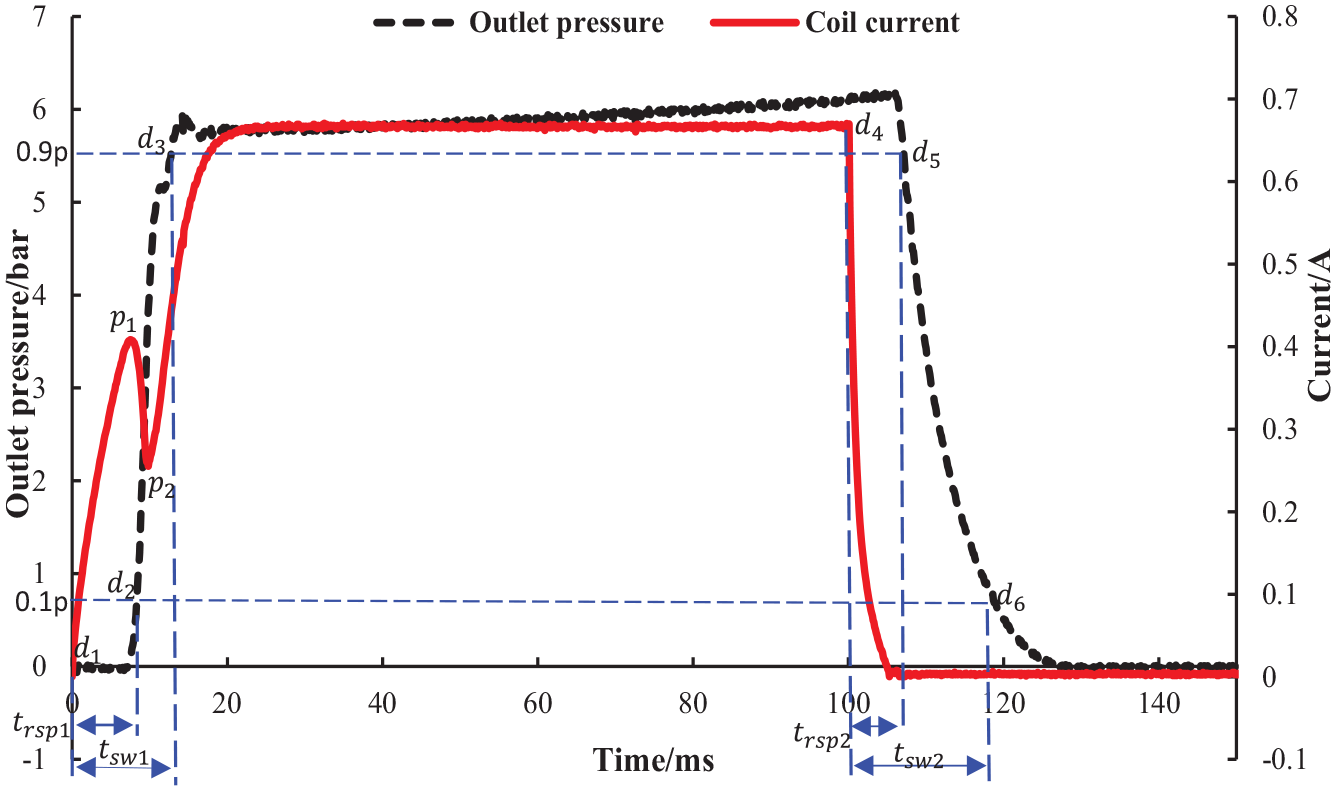
Response time test.
It is known from the diagram that the coil current increases rapidly after the coil is electrified, and the first turning point p1 appears at about 7 ms. At this time, it can be seen from the pressure curve that the outlet pressure begins to increase from 0, indicating that when the valve core moves under the action of electromagnetic force, the electric energy has been transformed into mechanical energy. At about 10 ms, the current curve has the second turning point p2. The current begins to increase, indicating that the valve core moves to the limit position, the valve is completely open and the electric energy is no longer converted. It shows that the open response time of the valve is 8.19 ms, the open switching time is 12 ms, the close response time is 6.88 ms and the close switching time is 18.19 ms by the outlet pressure and current curve.
Maximum action frequency test
In addition to the response time parameters of the solenoid valve during a single switch, the maximum action frequency of the solenoid valve is also an important response characteristic parameter of the solenoid valve. The maximum action frequency is the maximum switching frequency of the solenoid valve without any abnormal response conditions. If the maximum output pressure of the exit is lower than 90% of the inlet pressure, or the minimum output pressure is higher than 10% of the inlet pressure, it is judged that the response is abnormal at this time, and the solenoid valve cannot work normally.
Figure 17(a) shows the outlet pressure curve of the solenoid valve when the action frequency is 10 Hz and indicates that the response is normal. When the action frequency is 45 Hz, the minimum outlet pressure of each switch still meets the requirement of 10% below the inlet pressure, but the maximum outlet pressure is less than 90% of the inlet pressure. The abnormal response of the outlet pressure curve of the solenoid valve is shown in Figure 17(b). Therefore, the maximum action frequency of the solenoid valve can be set to 44 Hz.
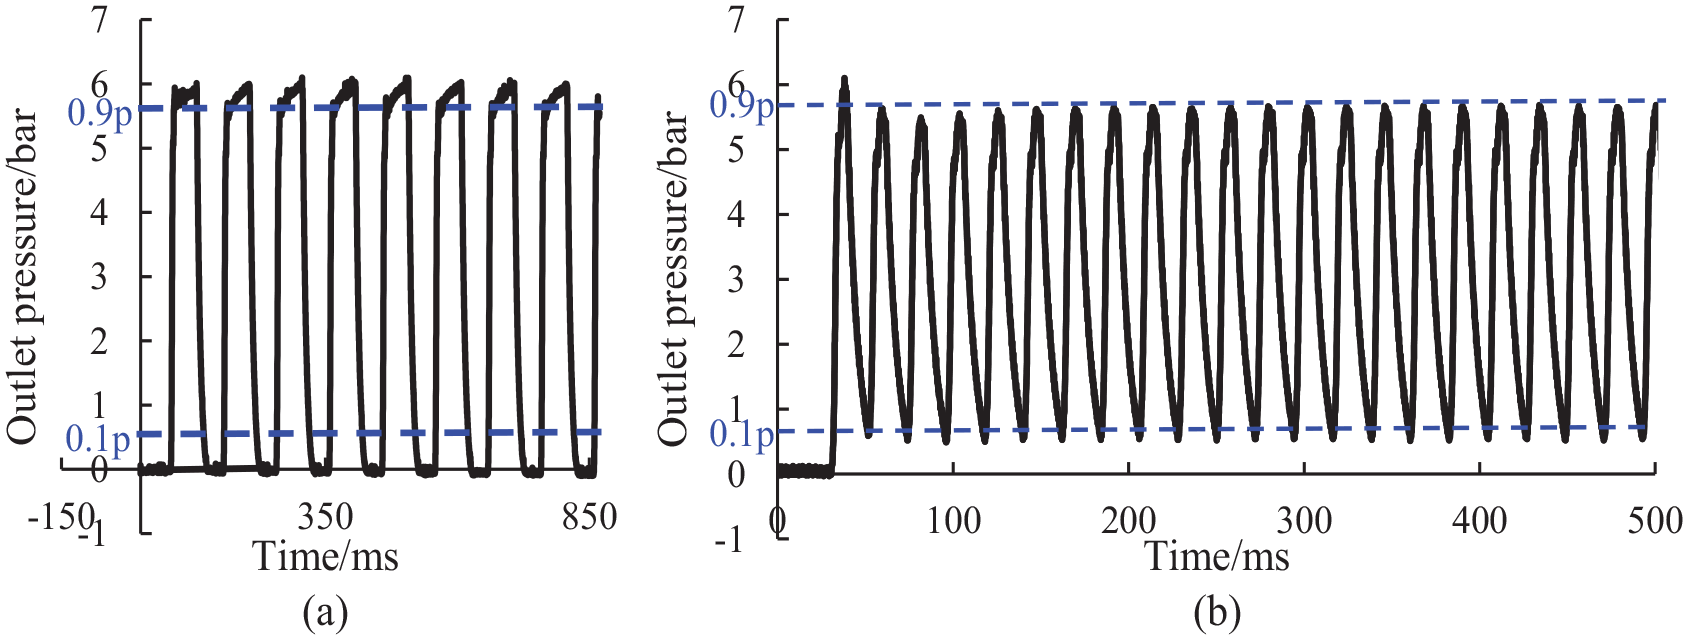
Response characteristic curve with different frequencies: (a) normal response with 10 Hz and (b) abnormal response with 45 Hz.
Analysis of test results
Influence of action frequency on the response time
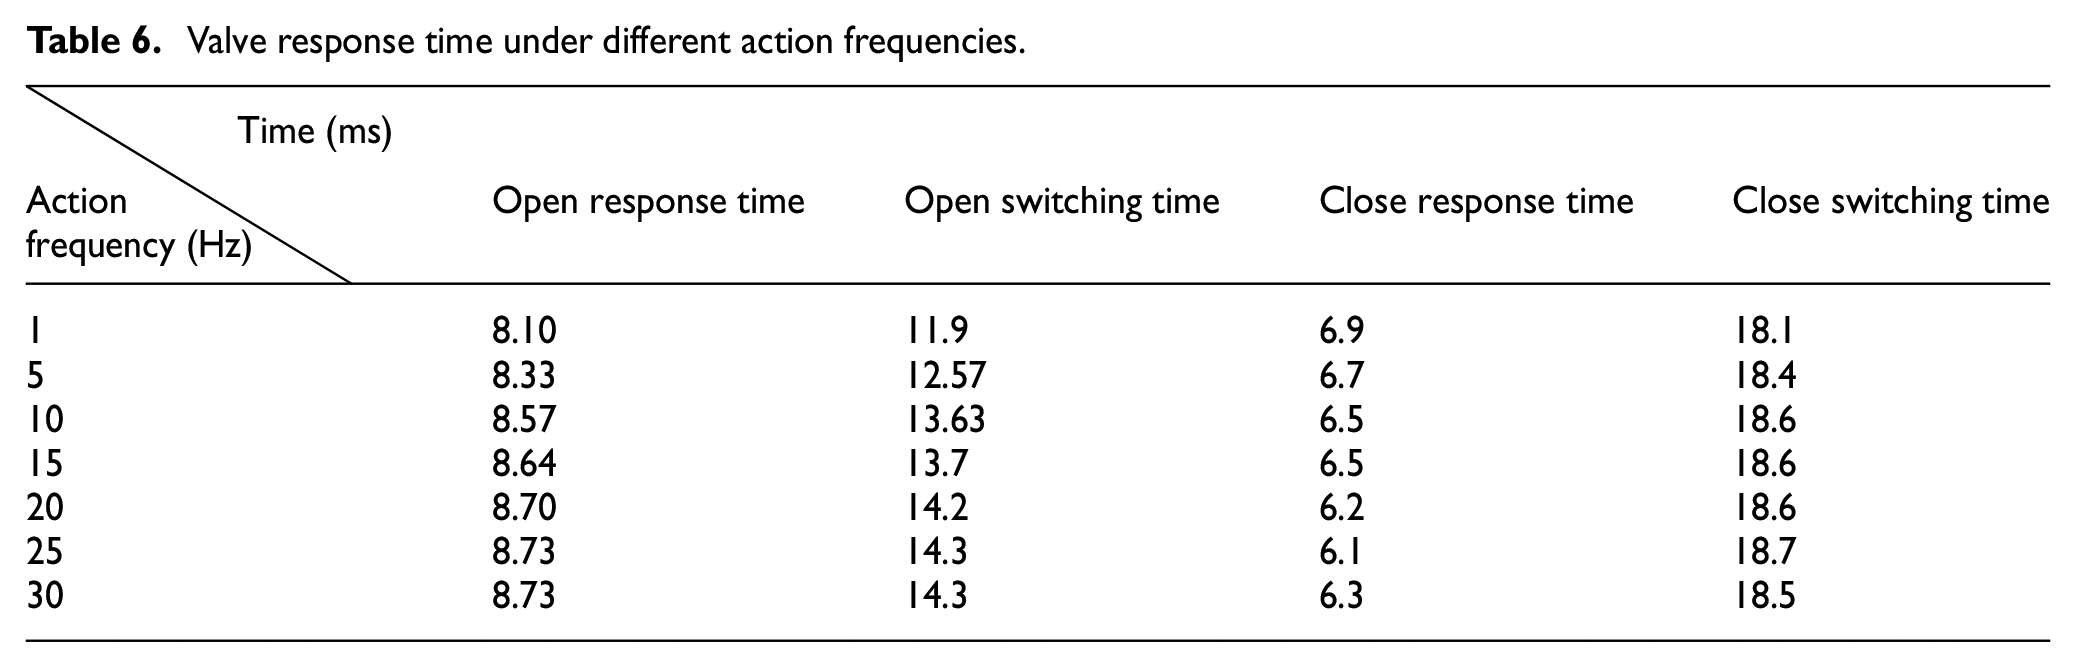
In order to analyze the effect of action frequency on the response time of the solenoid valve, the experiment is carried out as follows. By maintaining the test pressure of 630 kPa and driving the solenoid valve with the action frequency of 1, 5, 10, 15, 20, 25 and 30 Hz, the response time is tested. The two adjacent intervals are 1 min above, and the test results are shown in Table 6. The diagram drawn from the data in Table 6 shows that the close response time and the close switching time curve are basically maintained (Figure 18).
Valve response time under different action frequencies.
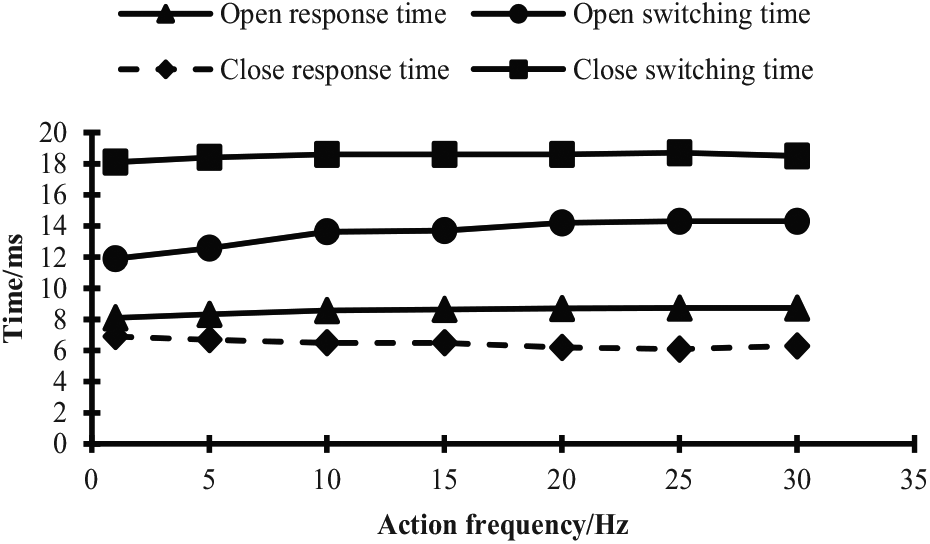
Valve response time under different action frequencies.
It is concluded that the close response and switching time are basically unaffected by the action frequency. The open response and switching time of the solenoid valve increase and then basically remain unchanged with the increase in the action frequency. The range of the opening response time is smaller, changing from 8.1 to 8.73 ms. The open switching time which increases relatively largely changes 2.3 ms, from 12 to 14.3 ms. In actual test, it can be tested on basis of the actual working frequency to reduce errors when the requirement for the response time accuracy of the solenoid valve is high. In general, a single action test can meet the requirements.
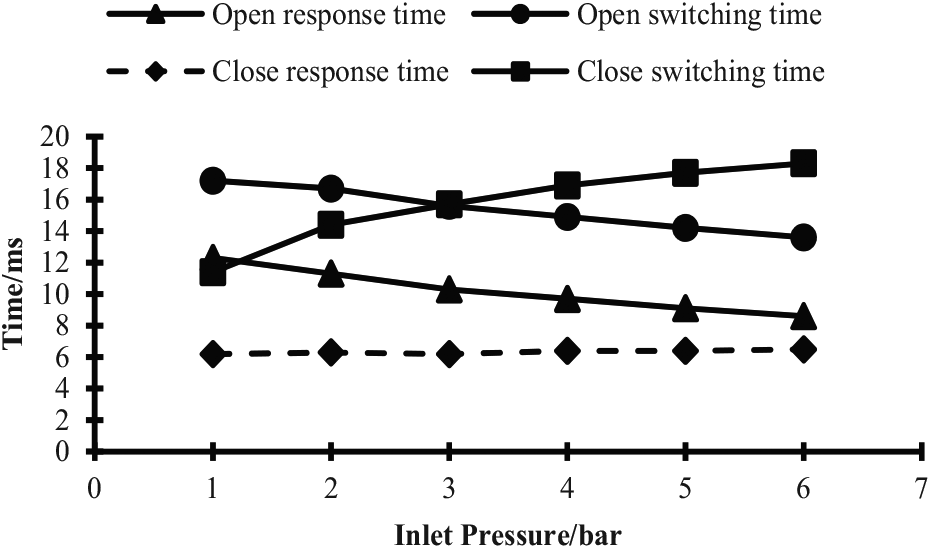
Influence of inlet pressure on the response time
Keep other test conditions unchanged and change the inlet pressure to test. The results are shown in Table 7. From the diagram drawn from the data in Table 7, the open response and switching time of the solenoid valve are reduced with the increase in the inlet pressure, while the close response and switching time increase with the increase in the inlet pressure, on the contrary.
Valve response time of different inlet pressures.
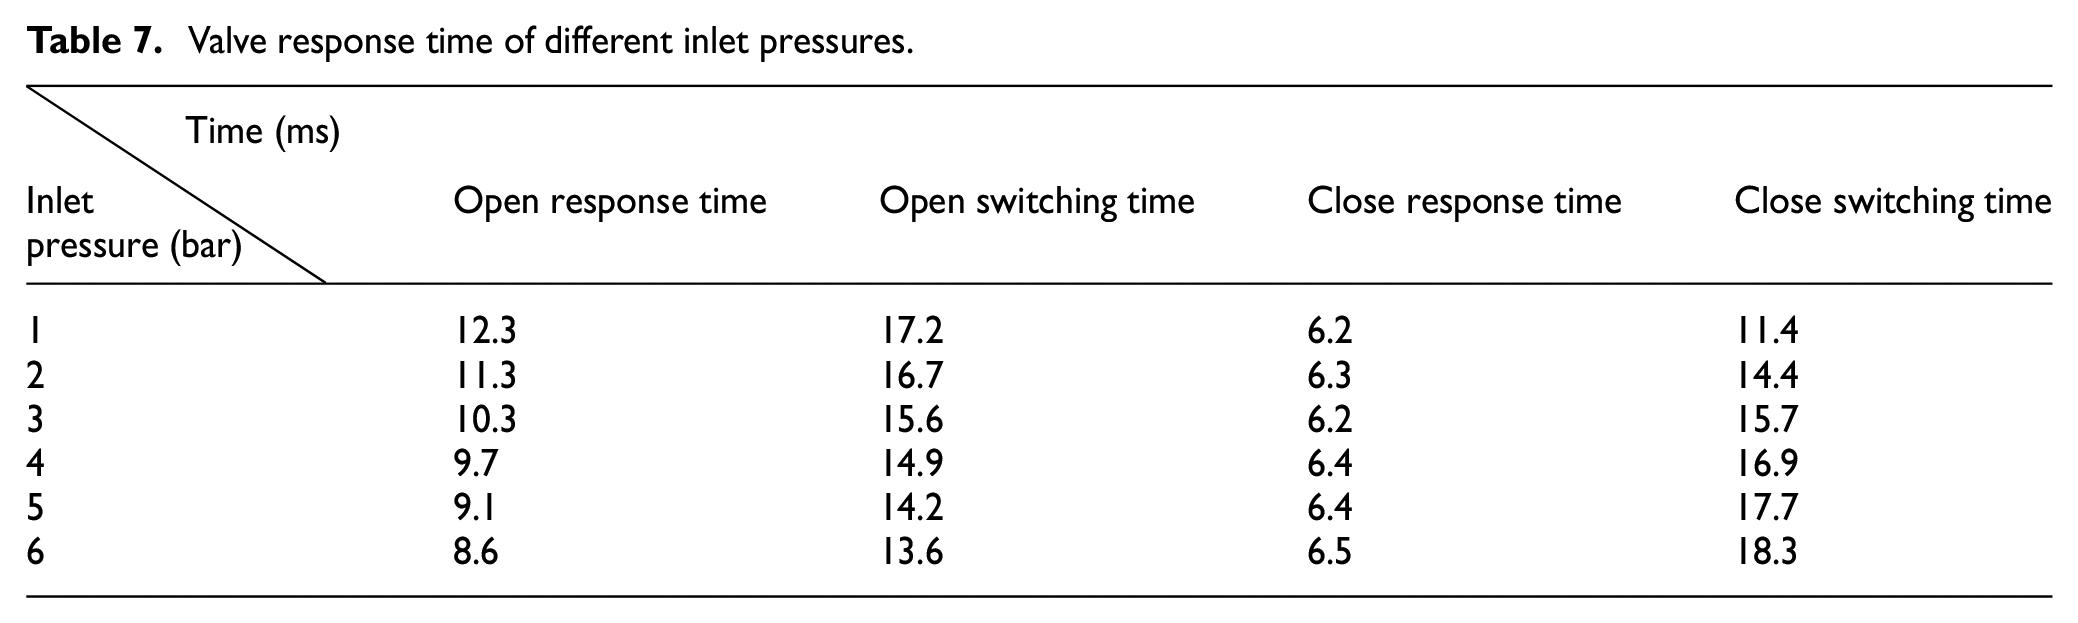
By comparing the data trend of switching time in Figures 11 and 19, it can be concluded that the experimental results are in agreement with the numerical results. According to the results of the aerodynamic calculation in numerical calculation, the aerodynamic force of the valve core increases with the increase in the inlet pressure. Therefore, when the inlet pressure is increased, the positive force of the valve core increases; the open response time and switching time decrease. When the solenoid valve is closed, the movement of the valve core is blocked by aerodynamic force and the larger the aerodynamic force is, the longer the close time is.
Valve response time of different inlet pressures.
Conclusion
Most of the existing research studies on pneumatic solenoid valves are based on the simulation of their flow characteristics. The numerical calculation and experimental study of pneumatic solenoid valves are carried out innovatively. The aerodynamic equation is obtained by the regression analysis of simulation data with the method of CFD. Mathematical model incorporates the equation into the simulation. The response characteristic test system of pneumatic solenoid valves is set up, and the response characteristic parameters such as the response time and maximum action frequency of the solenoid valve are tested. By comparing the data trend of switching time in Figures 11 and 19, the experimental results show the same trend as the numerical results, which proves the efficiency of the proposed numerical simulation.
Through the analysis of numerical results and experimental results, the following conclusions are obtained:
The response characteristics are basically irrelevant to the action frequency when the working frequency is less than maximum action frequency.
The open switching time of the solenoid valve decreases with the increase in the inlet pressure and the driving voltage and increases with the increase in the coil turns.
The close switching time increases with the increase in the inlet pressure, the driving voltage and the coil turns.
The simulation results are in good agreement with the experimental results, and this verifies the correctness of the numerical model and the test system. However, there is some room for further improvement:
The numerical simulation is mainly aimed at the two-position three-way solenoid valves in this paper; the other types can be simulated to analyze the difference between them in the follow-up study.
The test system can be encapsulated into a measuring instrument to test response characteristics of pneumatic solenoid valves conveniently.
Footnotes
Declaration of conflicting interests
The author(s) declared no potential conflicts of interest with respect to the research, authorship and/or publication of this article.
Funding
The author(s) disclosed receipt of the following financial support for the research, authorship and/or publication of this article: This work was founded by the National Natural Science Foundation of China (no. 51575277).