
Abstract
Power output is one of the main working parameters of a diesel engine, which not only reflects its dynamic performance but also acts as an important indicator of its operating state. At present, diesel engine power monitoring mainly depends on dynamometers, but most engines cannot be so equipped during operation. In addition, other techniques, such as in-cylinder pressure measurements used to gauge power output are invasive and have higher requirements for sealing and reliability. Therefore, it is important to study other means for achieving real-time monitoring of engine power that do not damage the engine. In this paper, we use the vibration acceleration of the combustion phase in the angle domain as the original signal to identify the output power. However, the signal contains many interference signals and must be pre-processed by purification techniques such as filtering, de-noising and empirical mode decomposition. Finally, the automatic identification of the power of a diesel engine is realized by means of inductive monitoring system algorithms. The test results show that the recognition accuracy under the five different working loads ranges between 83% and 95%, which demonstrates the effectiveness of the proposed method.
Introduction
The diesel engine is widely used in ship propulsion and power systems, playing an important role in these fields. In addition, condition assessment and fault diagnosis (CAFD) of diesel engines has been a research topic of interest for many years. However, power output, one of the most important indicators for CAFD, is still unable to be measured easily in the practical applications of diesel engines. For one reason, output power is usually measured through a dynamometer, which is large and expensive. There is no space to equip a diesel engine in such a manner in an actual working environment because the engine needs to connect to and drive a load directly. In-cylinder pressure measurement, which can be used for the indirect gauging of output power, is a destructive method with high cost and low durability. It is therefore of interest to study other methods for diesel engine power measurement that are easy to use and do not cause damage.
Douglas et al. 1 proposed a method using acoustic emission (AE) and instantaneous crankshaft angular velocity for the on-line power estimation of large diesel engines. They found that there is a strong relationship between AE energy and the variation of the instantaneous crankshaft angular velocity waveform over the engine cycle, which is a good indication of engine power. Lin et al. 2 found that the major order component of the instantaneous crank angular speed (IAS) spectrum can be utilized to estimate the engine loading condition. They established a mathematical relationship for the estimation of the engine power output based on the amplitude of the major order component of the measured IAS spectrum. Azzoni et al. 3 proposed a method of torque estimation based on angular velocity fluctuations over a range of operating parameters. Li et al. 4 proposed a method of estimating the indicated torque from the instantaneous crankshaft speed provides promising practical application potentials. Javadi et al. 5 proposed a novel statistical analysis system (SAS)-based algorithm for estimating the power curve of wind turbines. The algorithm, based on big data from wind farms, can be used to improve the power curve with respect to the results of forecasting wind power generation outputs and screening the turbines that might have operational defects. Ahmadi et al. 6 employed an intelligent model named least square support vector machine (LSSVM) to predict output power and shaft torque of Stirling engines. The temperature of the heat source, range of rotation speed, power and torque were utilized for building, training and testing the LSSVM. The vibration signal contains a lot of information about the running state and in-cylinder pressure of the diesel engine, and is easy to measure; thus, it is commonly used for CAFD. Ji et al.7–9 collected the vibration acceleration signal of the cylinder surface of the diesel engine. Based on this information, they proposed a new method to identify starting points of three key combustion parameters used for assessment of diesel and achieved high accuracy through the deviation correction approach. Chiatti et al. 10 used a vibration signal to evaluate the angular positions of combustion and demonstrated a high accuracy of the predictions achieved by the proposed method. Delvecchio and Farag et al.11,12 used a vibration signal for condition monitoring and vibration source identification by the fast Fourier transform (FFT) method of the signal. Carlucci et al. 13 found that the frequency component of the surface vibration of an engine could reflect the cylinder combustion process. They carried out an experiment based on a four-cylinder diesel engine and obtained a satisfactory result in the identification of the combustion process. Many researchers14–16 conducted a series of experiments, collecting vibration signals from a diesel engine test bed, and found that some frequency bands related to combustion, such as frequencies from 500 to 1100 Hz, were highly related to the cylinder pressure and vibration excited by combustion mainly occurred under 2000 Hz. In addition, in terms of diesel engine fault diagnosis, vibration analysis has been proven to be a useful tool and has been widely applied in many studies.17–21 Kimmich and Li et al.22–23 studied the fault diagnosis methods of fuel injection advance and abnormal clearance of diesel based on vibration signals. Ahmad and colleagues24,25 introduced a vibration-based method for fault detection of injectors in diesel engines. Liu et al. 26 used vibration signals to monitor and diagnose the fuel injection systems of diesel engines with good performance. Lee et al. 27 proposed a method for knock detection using block vibration and other signals collected from an engine. Flett and Bone 28 introduced a fault detection system for diesel valves with deformed spring and abnormal clearance faults.
However, the AE method is vulnerable to background noise and interference from other engines when considering the practical application of power output measurements. The angular velocity waveform is not sufficiently robust and is easily affected by fluctuations in engine speed. Although many studies have evaluated and diagnosed diesel engines using vibration signals, few have focused on power output estimation based on the vibration of the diesel engine. The vibration signal of cylinder head contains abundant information about the combustion process and can be measured easily from the engine block surface, 29 which could be used to identify the output power of the diesel engine.
The rest of the paper is organized as follows: section ‘Test methods and results’ introduces experimental setup of diesel generator, the test method and the acquisition of raw vibration data. Section ‘Signal processing and synthesis’ proposes a signal processing method, including purification, decomposition and synthesis. The probability distribution of vibration velocity under different working loads (WLs) also presented in this section. Then, the inductive monitoring system (IMS) method is described in section ‘Identification and results analysis’, and a flowchart of the IMS algorithm is built, based on which automatic recognition of the output power could be achieved. The method is proven to be correct by verification results. Finally, conclusions of the study were drawn in section ‘Conclusion’.
Test methods and results
Experimental setup
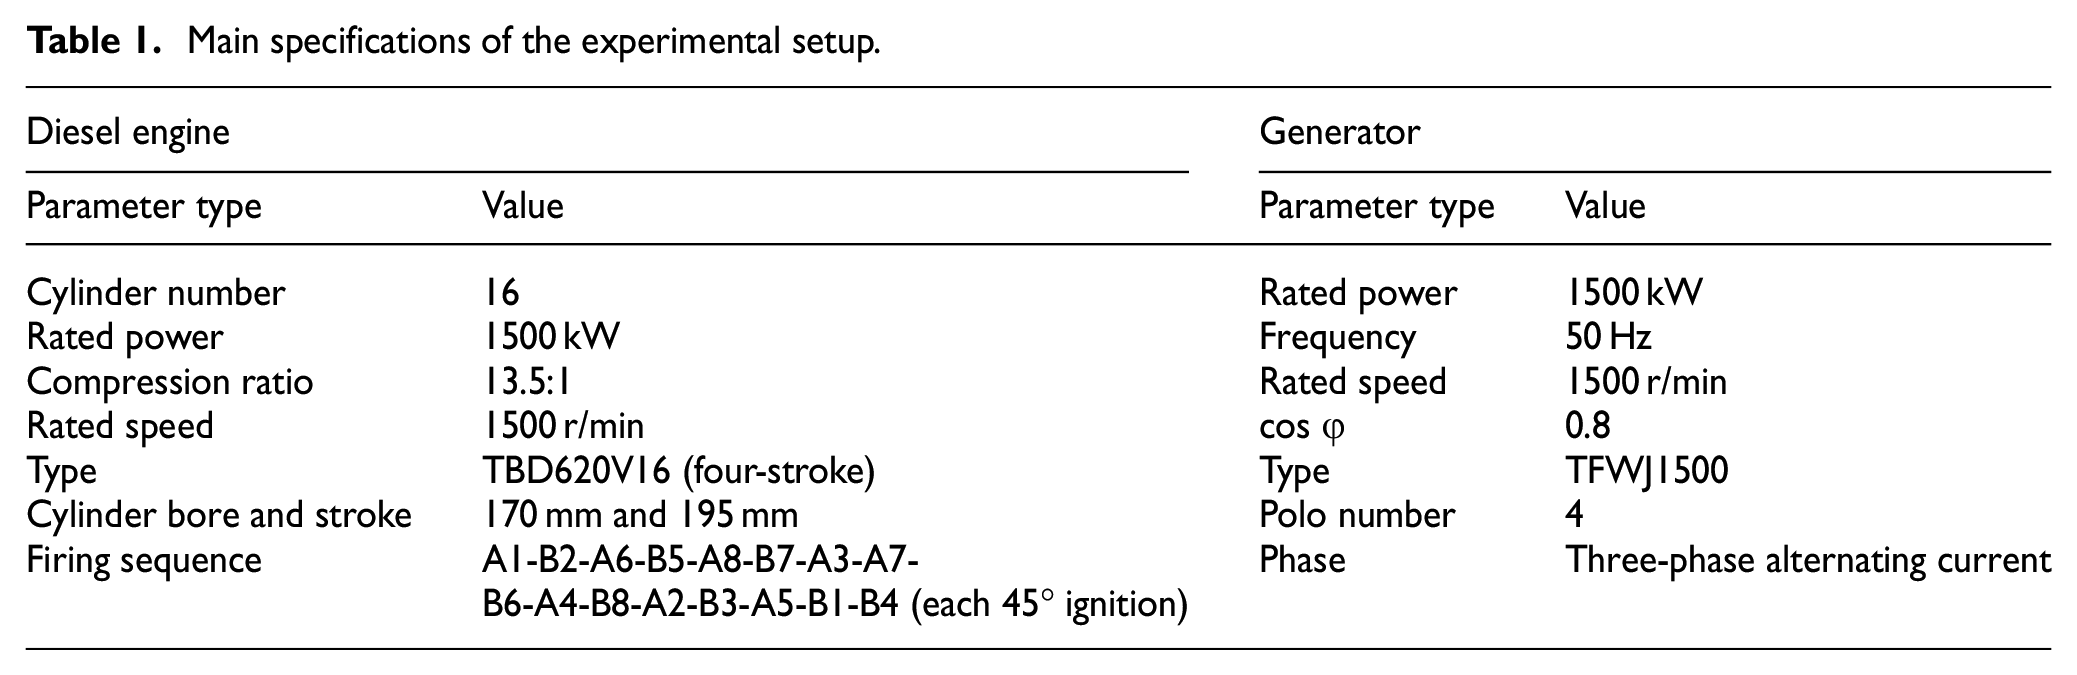
A V-type diesel engine and generator set (made by Henan Diesel Engine Industry Co., Ltd and Xiangtan Electric Manufacturing Group Co., Ltd, respectively) were used to carry out the experiment in this study, and the detailed specifications are shown in Table 1. To collect vibration data from the experimental setup, a data acquisition system (DAS) was built. The DAS is composed of two parts, software and hardware. The software part mainly includes an interface, communication middleware and a database. The hardware part includes the sensors and its cable, data collector and monitor station. Signals measured form sensors are sent to a data collector, where they are processed and converted from analogue to digital. Then, they are sent to the monitoring station to be saved and analysed. The layout of the DAS is shown in Figure 1, and the main configuration of the DAS is shown in Table 2.
Main specifications of the experimental setup.
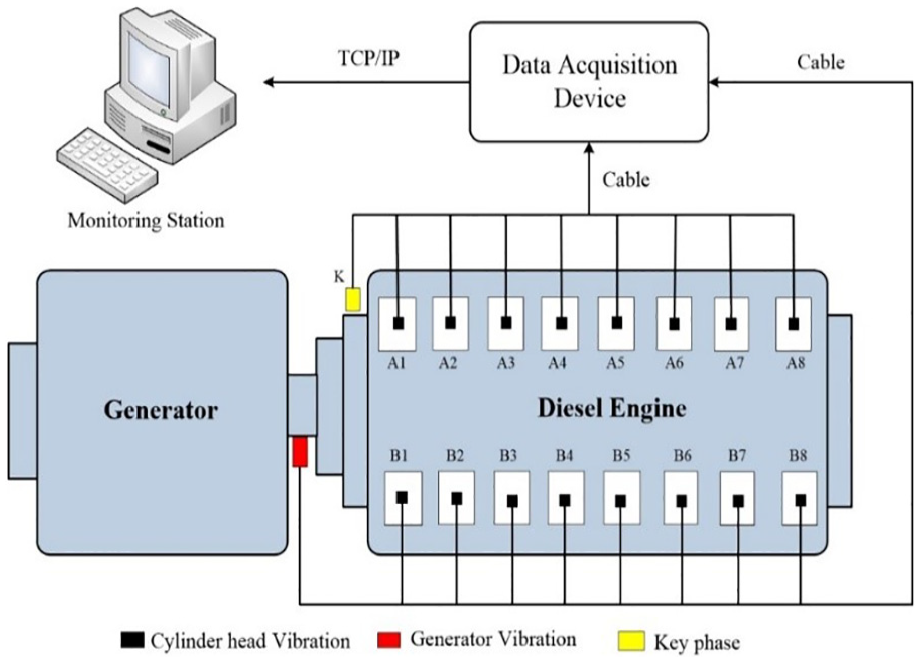
Layout of the DAS.
Main configuration of the DAS.
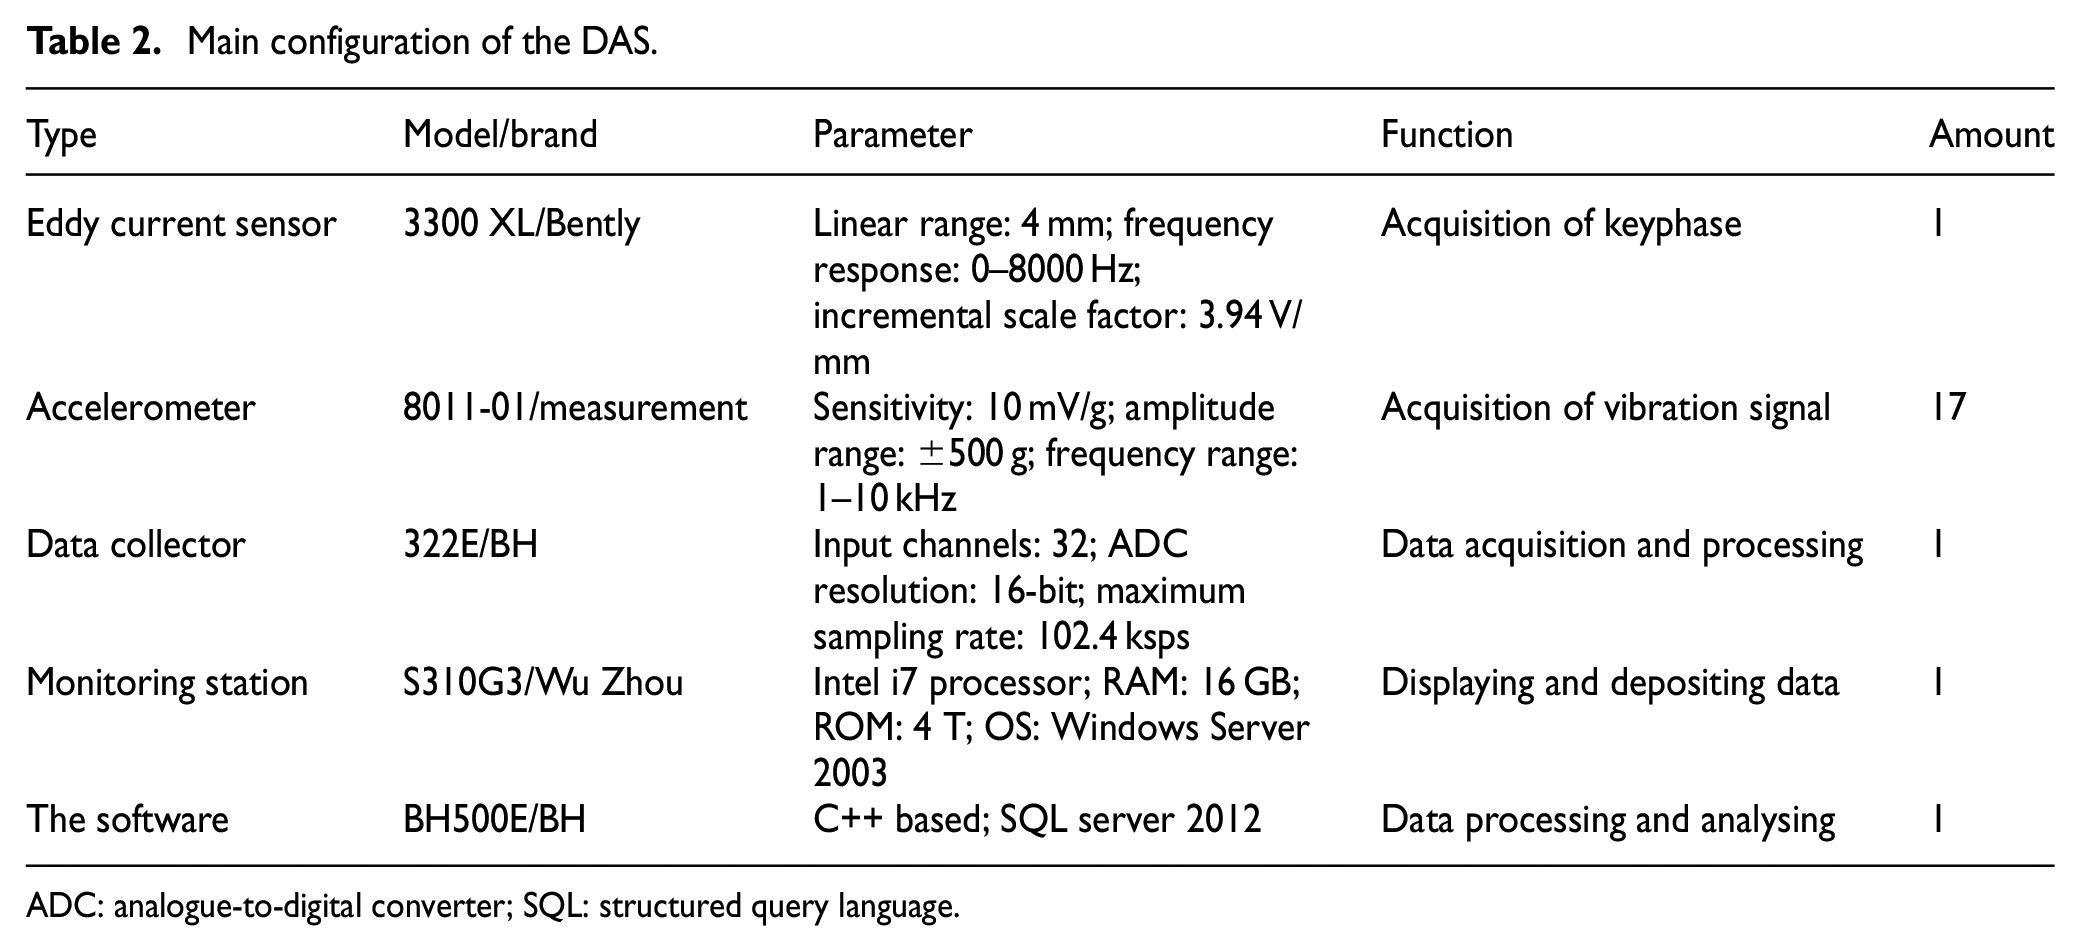
ADC: analogue-to-digital converter; SQL: structured query language.
The vibration signals were acquired by accelerometers mounted on the top of the cylinder head of the diesel, using glue paste (3M DP460). The keyphase signal used to identify different phases of combustion in the angle domain was collected by an eddy current sensor mounted on the flywheel shell. An illustration of the installation positions of the sensors is shown in Figure 2.
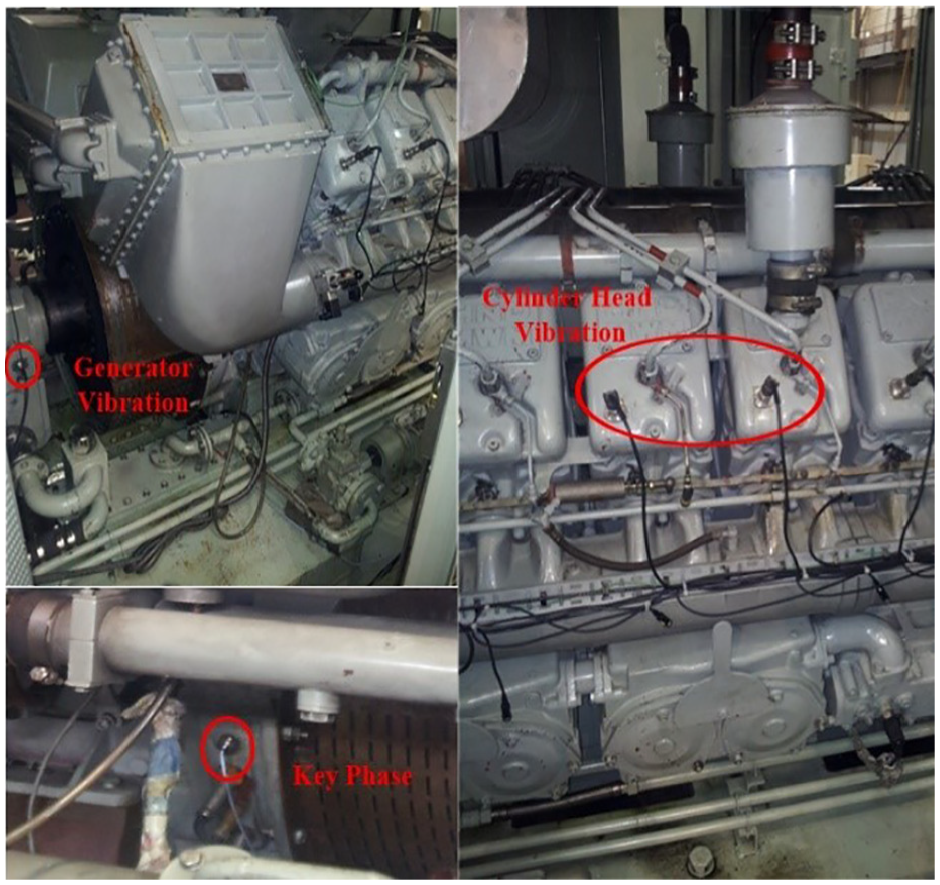
Position of measuring points.
Test process
The generator acted as a mechanical load for the diesel engine, through which the power output value could be adjusted. The experiments were conducted in the lab environment, and the data were collected and saved by the monitoring station mentioned before. Since the working speed of the diesel generator is constant (1500 r/min), the WL is the only variable to be considered. The vibration signal of engine was measured under different WLs of 0%, 25%, 50%, 75% and 100% of the rated power. For ease of presentation, these WLs are abbreviated as WL1, WL2, WL3, WL4 and WL5, respectively.
Test results
Figures 3 and 4 show the historical trend of the peak value of vibration acceleration of each working cycle measured from different cylinders. Because each cylinder is designed to have the same output power, and the locations of sensors are the same, the signals measured from these cylinder heads are basically the same except for the angle phase of vibration impact. However, this trait will not affect the data processing procedure. Hence, signals collected from cylinder A1 are used as a representation to simplify the narration. Figure 5 shows the waveform of vibration acceleration of cylinder A1 under different output powers in a working cycle, that is, a 720 °CA. As seen in the red box from the figure, the value of vibration acceleration measured form cylinder A1 continues to increase with growth of power output, which indicates the positive relationship between the vibration of the cylinder head and the power. To determine this relationship, further research needs to be conducted. However, the measured vibration acceleration waveform contains many interference signals, which mainly come from impacts of intake, exhaust valves and even oil pumps (shown in the black box of Figure 5). This interference will reduce the signal-to-noise ratio (SNR) and hinder signal purification and synthesis. Therefore, the measured acceleration signal must be pre-processed.
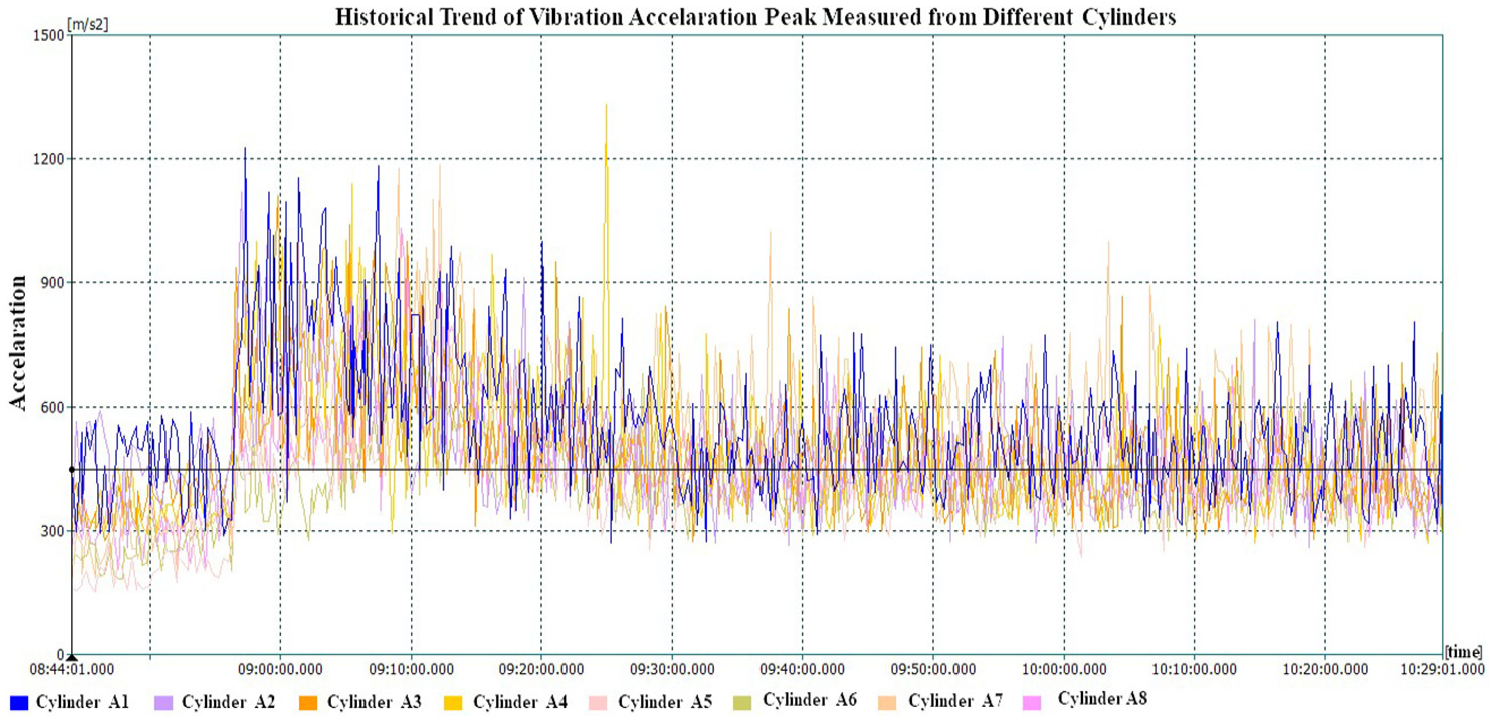
Historical trend of peak value of vibration acceleration from cylinders A1 to A8.
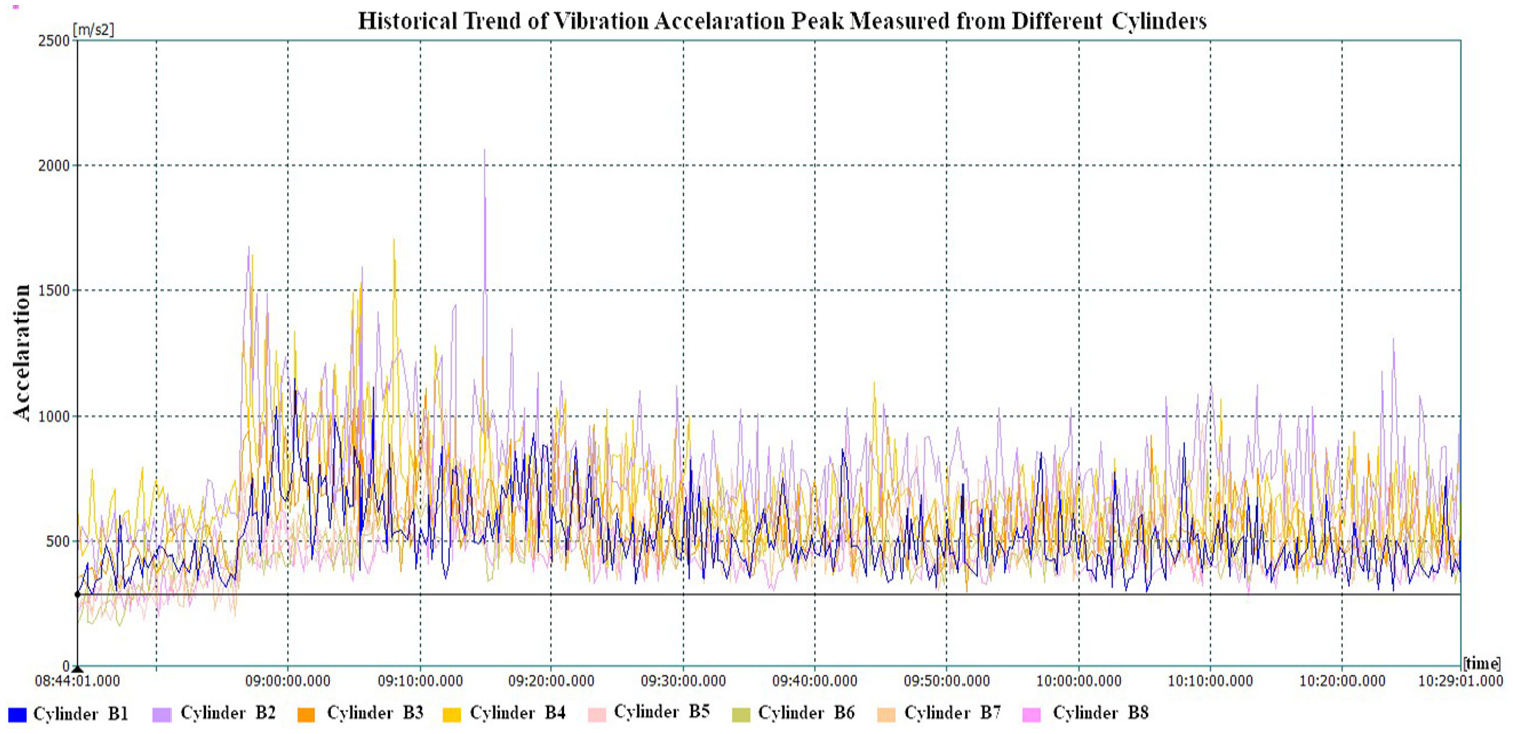
Historical trend of peak value of vibration acceleration from cylinders B1 to B8.
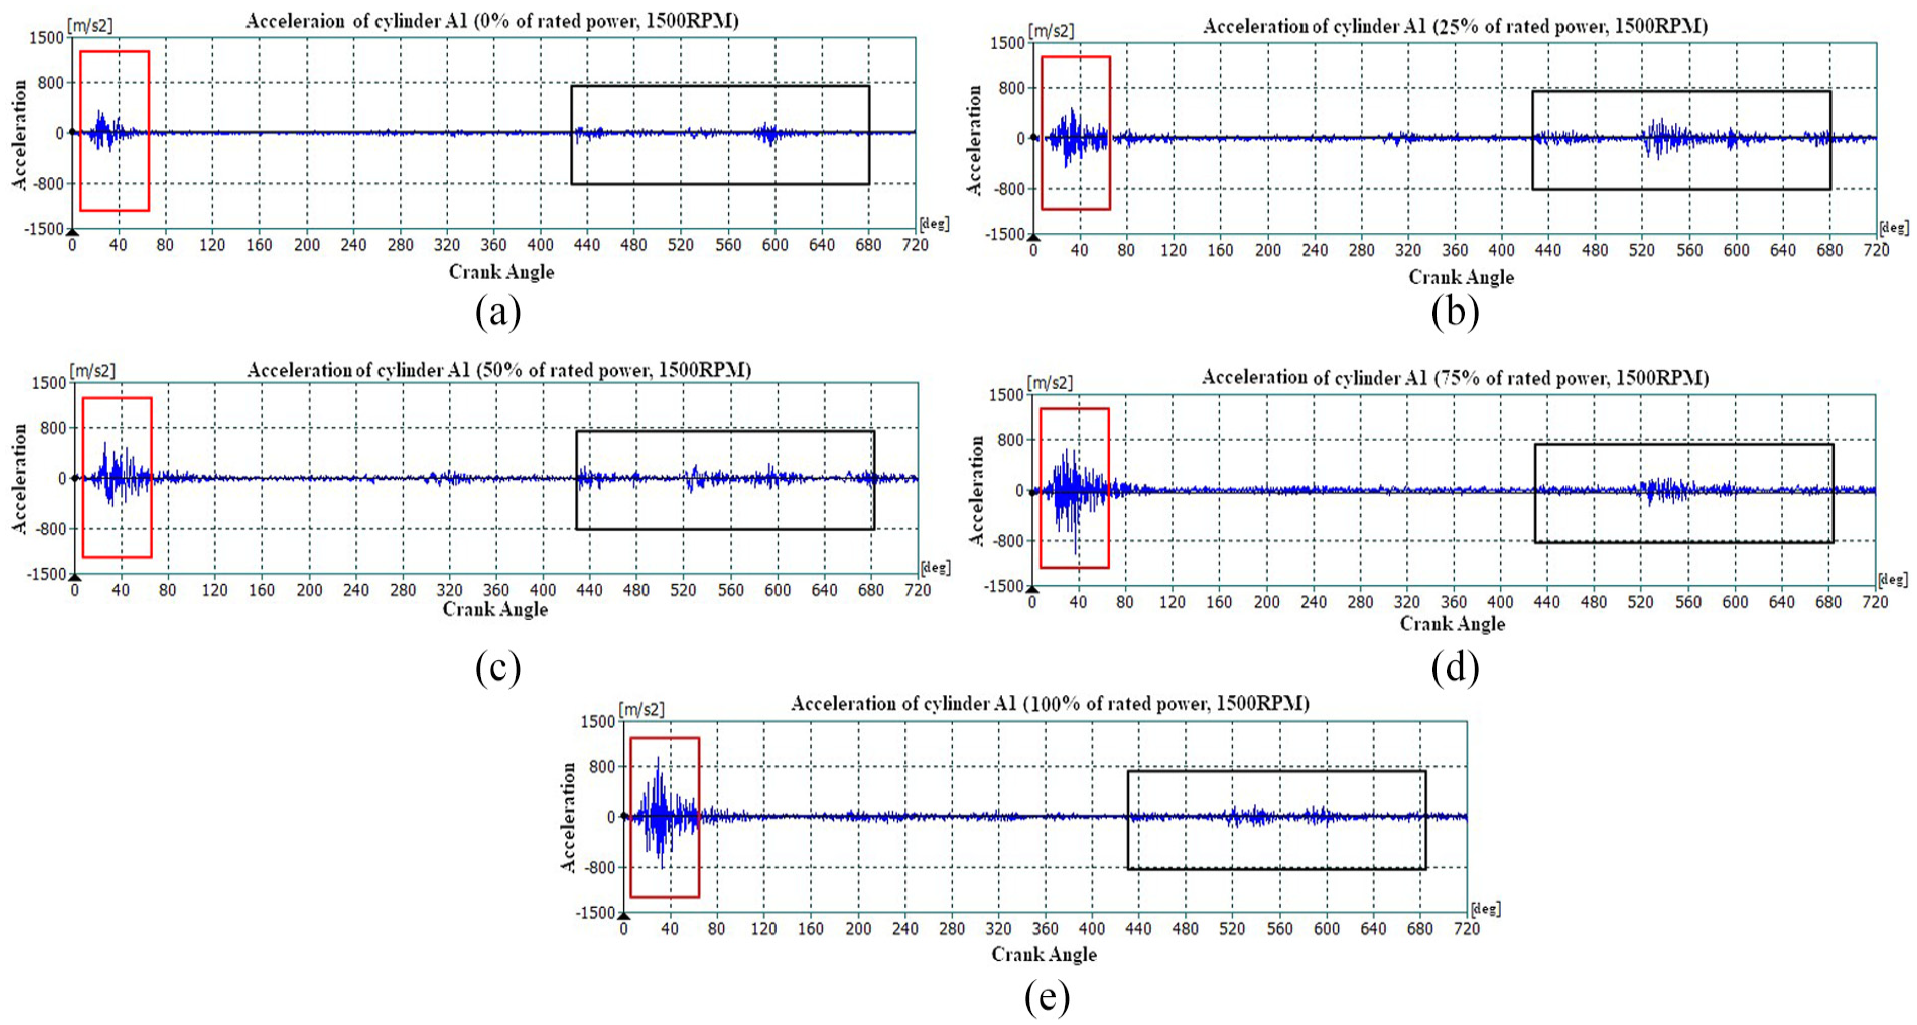
Vibration acceleration of cylinder A1 during one working cycle under different working loads: (a) 0% of rated power, (b) 25% of rated power, (c) 50% of rated power, (d) 75% of rated power and (e) 100% of rated power.
Signal processing and synthesis
Cut-off filtering
As shown in Figure 6, the impacts in the waveform mainly come from the vibrations of exhaust valves closing (Ve), intake valves closing (Vi), combustion (Vc) and high-pressure gas excitation (Vg), according to the firing sequence and timing of those actions. As mentioned before, power output is closely related to the combustion state, which is one of the most important criteria for power identification. However, combustion information is mainly concentrated in the low-frequency region of the vibration spectrum, and valve impacts or other interference signals are in the high-frequency region. 30 To focus on the combustion process, the other impact should be filtered out, so a low-pass filter was employed to improve the quality of the signal, and the cut-off frequency was empirically set to 4.5 kHz. A comparison between the raw and filtered waveforms of one working cycle in the angle domain is shown in Figure 7.
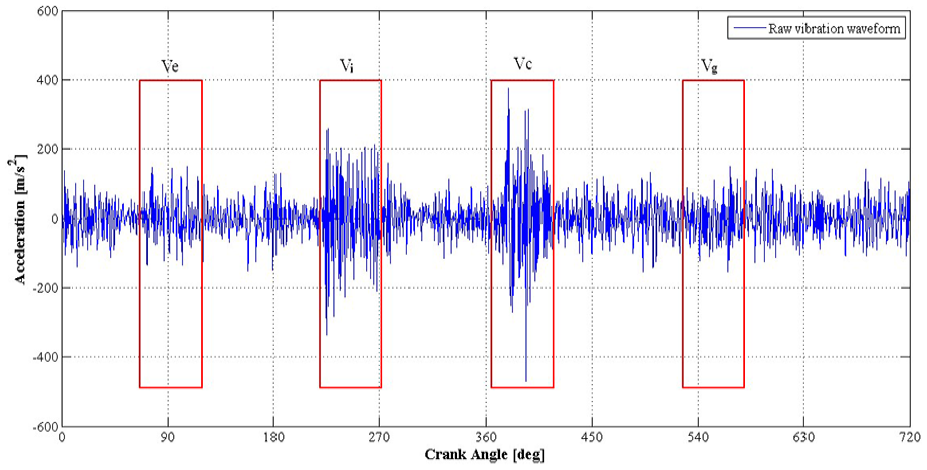
Different vibration impacts of cylinder B6 in one working cycle (1500 r/min, 100% load).
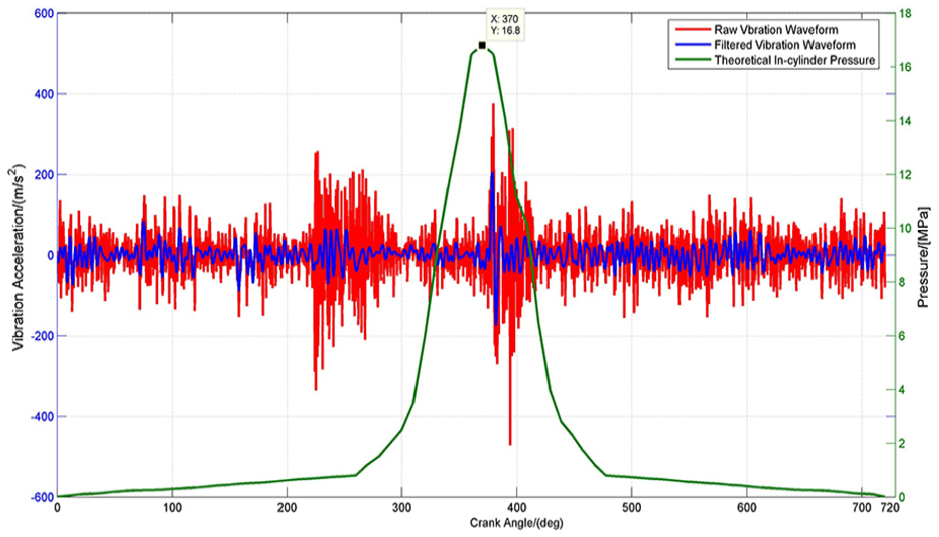
Comparison between raw and filtered waveform of B6 under cylinder pressure (1500 r/min, 100% load).
As shown in Figure 7, the filtered vibration acceleration signal is improved, the impact of combustion is much more obvious than before and the angle phase of the impact is consistent with that of the maximum of theoretical in-cylinder pressure. However, there is still some low-frequency interference with significant energy, which seriously affects the identification process. Therefore, the empirical mode decomposition (EMD) method is used to remove low-frequency interference and identify local features.
EMD processing
EMD is an adaptive approach to decompose non-linear and non-stationary time series into a set of intrinsic mode functions (IMFs) and a residual, which indicate the natural oscillations embedded in the vibration signal. 31 In this paper, the EMD algorithm proposed by Rilling et al. 32 is employed to decompose the filtered vibration waveform, and the result is shown in Figure 8. The signal denotes the original signal curve; imf1, imf2 and imf3 denote the different IMFs; and res. represents residual. To select the most useful IMFs that are closely related to the original signal, correlation analysis is employed.
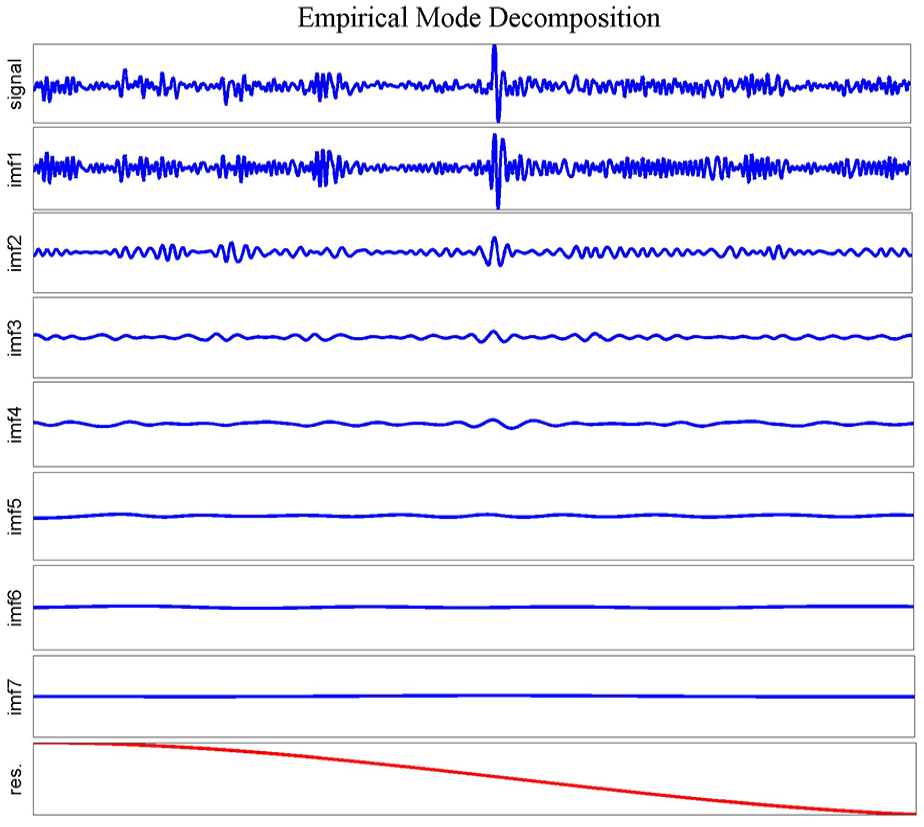
Decomposition result of filtered vibration waveform with EMD algorithm.
The correlation coefficient is used to illustrate the degree of association between the original and processed signal – the greater the absolute value is, the closer the relationship between the two variables. The formula is represented as follows
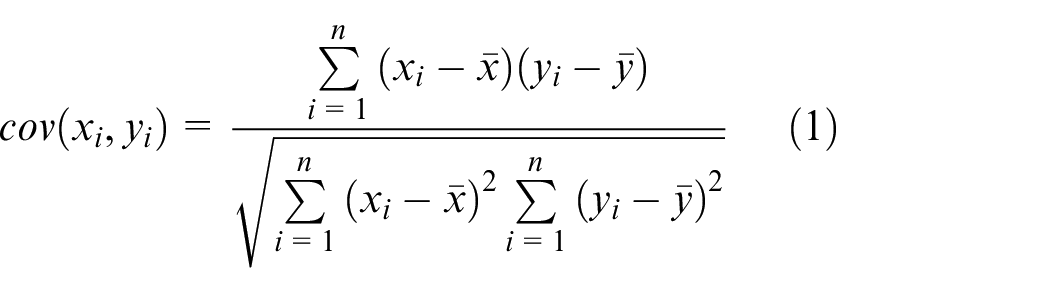
where
The correlation coefficient between the original signal and imf1 is 0.86, while that between the original signal and imf1 + imf2 becomes 0.93. Most of the information is mainly focused on the first two IMFs, and the remaining IMFs constitute the low interference. 7 Therefore, the first two IMFs are summed to form a new composite signal to replace the original signal, and the new signal is shown in Figure 9.
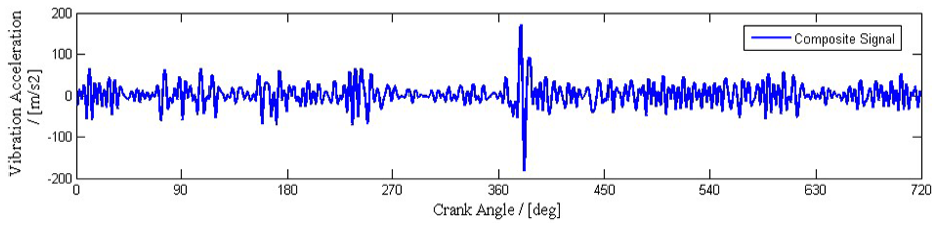
The new composite vibration acceleration signal.
Integration of the composite signal
Vibration acceleration reflects the impact strength of vibration. Vibration velocity, also known as vibration intensity, reflects the magnitude of vibration energy and can be obtained by integrating vibration acceleration and used for reflection of the power output. Therefore, the composite vibration acceleration signal was integrated into the vibration velocity curve.
However, the acceleration signal measured by the accelerometer will inevitably be accompanied by a zero-point offset of the acceleration signal (a0) caused by noise interference and measurement error offsets in actual measurements.
33
The real vibration acceleration is
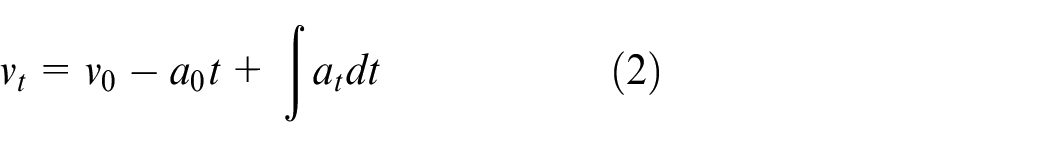
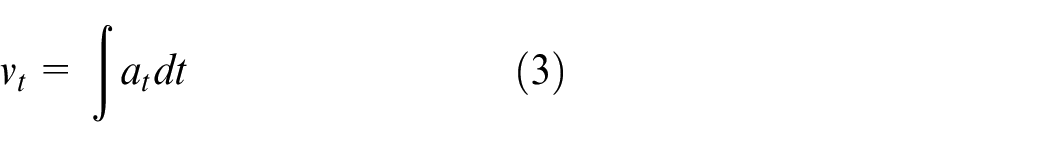
where
To reduce the error, the least square method is employed to remove the first-order trend term in the velocity signal, that is, to subtract the best straight-line fit linear trend of the discrete vibration velocity, and the result of de-trending is shown in Figure 10.
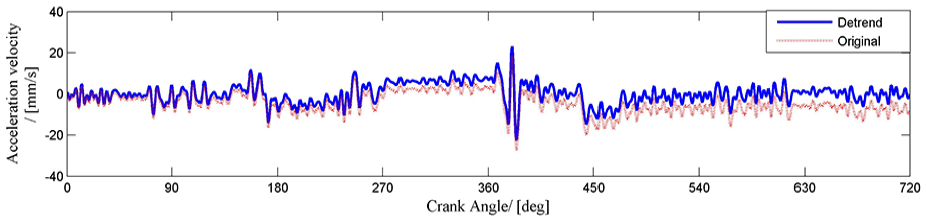
Comparison of integral vibration velocity signal and the de-trended one.
Signal synthesis
According to the above steps, the acceleration data of cylinder A1 under different output powers are processed, and its vibration velocity waveform can be obtained as shown in Figure 11. The vibration velocity waveform fluctuates greatly under the different working conditions because the dynamic status signals of the diesel engine are non-stationary signals, and there are many points (called outliers) far larger than others under the same working conditions.
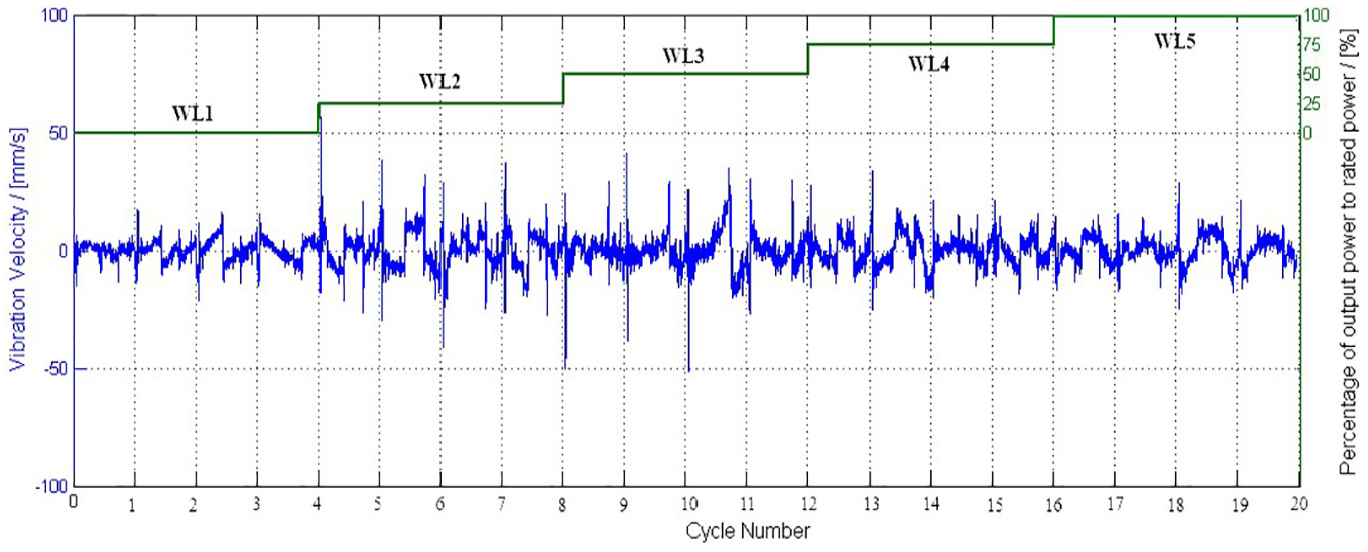
Vibration velocity of cylinder A1 under different powers.
As outliers will have a negative effect on the identification, they should be eliminated. According to the widely used three-sigma rule, singular data can be reasonably deleted and replaced by its arithmetic average value, if the data satisfy with equation (4)
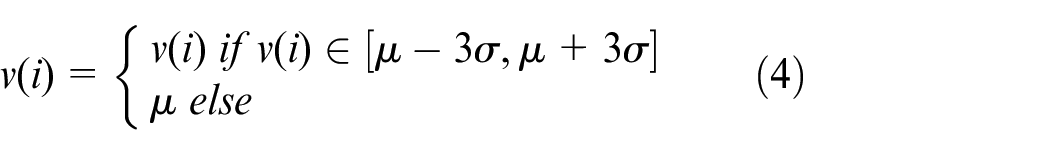
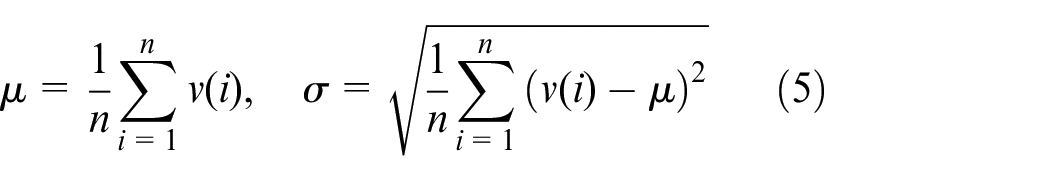
where
Probability density distribution of the vibration velocity
Since power output comes from continuous combustion in each cylinder, the vibration energy of the cylinder will suddenly increase as the combustion phase begins. Then, it will decrease gradually due to the existence of structural impedance. Theoretically, the maximum value of vibration velocity always appears in the combustion phase and corresponds to the maximum cylinder pressure, which can be used to reflect power output. However, a single maximum value may be precarious because of accidental factors. Hence, the top K velocity values instead of the maximum one in each working cycle are taken as the indicators of the output power to enhance its robustness. Figure 12 shows the vibration velocity of cylinder A1 with different K values under different WLs. The ordinate value first increases and then decreases with increasing load.
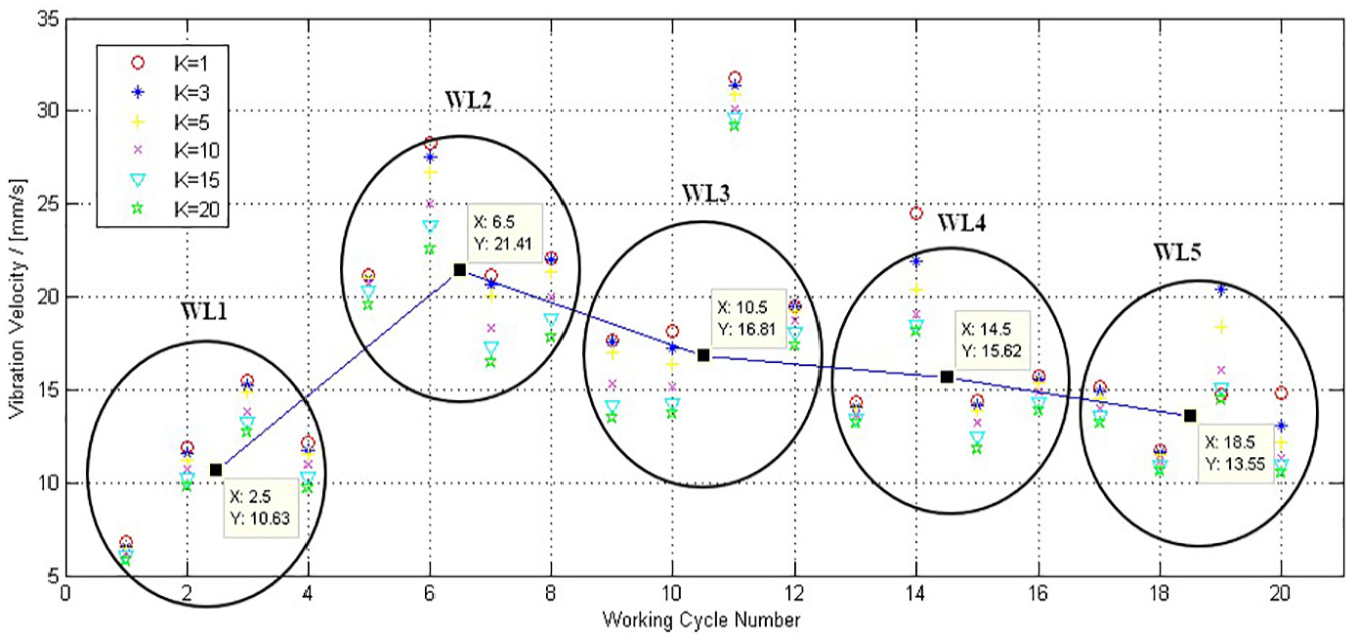
Vibration velocity of cylinder A1 with different K values.
It is also worth noting here that the vibration velocity values under the same WLs are relatively concentrated, and the distribution area can be expressed by a circle with equal radius. To find the best K value, the variance of distance between the centre of the circle and the calculated velocity value (DCV) is calculated. As shown in Table 3, in most cases, the variance of DCV is smallest when the value of K is 20, which means the velocity value is much closer to the centre and more stable than others. Therefore, in the subsequent part of this paper, K is set as 20.
Statistics of DCV under different K values.
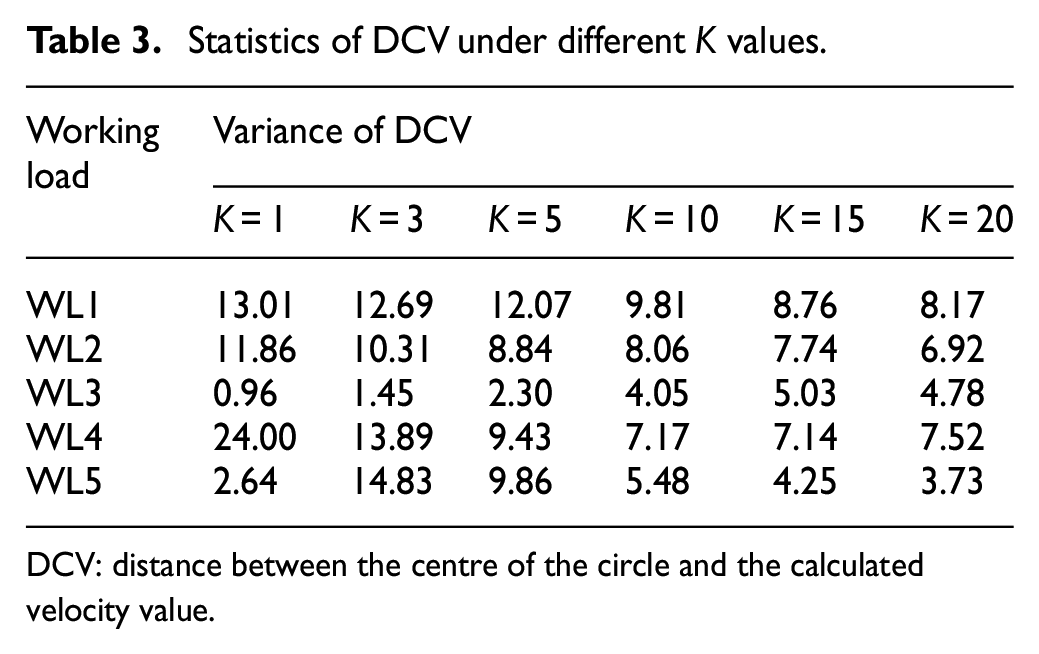
DCV: distance between the centre of the circle and the calculated velocity value.
The output power of the diesel engine is the sum of the output power of each cylinder. The overall vibration intensity of a diesel engine can be obtained by superimposing the velocity values of different cylinder blocks at the same time. The standard normal distribution curve is fitted to study the distribution of velocity under different WLs, as shown in Figure 13. The mean value of vibration velocity is the maximum under WL1 and the minimum under WL3, which may result from the structure of the unit.
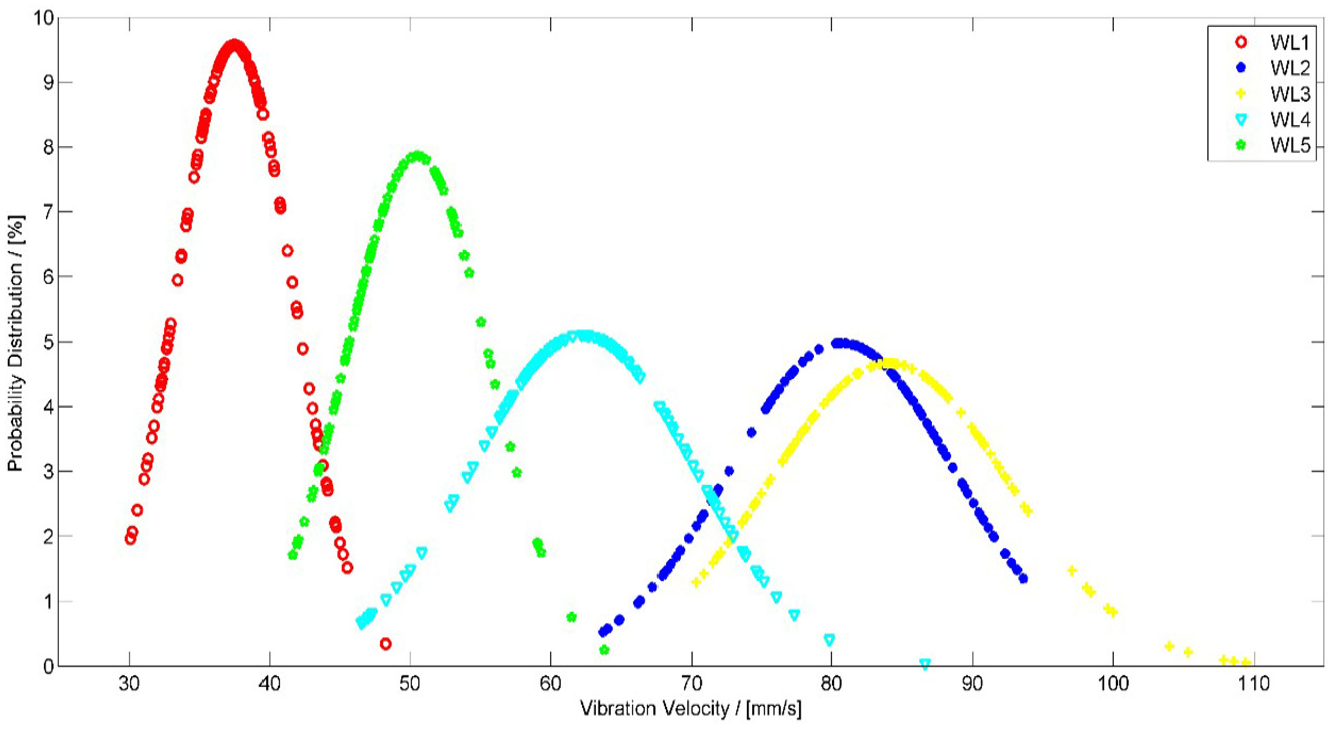
Probability density curve of vibration velocity under different working loads.
Identification and results analysis
Identification of output power
As shown in Figure 13, the vibration velocity distribution regions overlap with each other, which may hinder the identification process. To realize the accurate automatic recognition of the output power of the diesel, the IMS method is employed. IMS is a type of clustering algorithm, the principle of which is to determine whether the sample data belong to a certain data group by calculating their distance according to the different spatial distributions of the data. The specific algorithm is shown in Figure 14. The algorithm mainly includes two parts of training and testing. The function of the training part is to construct the upper and lower bounds of each data group under different WLs. The updating rule of the upper and lower bounds of the data group is unilateral expansion, that is, if a new data point is above (below) the upper (lower) bounds of the existing data groups and the minimum distance d from the data to the bounds is greater than a given discriminant threshold D, then the bounds will be rebuilt. The new bound equals that data point plus (minus) the excess part, which is then multiplied by the expansion coefficient, E. In this work, we empirically take E as 1.02 and D as 1.7.34,35
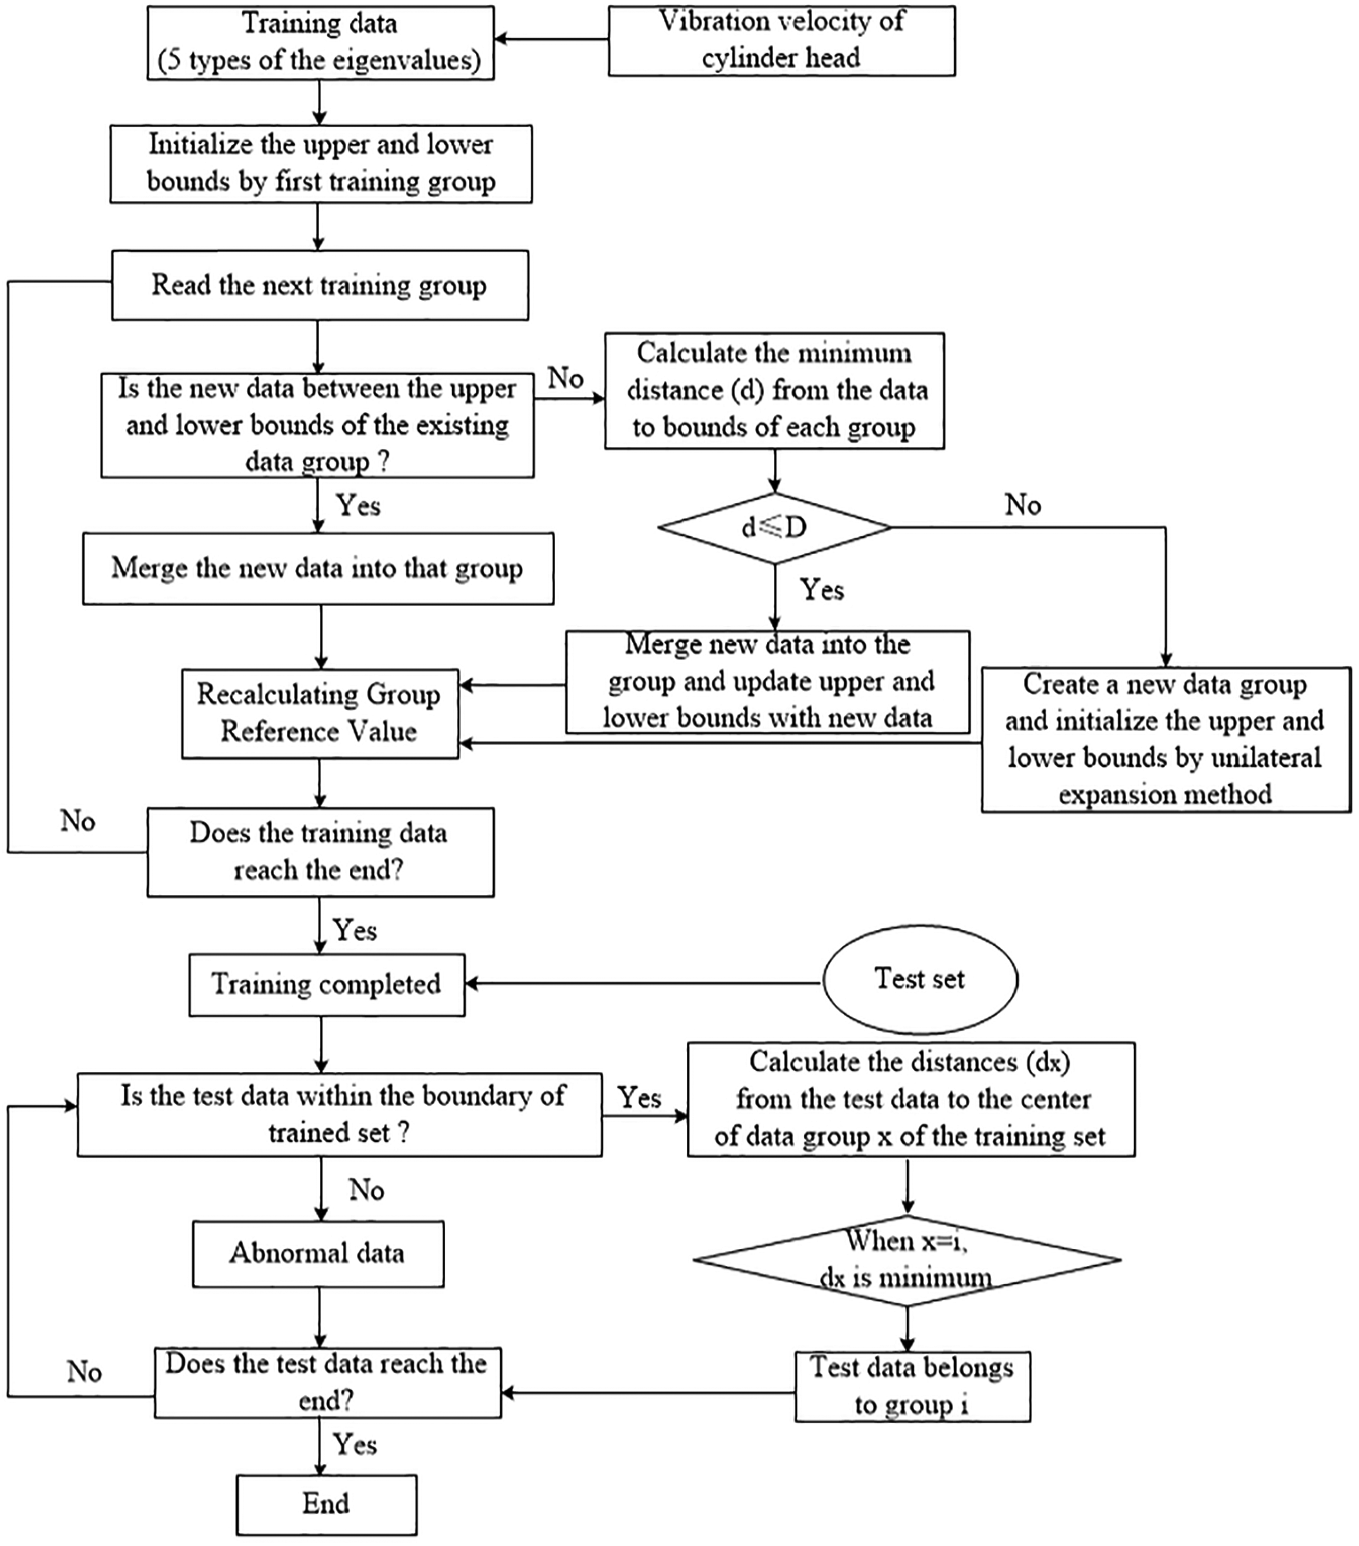
Flowchart of the IMS algorithm.
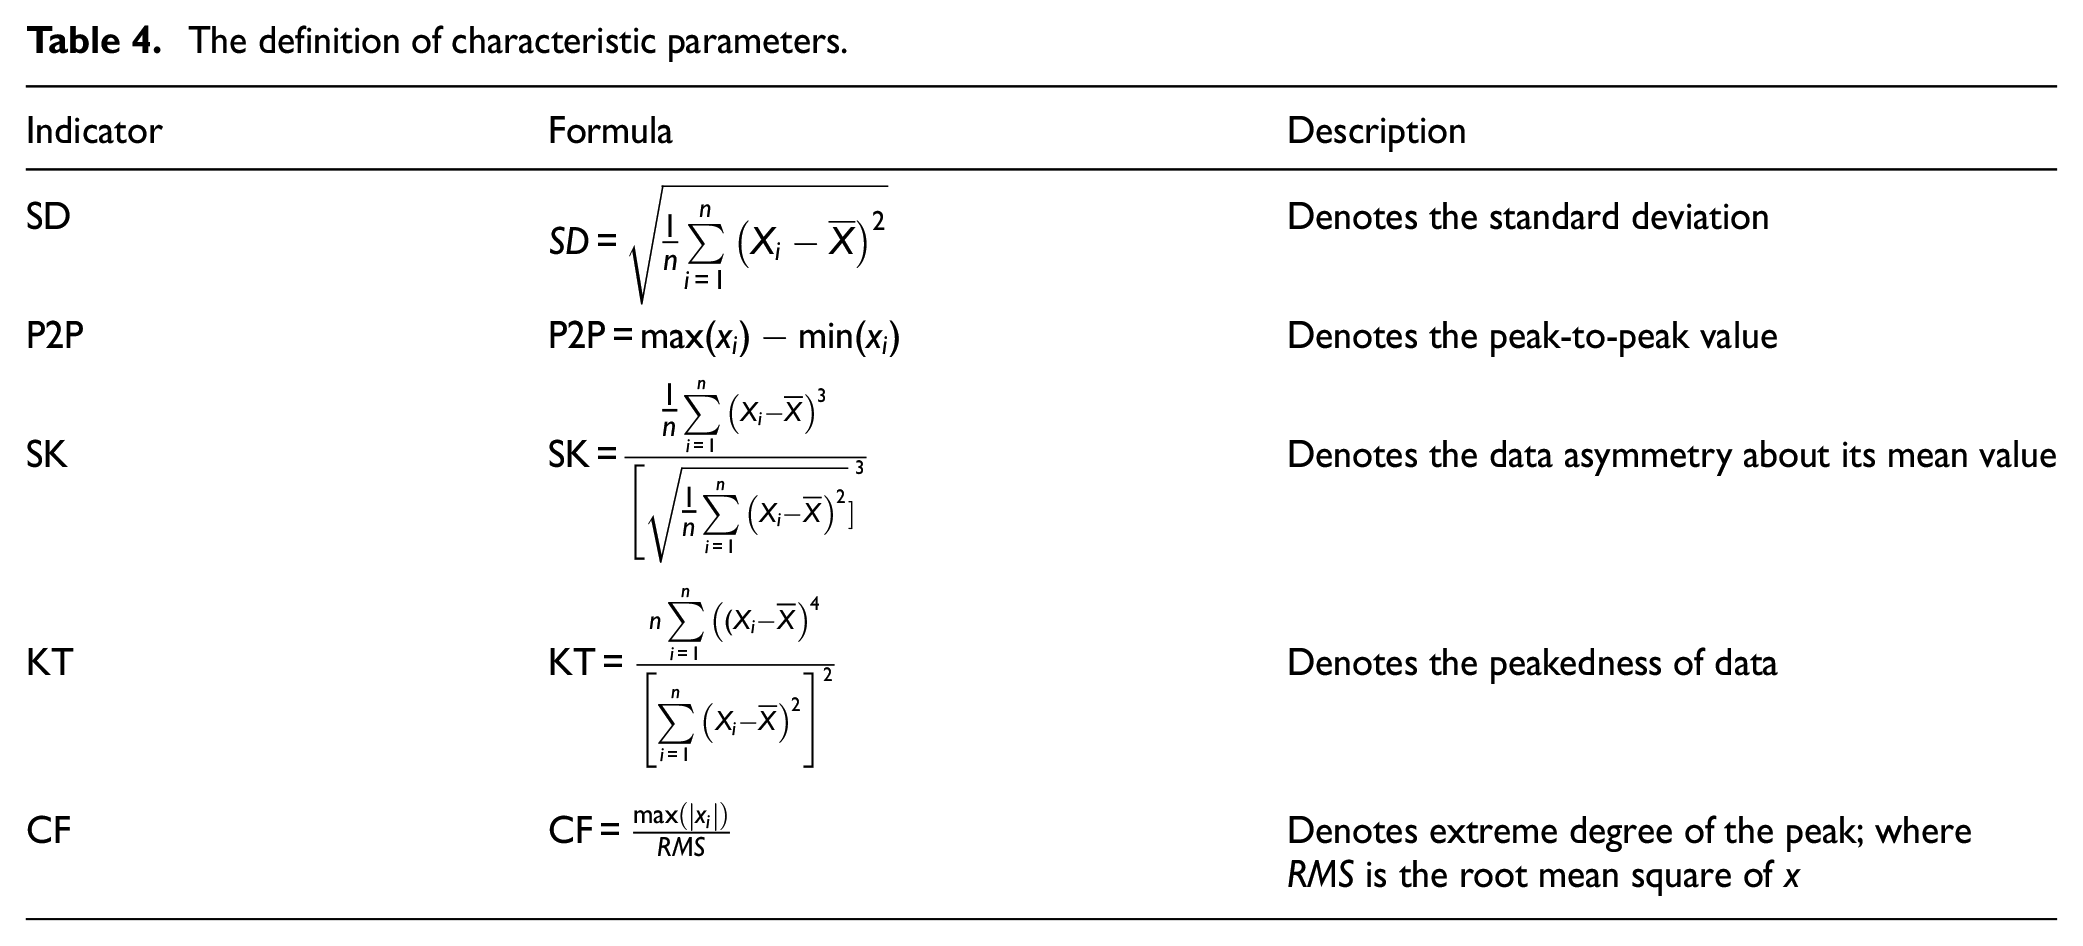
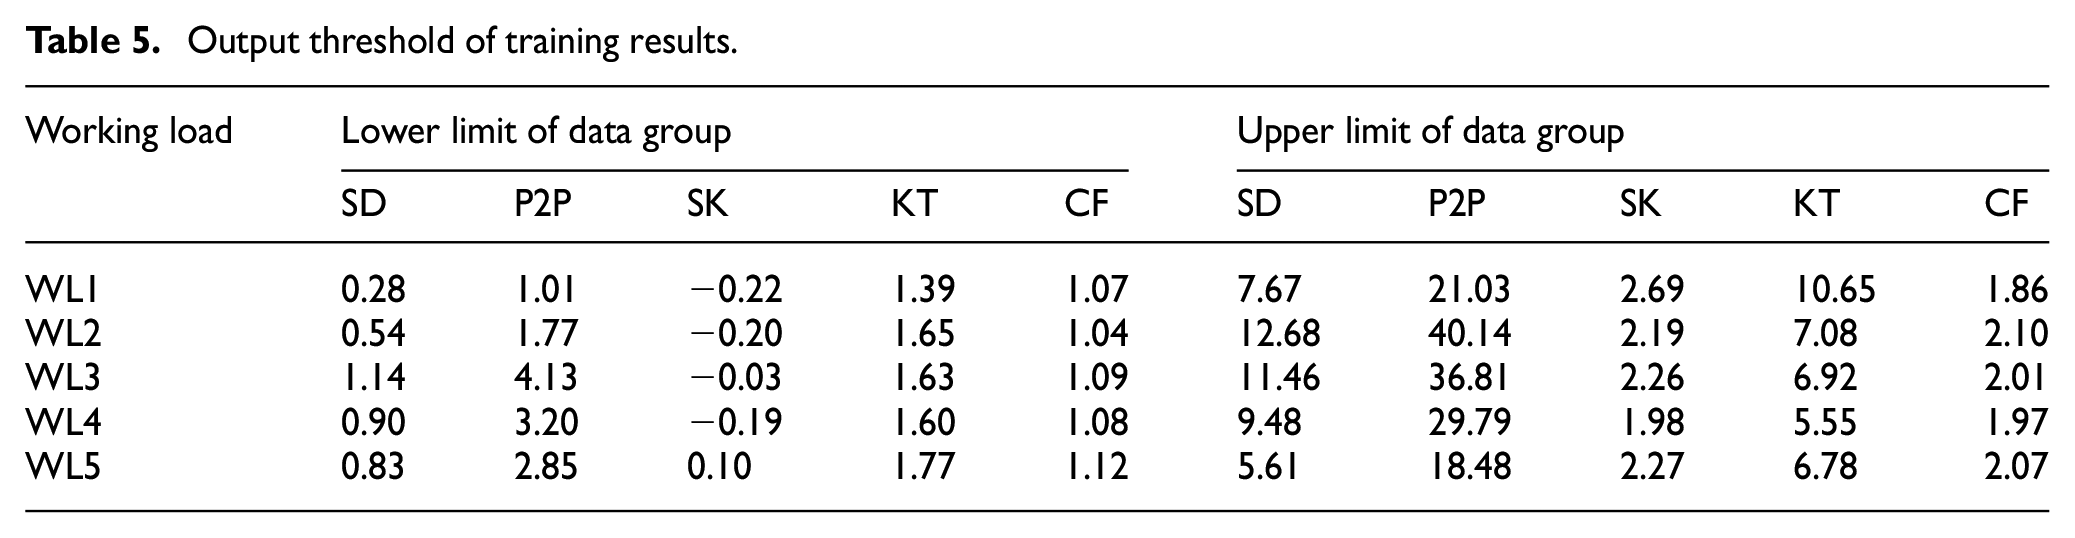
However, the robustness of the proposed IMS method is relatively poor when directly using vibration velocity as input data. Therefore, characteristic parameters of vibration velocity, as shown in Table 4, are introduced as eigenvalues. The eigenvalues based on 1000 groups of vibration velocity under five different WLs (200 groups for each condition) are calculated according to the formulas in Table 4 to form training set. Each group contains the top 20 peaks of the velocity waveform in one working cycle. When all the groups of data are classified, the threshold for each WL is determined as shown in Table 5, and the training process is completed. Then, the test process or identification process can be performed.
The definition of characteristic parameters.
Output threshold of training results.
Since the output power of the diesel engine is equal to the WL, which equals to the power of the generator in this paper. The power output can be determined by which data group the eigenvalues belong to. Specifically, a set of eigenvalues to be tested is input into the test set, then classified by the IMS algorithm and divided into a certain data group. The WL of the diesel engine corresponding to the eigenvalue is the same as that corresponding to the data group. In this way, the power output of the diesel engine can be obtained.
Results and error analysis
Test results
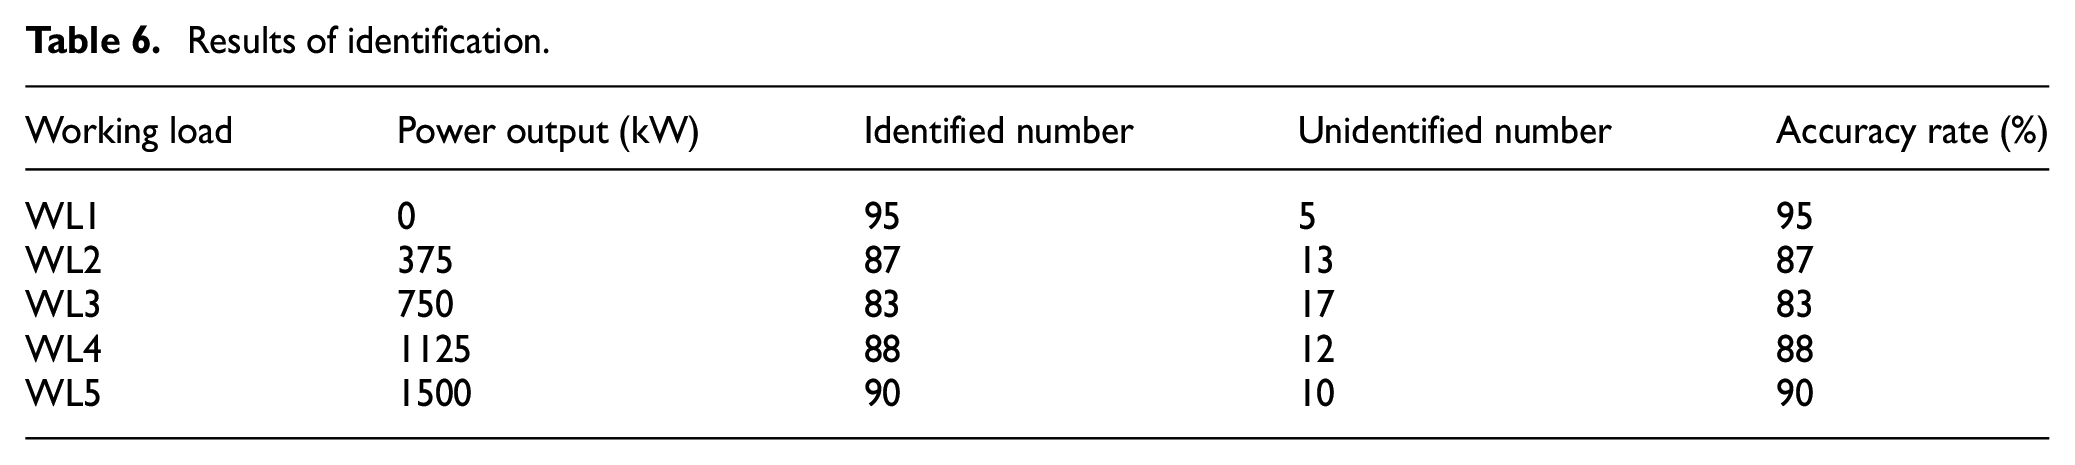
The parameters of vibration velocity of 500 groups under five WLs (100 groups for each condition) are taken as the test set and are input to the above training results. The accuracy of the test results is shown in Table 6. The table shows that the recognition accuracy of the IMS method for power output ranges between 83% (WL3) and 95% (WL1). The overall recognition of the algorithm is good and acceptable, which demonstrates the accuracy of the algorithm.
Results of identification.
Error and sensitivity analysis
It can be seen from the above results that the identification accuracy is the highest under a no-load condition and only 5 of the 100 data sets are not accurately identified. This shows that when the power output is 0, the characteristic values distribution of the diesel cylinders’ vibration data are more concentrated. In this case, the power identification is the most sensitive, and the error is also the smallest. When the output power is 750 kW, that is, under 50% load, the recognition accuracy is the lowest, at only 83%. At this time, the distribution of characteristic parameters of vibration is relatively scattered, which is not conducive to identification, and the error is also the greatest. The occurrence of this situation is related to the structure of the diesel engine itself and its vibration characteristics.
In addition, it is worth noting here that the identification result of output power is an approximate value because of the existence of internal friction loss and other power consumption. For instance, even though the power of the generator is 0 under WL1, the actual output power of diesel is not exactly 0 as long as it rotates. However, that power is very small and close to 0. Therefore, this method can be used for the general evaluation of the power output of the diesel engine, where the exact value of power is not needed.
Conclusion
In this paper, a novel method for identifying the output power of diesel engines based on vibration signals is proposed. More specifically, the method employs five eigenvalues of processed vibration velocity as input to train the IMS algorithm, which is used for power identification. The test results show that the recognition accuracy rate varies with output power. The accuracy is the highest when the output power is 0, while it becomes the lowest at 750 kW. This is due to the difference in the distribution of eigenvalues. However, the overall accuracy rate is approximately 88.6%, which is acceptable for evaluating performance. In addition, the algorithm flow is simple with good practicability and could be used for real-time condition monitoring of diesel engines.
Footnotes
Declaration of conflicting interests
The author(s) declared no potential conflicts of interest with respect to the research, authorship and/or publication of this article.
Funding
The author(s) disclosed receipt of the following financial support for the research, authorship and/or publication of this article: This research was supported by the National Key Research and Development Plan (2016YFF0203305), the Fundamental Research Funds for the Central Universities (JD1912 and ZY1940) and Double First-rate Construction Special Funds (ZD1601).