
Abstract
In this study, a test setup was designed for three- and/or four-wheeled electric mobility scooter models used by disabled or old people. This system is composed of a test platform that enables measurement of vehicular velocity, a data acquisition card, and an interface prepared in the C# program. Using the data acquisition card that was designed, seven quantities, namely, battery and motor currents, battery and motor terminal voltages, wheel speed in revolution per minute, and ambient and motor temperatures, were measured instantaneously during the test procedure and transferred to a computer via a USB device. Using these data that were transferred, motor speed in revolution per minute, torque generated by the motor, motor shaft power, motor and driver efficiency, instantaneous velocity of the vehicle, and total distance covered information obtained from the moment the vehicle began to be used were computed in real time throughout the experiment in the interface prepared in the C#, and their graphs were drawn and recorded. Thus, the faults in the battery, motor, or driver of electric mobility scooters became easily detectable in tests conducted under various conditions such as different ambient temperatures, different user weights, and roads with different slopes.
Keywords
Introduction
Many people encounter diseases or accidents in their daily lives that occur beyond their control and confine them to a wheelchair throughout their lives. Some people, however, are walking-disabled congenitally. Therefore, wheelchairs, whether battery-operated or not, are indispensable components of their lives.
Today, a wide range of power wheelchair models are produced for disabled people who want to use power wheelchairs as long as they can afford. Those with double motor are called battery-operated wheelchair. The ones with a single motor are called electric mobility scooters. But, the basic components in both are the same.
Different power choices are offered depending on conditions of use, and there are battery-operated wheelchair models that can bring their users to an upright position on the vehicle. 1 However, no matter in what models and powers these wheelchairs are produced, the fundamental components of these vehicles are batteries, motors, and drivers. When producers of such vehicles are investigated, it is seen that they generally obtain batteries, motors, and drivers from different firms, then mount them on a chassis and offer them for sale. However, when a fault occurs in the vehicle, they try to detect the fault in ways that are not much technical.
Faults that arise in such vehicles are not always in the form of a failure of the motor to revolve or the battery’s failure to be charged up. The decreases observed in motor and driver efficiency in the course of time, very quick heating of the motor, quicker-than-normal discharging of the battery, and accordingly the vehicle’s covering a shorter distance at full charge are among possible faults. It is not possible to determine driver efficiency by measuring only motor current or battery current, nor is it possible to determine at only room temperatures the faults that present themselves at very high or very low temperatures. Neither is it an appropriate method of fault detection to take the motor thought to be faulty and test it on another vehicle. When all these are taken into consideration, one needs to ensure that all the components of the vehicle are in interaction with one another, and they need to be evaluated as a whole. In order to ensure this, battery and motor currents, battery and motor terminal voltages, motor speed, motor and ambient temperatures, the torque generated by the motor, the instantaneous velocity of the motor, and the route information collected from the moment the vehicle began to be used need to be collected, transferred to a computer environment, and analyzed so that the true source of the fault can be determined.
There is a study in which some of these data were taken in electric vehicles and transferred to a database. 2 However, measurement of velocity using magnets and reed switch placed within the wheel is not a proper method of measurement for velocities where the number of revolutions per second is way below one because this will extend the calculation range of other parameters computed relative to velocity and hence lead to different frequencies of data collection at different velocity stages. This will in turn give rise to an error in the measurement of energy transferred by the battery to the motor.
No study has been encountered among the publications concerning these vehicles about inclusion of wheelchair parameters such as center of gravity, moment of inertia, and velocity and torque constants of the motor. 3 Likewise, when publications in this regard are examined, it is seen that attempts have been made to find various solutions for amputated people (people without arms and legs). For example, control of the wheelchair with a movement of the head,4–7 control with the eyes,8–12 control with voice command,13–16 and control with movements of the mouth 17 are among some of these. There are also studies where passenger characteristics have been evaluated, 18 human factor has been investigated, 19 the moment of inertia of the vehicle has been measured experimentally, 20 vibration has been investigated under different road conditions via nine axes sensor placed under the seat, 21 and mechanical and electrical impedance of the vehicle has been measured using sensors. 22 However, no study has been found where a complete system has been designed to detect faults in battery-operated wheelchairs or to test these vehicles.
In this study, which was conducted to meet this demand, a test setup was designed for electric mobility scooter models used by disabled or old people. In this setup, seven quantities, namely, battery and motor currents, battery and motor terminal voltages, wheel speed, and ambient and motor temperatures, were measured instantaneously during the procedure and transferred to a computer via a USB. Then, using these data that were transferred, motor speed, torque generated by the motor, motor shaft power, motor and driver efficiency, instantaneous velocity of the vehicle, and total distance covered information obtained from the moment the vehicle began to be used were computed in real time throughout the experiment in the interface prepared in the C#, and their graphs were drawn and recorded. All the data that were measured and calculated can also be monitored instantaneously at the same time. If the motor current and consequently the motor temperature increase abnormally, the system generates an audible error warning. When the graphs of the measured parameters are evaluated by an experienced technical staff, the cause of the fault can be determined in detail.
The designed system and its components
First, a platform was designed in the setup to determine the velocity of the vehicle. Then, sensors required for the measurement of currents and voltages and a card for reading them were designed. After the designing of the data acquisition card, which would read the quantities that were planned to be measured and send them to the computer, an interface was designed that would enable them to be displayed, and their graphs to be drawn and recorded on the computer. All these components of the system are presented in detail below.
Preparation of the test platform to be used in velocity measurement
First of all, it is necessary to design a mechanical setup that will allow to measure the speed of all battery-powered vehicles in the laboratory. Therefore, a very simple and efficient test platform to be used for speed measurement was designed (Figure 1).
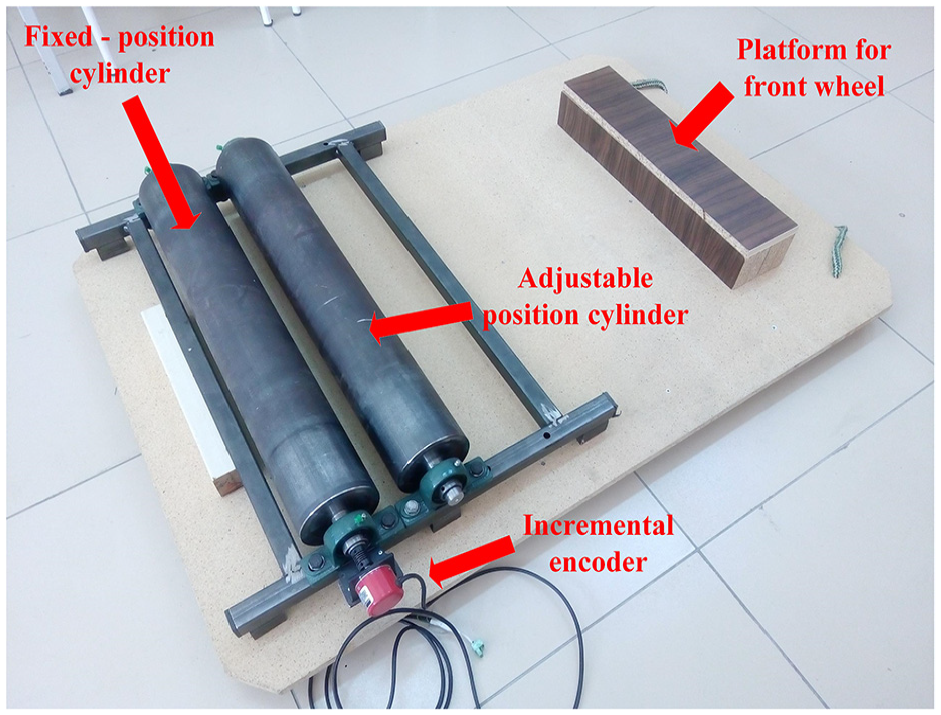
Test platform designed to test the electric vehicle in the laboratory environment.
To prepare the test platform, two cylinders were mounted on an iron shape using roller bearings. Then, an incremental encoder that generates 1000 pulses per revolution was mounted onto this setup to measure velocity. The gap between the wheels was designed as to be adjustable in order for it to fit in with different wheel diameters. Thus, it was ensured that the velocity information of the vehicle and the motor was accessible in vehicles that have different wheel diameters.
A simple circuit board was designed for use in testing the designed test platform and speed measurement algorithm. In this board, in which PIC18F4550 was used, the frequency of the signal, velocity of the motor and the wheel, instantaneous velocity information of the vehicle, and the distance covered until the end of the test were calculated using the signals in the encoder output, and they were written on the LCD screen. The circumference of the cylinder to which the encoder was attached, the circumference of the wheel, and the gearbox rate were taken into consideration while the aforementioned information was being calculated.
Some experiments were carried out at different speeds by changing the reference speed of the motor in the vehicle. In the experiments, the frequency read from the oscilloscope and the frequency read from the circuit board were observed to overlap. The values read from the board and the oscilloscope in one of these tests are shown in Figure 2. When the frequency values of Figure 2 are examined, it is seen that the frequencies read from the oscilloscope and the designed card are 8.81 kHz.
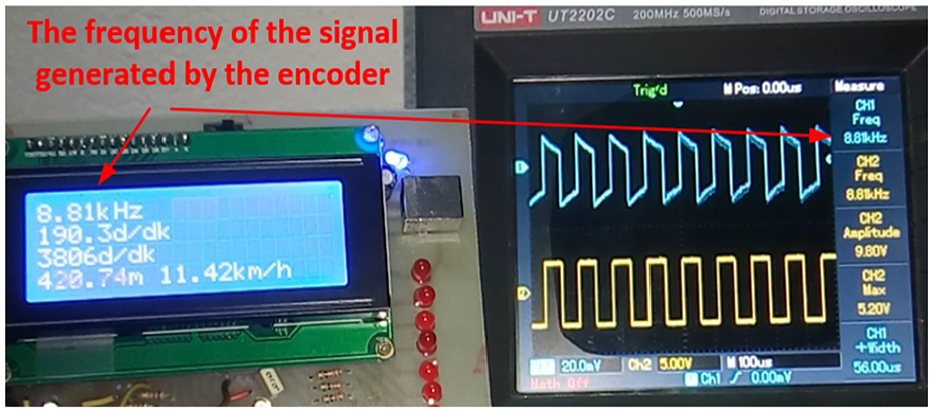
A view of the velocity measurement test conducted using the incremental encoder.
Measurement of battery and motor currents
To measure the current, the current sensor produced by the company named Allegro was selected. This sensor (ACS712) is a current sensor that can take measurements bi-directionally up to 30 A without any problems and is operated at 5 V. These sensors yield analog outputs between 0 and 5 V in proportion with the current. This value is within the range of 2.5–5 V in positive currents, whereas it is within the range of 2.5–0 V in negative currents. Since it can be obtained as a complete module, it will suffice to connect the output of this sensor directly to any analog input of the card where all the data will be read. Because battery and motor currents will be measured, two sensor modules of this type will be used.
Measurement of battery and motor voltages
To measure the voltage, the voltage sensor produced by the company named LEM was selected. Due to this sensor, both insulation is provided and the effect of temperature is minimized. This sensor, which can measure AC and DC voltages and require symmetrical feeding, yields an output current that varies by the magnitude of the voltage in its input. The voltage at the resistor terminals connected to the undervoltage side of this sensor can be connected to any analog input of the microcontroller to be used so that the voltage at the sensor input can be easily measured. Typical connection diagram of this sensor is shown in Figure 3.
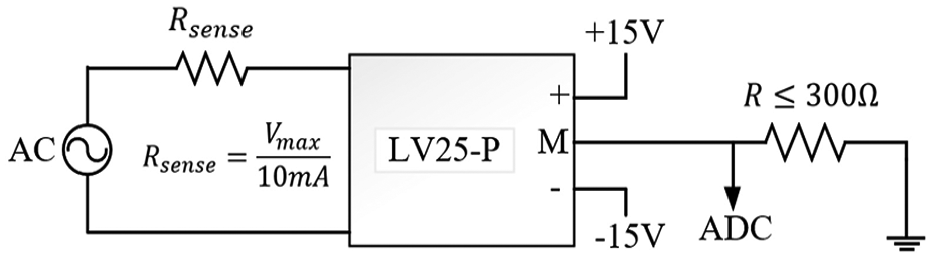
Typical connection diagram of the LV 25-P voltage sensor.
As can be understood from Figure 3, it is necessary to determine the measuring range in the voltage sensor and to design a circuit appropriate for it. Since the voltage level that was intended to be measured in this study would never exceed 30 V, the resistance value to be connected to the high voltage side of the sensor was determined accordingly. In addition, since the voltage sensor needed symmetrical feeding, it was deemed a better choice to design the circuit to be used for measuring voltage as a separate card. Two such sensors were used to read the voltages on the battery and motor terminals. The electronic card designed and produced taking into account the aforementioned considerations is shown in Figure 4.
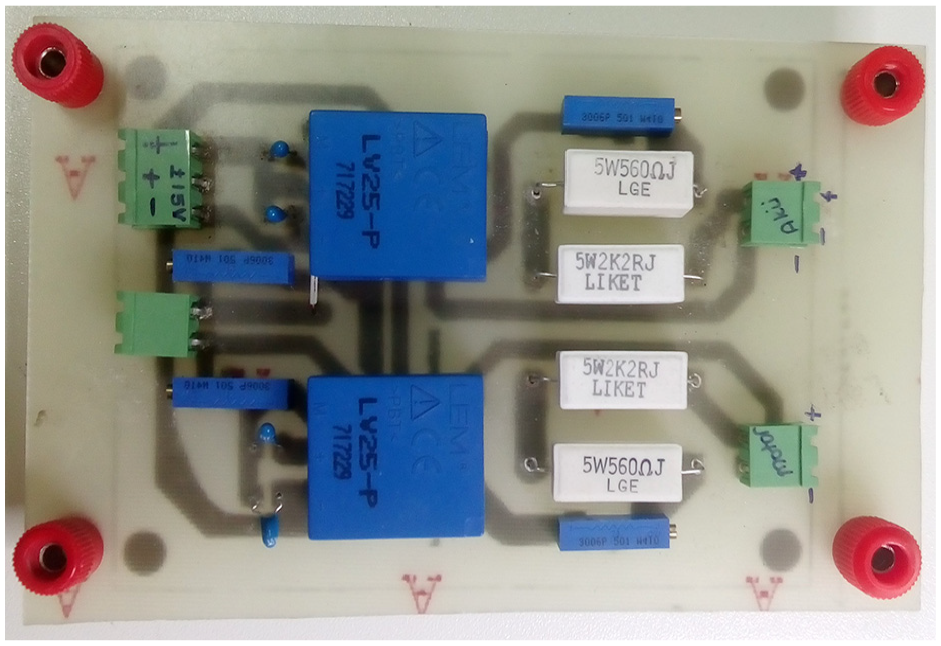
The circuit card designed and implemented to measure voltage.
The temperature sensors produced by the company, Dallas Semiconductor, were used to measure the test environment temperature and motor surface temperature.
Data acquisition card
An electronic card is designed to read two voltages, two currents, two temperatures, and one speed information. The card will allow the data to be viewed both on the LCD screen and transferred to the computer via USB in real time. PIC18F4550 was chosen as the microcontroller, and it is operated at 48 MHz. The current and voltage values were determined by sampling 1000 times. The temperature measurement was made instantaneously outside the current and voltage loops. Timer interrupt of the microcontroller was used to measure velocity. According to this number of sampling, the time needed for all the data to be read, evaluated, and transferred to the computer was 375 ms. The electronic card that was designed and implemented to perform these procedures and the flow diagram that summarizing the measurement algorithm of the microcontroller are given in Figures 5 and 6, respectively.
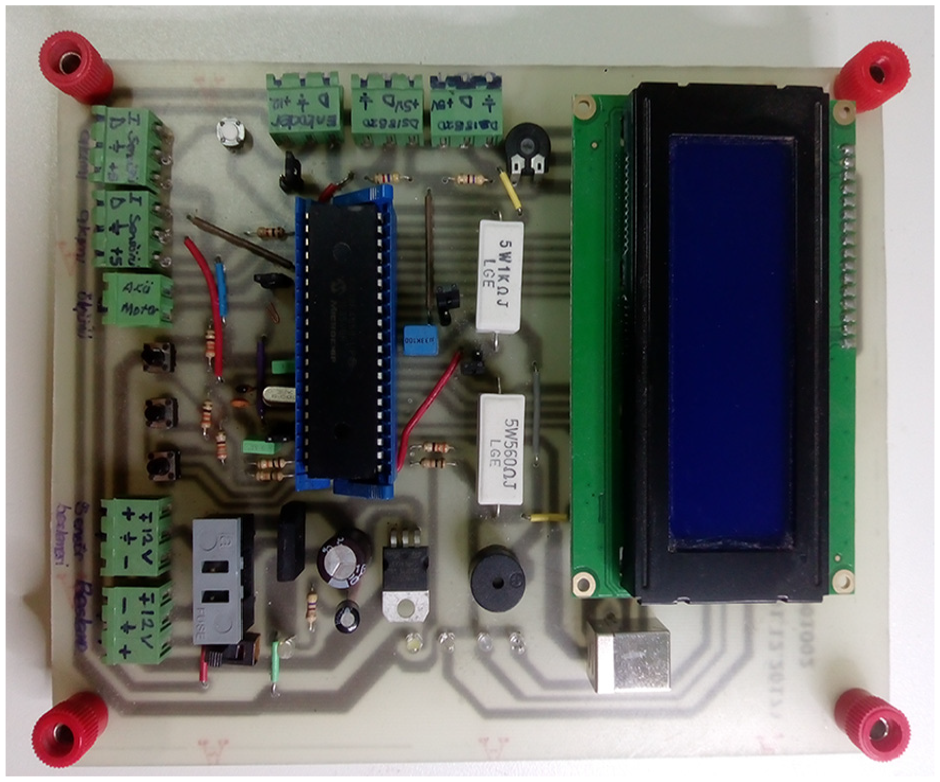
The data acquisition card designed and implemented to read and transfer the data to the computer.
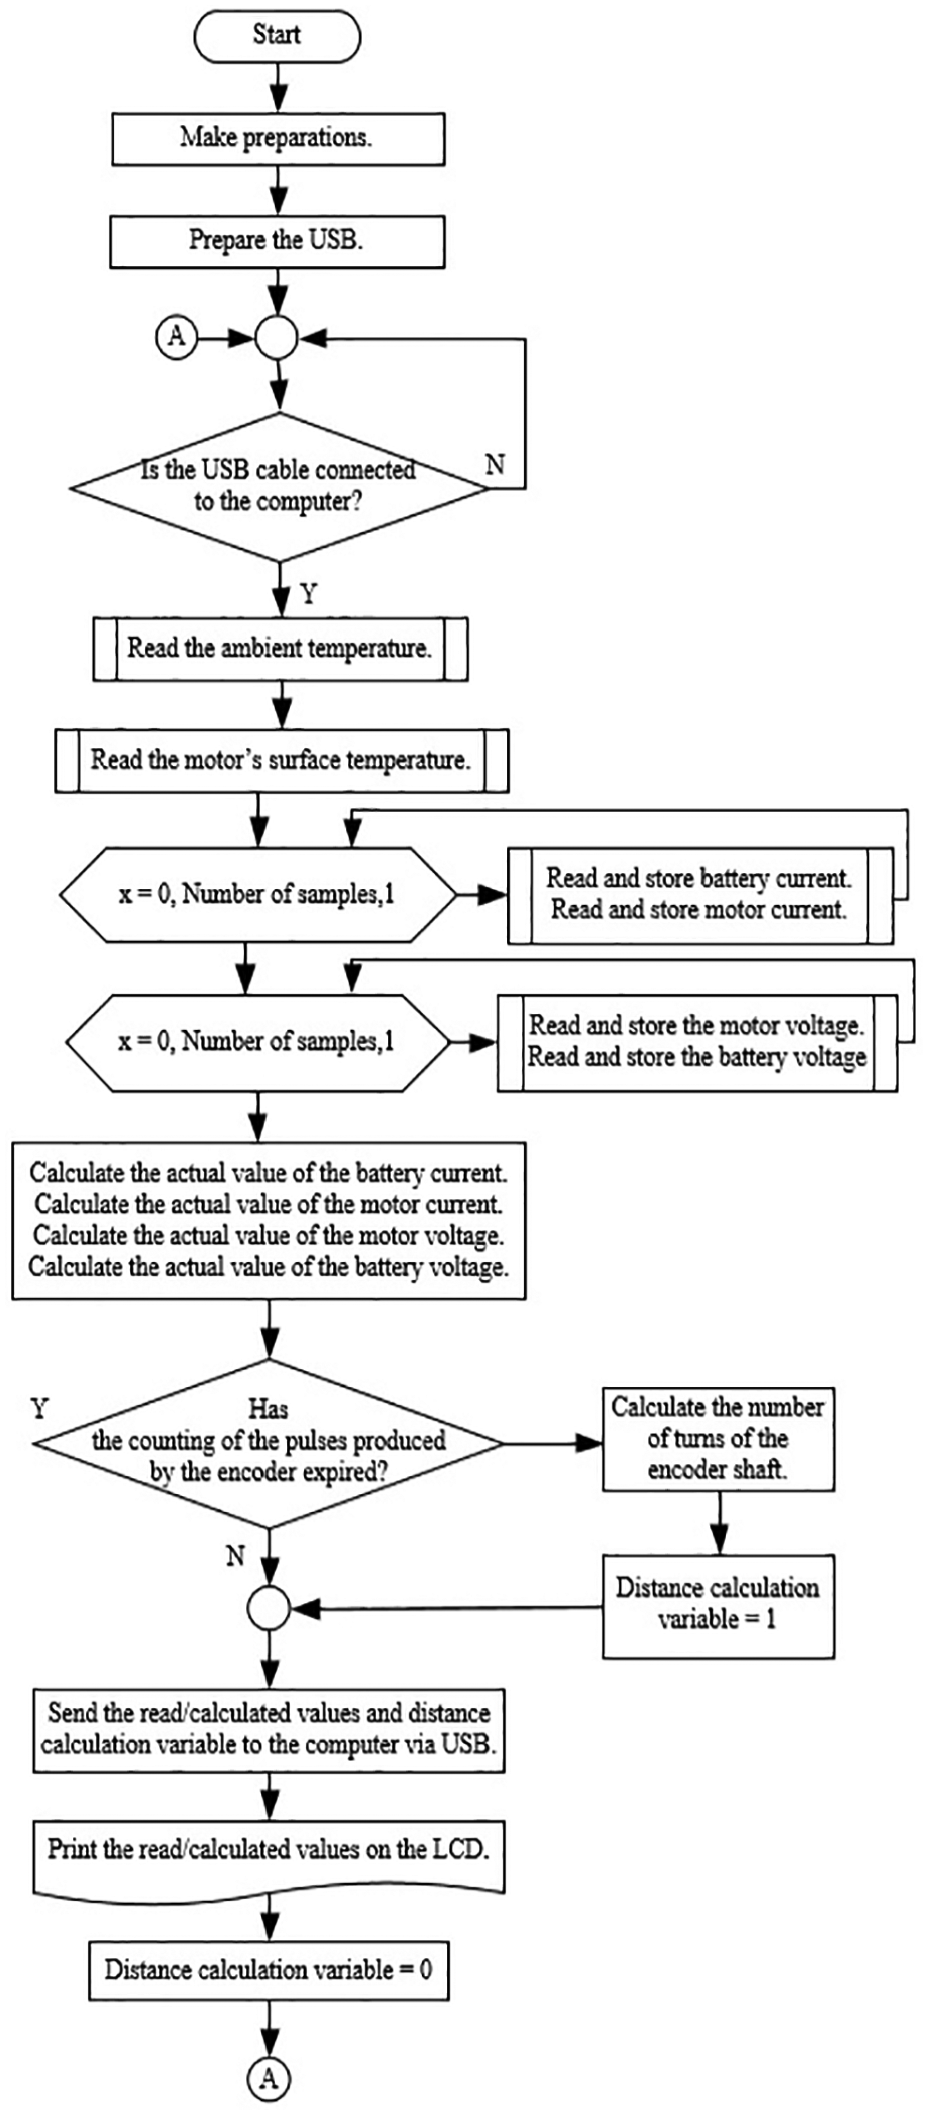
The flow diagram summarizing the measurement algorithm of the microcontroller.
Data reading interface program
An interface was designed on Visual C# program to receive the data to be sent by the data acquisition card, display them on the computer, store them, and get some necessary data to be drawn on the screen graphically and simultaneously. This system to be implemented needs to be designed in accordance with models that have different powers, different wheel circumferences, or different gearbox rates. The interface section involving the parameters that need to be entered in the design is given in Figure 7.
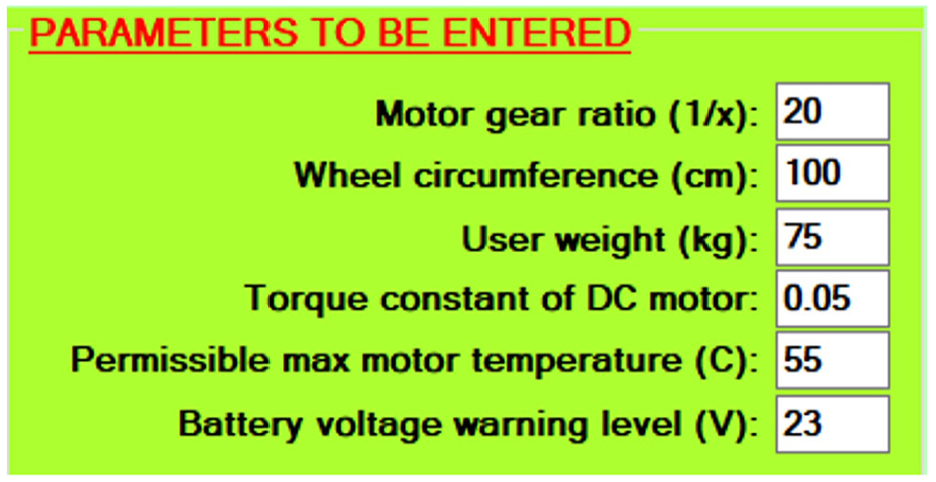
The interface section involving the parameters that need to be entered in the design.
In the meantime, battery voltage warning level can be determined to protect the battery from deep discharge or to observe the process until the battery voltage drops to a certain value. When the battery voltage drops to this value that was entered, the operator is warned with a voice warning. In addition, a permissible maximum motor temperature section was added in order to prevent the motor from overheating or to observe the process until the temperature reaches a certain value. Moreover, it was enabled to enter the weight information of the person who sat on the vehicle during the experiment so as to investigate the effect of user weight on the parameters measured. A torque sensor needs to be used to be able to calculate the torque of the motor and some parameters connected with it. However, the motor is directly connected to the gearbox in these vehicles. Therefore, placing a torque sensor between the motor and the gearbox is quite a tiresome and unnecessary operation. Using the torque constant in place of it is much more practical method. Because permanent magnet direct current (PMDC) motors are used in these vehicles. The torque generated by these motors is equal to the result of the multiplication of armature current by torque constant. Therefore, it will suffice to multiply the instantaneously measured motor current by the torque constant known beforehand to calculate the torque that the motor will generate. For this reason, the torque constant value of the motor on the vehicle was added to the parameters to be entered.
Knowing where the current and voltage sensors are connected in the designed system will be useful in explaining the method of calculating some parameters in the interface. An explanatory schema concerning this is shown in Figure 8.
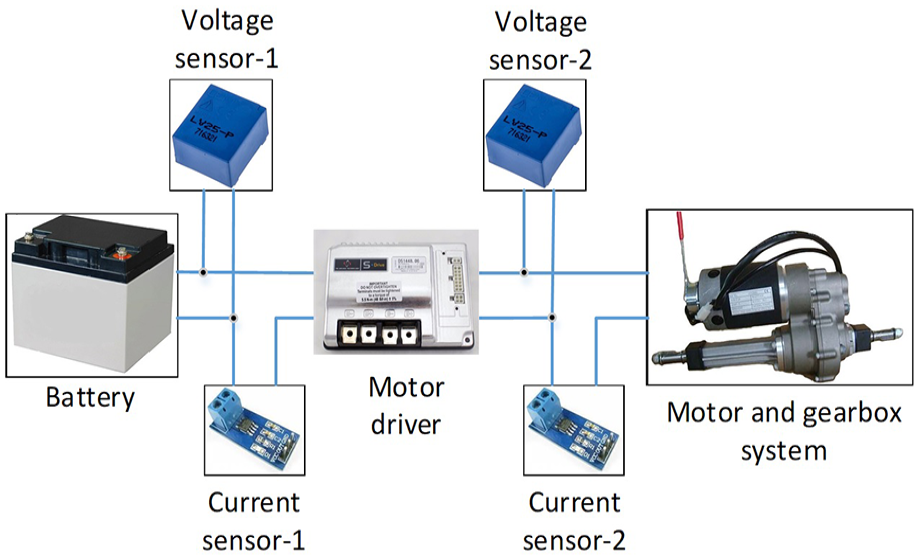
Positions of current and voltage sensors in the designed system.
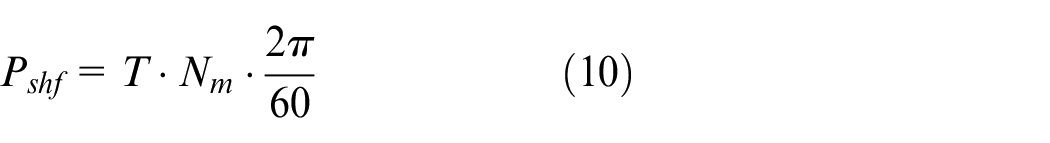
In the interface designed, the motor speed, the torque generated by the motor, the shaft power of the motor, motor and driver efficiency, the instantaneous velocity of the motor, and the total distance covered information from the moment the vehicle began to be used are calculated, as it was stated before, by seven quantities measured instantaneously throughout the test process. Since the motor speed plays a key role in the calculation of the other parameters, first this quantity needs to be calculated. However, in order to be able to calculate the motor speed, firstly wheel speed needs to be calculated. The wheel speed is:
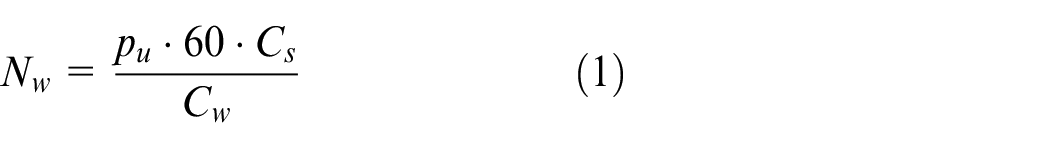
In the equation,

If it is remembered that the encoder used generates 1000 pulses at one revolution, the one-thousandth of the total number of pulses that the encoder will generate in a second will be equal to the number of revolutions in a second of the cylinder to which the encoder is attached
Current total distance covered is obtained by adding the distance covered in a second to the total distance covered until then

Consequently, the instantaneous velocity of the vehicle in km/h is

Since the motors used in such vehicles are PMDC motors, torque constant

The power flow diagram for situations when electric equipment other than the motor and the driver (headlights, horn, right/left indicators, etc.) on the wheelchair is not used is shown in Figure 9.
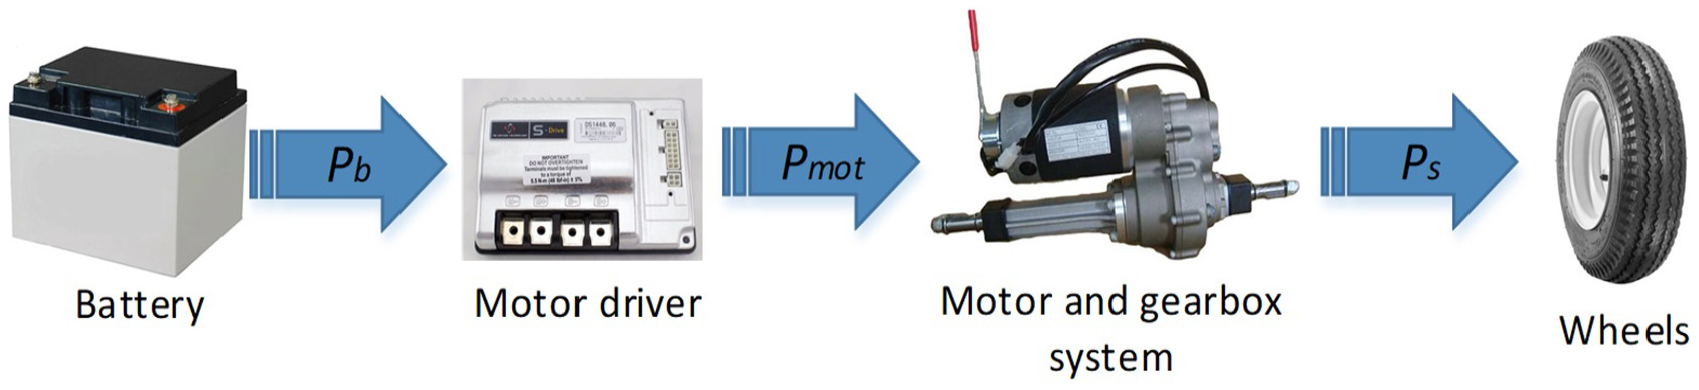
Power flow diagram for cases when electric equipment other than the motor and the driver is not used.
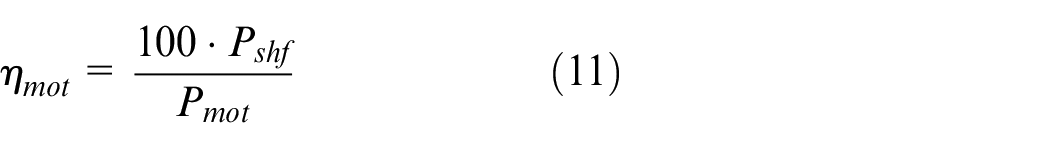
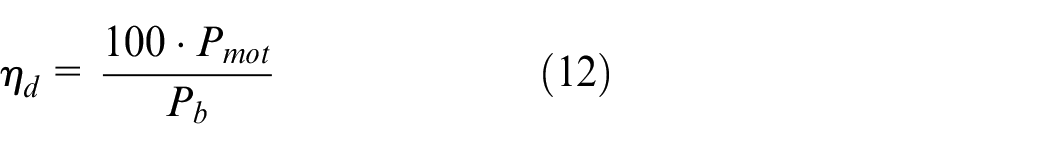
As can be understood from the power flow diagram, in order to be able to calculate motor efficiency


In the equation,
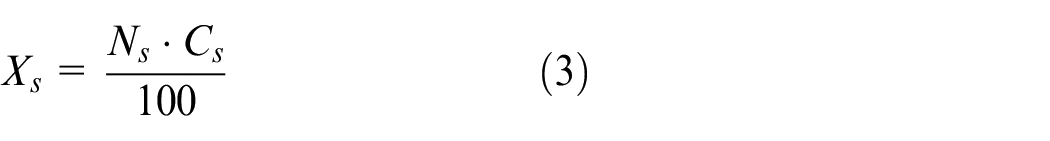
All these data measured and calculated are both recorded instantaneously in the relevant section in the interface and at the same time registered in a table created in the interface so as to allow examining in the future. All the data in this table can be automatically transferred to Excel if desired. The flow diagram of the algorithm used in the designed interface is given in Figure 10.
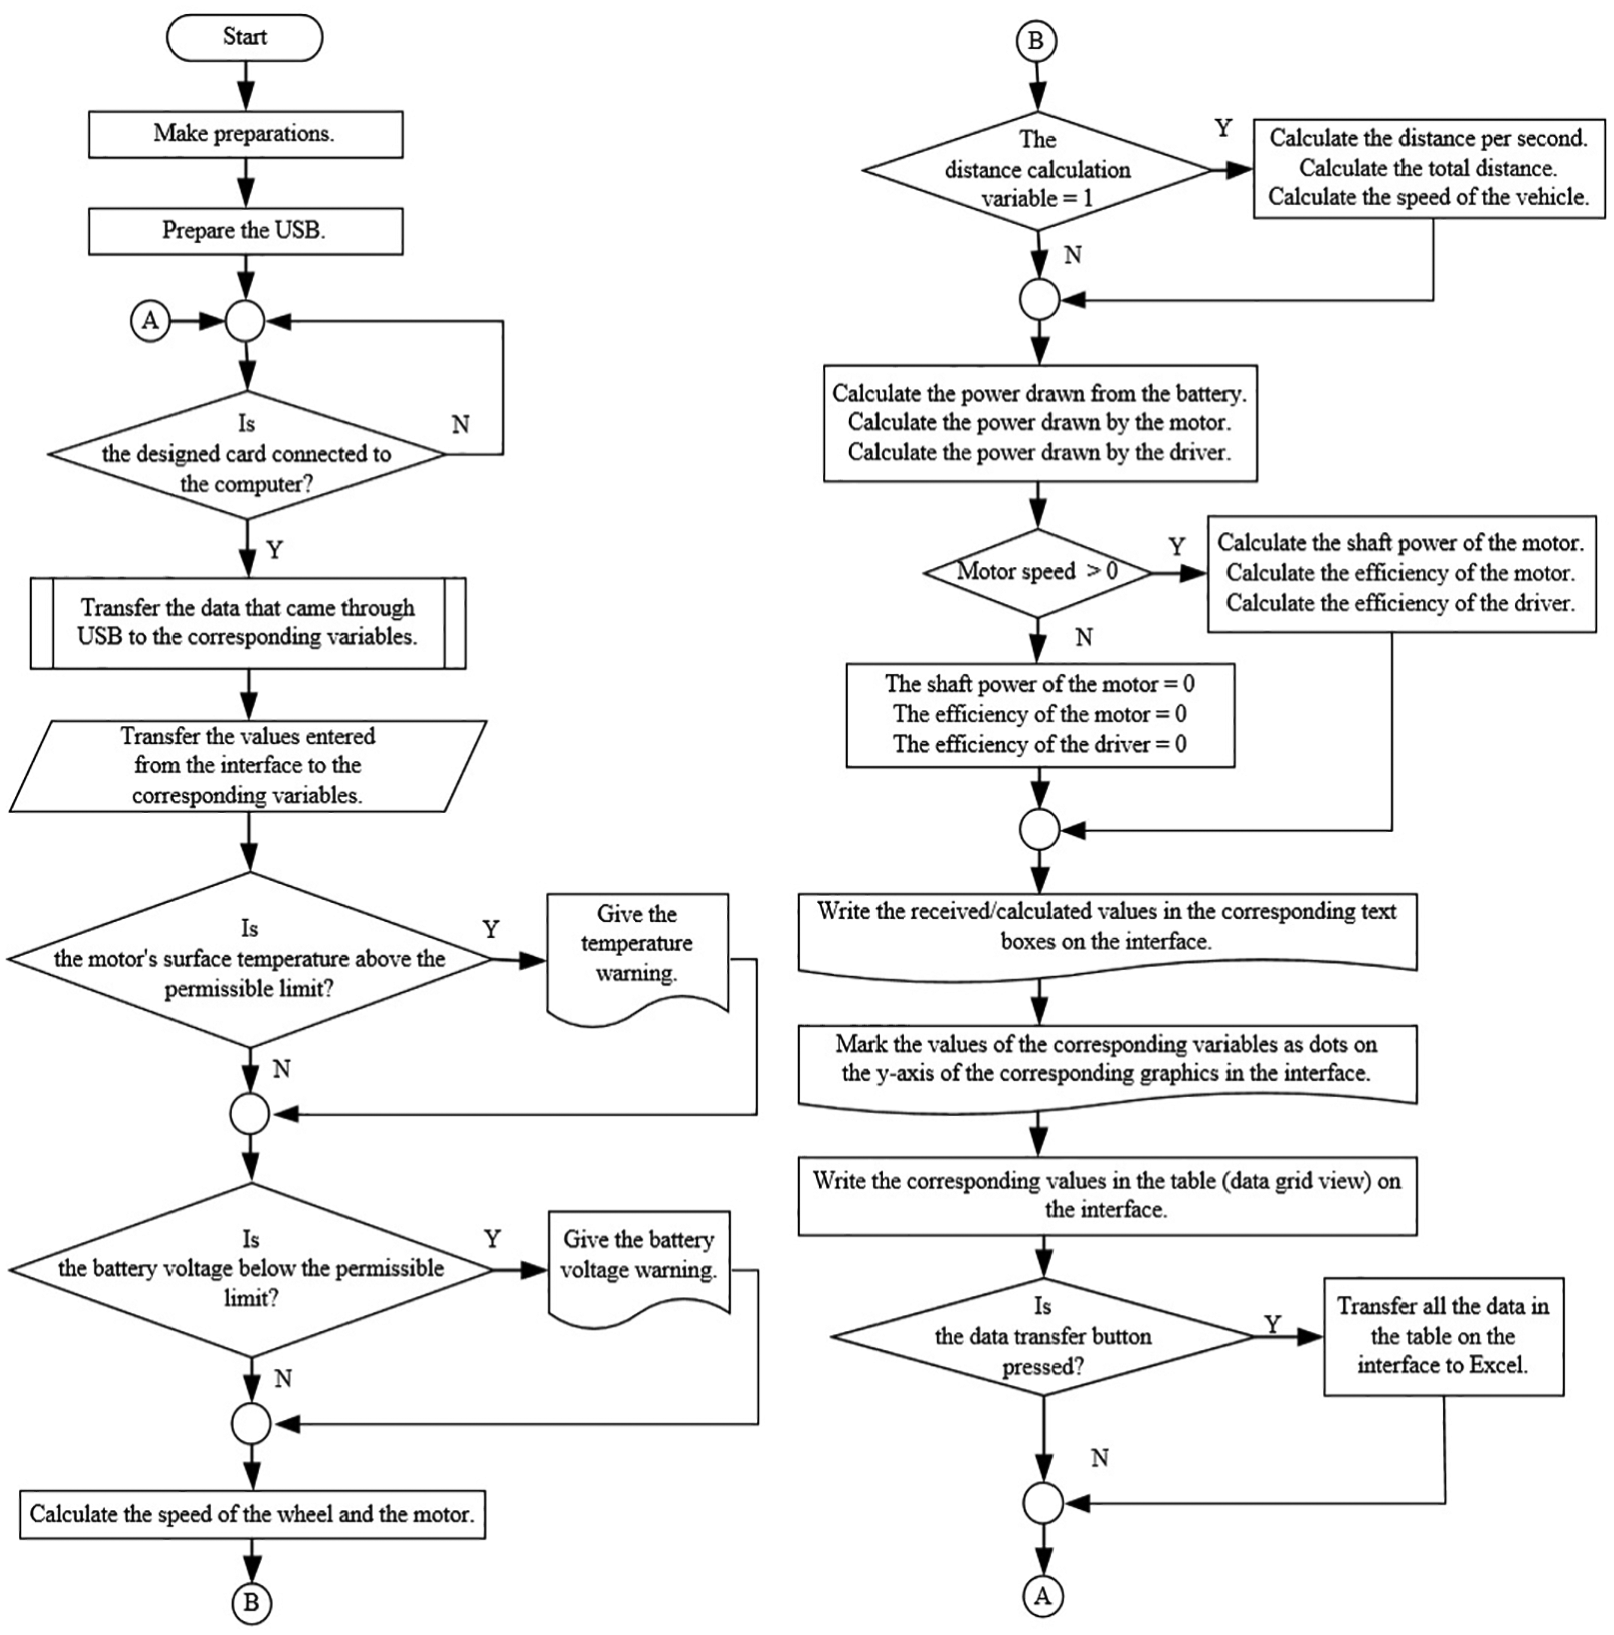
The flow diagram of the algorithm used in the designed interface.
All the data that were measured and calculated are shown in the interface until the next data arrive. The screenshot received from this section of the interface during a sample test is given in Figure 11.
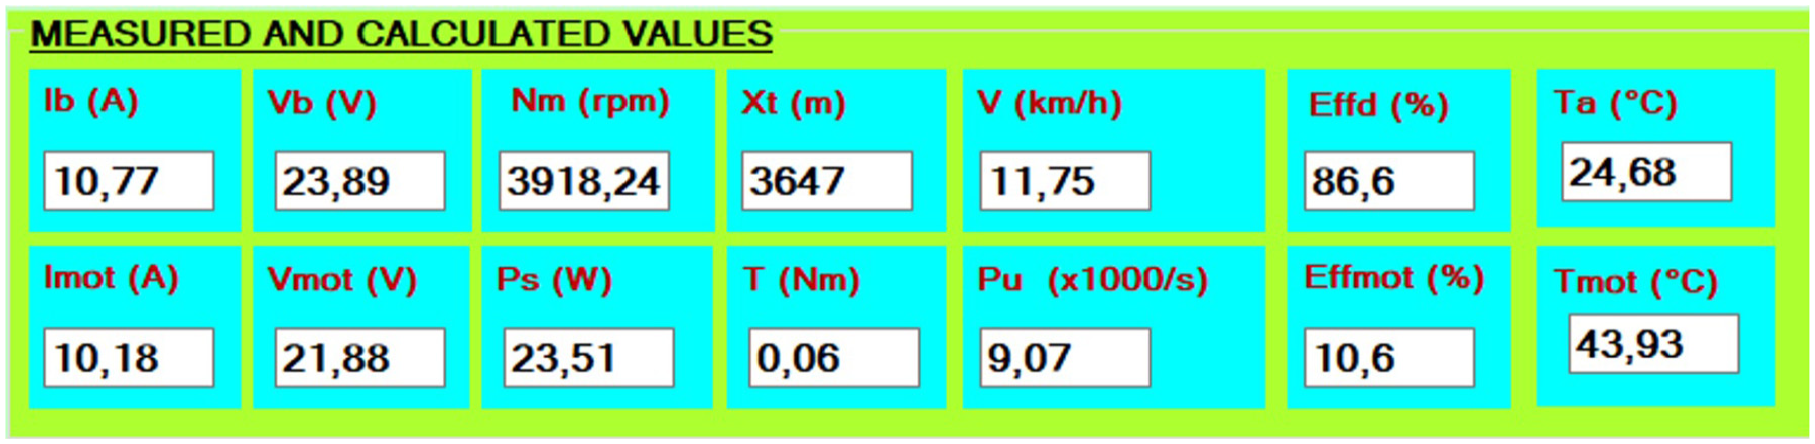
The section where all the values that were measured and calculated are shown until the next data arrive.
Graphic demonstration was also resorted in order to better see the change in the same quantity during the test and examine it. Ten of the 14 quantities measured and calculated were grouped among themselves and presented in six graphs. In these graphs, which were drawn simultaneously, the data are on the y axis whereas the data numbers are on the x axis. The screenshot of the designed interface program before it is connected to the data acquisition card is given in Figure 12. Since graphs begin to be drawn after the data acquisition card is connected to the computer, no graphs can be seen in Figure 12.
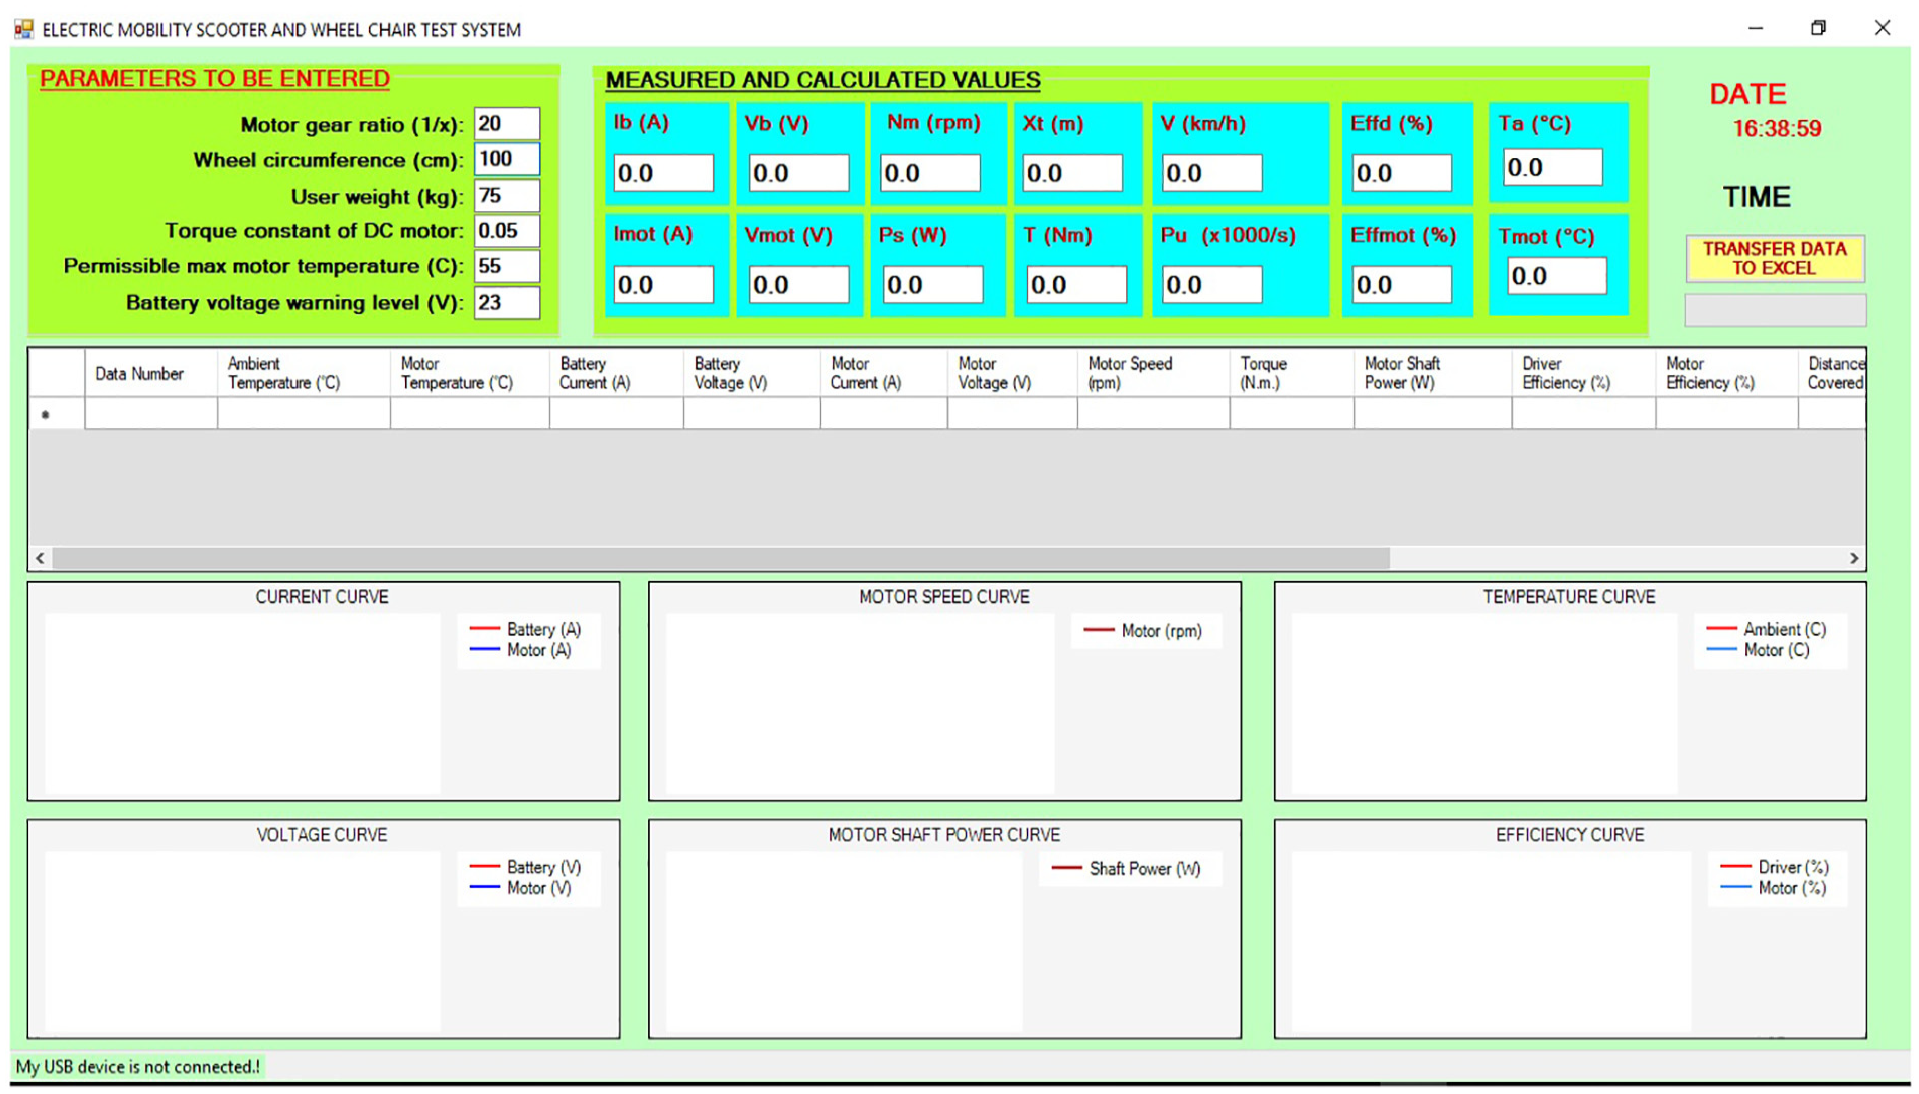
The screenshot of the designed interface program before it is connected to the data acquisition card.
Testing of the designed system on an electric mobility scooter
The efficiency of the designed system was tested on an electric mobility scooter. The scooter used in the test meets the needed electric energy from two batteries connected in series with 12 V-33 Ah values. The PMDC motor on the scooter is 24 V and has a shaft power of 750 W. The operating voltage of the driver that enables control of the scooter is within the range of 16–28 V. The driver drives the motor with a PWM signal of 20 kHz. The velocity of the scooter can be adjusted as desired with a potentiometer under the control of the user. Pictures taken during the testing of the system are shown in Figure 13.
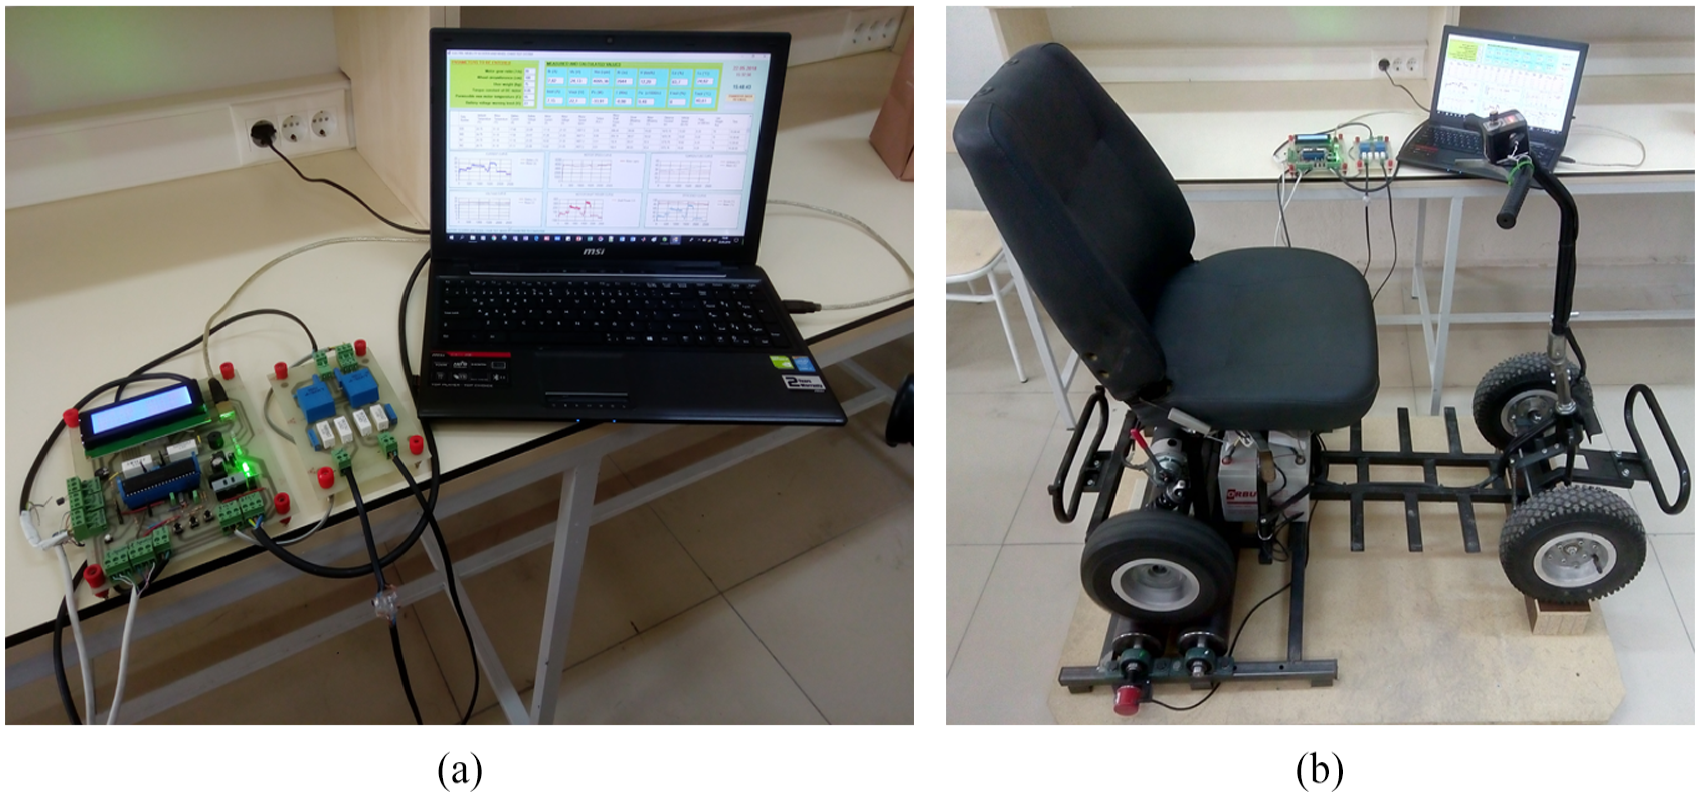
Pictures of the designed system taken during its testing on an electric mobility scooter: (a) the cards designed and the computer to which the data were transferred and (b) the vehicle on the test platform.
Loads having different weights were placed on the vehicle seat to be able to better see the changes in the current and other parameters during the test. The weight of each load was between 20 and 35 kg. These loads were loaded using different numbers and combinations. The maximum value of the load on the vehicle was 230 kg. Placement of the loads on the seat was performed while the vehicle on the test platform was running at maximum speed.
The screenshot taken during the test procedure is given in Figure 14. However, the screenshot after the data were transferred to Excel is given in Figure 15.
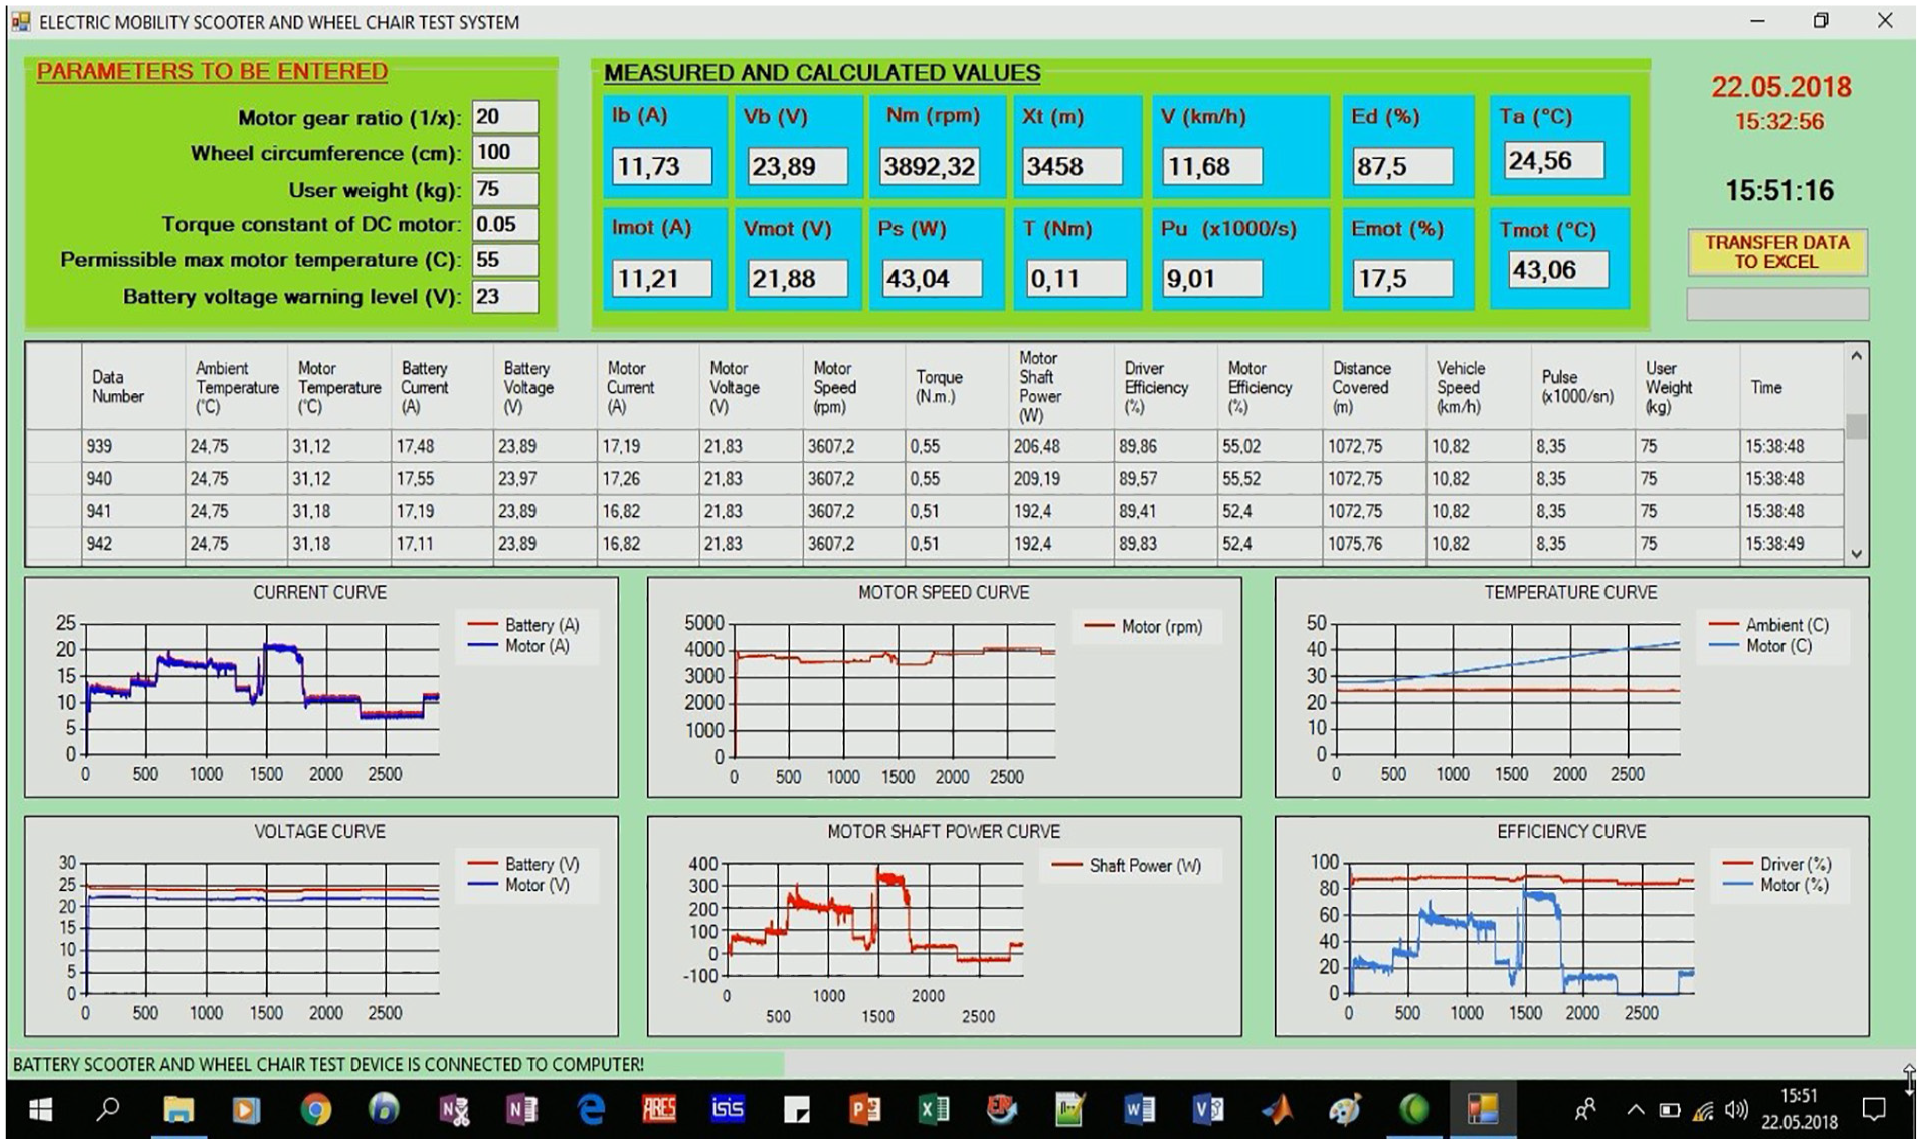
The screenshot of the designed interface program during a sample test procedure.
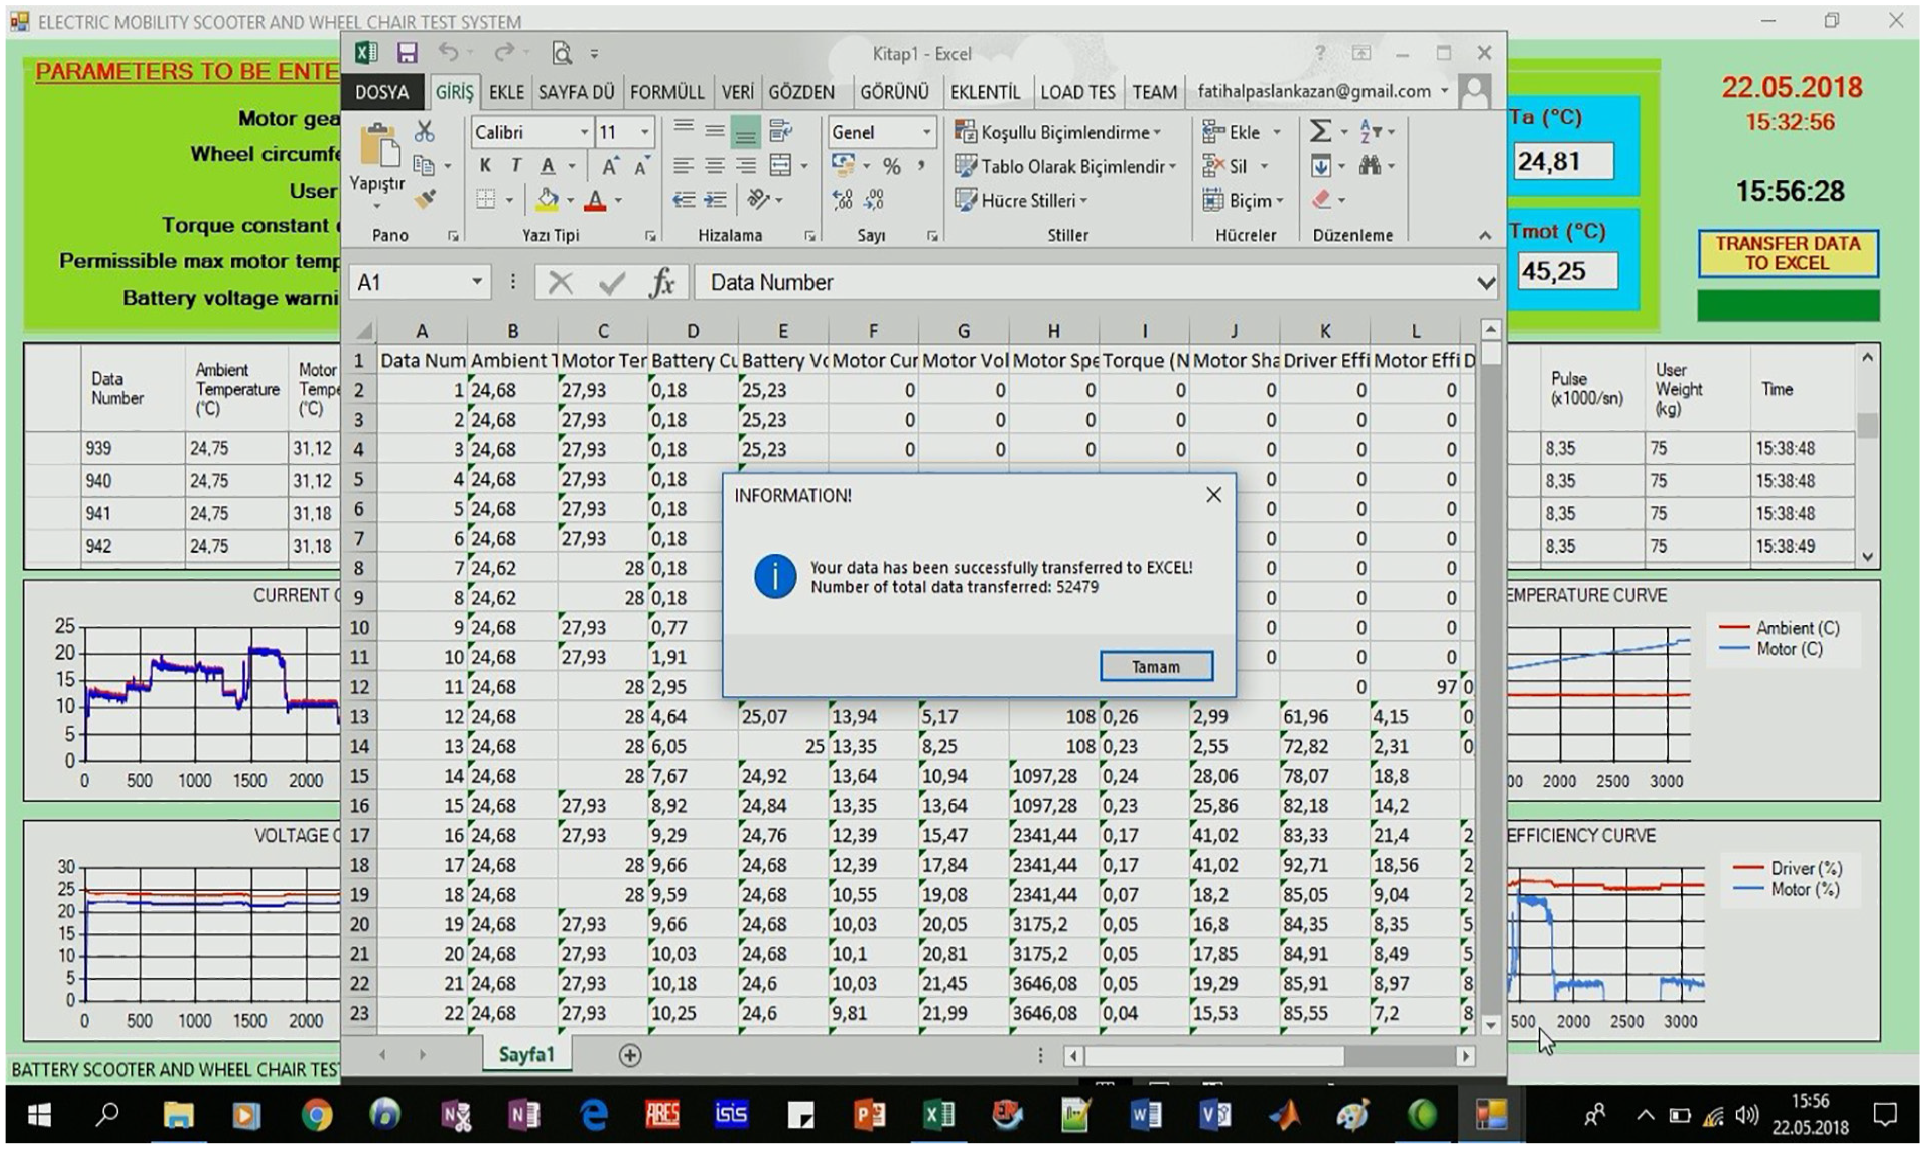
The screenshot of the designed interface program after the data were transferred to Excel.
Graphs can be drawn using different programs for a detailed examination and analysis after the data have been transferred to Excel. Since all the data are transferred to Excel in different columns according to data number (Figure 15), the graphs of the desired data can be drawn differently from the groupings in the interface. To demonstrate this, various graphs were drawn in MATLAB using the data in Figure 15. For example, the curve belonging to the battery and motor currents drawn using the transferred data are shown in Figure 16. When this curve is examined, it is seen that it is exactly the same as the current graph seen in the interface in Figure 14.
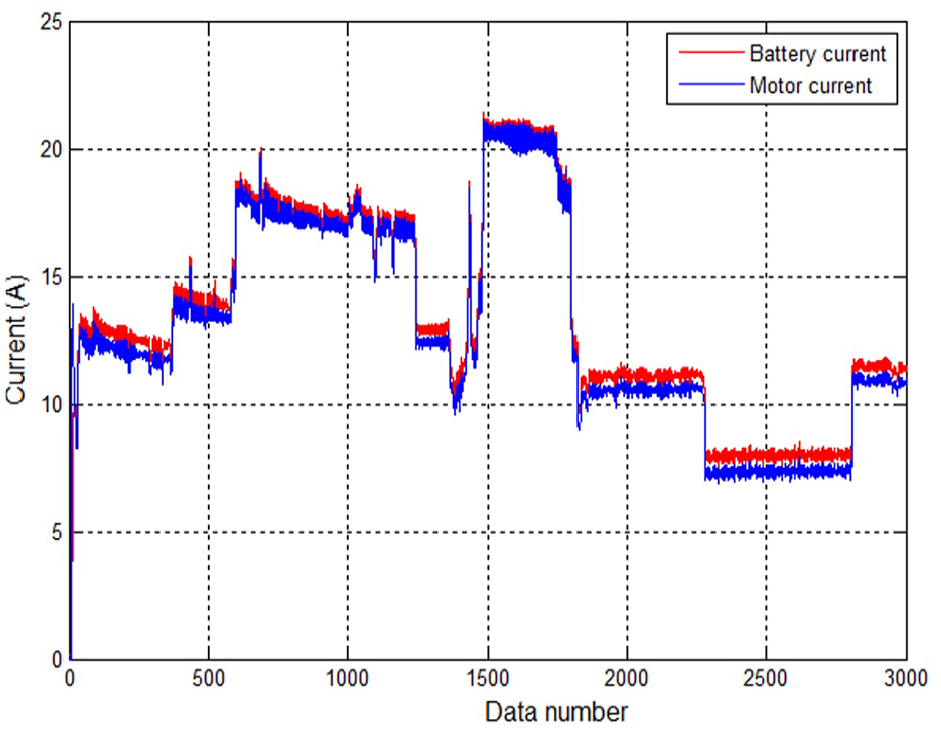
The changes in battery and motor currents throughout the test (drawn using the data transferred to Excel).
A close look at Figure 14 indicates that the currents and the voltages are given in different graphs in the designed interface. However, changes in the currents and voltages can be drawn in the same graph using the transferred data. Therefore, the effect of sharp increases or decreases in the current drawn from the battery on the battery terminal voltage can be easily examined. The graph drawn to this end is given in Figure 17.
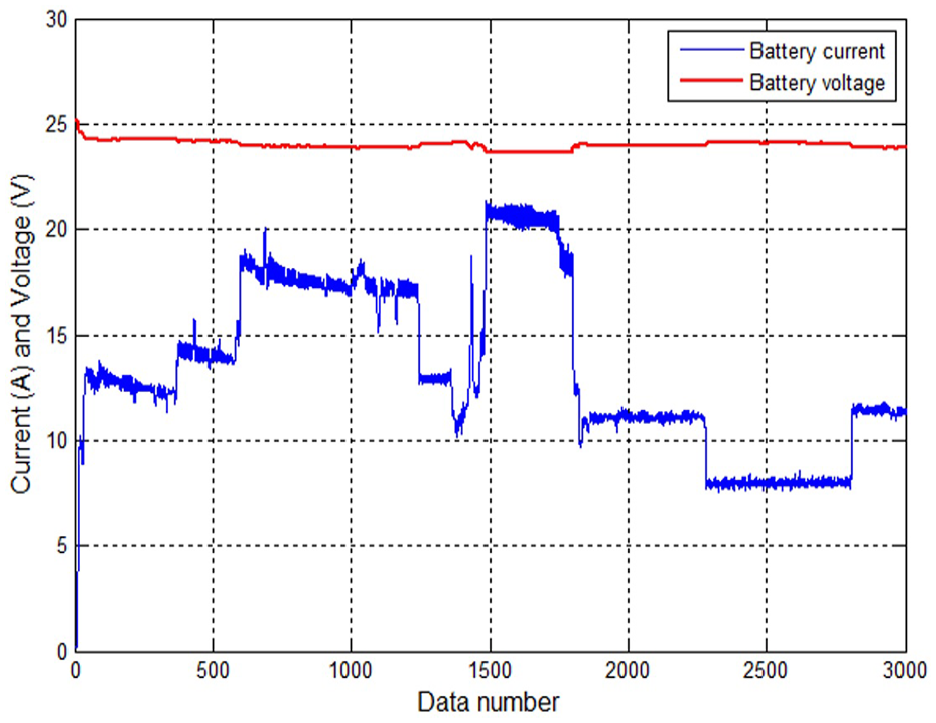
The changes in the battery current and voltage throughout the test (drawn using the data transferred to Excel).
Dimensions of the graphs were kept constant in order to render the designed interface as clear and useful as possible. However, graphic change in any quantity at a certain phase of the test can be easily examined thanks to the transferred data. To illustrate this, the variation of the motor shaft power curve in Figure 14 is shown in Figure 18 by redrawing the variation between the data 300 and 1200.
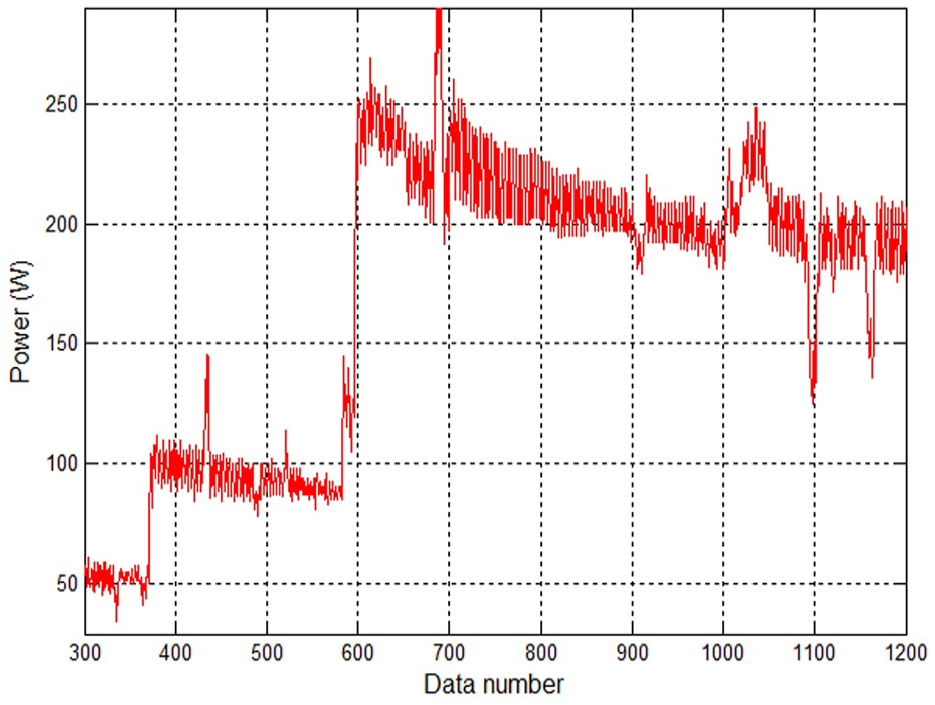
The change in the motor shaft power between the 300th and 1200th data (drawn using the data transferred to Excel).
Quantities that were not calculated in the interface or whose graphs were not drawn can be easily calculated using the data that were transferred. For example, the relationship between motor voltage and motor velocity during the acceleration of the vehicle can be observed easily in the graphs drawn using the same data number range. Or, when the load on the vehicle is suddenly changed, if one is to make a detailed analysis of the reaction of the vehicle velocity to that load, it will be sufficient to have graphs of user weight and velocity belonging to the relevant data range. For example, power losses on the motor and the driver were not calculated in the interface. Therefore, no graph of it was drawn concerning their change during the test. However, this is possible thanks to the data transferred to Excel. By subtracting the motor shaft power from the motor input power, the lost power in the motor can be calculated. If the power lost in the driver is to be calculated, it can be calculated by subtracting the power drawn by the motor from the power drawn from the battery. If total loss is desired, it is sufficient to sum motor and driver losses. The graph of these losses is given in Figure 19.
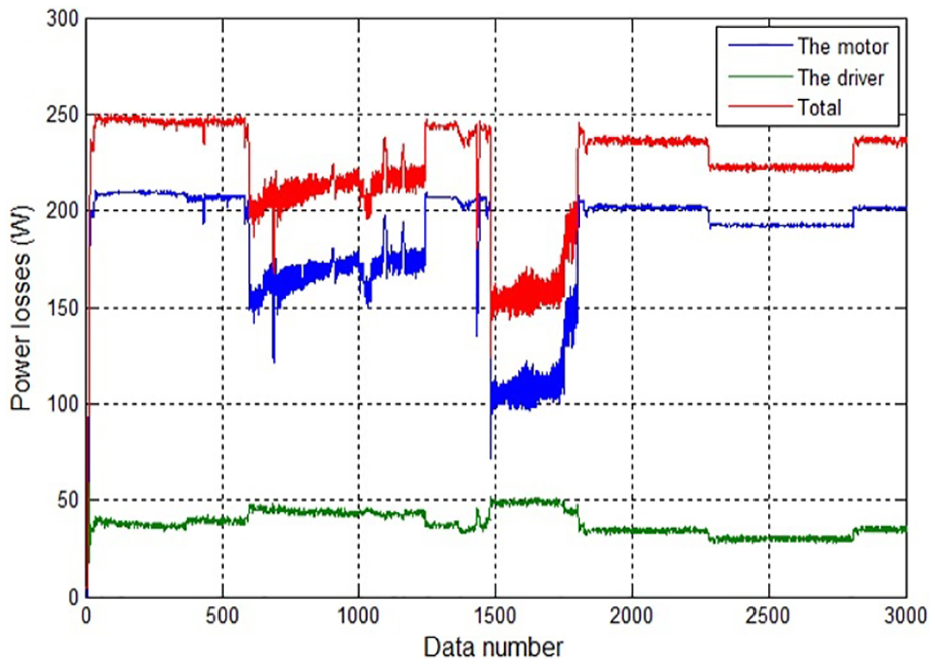
The changes of power losses on the motor and the driver throughout the test (drawn using the data transferred to Excel).
Conclusion
In this study, a test setup was designed aimed at electric mobility scooter models used by disabled or old people. In this system, which was implemented at a very low cost, seven quantities, namely, battery and motor currents, battery and motor terminal voltages, wheel speed, and ambient and motor temperatures, were measured instantaneously using the designed data acquisition card and transferred to computer environment via a USB. Using these data that were transferred, motor speed, torque generated by the motor, motor shaft power, motor and driver efficiency, instantaneous velocity of the vehicle, and total distance covered information obtained from the moment the vehicle began to be used were computed in real time throughout the experiment, and their graphs were drawn and recorded. Using this design, the following can be examined in the electric mobility scooter models for disabled people:
Current and voltage changes in the battery and the motor at different loads and speeds.
The effect of user weight on the distance to be covered by the vehicle.
The behavior of the vehicle on roads with different slopes by bringing the test platform to desired slope (current, shaft power, power losses, torque, velocity, distance covered).
The effect of user weight on the heating of the motor and motor/driver efficiency.
The effect of ambient temperature on motor heating.
The effects on currents of user’s bending forth or back or changes in center of gravity due to various reasons.
In the event that the motor current and consequently the motor temperature increase abnormally, the system gives an audible fault warning. The graphs of the measured parameters can be evaluated by an experienced technician and the cause of the fault can be determined in more detail. In addition, in battery-operated wheelchair, each motor can be tested in turn and fault detection tests can be conducted concerning the motors of those models.
Footnotes
Declaration of conflicting interests
The author(s) declared no potential conflicts of interest with respect to the research, authorship, and/or publication of this article.
Funding
The author(s) disclosed receipt of the following financial support for the research, authorship, and/or publication of this article: This study was part of the project supported by Selçuk University Scientific Research Projects Coordination Office. The project number is 17101008.