
Abstract
Velocity distribution of vertical pipes with large particle slurry plays an important role in pipeline transportation of minerals in hydraulic coal mining and ocean mining industry. The experiments of particle fluidization and particle vertical lift are conducted and the fluidization data of three kinds of large particles are analyzed. The results show that the vortex resistance prevents particles from moving as the coarse particles move in vertical pipes. An additional coefficient method is proposed to study the vortex resistance by increasing the coefficient of vortex resistance before interference. Mathematical model is established to describe the drag coefficient of the vortex by analyzing the influence factors of the experimental data and the drag coefficient of the vortex. In addition, calculation model of the velocity distribution of large particles in vertical pipe is proposed by analyzing the force, the fluid, and the solid momentum. Moreover, the experimental data of particle transport in vertical pipes are utilized to verify and analyze the proposed model.
Introduction
With the development of marine mining technology, some progresses in hydraulic transportation technology of coarse particle slurry in pipeline have been made in recent years. Moreover, the theory of coarse particle slurry in pipeline has also been widely applied in hydraulic coal mining, river silting, dredging and filling engineering, and tailing transportation. The calculation formula of the blockage velocity during vertical pipeline lifting has been studied by Jiang et al. 1 and results indicate that the blockage velocity can be influenced by liquid, solid density, and the ratio of the maximum particle size to average particle size. Tian et al. 2 investigated the concentration characteristics of large size particles during vertical hydraulic lifting by applying dispersion equation. Meanwhile, pipe-wall friction in vertical slurry pipe for several large sands has been studied by Matousek. 3 Moreover, influence factor during lifting efficiency of coarse particles was studied by Pan et al. 4 Song et al. 5 studied the factors affecting the slip velocity of nodules in the elevating pipeline and on this basis, the formula for calculating the slip velocity of nodules in the vertical pipeline was given through data fitting. Many scholars used FLUENT software to simulate and analyze the velocity distribution of polymetallic sulfide or gas hydrate particles in vertical pipeline.6–9 However, the velocity distribution characteristics of large particle slurry in vertical pipeline are still unclear. In this study, particle fluidization experiment and particle vertical lift experiment were conducted to investigate large particle slurry flow in vertical pipe, revealing forces acted on large particle and its influence on particle velocity distribution.
Measurement of large particles movement in vertical pipe
The experiments of vertical pipe slurry consist of two parts, including particle fluidization experiment and particle vertical lift experiment. The experiments were conducted in a closed ring-shaped pipeline (Figure 1). During the experiment, particle size was invariable due to the fact that the particles did not pass through the pump.
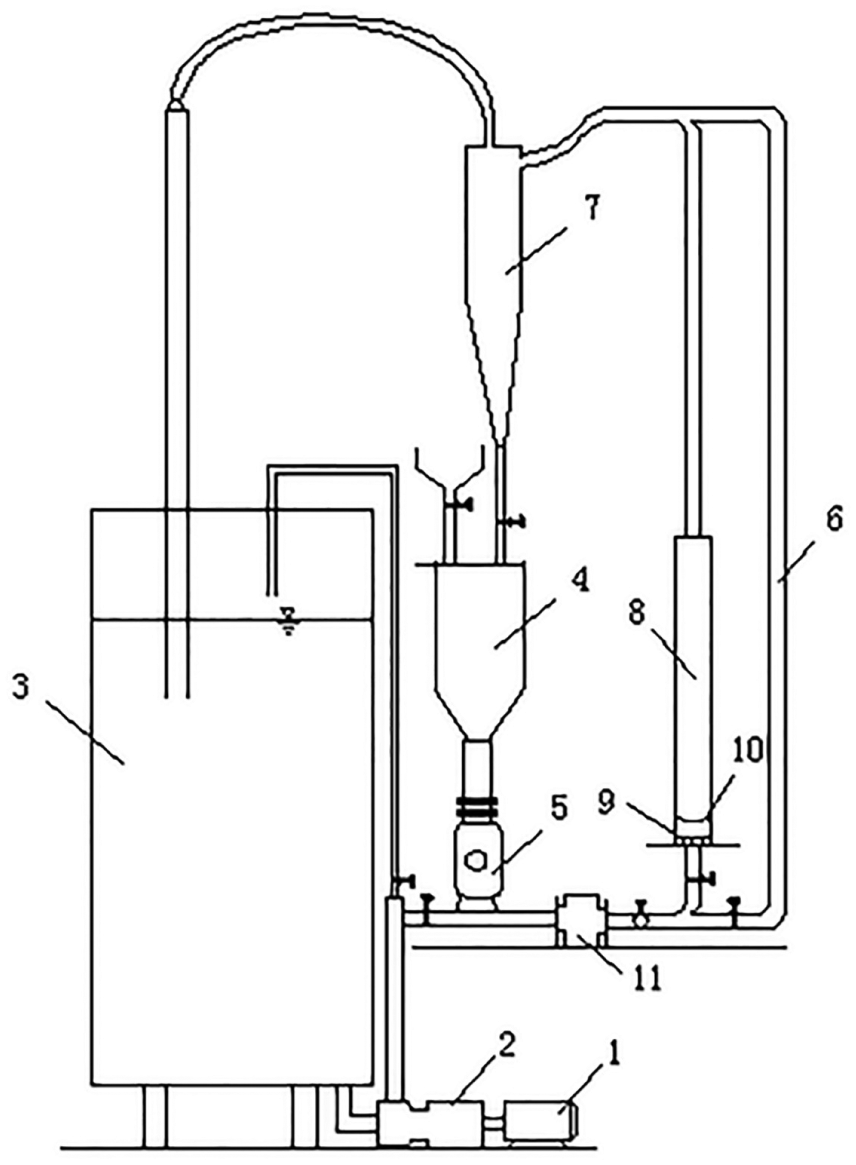
Schematic drawing of experimental device.
Fluidization experimental tube section is shown in section 8 of Figure 1. The diameter and length of the acrylic glass pipe are 0.1 and 2.5 m, respectively. The solid particles of quartz glass spheres are placed on the metal screen in the lower part of the pipe, with a distance 200 mm from the 200-mm-thick permeable foam layer. The height of the foam is 200–300 mm. The initial granular layer thickness of 5, 15, and 25 mm is 80, 93, and 104 mm, respectively. In fluidization experiment, the maximum height of bed is no more than 1.8 m. Pump speed and mean velocity Vm in pipe can change continuously by using variable frequency motor 1. The velocity of water flow is low at initial stage of the experiment, resulting in static state for most particles. The particles change to active state as the flow velocity exceeds the fluidization velocity. It means that the flow state changes from granular bed to movable bed. The suspended layer height at different velocity of flow can be recorded, thus the velocity of particles at suspended state can be calculated until the particles are filled with the whole glass pipe. Each group fluidization test maintains stable flow at least 20 min and records the corresponding height of solid particles, and the average velocity can be obtained from repeating above processes for three to four times. In the test, quartz glass spheres with diameter of 5, 15, and 25 mm were utilized and the density ranges from 2179 to 2182 kg/m3. The mean volume concentration Cv ranges from 3% to 30%. Fluidization experimental data can be seen in Figures 3 and 4.
The inner diameter of the pipe was 36 mm, and the quartz glass spheres (density: 2180–2185 kg/m3) with particle size of 3.7–4.0 mm, 5.1–6.4 mm, and 7.3–8.5 mm were used for hydraulic lift pipe section 6 in Figure 1. The motion picture of the particles was photographed with high-speed photogrammetry and then processed using MATLAB software; the image processing includes image extraction, image calibration, transforming into grayscale images, grayscale enhancement, thresholding, particle matching, and so on. 10 As the particle reaches the stability condition, the velocity in vertical direction is almost stable, but the horizontal direction presents periodic motion characteristics. In this study, only velocity in the vertical direction was investigated. In the two adjacent images, the velocity of the solid particles can be obtained from the ratio of the axial displacement of the particles to the interval of the shooting time.
Theoretical analysis of experimental data
It has been acknowledged that four forces exist on a solid particle in fluidization experimental pipe, 11 including gravity of solid particle (fG), the buoyancy of fluid to particle (fB), resistance from liquids (fDi), and interference force (fhi) (Figure 2).
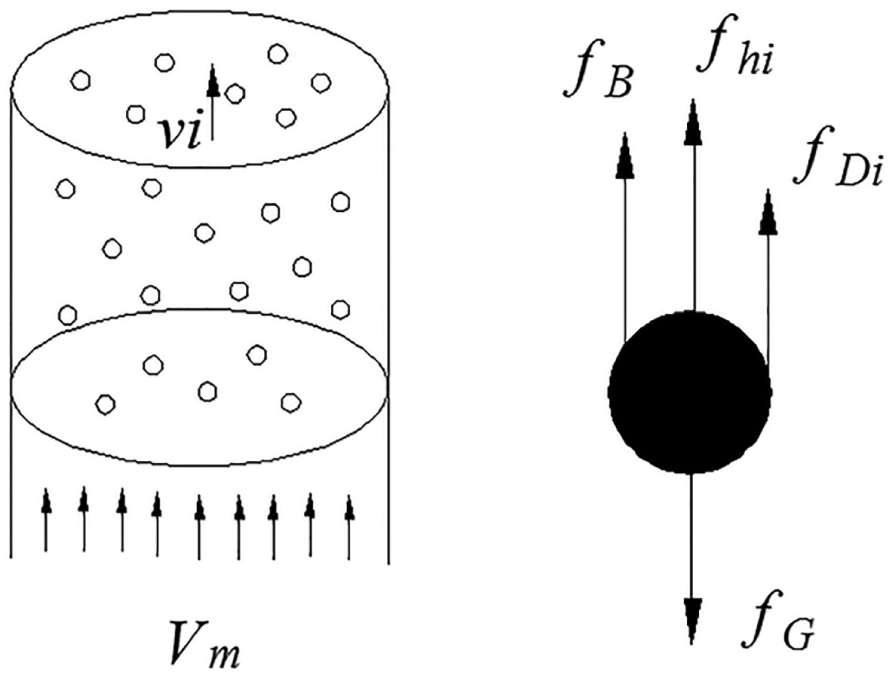
Fluidized test of solid particle group in vertical pipe.
The results of the vertical pipeline transportation experiments are shown in Figure 3; it indicates that the water flow velocity Vm increases with increasing intergranular water speed vi, while local solid mean concentration Q decreases. Moreover, there exists a positive relationship of particle size with vi and Q under the same experimental conditions.
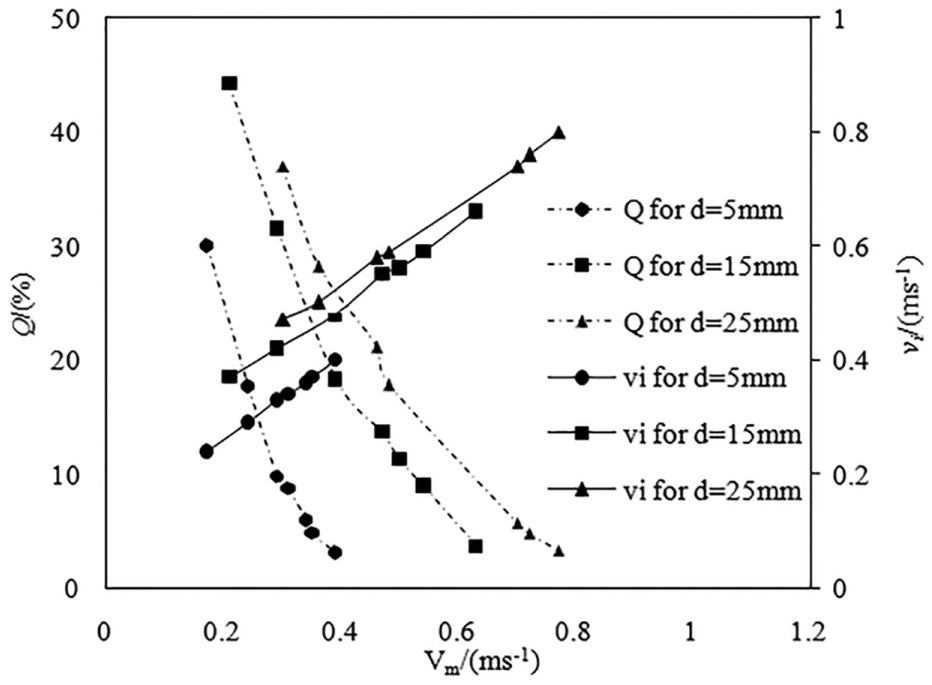
Change of vi and Q with Vm.
Figure 4 shows that the intergranular water speed vi is greater than the average water velocity Vm under same experimental conditions. This is in line with relationship of Vm = (1 – Q)vi. 12 In addition, conventional force balance equation of solid particle can be written as follows 7

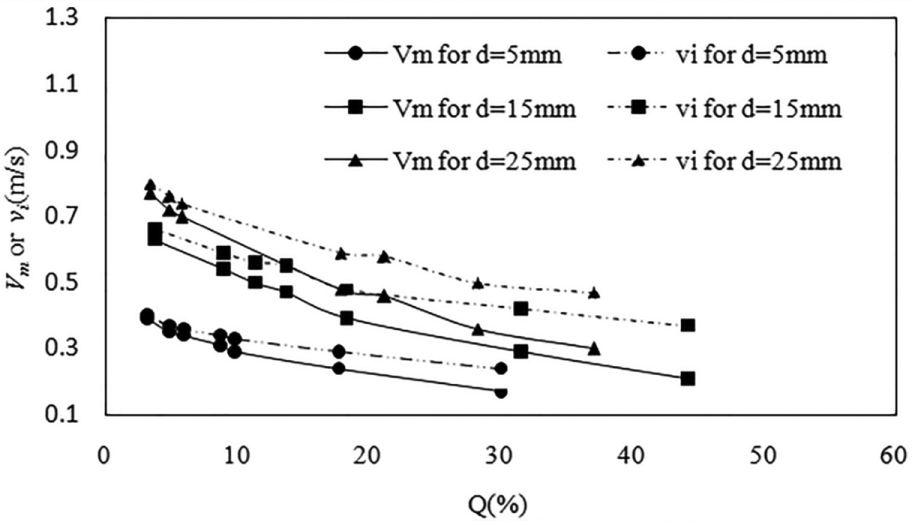
Effect of Q on Vm and vi.
In equation (1), solid’s effective gravity can be described as fG – fB, and it is expressed as wb
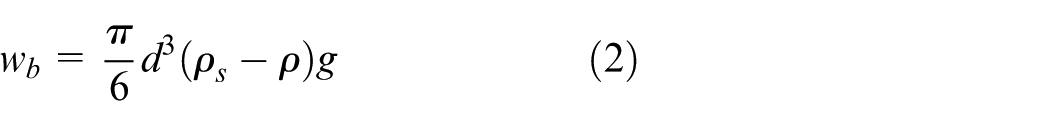
In equation (2), d is particle diameter, ρs and ρ are density of solid and water, respectively, and g is the acceleration of gravity.
According to previous studies, fDi and fhi can be expressed as12–14
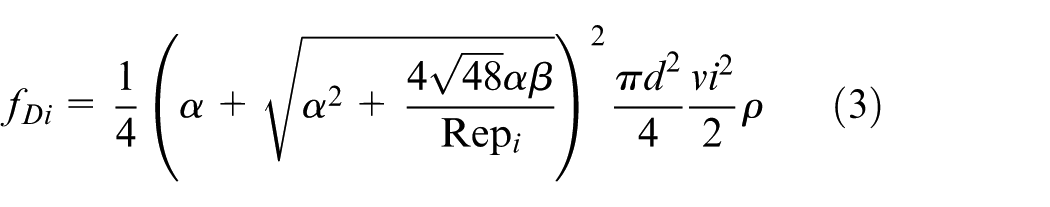
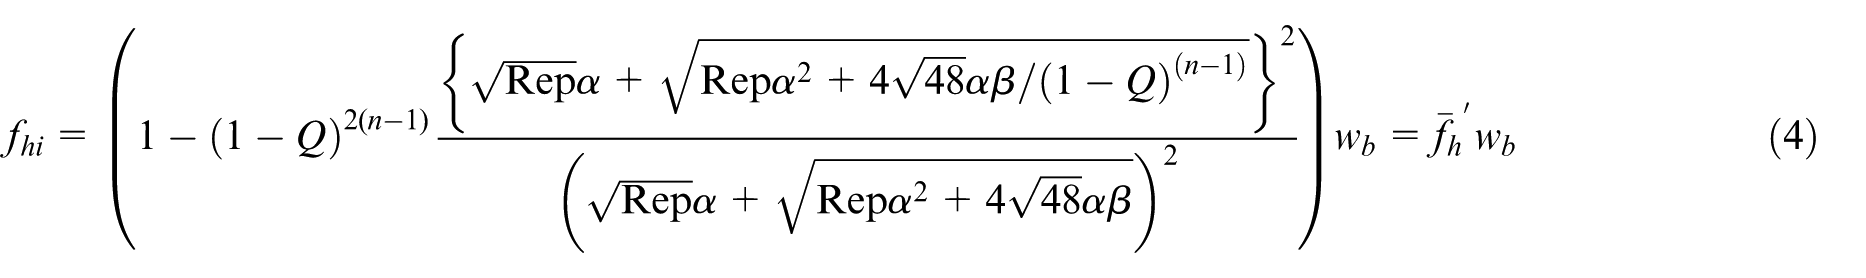
In equations (3) and (4), α and β are Swanson shape coefficient, n is flow index, Rep i = ρdvi/μ, Rep = ρVtd/μ.
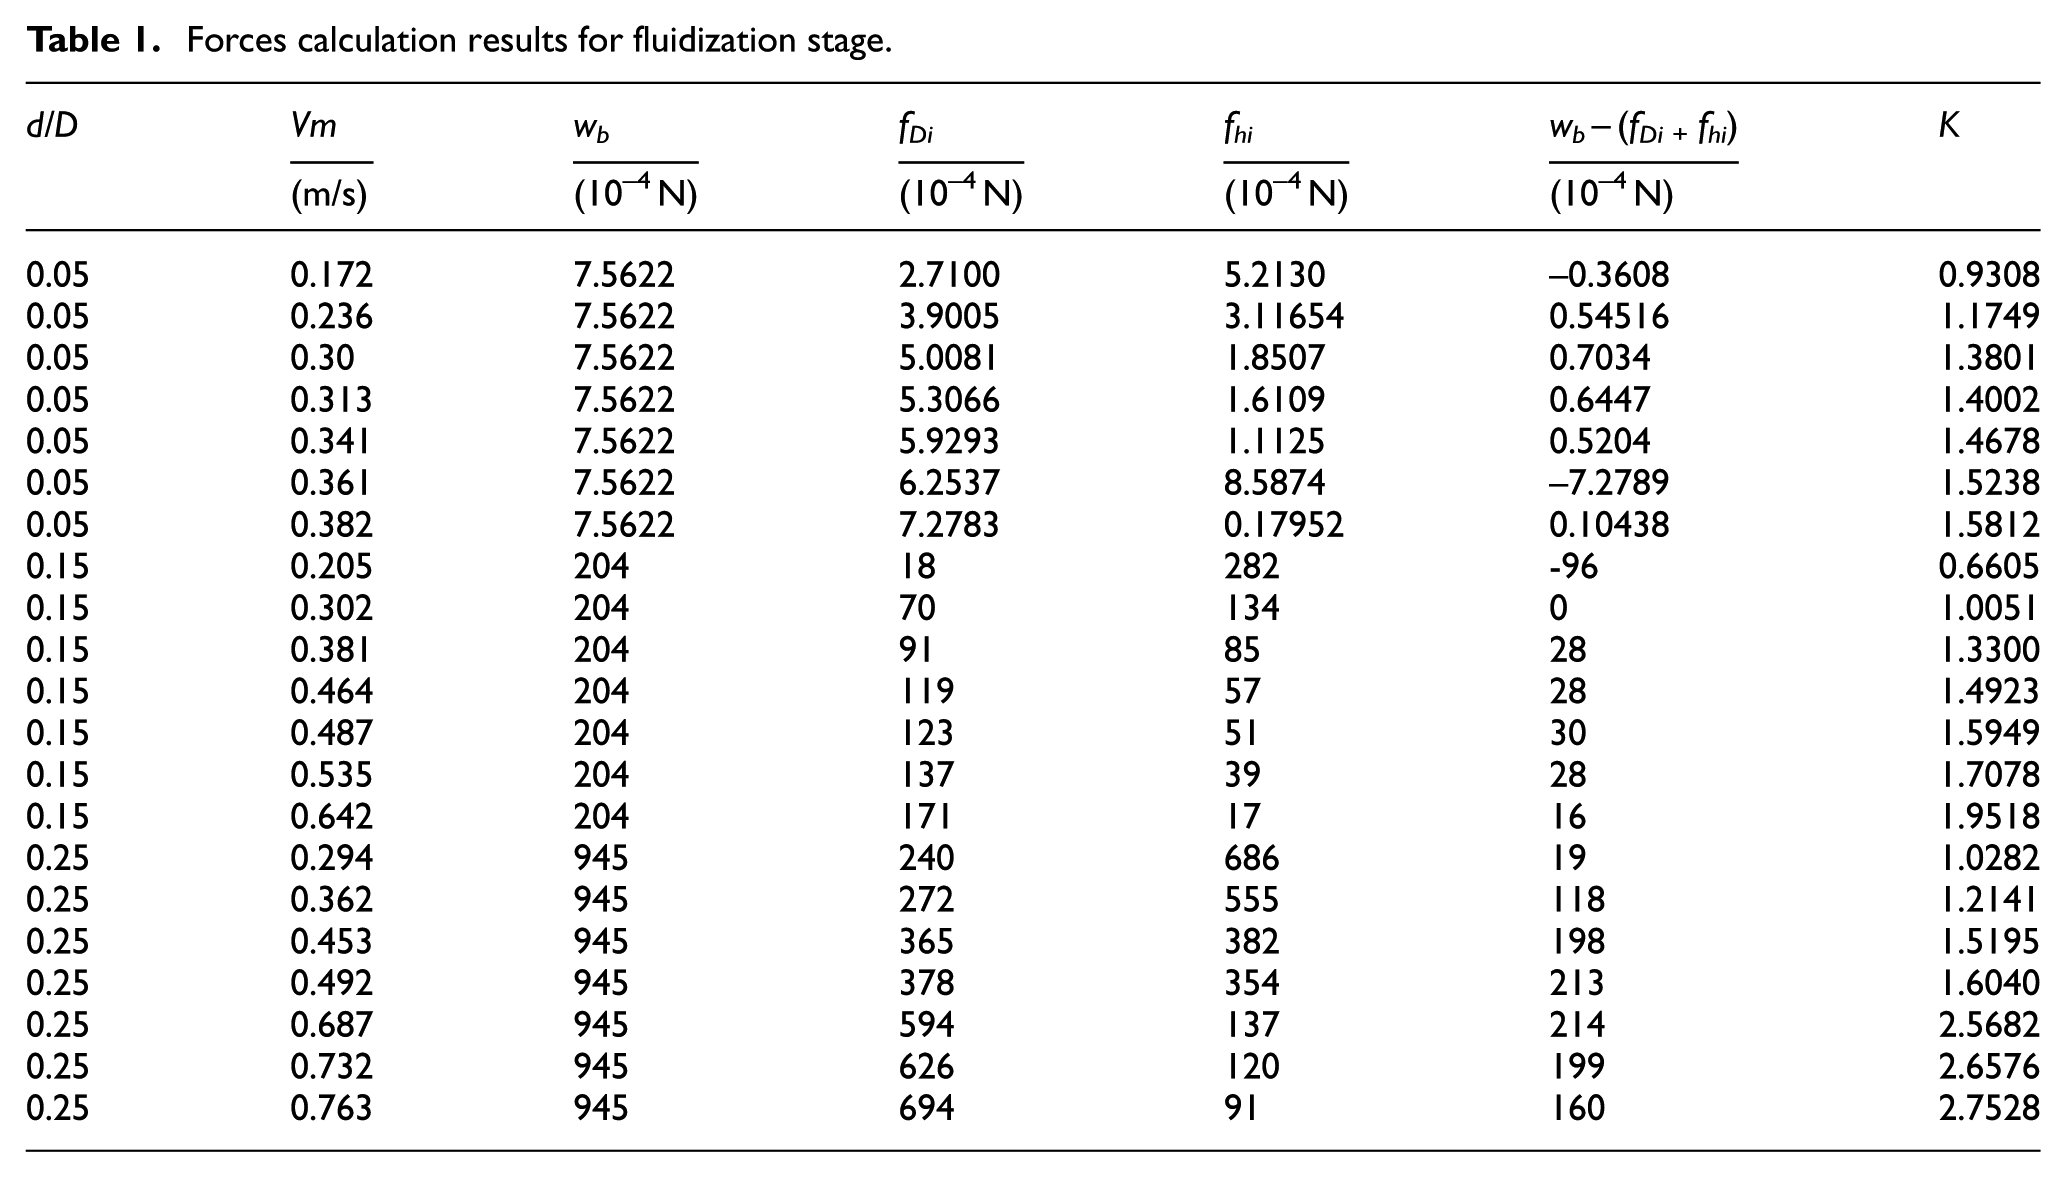
Comparison between calculated wb and calculated fDi + fhi based on Figures 3 and 4 is shown in Table 1, and the value of effective gravity wb is greater than the sum of fDi and fhi, which is in contradiction with the conventional force balance equation (1).
Forces calculation results for fluidization stage.
It is noted that the Rep is larger than 1000 in this experiment, and the particle was moved by water and vortex in the rear of particle was produced (Figure 5). 12 It shows a positive relationship with the calculated velocity and the particle size. 15 Therefore, the Reynolds number of the particles (Rep) also has a positively relation with the particle size.
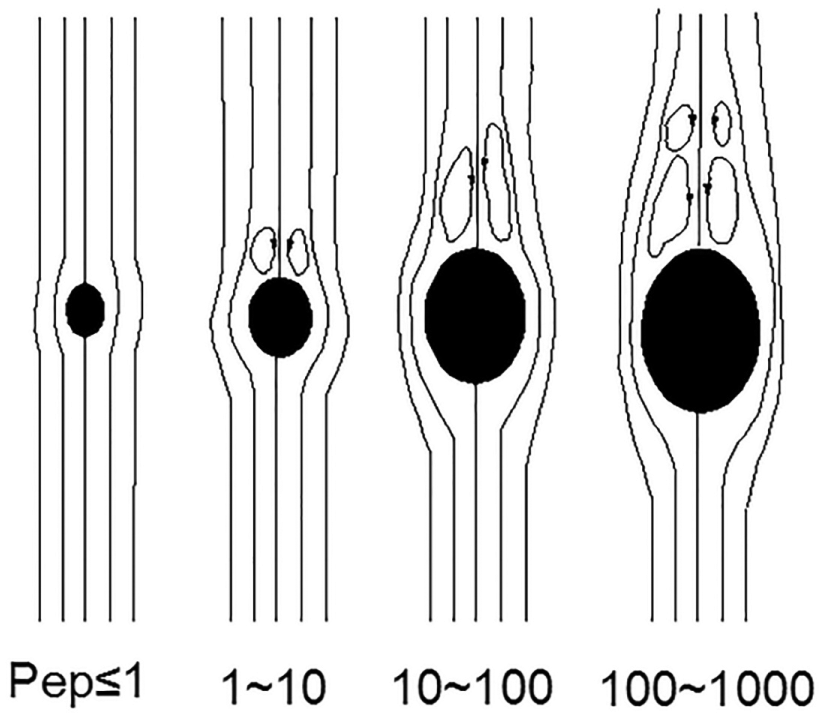
Mechanism of production of vortex resistance.
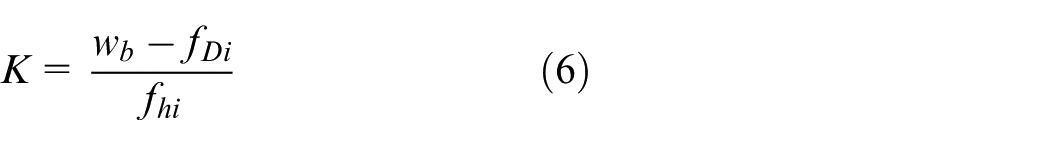
It may suggest that the vortex produced fvi in the rear of the particle plays a drag on the particles and this drag fails to be considered on the right of equation (1) thus causing wb > (fDi + fhi). Therefore, an additional coefficient method is used to characterize the resistance caused by the appearance of the vortex in the rear of the particle. In this method, a coefficient K is added in front of the interference force, then determine the factors that affect the coefficient, so as to determine the influence of vortex resistance on particle flow and even velocity and resistance loss. Based on the above thought, the relationship between wb, fDi, and fhi can be established as follows

Thus
The data in Table 1 are brought into formula (6), and the calculated K value is shown in the last column in Table 1. The results indicate that most of the calculated K value is greater than 1. However, some are less than 1 due to the measurement or calculation error. Meanwhile, the value of K increases with increasing particle size.
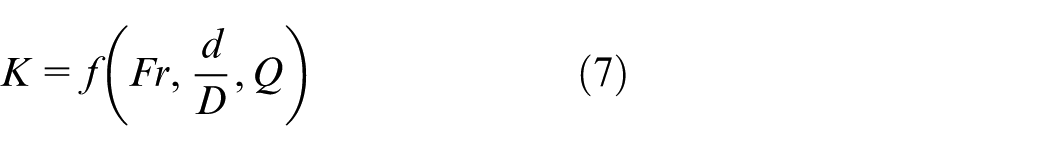
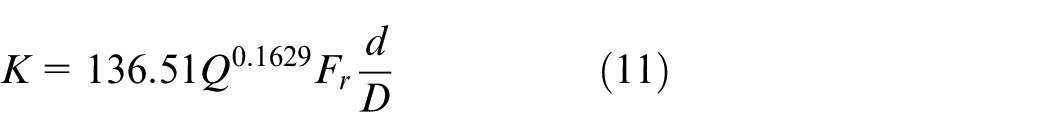
It can be seen from equations (2)–(4) and equation (6) that the d, Q, and vi can influence the value of K. Moreover, it is well accepted that vi is related to Vm and Q. 12 In the experiment, the solid particles’ density is basically unchanged, not considering its influence. At the same time, considering the dimensional balance, the K can be expressed as function of Froude number (expressed in symbol Fr, Fr = Vm/(gd)0.5), d/D and Q, that is
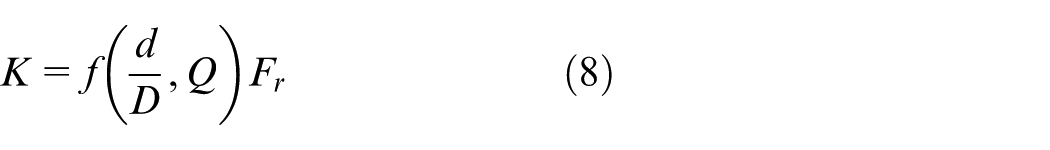
The relationship of vortex resistance coefficient K and Froude number Fr is shown in Figure 6. It shows a linear relationship between K and Fr in Figure 6. Therefore, equation (7) can be written as
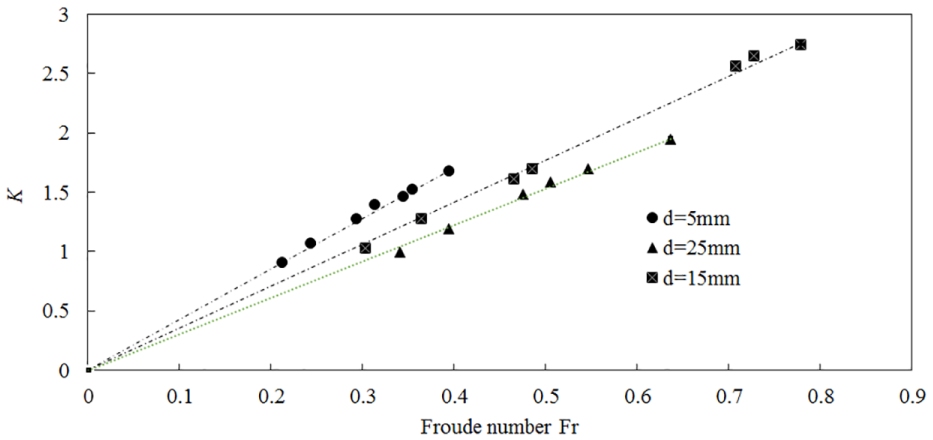
Relationship between K and Fr.
When concentration of solid is about 18%, relationship of K/Fr (equal to f(d/D, Q)) and d/D is calculated, and the results are shown in Figure 7. Meanwhile, the f(d/D, Q) is directly proportional to d/D. Therefore, equation (8) can be written as
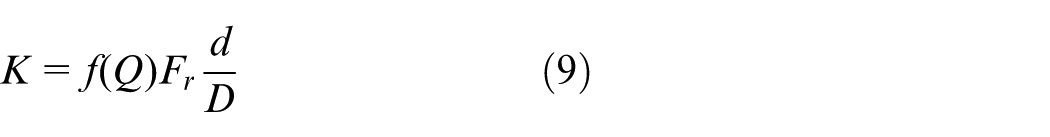
Relationship between K/Fr and d/D.
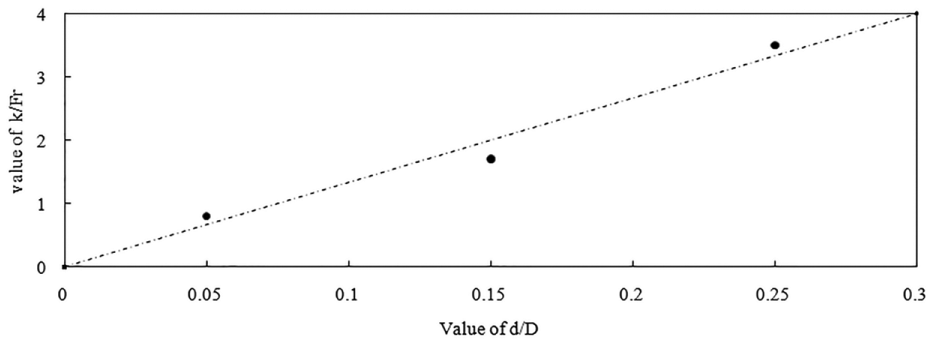
f(Q) is further calculated from equation (9), and through data fitting, f(Q) versus Q figure is drawn as shown in Figure 8, and f(Q) can be expressed as follows

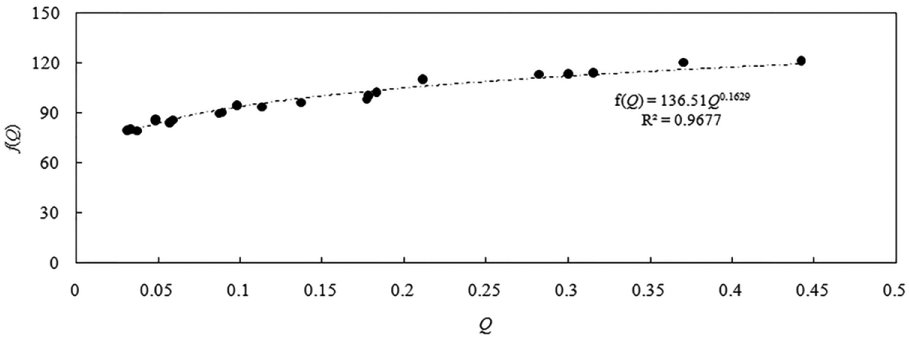
Relationship between f(Q) and Q.
So K can be expressed as
Effects of vortex resistance on vertical pipeline velocity distribution
Calculation model of velocity distribution of solid particle in vertical slurry pipeline
The equation of the force balance of the particles can be expressed in the following form as the water flows vertically upward with the particles
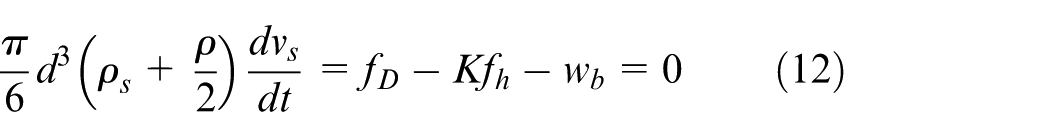
As the velocity of the particles is stable, the following relationship exists

In formula (13), fD can be calculated through formula (3) and vi should be substituted by vw – vs, K can be obtained through formula (11), fh can be calculated through formula (4), and wb can be calculated by formula (2).
Form above equations, following expression can be obtained
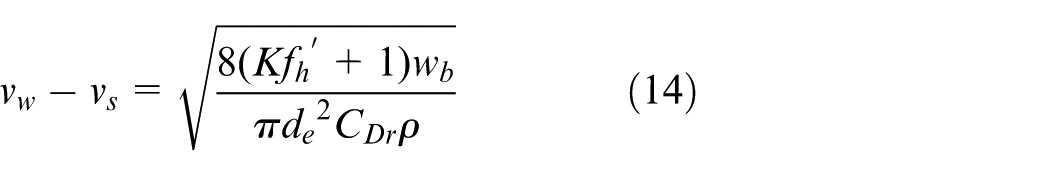
During the calculation of
In formula (14), CDr can be calculated by
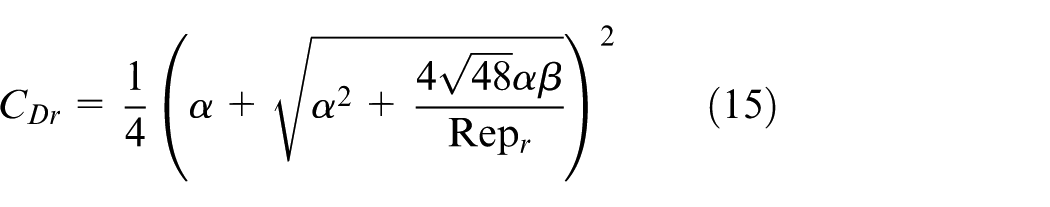
where
According to the previous study of liquid and solid momentum exchange, if it is assumed that before water and solid momentum exchange, water velocity is v and after liquid and solid momentum exchange, clear water velocity is vw and solid velocity is vs, there exists following formula in vertical pipe 16
where ψ(1) = 0.34Log10(Vm/(gdδ2)) + 0.38, δ is the ratio of particle density to clear water density. La is the acceleration distance of the particle, and its calculation method can be found in relevant literature. 17
According to the flow continuity, following equation can be obtained

In the above formula, q is the distribution of particle concentration in the vertical pipe.
Based on formulas (14), (17), and (18), the relationship between Vs and Vw on the whole pipe section can be expressed as follows

In formula (19),
In equations (14)–(18), vw, vs, vm, and v are all related to the concentration of q, the concentration distribution in the vertical pipe can be calculated according to the following formula 2
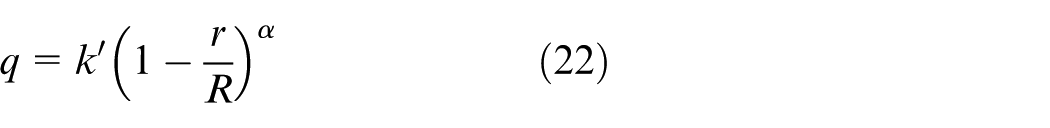
In the above equation, k′ is the distribution coefficient of particle concentration, r is a point at the distance of r from the center of the pipeline, R is the half of inner diameter of the pipe, and α is the particle concentration distribution index. The calculation method of the above parameters follows the related literature. 2
Calculation steps of particle velocity distribution
According to the previous study, the following relation exists in smooth pipelines14,18
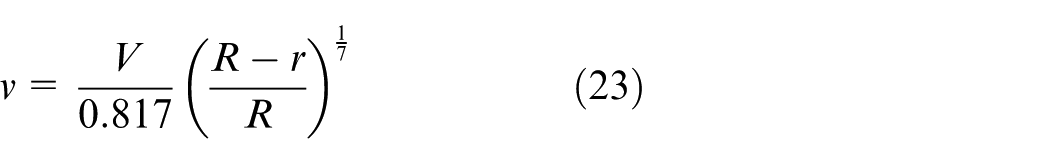
where R is the pipe radius (m) and r is the distance from the center of the pipe (m). So the particle velocity distribution can be carried out according to the following steps:
According to the relevant data, calculate K,
V can be calculated by equations (19)–(21);
v can be obtained by equation (23);
vs can be obtained using equations (14)–(18).
The value of the mean pipe concentration of Q can be obtained by integrating the concentration of q in the tube.
Model verification
The comparison of velocity distribution between calculation and observation for solid particle for Vm = 1.0 m/s, Cv = 6.7%, and d = 3.7–4.0 mm is presented in Figure 9. Meanwhile, the comparison of velocity distribution between calculation and observation for solid particle for Vm = 2.23 m/s, Cv = 6.7%, and d = 3.7–4.0 mm is shown in Figure 10. The results indicate that velocity distribution of solid particles becomes relatively uniform with increasing Vm (Figures 8 and 9). Moreover, the prediction value of the model is generally larger than that of test value in Figures 9 and 10. Taking the vortex force coefficient K into consideration, the velocity distribution of solid particles is reduced, and it is more closer to the measured value with the maximum deviations of the prediction value and test value are 10.4% and 3.7%, respectively. If the vortex resistance is not considered, the maximum deviations between the model calculating value and test value in Figures 9 and 10 are 15% and 7.3%, respectively. Vm increases with decreasing error (Figures 8 and 9). It can be seen from Figures 8 and 9 that under the same condition, the larger the Vm, the smaller the error.
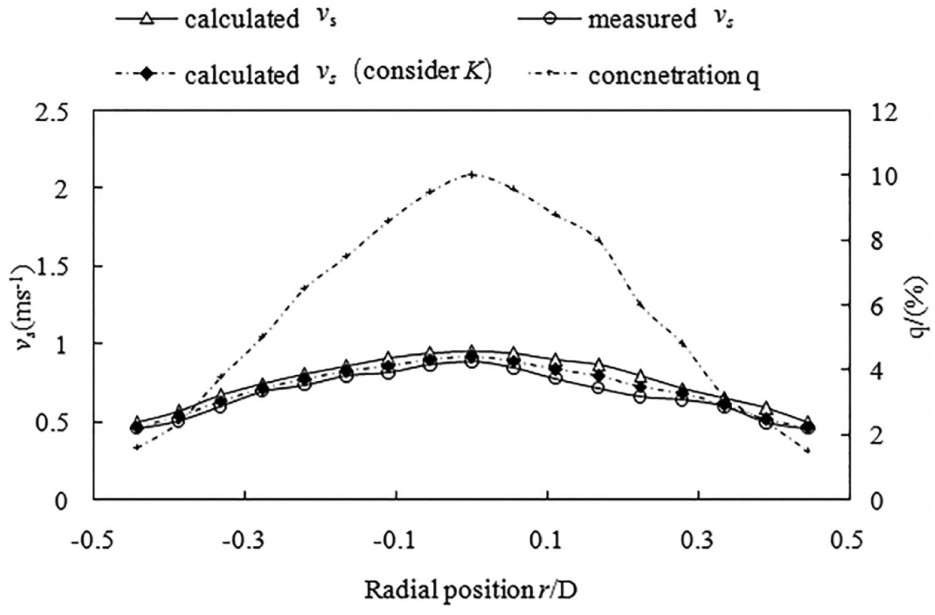
Comparison of velocity distribution between calculation value and observation for Vm=1.0m/s.
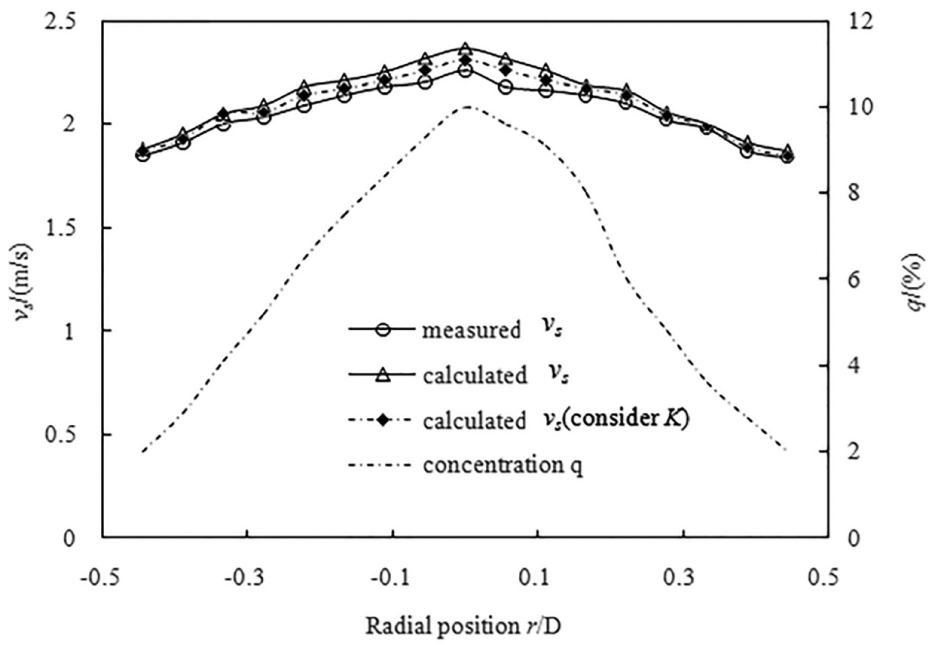
Comparison of velocity distribution between calculation value and observation for Vm=2.23m/s.
The comparison of velocity distribution between calculation and observation for solid particle for Vm = 2.07 m/s, Cv = 1.4%, and d = 5.1–6.4 mm is presented in Figure 11. Meanwhile, the comparison of velocity distribution between calculation and observation for solid particle for Vm = 1.71 m/s, Cv = 1.4%, d = 7.3–8.5 mm is shown in Figure 12. If the vortex resistance is not taken into consideration, the maximum deviations between the calculation value and measurement value in Figures 11 and 12 are 10.12% and 9.25%, respectively. When the vortex resistance coefficient K is taken into consideration, the maximum deviations of the two are 7.95% and 5.95%, respectively. The solids size in Figure 11 is smaller than that of Figure 12, while deviation is more large. Hence, the value of K is proportional to d0.5/D, for pipe diameter is constant, the value K is positively correlated with particle size. The larger the particle size, the greater the K value, and the smaller the deviation. Therefore, velocity distribution of solid particle in vertical slurry pipeline can be influenced by vortex resistance coefficient K. If the vortex resistance coefficient K was taken into consideration, the deviation between the measured value of the experiment and the calculated value of the model can be significantly reduced.
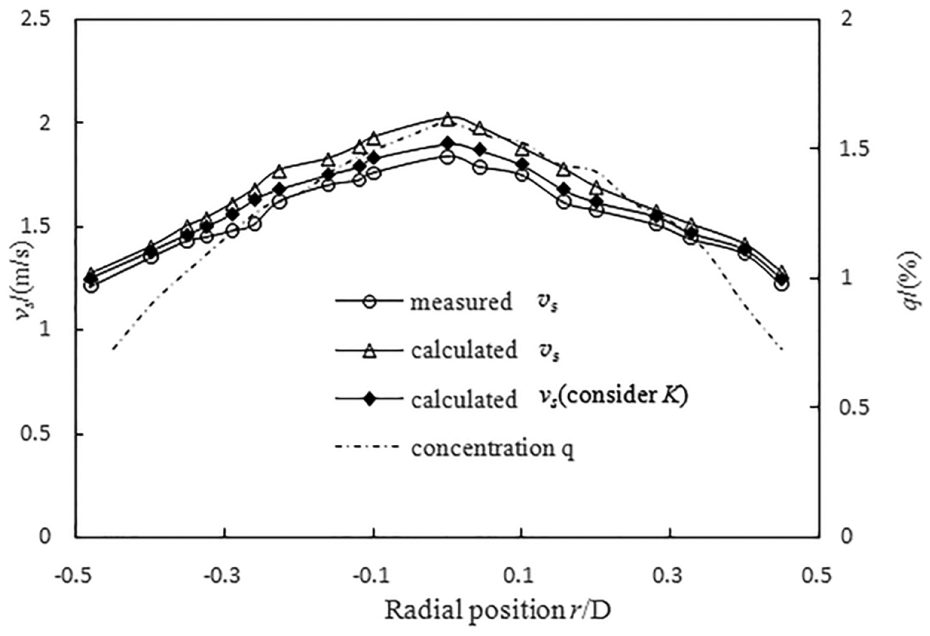
Comparison of velocity distribution between calculation value and observation value for Vm=2.07m/s, d=5.1–6.4mm.
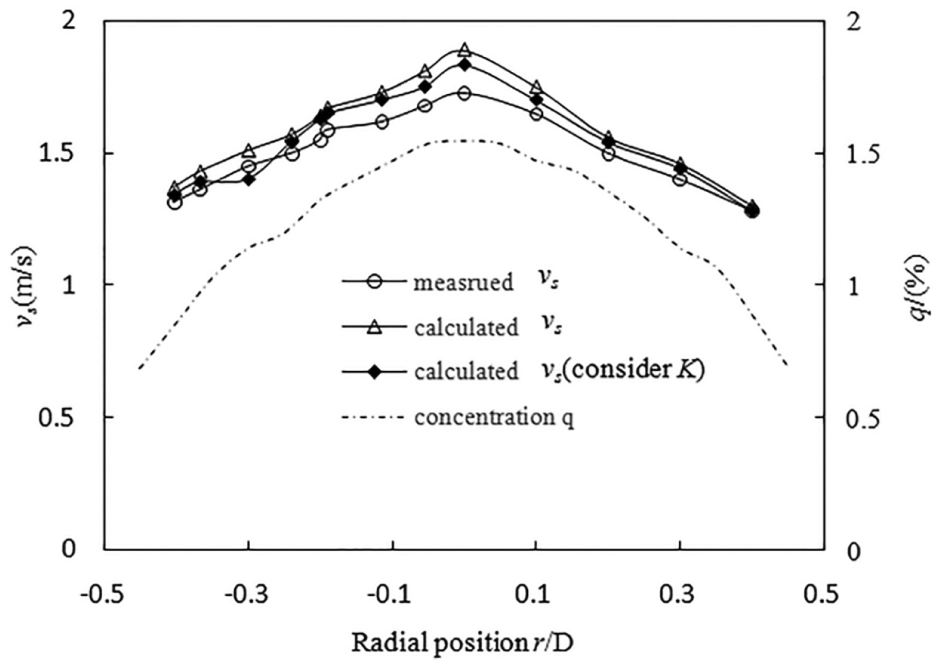
Comparison of velocity distribution between calculation value and observation value for Vm=1.71m/s, d=7.3–8.5mm.
Conclusion
The vortex in the rear of particle was produced for coarse particle slurry flowing in vertical pipe, and it plays a drag on the particles through calculating forces acted on particle and analyzing conventional force balance equation.
An additional coefficient method is put forward to characterize the drag caused by the appearance of the vortex, and by analyzing the influence factors of the drag coefficient of the vortex, expression of additional coefficient K is given out through experimental data fitting.
Calculation model of velocity distribution of coarse solid particle in vertical slurry pipeline is derived. When the coefficient K is taken into account, the deviation of the calculated particle velocity against the measured value is 2.17%–4.6% lower than that when the coefficient K is not taken into account. The vortex resistance is not negligible in predicting velocity distribution of large particle slurry flow in vertical pipeline.
Footnotes
Declaration of conflicting interests
The author(s) declared no potential conflicts of interest with respect to the research, authorship, and/or publication of this article.
Funding
This work was partly supported by the Special fund project for technology innovation of China Coal Technology Engineering Group(Project name: Research on Key Technologies of Long Distance Coarse particle Coal Slurry Pipeline Transportation. Project number: 2019-ZD003). Here, the authors thank Wuhan Design and Research Institute of China Coal Technology Engineering Group for its experimental conditions and great assistance.