
Abstract
Emissions of NOX from automobile causes various environmental impacts. In order to satisfy the emission norms and standards, it is necessary to reduce the toxic gases from emission. This paper concentrates on designing a packed column and analysis on the selection of an effective absorbent to reduce NOX emission from diesel engines. NOX emission is taken from the exhaust of diesel engine (Kirloskar TV1 Diesel engine). Flue gas inlet to the packed column and the treated gas at the outlet of the packed column are measured using NOX inlet and outlet gas sensors, respectively. Absorbent flow is carried out in a lab-scale packed column experimental setup. Various parameters of the packed column such as liquid: gas ratio, diameter, total height and packing height are determined based on the mathematical modeling. The NOX emission was experimentally measured with various combinations of different absorbents with different flow rate. Based on the experiments, effective absorbents are chosen as NaClO2 and NaOH. Experimental results show chemical absorbent combination with 0.5 M concentration of sodium chlorite and 0.3 M concentration of sodium hydroxide at 80% data acquisition card opening condition is absorbing NOX effectively.
Introduction
Emission of toxic gases like NOX causes acid rain and other forms of pollution. NOX emissions are produced due to the combustion of diesel engines in the transport sector and other industries. 1 Diesel engines are also used in agriculture applications; emissions from diesel exhaust cause more impact on environmental pollution. 2 Increased NOX emissions cause human health hazards particularly for the respiratory system. The major emissions of pollutants from coal combustion at thermal power plants, transport sector and other industries are carbon monoxide (CO), Nitrogen oxide (NOX), Sulfur oxide (SOX), Chlorofluorocarbons (CFC) and Suspended Particulate Matters (SPM), such as fly ash, soot and other trace gas species. 1 Industries located in Asian countries lead to rapid increase in energy usage and as a consequence, emission of NOX is increased. 3 Even the vehicles with some of the biodiesel produce NOX emissions. 4 Various changes and technological advancements in diesel engine combustion systems are required to satisfy the emission standards and norms. 5 In case of diesel engines nowadays, there is a necessity toward increasing the performance of the engine and to satisfy the emission norms specifically toward NOX emissions. 6 Compared to that of other fuels, diesel fuel emission exhausts more NOX. 7 Considering the harmful emissions of engine exhaust, researchers derived various solutions like adding oxidation catalysts, anti-oxidation catalysts and so on. 8 NOX and other emission reduction techniques were proposed by various researchers,9–11 and they proposed different devices such as packed column, 12 budding jet reactor, 13 combined packed and spray tower absorber, 14 wetted wall column, 15 cable bundle wet scrubber 16 and so on. For efficient removal of NOX, wet scrubbing method is practiced in a majority of industries. It is one of the cost-efficient techniques. 17 Selection of absorbents for wet scrubbing process is one of the key factor to be considered for producing maximum removal efficiency. Mostly used absorbents are hydrogen peroxide as the scrubbing liquid, NaClO2,15,16 sodium chlorite, 18 NaClO2 and NAOH. 19
Experimental conditions
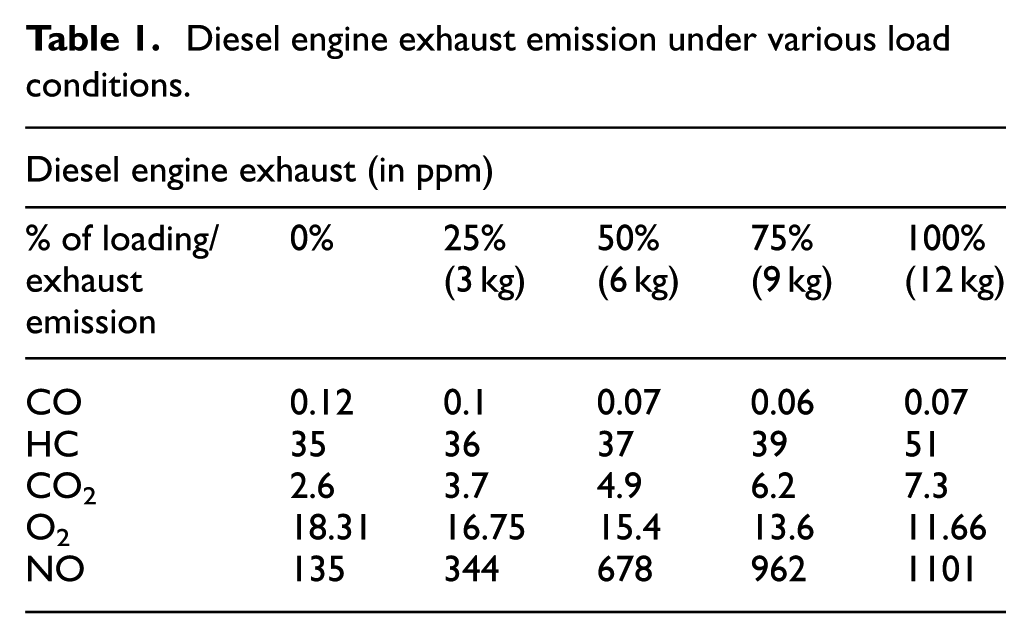
Experiments were carried out with diesel engine exhaust under 25% of loading conditions with normal temperature. 20 For this specified diesel engine, mechanical loading was carried out through the mechanical loading set up. Maximum loading that can be carried out for this set up is 100% (12 kg). In this experiment, exhaust gas was obtained at 25% (3 kg) of mechanical loading. 20 Table 1 shows the average values of engine exhaust readings. These readings were obtained by using engine gas analyzer. From Table 1, it is found that exhaust emissions of NOX is more compared to that of other exhaust gases. Exhaust emission is almost constant. The readings were taken with an interval 1 h for 12 h. 20
Diesel engine exhaust emission under various load conditions.
The present research work aims toward the effective removal of NOX in two steps. The first step is to determine packed column parameters with reference to two film gas liquid absorption theory such as diameter, packed height and liquid: gas (L/G) ratio. Second step for removal of NOX is to carry out experiments with different absorbents such as KMnO4, NaOH and NaClO2 with different combinations and concentrations in a lab-scale emission control setup.
Physical modeling of structured packed column
The absorption process efficiency is based on solubility of contaminant gas in liquid phase. Packed column system is the commonly used method for absorption. In a packed column system, absorption rate is increased by increasing interfacial area between gas and liquid. 21 Packed column performance depends on following parameters like liquid and gas (Lm/Gm) ratio, diameter, packing height and total height. All the above parameters ensure better liquid and gas distribution in the entire surface area. The packed column is designed in such a way that it must produce maximum absorption as possible. Figure 1 shows two-dimensional model of the packed column.
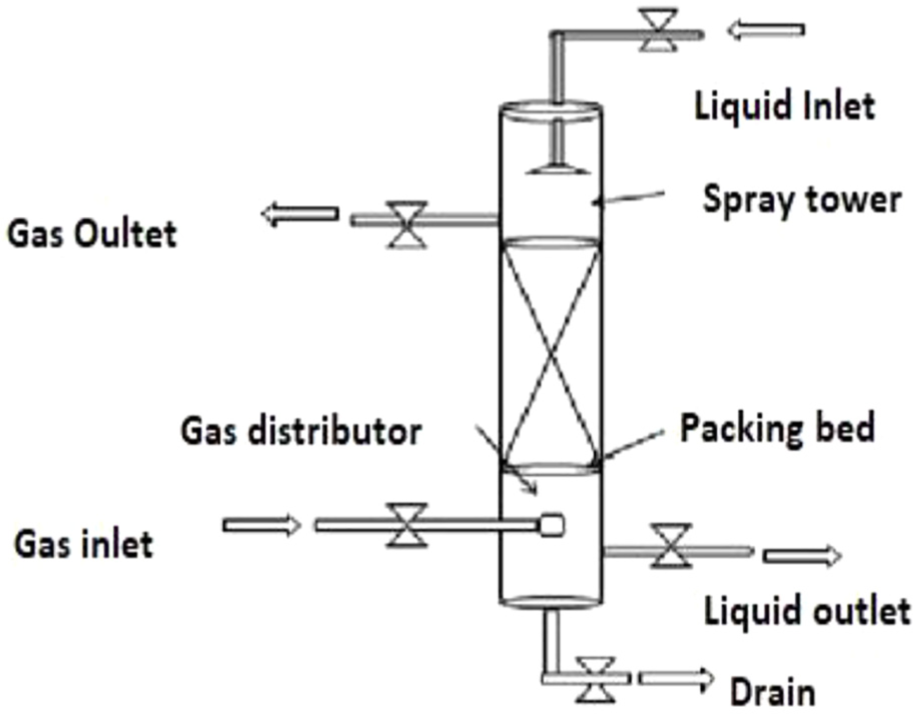
Design of packed column.
Determination of Lm/Gm ratio
In a packed column design, liquid flow rate and the amount of gas entering the packed column are to be determined initially. In this work, sodium chlorite (NaClO2) is considered as an adsorbent for removal of NOX. During the mass transfer between the gas (NOX) and NaClO2, NaClO2 becomes aqueous sodium chlorite. The solubility of gas (NOx) in aqueous sodium chlorite determines the quantity of pollutant to be absorbed from gas phase to liquid phase. The mole fraction of NOX in aqueous sodium chlorite is determined by dividing the moles of NOX dissolved into the liquid by the total moles of aqueous sodium chlorite. In the present work, NaClO2 is considered as an absorbent liquid (L) and NOX gas is considered as gas (G) and L/G ratio is calculated by the following relation, shown in Equation (1)
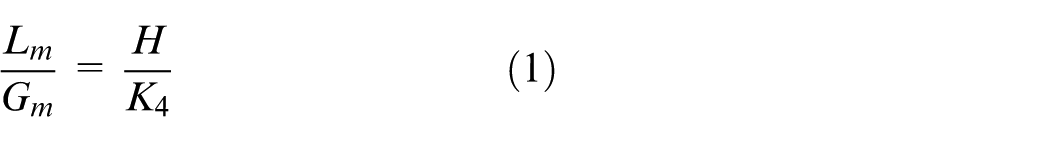
where Lm is minimum liquid flow rate, H is Henry’s constant, Gm is minimum gas flow rate and K4 is flooding factor. Flooding factor is identified for the corresponding pressure drop in the packed column by Sherwood correlation and it is used for calculating the column diameter. By considering Gm = 1 m3/h, flooding factor is 0.7 and Henry constant is 0.0014 22

Determination of diameter
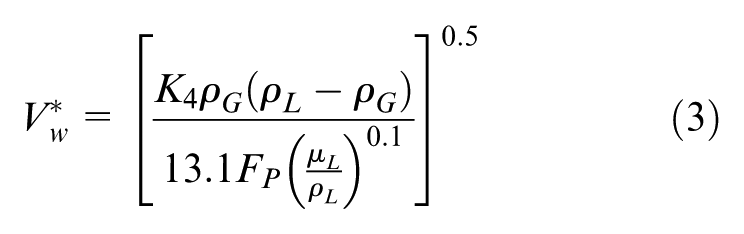
Diameter of the packed column influences directly over the velocity of gas and liquid. Flow rate of gas inside the packed column gradually increases with decrease in packed column diameter, hence it produces flooding. 23 Therfore, the column diameter is calculated for 70% of the flooding velocity to achieve the highest economical pressure drop and good liquid and gas distribution 21 based on Sherwood correlation. The flooding factor (K4) is identified for the corresponding pressure drop (FLV) and it is represented as

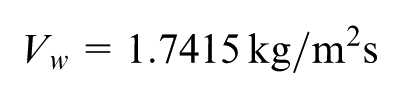
By substituting the molar flow rate of liquid, gas and also their corresponding densities, the calculated pressure drop (FLV) is 0.1724. For determining liquid flow rate inside the packed column, flooding is another important factor to be considered. Flooding factor gives the gas velocity at which the liquid droplets become entrained in the exiting gas stream and it is shown in Equation (2). From the flooding factor, the gas mass flow rate/column cross-sectional area
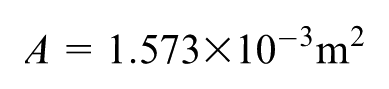
The area of the packed column (A) is calculated as shown in Equation (4)
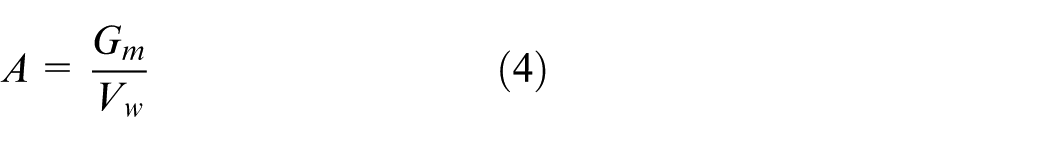
where Gm is gas flow rate and Vw is gas mass flow rate/column cross-sectional area
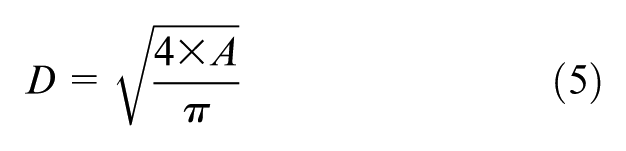
Based on Equation (5), substituting the area value and the diameter obtained is

Hence the area of the packed column is determined as A = 0.001573 m2 and the diameter of the packed column is D = 0.050 m.
Determination of packing height
Liquid hold up time for the packed column is determined by packing height. Better removal efficiency is obtained by higher liquid hold up time. Computation of packed height (Z) of the column is expressed as shown in Equation (6)

where NOG is the number of transfer units and HOG is height of transfer units (0.3–1.2 m). The packed column height at different flow rate was estimated. 21 NOG is calculated as
where y1 is mole fraction of mixture gas entering the column (5000 ppm); y2 is mole fraction of gas leaving the column (assumed as 50 ppm) and the calculated NOG is 4.6. Based on Equation (7), packed height is determined as 0.4224 m.
Experimental setup
Experimental work was carried out in the laboratory scale emission control setup as shown in Figure 2 and its functional block is shown in Figure 4. Inlet NOX emission is taken from the exhaust of diesel engine (Kirloskar TV1 Diesel engine). NOX from the chamber enters at the bottom of packed column.
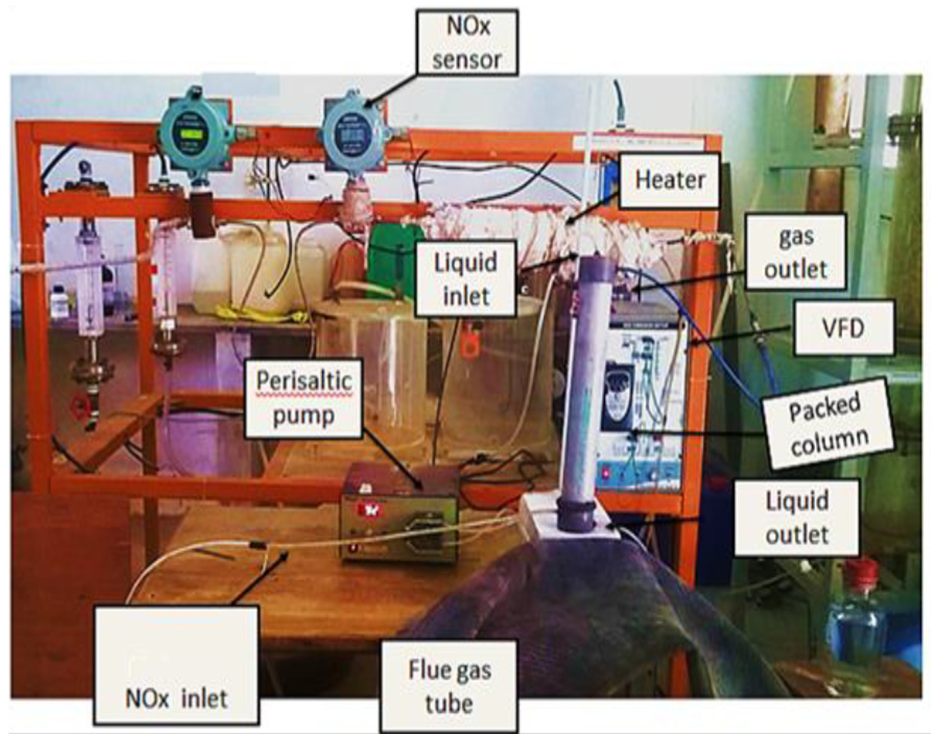
Photographic view of experimental setup.
In the packed column, liquid enters at the top, by using liquid distributor evenly spread out using packing arrangement. Gas enters at the co-current section (bottom) of the packed column and both are blended together in the packed area. Based on the mass transfer occurred between gas and NaClO2, polluted gases gets absorbed into the liquid. The concentration of NOX at the inlet and outlet of the packed column is measured by NOX gas sensors.
The output from the PC-based controller is directed to actuate the peristaltic pump which functions like a final control element. Based on the NOX concentration in the untreated gases, the flow rate of the NaClO2 is manipulated through the peristaltic pump. DAQ is Data acquisition card used for acquiring sensor (NOX) data and transfers control signal for the final control element (peristaltic pump). A specially designed ADuC841 microcontroller-based VMATDAQ unit is used for monitoring and controlling the NOX emission control process (M/s V-I Microsystems, Chennai, India).
Experimental data were obtained from a real-time lab-scale experimental setup as shown in Figure 3. Data were recorded automatically by using DAQ. The front end SIMULINK/MATLAB platform as shown in Figure 3 is created 24 to store the sensor data. While obtaining the data using MATLAB interface–based DAQ, it is possible to control data acquisition system both by manual mode and automatic mode. Based on the measured data, a graph was drawn and shown in Figure 5. Initially, the data were obtained by considering a time interval of 100 s for each absorbent. But no major changes occur up to 1000 s. The changes happened approximately at the interval of 1000 s. Hence, the graph is plotted for an interval of 1000 s. Experimentation was carried out for maximum of 5000 s to all the absorbents.
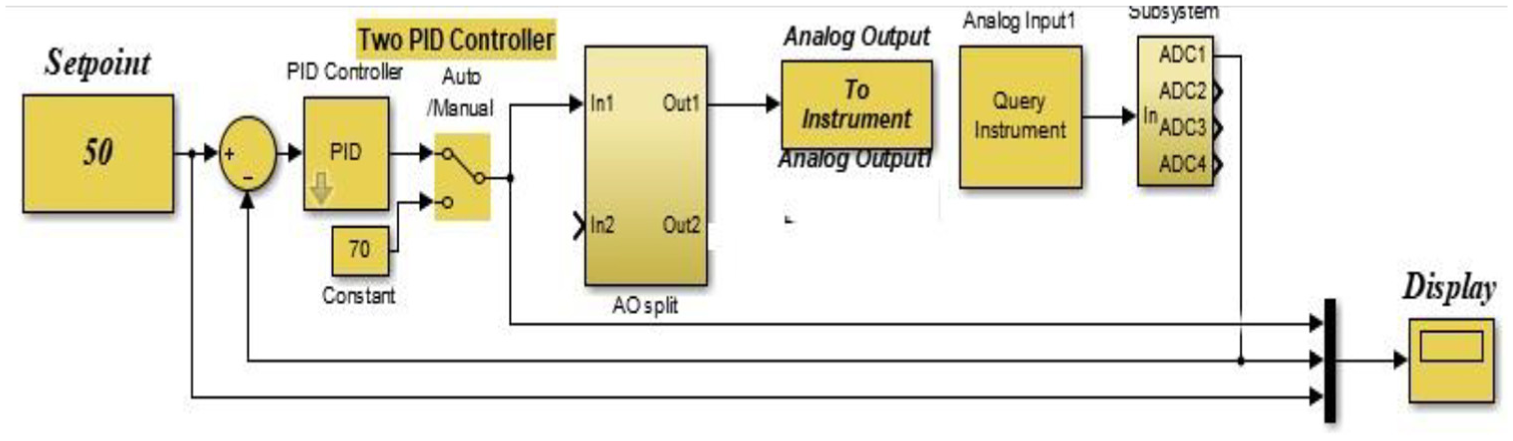
MATLAB - Simulink model for NOx emission control system.
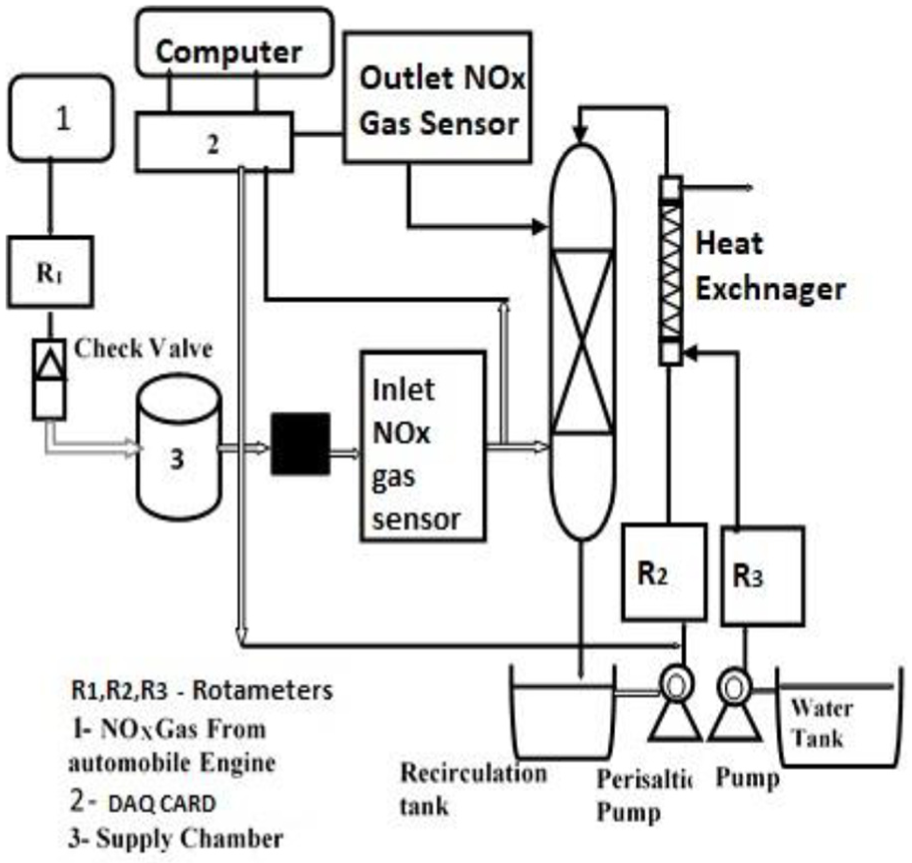
Function block of experimental setup.
Result and discussion on optimization of absorbents for NOX absorption
Various absorbents such as NaClO2, KMnO4, H2O2, H2O, NaOH and so on are used by the researchers for NOX removal process. It was analyzed by conducting the experiments in the laboratory-based emission control experimental setup.
Water (H2O) as absorbent
From Figure 5, it is observed that the removal efficiency obtained from water absorbent is around 20% to 25% at various NOX inlet concentrations, respectively. Although water is the mostly used absorbent in industrial practice, the fractional absorption occurred during continuous runs. H2O reaction is not enough to influence the mass transfer since the response time was very rare. NOX gases need strong oxidant. Hence percentage of removal was very minimum. Hence, it is not considered in the present study.
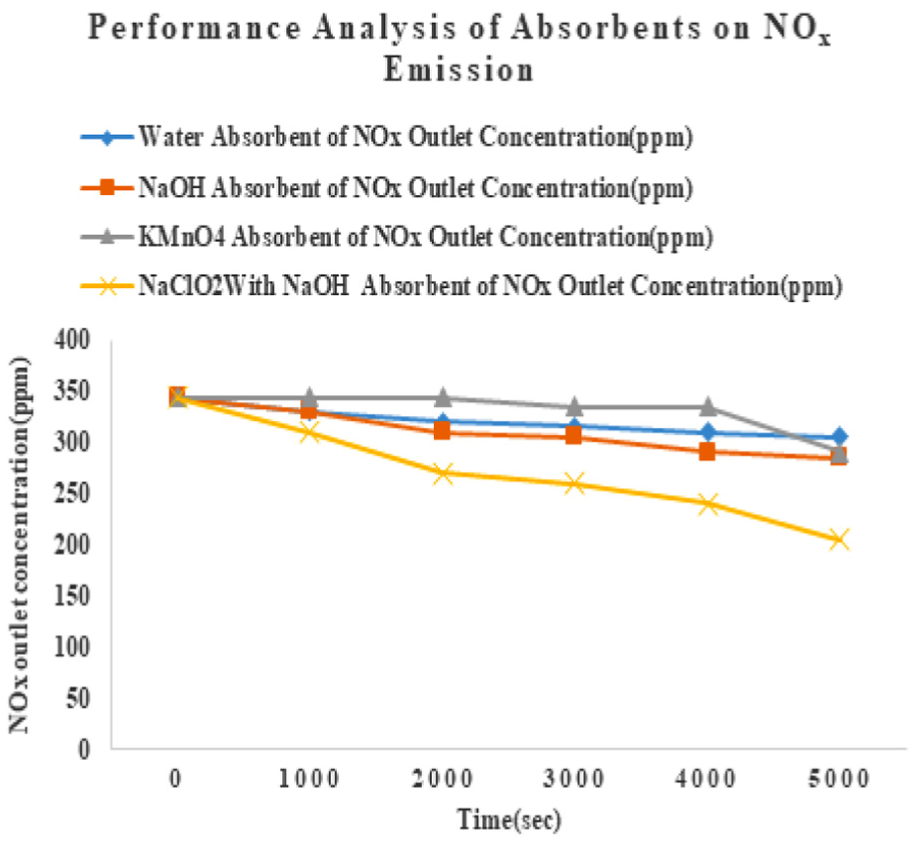
Performance analysis of various absorbent.
Sodium Hydroxide (NaOH) as absorbent
In presence of NaOH solution, it acts as an effective oxidant of nitrogen oxides. The absorption rates of NO slightly exceed gas-film controlled rates. This suggests that the presence of NO may consume more NaOH in the solution. Figure 5 shows the 35% of removal efficiency.
Potassium Permanganate (KMnO4) with NaOH solution as absorbent
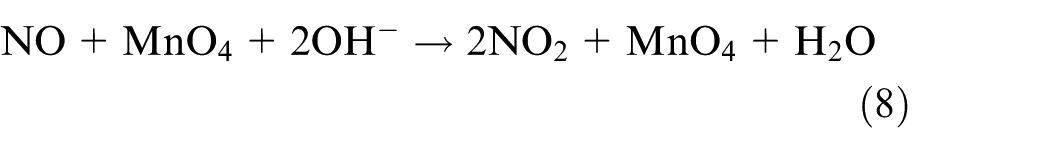
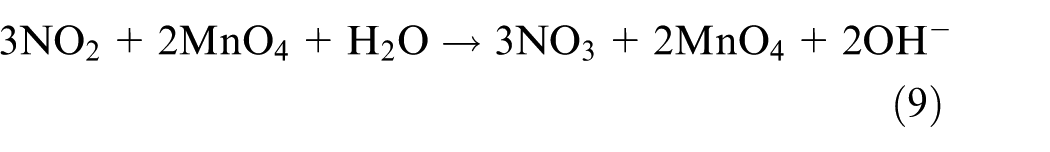
For 0.01 M KMnO4 and 0.1 M NaOH absorption rate over NO concentration is trivial. There is a significant decrease of NO absorption rate with increasing concentration of other pollutants due to chemical reactions. The chemical reaction pointed out in Equations (8) and (9), in which NaClO2 would be decomposed in an acid solution are as follows
From Figure 5, it is seen that it can obtain the 35% of NOX removal as an absorber in a packed column.
Sodium Chlorite (NaClO2) with NaOH solution as absorbent
When the NO concentrations in the gas stream ranges between 0.5% and 15% and the experiments were carried out at temperature of 25°C, the chemical reaction shown in the Equations (10) and (11) is NaClO2 would be decomposed in an acid solution as follows


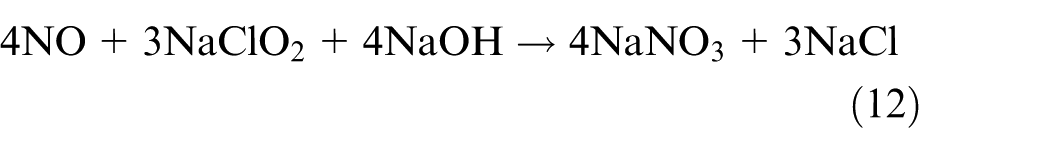
Some ClO2 may evolve from the solution into the gas phase and oxidize NOX to help the absorption of NOX in the system as shown in Equation (12)
Hence from Figure 5, it is observed that high removal percentage for the absorbent NaClO2 gives above 70% of removal by using sodium chlorite. Figure 6 shows that NaOH solution does not produce resistance during the gas and liquid reaction, 0.1 M NaOH produces around 35% for various inlets of NOX. NaOH shows that the removal efficiency gradient is less compared to NaClO2 but it is effective oxidant which is to improve the removal amount combined with NaClO2. It shows that NaClO2 is a powerful oxidant and behaves as good absorbing medium leading to the formation of NO3. Hence NaClO2 with NaOH is taken as an adsorbent for removal of NOX gases.
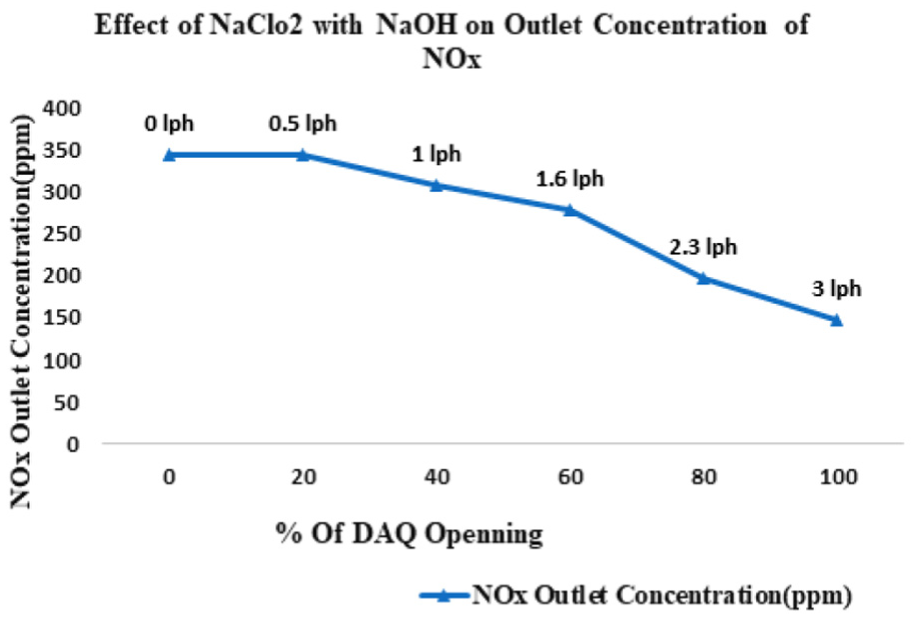
Effect of absorbent flow rate with various percentage of DAQ opening with outlet concentration of NOX.
The pure NaClO2 and NaOH (0.5 + 0.3 M) is taken as an absorbent to attain better removal efficiency. The effect on NOX removal at various flow rates of the absorbent is recorded. In this analysis, the flow rate is varied between 40% and 100% DAQ opening. The higher and optimal removal efficiency is obtained at 80% DAQ opening of the NaClO2 solution and the corresponding outlet concentration. The various flow rate of NaClO2 is obtained by the VDPID-03 Digital controllers.
The developed by-product with reference to Equation (12) after the reaction of NO+Na ClO2 + NaOH is 2NaNO3 (sodium nitrate) and NaCl (sodium chloride) solution is stored in a container. After the experiments, it is not reused. Thus, the by-products generated after NOX removal from these experiments were very less. By-products will be maximum to the range of 300–350 ppm of NOX along with absorbent solution to a maximum of 3 L/h.
Experimental readings show the liquid–gas interaction nature and desired maximum removal efficiency obtained at the 60%–100% of DAQ opening because oxidation reaction and mass transfer that occur between sodium chlorite and sodium hydroxide at that point are very high. This ensures that depending on the flow rate, outlet concentration of emission gases NOX is continually reduced. This is shown in Table 2 and Figure 6.
Effect of the flow rate at the outlet concentration of NOX.
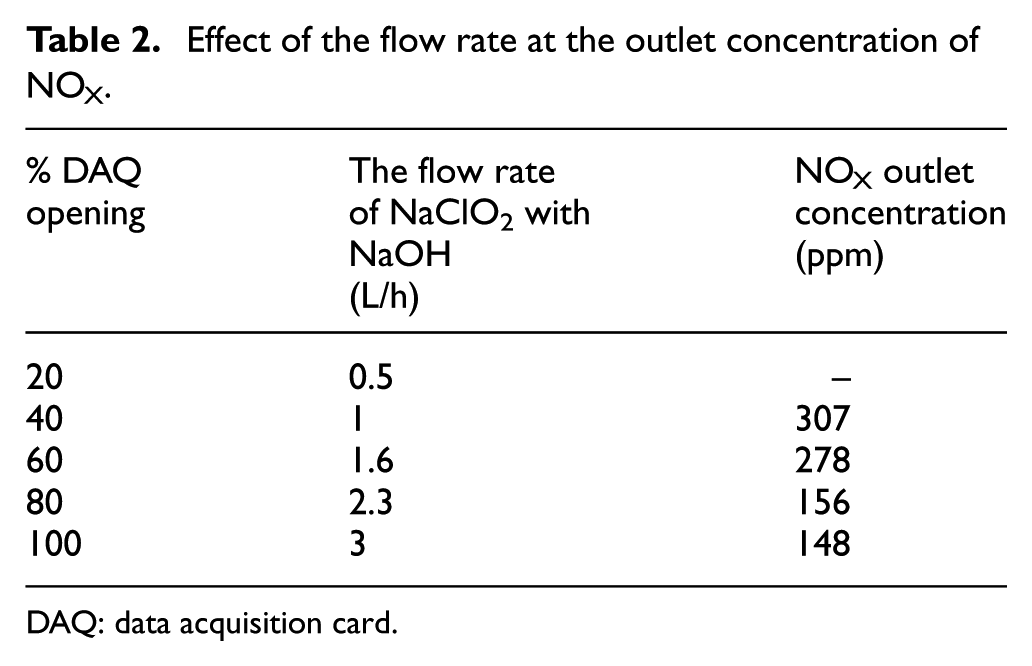
DAQ: data acquisition card.
Conclusion
The experiments were carried out in the lab-scale experimental setup using various absorbents such as water, NaOH and KMnO4 with different combinations and concentrations of NaClO2. Based on the experimental results, it is found that for diesel engine exhaust gas de-nitrification process, the 0.5 M concentration of sodium chlorite with a 0.3 M concentration of sodium hydroxide was an attractive alternative to increase the simultaneous removal efficiency. This combination created 65% of nitrogen oxides removal efficiency, the experimental results conclude that the increase in sodium chlorite increases the NOX removal efficiency. From the NOX removal analysis, the greatest NOX removal efficiencies are in the range of 36%–65%. Control action is essential to regulate the flow rate of the absorbent NaClO2 since it has the direct influence on the NOX removal efficiency.
Footnotes
Declaration of conflicting interests
The author(s) declared no potential conflicts of interest with respect to the research, authorship and/or publication of this article.
Funding
The authors wish to acknowledge the University Grants Commission under Major Research Project F.No. 39-883/2010 dated 12 January 2011 for providing the financial support to develop this experimental setup.