
Abstract
The requirement for transit reliability grows with the increase of pace of life since unstable bus arrivals can raise the anxiety of waiting passengers. This paper proposes a reliability assessment method to evaluate the reliability of each bus stop on the route and the reliability of bus routes. In reliability prediction, the prediction target is locked by rolling horizon to reduce the interference of other information. In addition, a prediction method of the reliability of further transit service using the accurate online support vector machine is proposed. This prediction can provide more accurate and stable data for the arrival of buses and reduce unnecessary waiting of passengers. Finally, the reliability prediction method proposed is tested with the real data of a bus route in Dalian, China. The results show that the accurate online support vector machine with reasonable parameters can predict the reliability of transit service accurately.
Introduction
Traffic congestion has been a common problem in large cities of the world. In order to effectively alleviate traffic congestion, the urban public transit system has been pushed into a very important position. However, in many large and medium-sized cities of China, the development of public transit is not effective because of the pressure and difficulty from the large numbers of citizens. The specific drawbacks are the poor punctuality of buses, uneven headway between buses, and the appearance of bus bunching and large spare space. With the increase of pace of life, travelers are willing to arrive at their destinations quickly and promptly. In other words, reaching the destination within the expected time (i.e. the reliability of buses) is very important. Moreover, in many large cities, it is common that there might be no timetable of buses at each bus stop because traffic conditions usually change quickly, which makes it hard for buses to follow timetables. However, although timetable of buses might not exist, buses still have schedule at the beginning bus stops. Considering the actual condition of these timetable-lacking buses, their reliability seems to be more important owing to the anxiety of waiting passengers without an approximate waiting time. Therefore, concentrating on the reliability of public transit is helpful to evaluate and further improve public transit service.
The research on the reliability theory on road traffic networks has developed rapidly since the 1980s, and the main aspects include network connectivity reliability,1,2 travel time reliability,3–11 capacity reliability,12,13 waiting time reliability,14–16 and so on. Abkowitz 17 investigated the San Francisco Bay Area to study travel time reliability, and the result showed that the travel time reliability has a significant impact on the departure-time choice of commuters. Asakura and Kashiwadani 3 used a simulation-based method to examine the impact of variability in O-D demand levels. Strathmanll et al. 18 used the headway ratio, run time ratio, and average waiting time to evaluate the bus reliability. From the passenger’s perspective, Bruinsma et al. 19 regarded travel time reliability as an index for the evaluation of transit service reliability. Taking into account the interactions between network performance and passengers’ route choice behavior, Yin et al. 20 used the Monte Carlo simulation approach with stochastic user equilibrium transit assignment model to quantify the reliability of transit running time, schedule reliability, and stop waiting time reliability. Liang et al. 21 proposed unblocked reliability by defining that travelers can travel under a specified level of service in transit network.
As can be seen in the literature, studies mainly focus on the assessment of current transport reliability, rather than the prediction of transit reliability. Xuan et al. 22 recognized the importance of public transportation stability and conducted a reliability analysis of the bus scheduling problem to reduce bus congestion and improve the possibility of on-time arrival schedule. The prediction, in the field of urban transport, mainly involves two aspects: traffic volume prediction and bus arrival time prediction. The related prediction methods could be roughly divided into two classes: traditional mathematics prediction methods and data-driven approach. The traditional mathematics prediction methods include historical average model, time series model, Kalman filter model, and so on, while the data-driven approach includes neural networks, nonparametric regression, k-nearest neighbor algorithm (k-NN), and so on. Kim and Hobeika 23 applied the autoregressive integrated moving average model to the freeway volume forecasting. Chen et al. 24 analyzed the Kalman filter theory and then established a short-term traffic volume forecast model based on the Kalman filter theory. Chien and Kuchipudi 25 developed a path-based model and a link-based model using a Kalman filter to predict bus travel times. Chien et al. 26 proposed two artificial neural network (ANN)-based models, the link-based ANN model, and the stop-based ANN model, to predict bus arrival time. Taking the city of Jinan, China, as an example, and based on the historical GPS data and AFC system data, Lin et al. 27 proposed two ANN models to predict the real-time bus arrivals. Yu et al. 28 adopted several methods, including support vector machine (SVM), ANN, k-NN, and linear regression (LR), for the bus arrival time prediction and found that the SVM model performs the best among the four proposed models. In spite of numerous studies about traffic flows and running time prediction, the research on transit reliability prediction is rare, which is mainly discussed in this paper.
SVM can solve machine learning problems in classification and induction with good generalization ability. SVM has global optimal characteristics and the advantage of not falling into local optimal,29,30 which makes it not requiring to perform a complex nonlinear optimization. SVM maps data from nonlinear low-dimensional spaces to higher dimensional linear spaces and searches for the optimal LR hyperplane algorithm to solve the convex programming problem with convex constraints, so as to obtain the global optimal solution.31,32 In the aspect of prediction methods, SVM performs well at the prediction of financial time series, short-term wind speed, traffic flow, and so on. In order to make SVM better solve some practical problems, researchers modified the objective function of quadratic programming to construct a number of SVMs with new properties, for example, v-SVM,33,34 BSVM,35,36 One-Class SVM,37,38 RSVM, 39 Ls-SVM, 40 WSVM, 41 and so on.
In addition, since Vapnik proposed SVM, the studies have proved that the generalization performance of SVM did not depend on all the training data, but support vectors. The reason is that the number of support vectors is smaller compared with the number of entire training data sets, which provides the possibility of incremental learning. Syed et al. 42 first proposed an incremental algorithm based on SVM. Mitra et al. 43 put forward to achieve incremental learning through the error-drive technology. Similar to Syed, they abandoned non-support vectors at each training, but the difference is that the training set consists of a support vector set and a misclassified sample set, and the SVM model was retrained. Poggio and Cauwenberghs 44 developed a method to incrementally obtain exact solutions for global optimization problems, increasing or decreasing the impact of a support sample on the Lagrange coefficient and support vector. Considering the nuclear localized features of radial basis functions (RBFs), Ralaivola and d’Alché-Buc 45 applied incremental learning based on the characteristics of data locality and put the data adjacent to new data into a training set to correct its original classification criteria. Ma et al. 46 proposed an accurate online support vector machine (AOSVM) algorithm, which could learn online and update model. This method was proved to be suitable for solving issues like large changes of time series data property, frequent model updates, and so on. Thus, it is well applied for online analysis and prediction.
Research on transit reliability can provide travelers with more accurate travel information. Thus, unexpected delays can be avoided if travel time is reasonably arranged. For operating companies, the operational level can be improved effectively, and the available resources can be adequately distributed at the maximum degree. In addition, the reliability is also a decision indicator for transit network planning and optimization, which ensure that public transport has a higher service level and stronger marketplace position in the future.
The purpose of this work is to enrich the study on the prediction of transit reliability, especially for no-schedule bus routes and bus stops. Therefore, a specific measure of reliability is put forward for the prediction of future reliability. The machine learning method is adopted in this paper, that is, the idea of incremental learning is adopted, and the accurate online support vector machine (AOSVM) is used to predict the reliability of public transit (buses).
The remainder of this paper is organized as follows. Section “Model development” shows the description of the problem and develops a model to predict the transit reliability of buses using AOSVM. In section “Accurate online support vector machine,” we present the principle of AOSVM, as well as the process of algorithm. A case study of line 10 in Dalian, China, is presented in section “Case study.” And finally, the conclusions are provided in section “Conclusion.”
Model development
Problem description
Getting to the destination within the expected time (i.e. the reliability of the bus) is becoming increasingly important. In order to improve bus reliability, this paper first establishes a bus reliability evaluation model, which includes the reliability assessment of bus stops and bus routes. Then, the rolling horizon is used to select the target and the prediction function is established to predict the reliability of transit.
Transit reliability assessment
Stop reliability assessment
Reliability of bus stops can be seen as the property of fairness of each bus stop in this paper. That is, the time interval between two successive bus stops is used to measure stop reliability and fair arrival (same arrival interval) at a stop leads to a high stop reliability. The level of the reliability of a bus stop should regard the actual time interval between two successive vehicles arriving at the same stop as the basis of reliability evaluation. Theoretically, the service is good if the actual time interval between two successive vehicles arriving at the same stop is equal to the departure interval. However, affected by weather, traffic accidents, and other random factors (e.g. short-term large traffic volume, road pavement maintenance), the time intervals between two successive vehicles arriving at the same stop are actually fluctuating. And the higher the volatility of bus arrival time, the worse the bus reliability. Thus, by evaluating the volatility of bus arrival at each stop, the bus operation reliability can be described. In this paper,
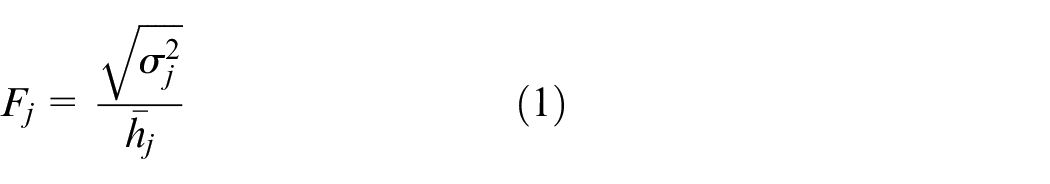
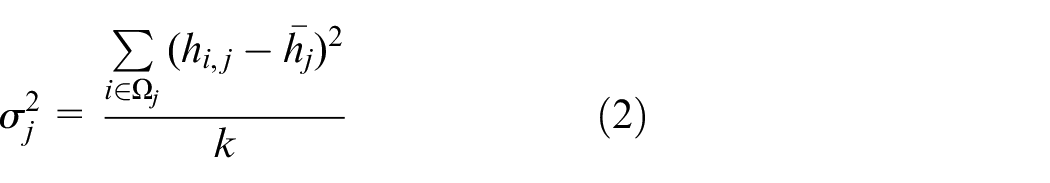

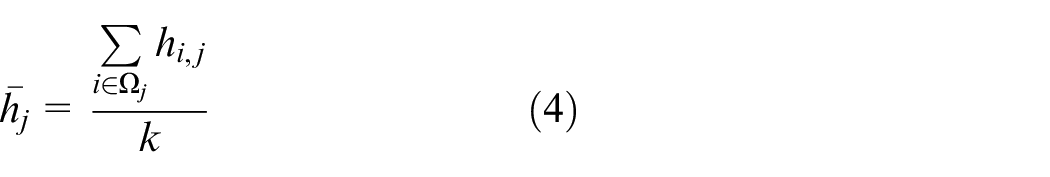
where
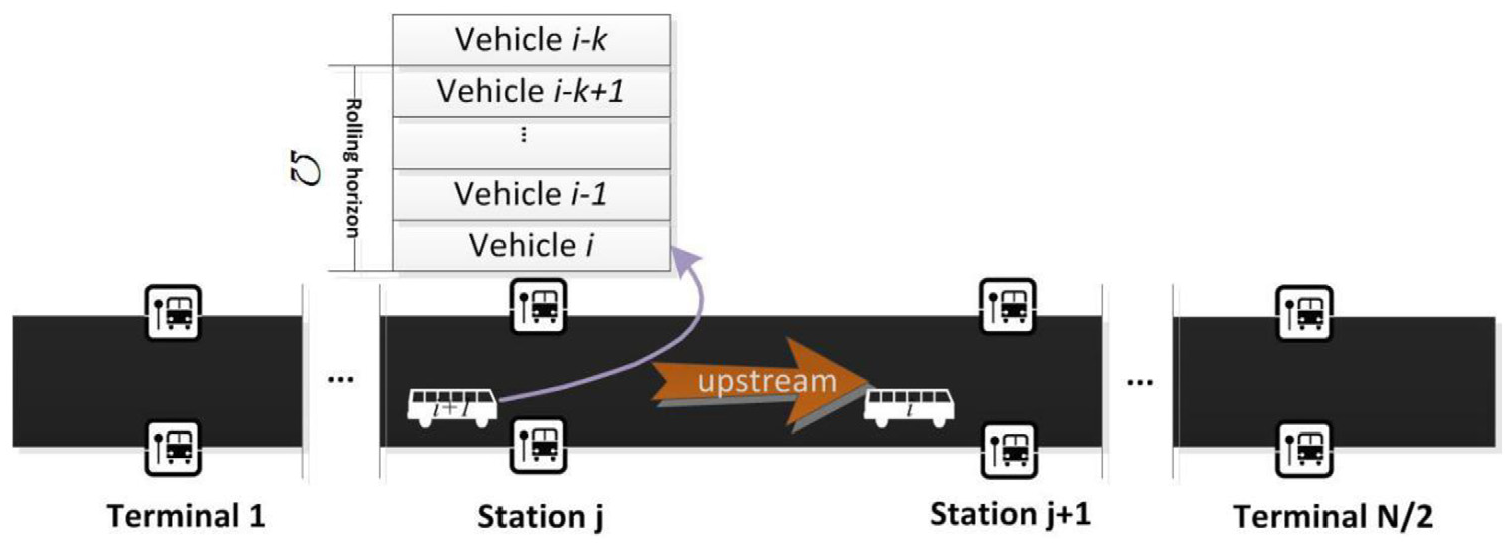
Illustration of rolling horizon of buses.
As can be seen from formula (1), a smaller fluctuation coefficient means the bus line operation at the stop is more stable and the reliability is better. Particularly, the fluctuation coefficient
The reliability of transit service of bus route
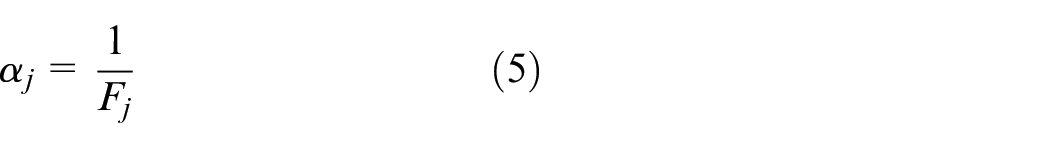
By summing the reliability of each stop on a bus route according to a certain weight, the reliability of the bus route is finally obtained. Essentially, the weights measure the importance of a single stop on the route. In a certain period of time, the bus stop plays an important role in the bus route if the passenger flow is large. Thus, the proportion of passenger flow is taken as the weight of each bus stop. Noting that, for the sake of simplification, the entering and exiting times of passengers are set as the same, the reliability of the bus route
where
Prediction of transit reliability
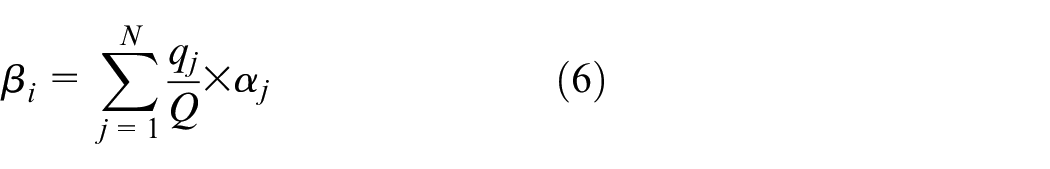
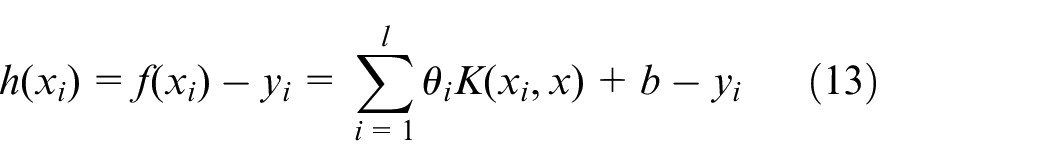
With the help of the GPS technology, the bus arrival time at each stop can be easily obtained. Thus, the reliability of the bus route is available according to the formulas in section “Problem description.” However, the future reliability of the bus route is of great significance for both bus operating and passenger travel choice, especially in short term. Therefore, it is necessary to predict future reliability of bus route. To predict the reliability of the further transit service, the potential relation between the current and further transit services should be deduced. In this paper, the SVM method is adopted to formulate the reliability of the future transit service based on the reliability of the current and recent transit services

where
The frame of transit reliability prediction.
Accurate online support vector machine
The principle of AOSVM
SVM is a kind of novel machine learning method based on statistical learning theory proposed by Vapnik. 47 SVM can well solve the small sample, nonlinear, and other practical problems. SVM has the advantages of finding global solutions and higher generalization capability. 48 SVM is developed from the optimal classification hyperplane when the training data is linear separable. Its essence is to find that the support vector can be used to construct the optimal classification hyperplane from the training data.
The main principle of SVM is to choose a nonlinear mapping
Supposing the training set

where
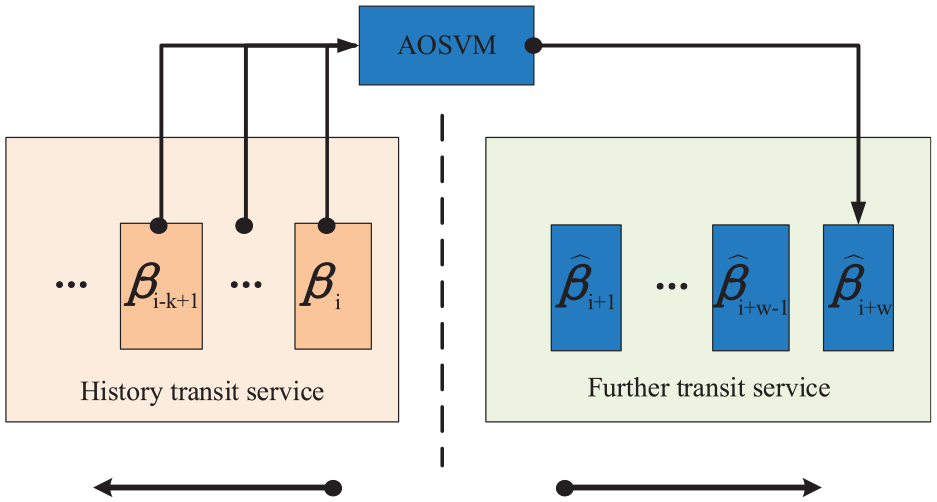
As shown in Figure 3, circles and squares, respectively, represent samples of two different categories, H represents the hyperplane that correctly separates the two types of samples, and its direction is represented by hyperplane normal vector. H1 and H2 represent the plane that is parallel to the hyperplane. H1 and H2 pass through each type of samples and is closest to hyperplane H. The distance between H1 and H2 is called classification interval. The optimal classification hyperplane refers to the fact that the obtained hyperplane can not only correctly separate the two types of samples and minimize the model training error but also maximize the classification interval between the two types.
Hyperplane of optimal classification.
Make
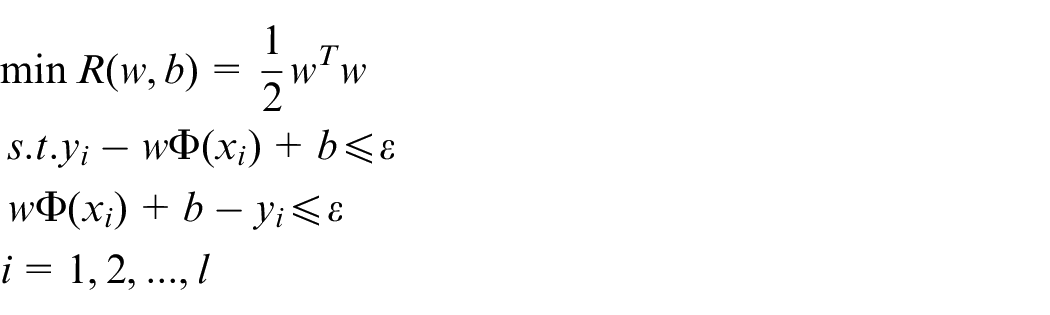
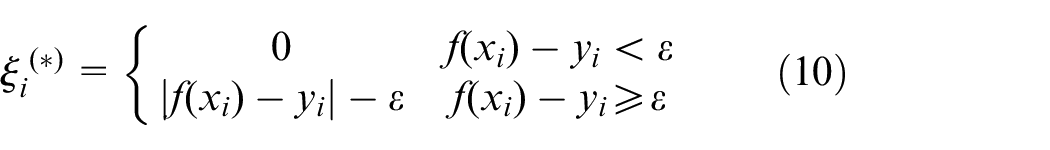
The relaxation factors
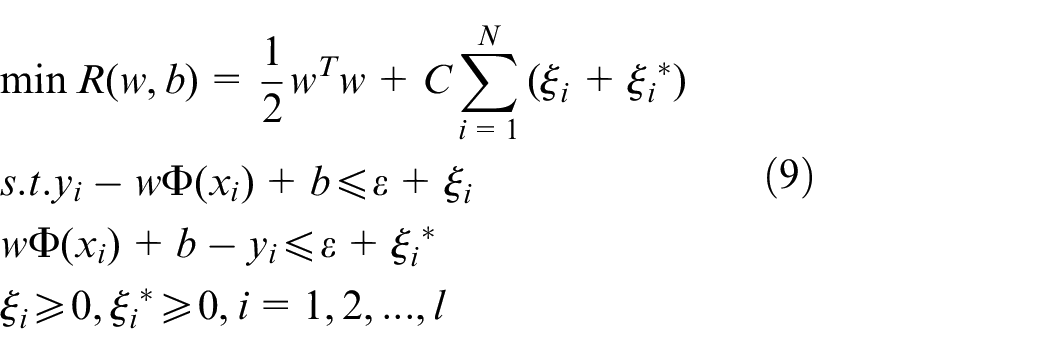
where
Formula (9) can be written as formula (11) by introducing Lagrange multipliers
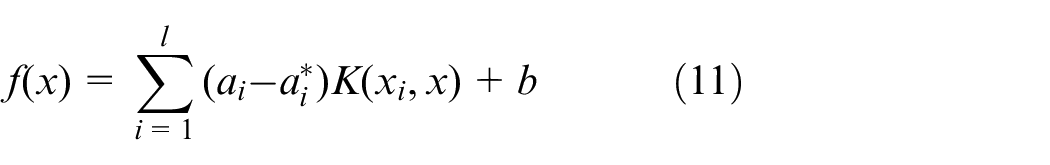
where
where
When training samples of the traditional SVM reach a certain level, in which the computational memory exceeds the limited memory size, the training results cannot be obtained. Therefore, the practical and effective online SVM, which can meet the requirement of large-scale problems and online applications, is recommended.
The core of the incremental learning in online SVM is that, when the regression data set sample is updated, the new sample will be added to the training set, and the algorithm dynamically updates the trained SVM model. The basic idea is that when the sample set changes, update three coefficients
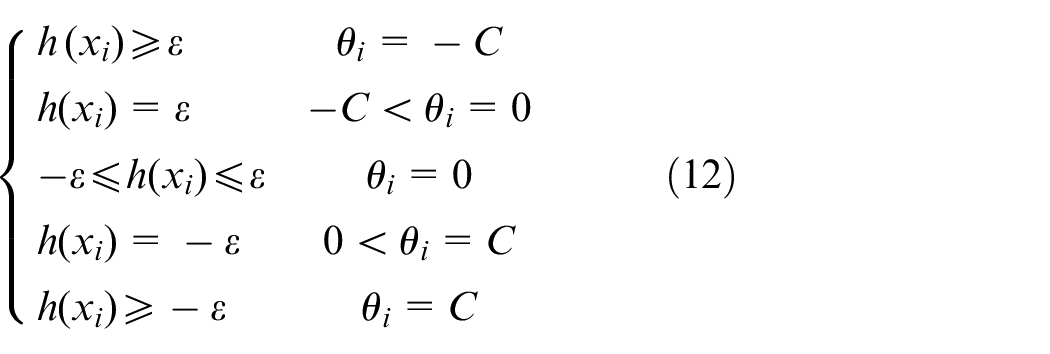
Based on the original training results, AOSVM updates the model online according to sample set change. There are five conditions in equation (12), but they can be identified into three categories.46,51 The three categories are separated according to formula (14)
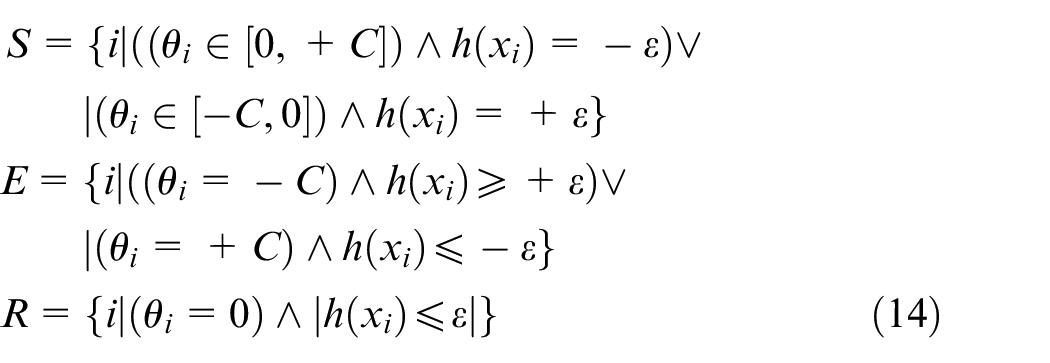
where S is the support vector set, E is the error set, and R is the reserved set. Different from the offline SVM, the AOSVM directly increases or removes one sample data instead of restarting training when the data are updated and then adjusts SVM structure and data characteristics of the corresponding training data set online dynamically, making SVM corresponding to KKT conditions.
In the incremental algorithm, a new sample
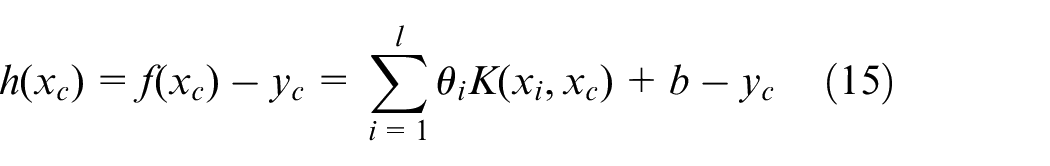
The value of Lagrange multiplier of the new added data
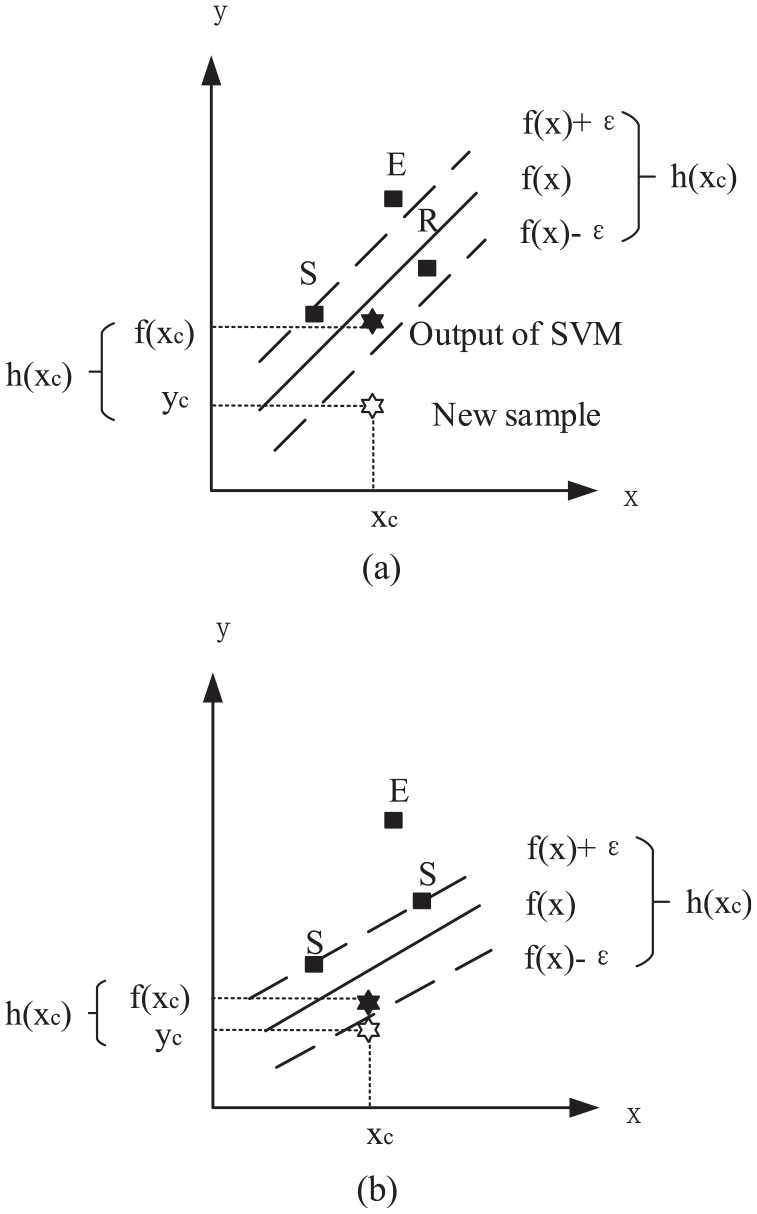
E, S, and R subsets: (a) before and (b) after.
The farthest historical sample points in the data samples of S, E, and R sets are selected to “forget” in the decremental algorithm. 53 When removing an existing sample from the training set, the decremental algorithm is used to eliminate the old sample. That is, a trained sample in S set which does not contribute to the model will be removed from the training set. The decremental algorithm follows the incremental algorithm with a few small adjustments.
Detailed information on the matrix deduction in the incremental and decremental algorithms is available in the literature46,52 (Ma et al. 2003; Wang et al. 2009). Through the update rules,
The process of algorithm
In the incremental algorithm, when a new sample
Step (1) Set
Step (2)
Step (3) Update
Step (4) If
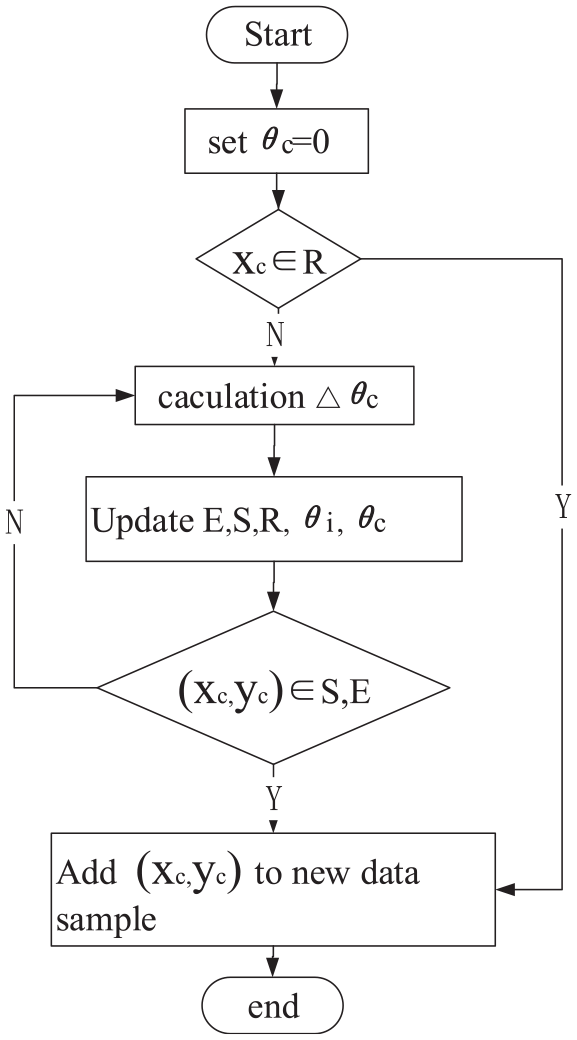
Flowchart of the algorithm.
In the decremental algorithm, when a trained sample
Step (1) If
Step (2) If
Case study
In this paper, the proposed model and algorithm are tested based on the real-world data in Dalian, China (i.e. GPS data of the bus route 10). The raw data were collected from public transport providers, including bus Id, time, current location (latitude and longitude), heading, average speed, number of boarding/alighting passengers at bus stops, and so on. And GPS data include bus Id, time, current location (latitude and longitude), heading, and average speed. GPS is always accurate in general, but in the process of data acquisition, it may be affected by a variety of factors and produce some data with large errors or wrong data. In order to improve the accuracy of the research results, it is necessary to preprocess GPS data and delete the inaccurate or incorrect data, including incorrect time format, data field missing, latitude and longitude range crossing, data redundancy, and so on.
Bus route 10 is from Baihe village to Shahekou station with a total length of 14.5 km and 28 stations (see Figure 6). There are 11,729 groups of valid data from 6:00 to 20:00 during 1 September to 10 September 2015. The input variable of SVM is the recent processed data, and the objective/output is the future reliability. Thus, the time interval (headway) arriving at each stop between two successive buses can be calculated and measured in bus reliability. In order to avoid overfitting of the model in the training process, 80% of the data were randomly selected as the training data. Original sample data are divided into two subsets: training sample set and test sample set, where the test samples are set as 20% (about 2.4 thousand groups) and the rest are set as the training samples.
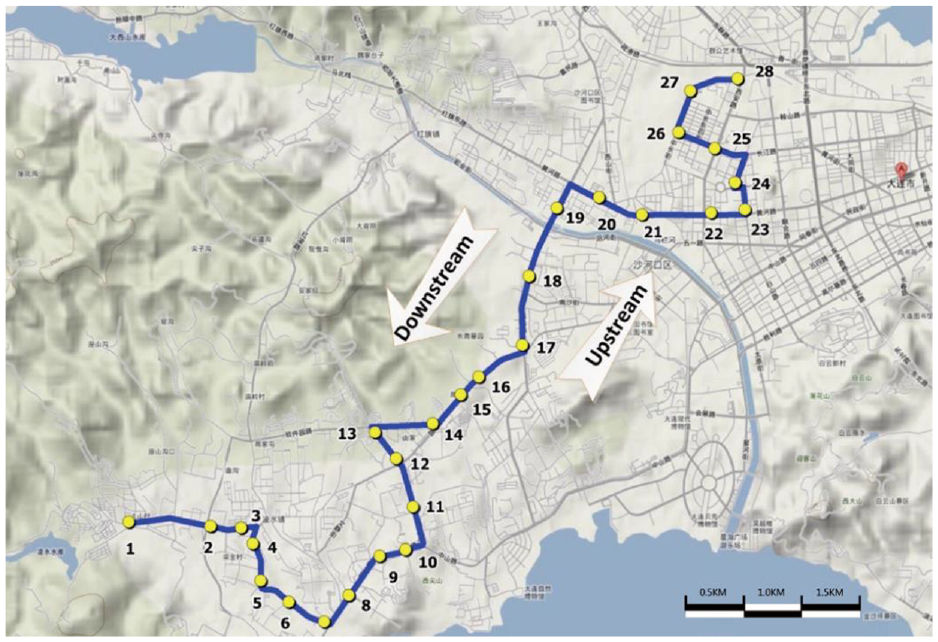
Configurations of bus route 10 in Dalian, China.
Headway of buses is the essential factor that can directly represent the level of transit service (reliability). Figure 7 shows a boxplot of headway with minimum, first-quartile, median, third-quartile, and maximum value of headway at different bus stops. Figure 7 shows that the average headway at all stops maintains 125 s, and the headway has a trend that increases with the sequence of bus stops. In other words, bus stops near the terminal usually have higher headway variation than that of bus stops near the originating station. This higher variation results from the accumulation and progressive increase of abnormal running, such as traffic congestion and so on. Figure 8 gives an example of headways of five buses on line 10 during the peak hours.
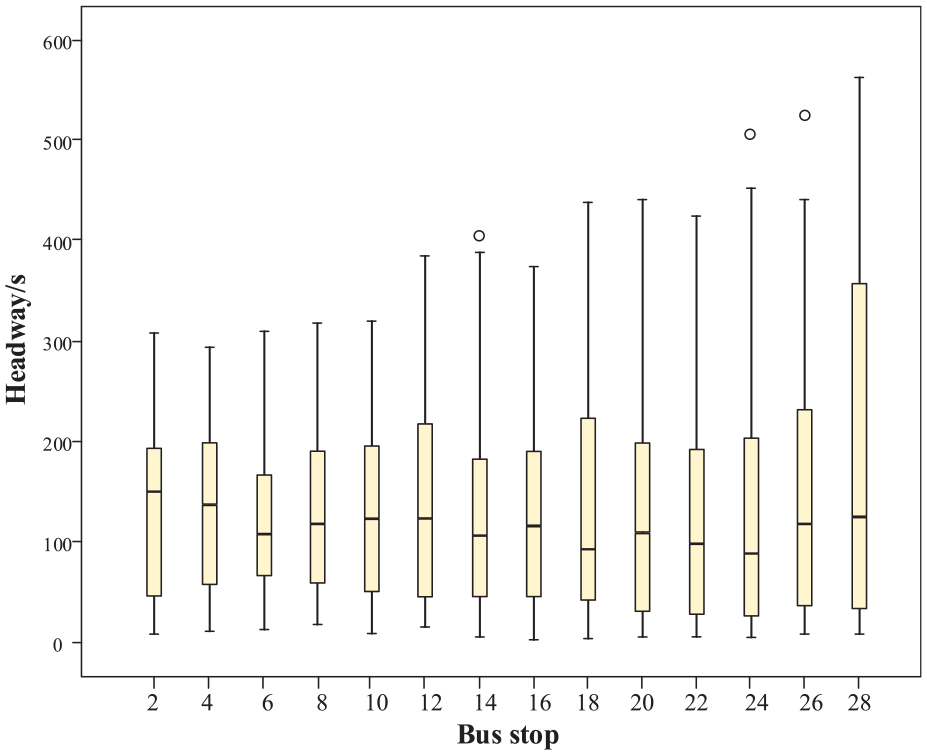
Bus headway at different bus stops of bus route 10 (upstream).
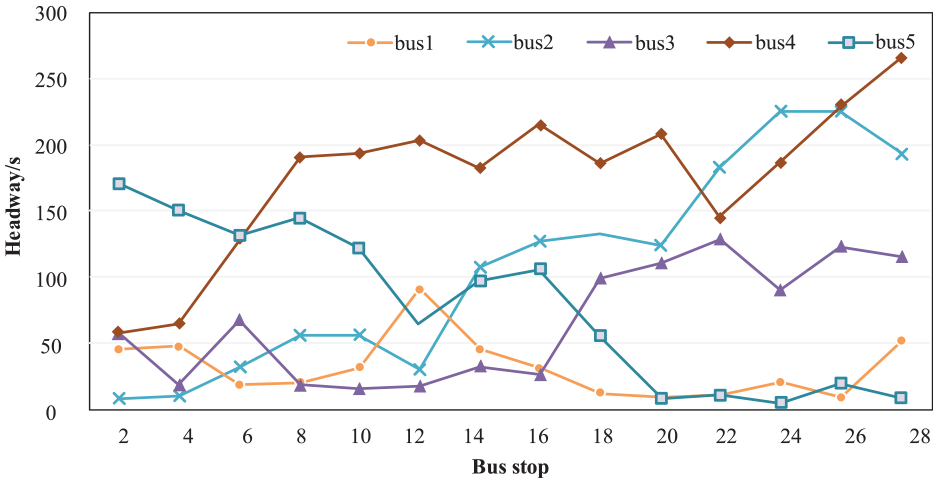
Headways of five buses on route 10 during 07:00–08:00 (upstream).
From Figure 8, it can be seen that there is a bunching between buses 4 and 5 since headway of bus 5 is small (close to 0). The operational statuses of some buses are strange, such as buses 3 and 4. By observing the small headways between buses 2 and 3, it can be concluded that bus 2 is always following bus 3 from stop 8 to 16. It shows a high possibility of passenger accumulation after buses 2 and 3, and leaving the “accumulated waiting passengers” to the next following bus (i.e. bus 4). Therefore, we can observe the large headways of bus 4 from stop 8 to stop 20, resulting from larger passenger flows and propagation of this “negative” effect.
To find an AOSVM with good features-learning capacity, two main steps need to be preprocessed: (1) selection of the kernel function and (2) selection of parameters in SVM. The kernel parameter, C, and epsilon were determined via grid search algorithm. The kernel RBF shows advantages in bus running time prediction.
28
Considering that SVM prediction in this paper is related to bus running, RBF is selected as the kernel function. In the literature, there are many methods to calibrate the parameters
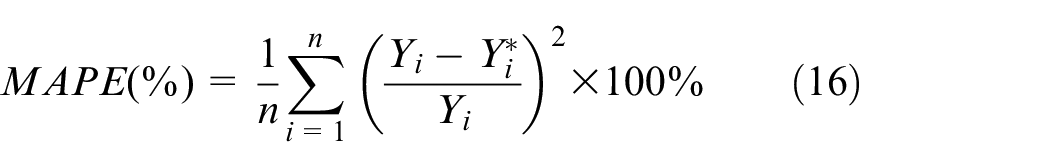
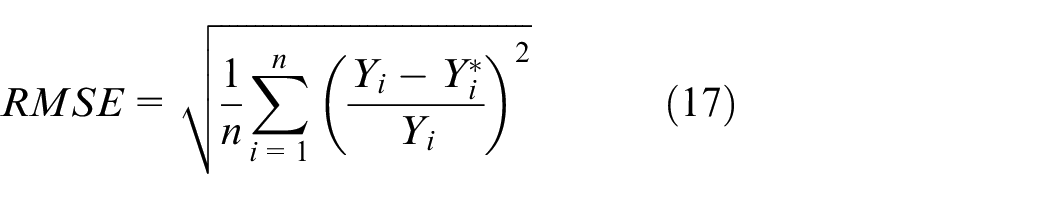
In order to verify the stability of the algorithm, the proposed AOSVM is used to predict for 10 times. The performance of the model is evaluated with two metrics: mean absolute percent error (MAPE) and root mean square error (RMSE). The formulas of MAPE and RMSE can be seen in formulas (16) and (17), and the prediction results are shown in Figure 9
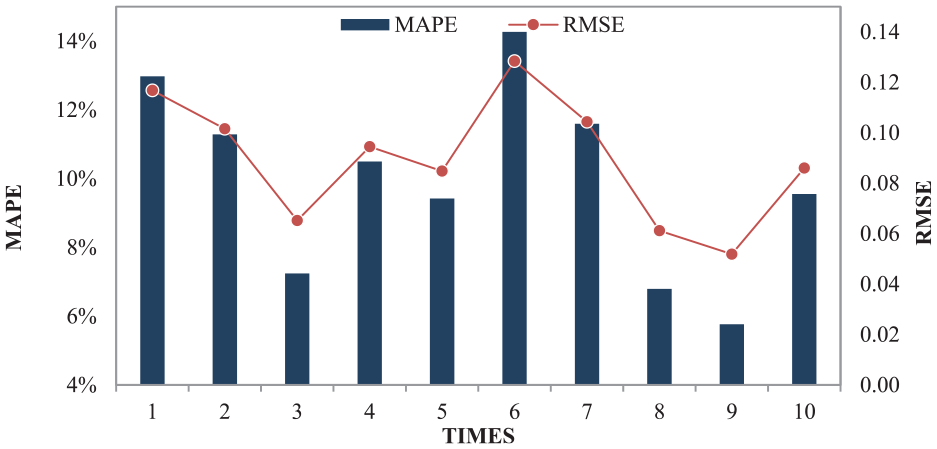
Prediction results using AOSVM for 10 times.
As we can see in Figure 9, the MAPE of 10 times calculation is lower than 15%, and RMSE has a mean value of about 0.08. The results illustrate that the AOSVM has a good stability and is feasible to predict the transit reliability.
In order to verify the accuracy of AOSVM, we use AOSVM, classic SVM (Cl-SVM), and GA-SVM, 55 respectively, to predict the reliability of bus route 10. The performances (if data updates) of different methods with limited running time are listed in Table 1. And in order to verify the influence of different methods of searching kernel parameters on the results of AOSVM, the kernel parameters of AOSVM are searched via both GA and grid search algorithm. And GA-SVM (SVM of which the kernel parameters searched by GA) is also compared with GS-SVM (SVM of which the kernel parameters are searched by grid search). Actually, the grid search is a kind of traversal algorithm and gets through all the parameters. As the result, the results obtained by the grid search method are better than those of the GA. However, the convergence speed of GA is much faster than that of the grid search. And the performances of different search algorithms with limited running time are summarized in Table 1. In this running-time-limit procedure, we substituted 5% (about 400 samples) of the training data set to inspect samples for 10 times with each time 0.5%. The running time is limited to 5 min with a dual-core processor (3.2 GHz) and 4G memory, and the procedure will stop if time-out, no matter where the progress bar (no. of the substitution, second or ninth substitution) is.
Comparison of performances among AOSVM, GA-SVM, GS-SVM, and Cl-SVM with limited running time.
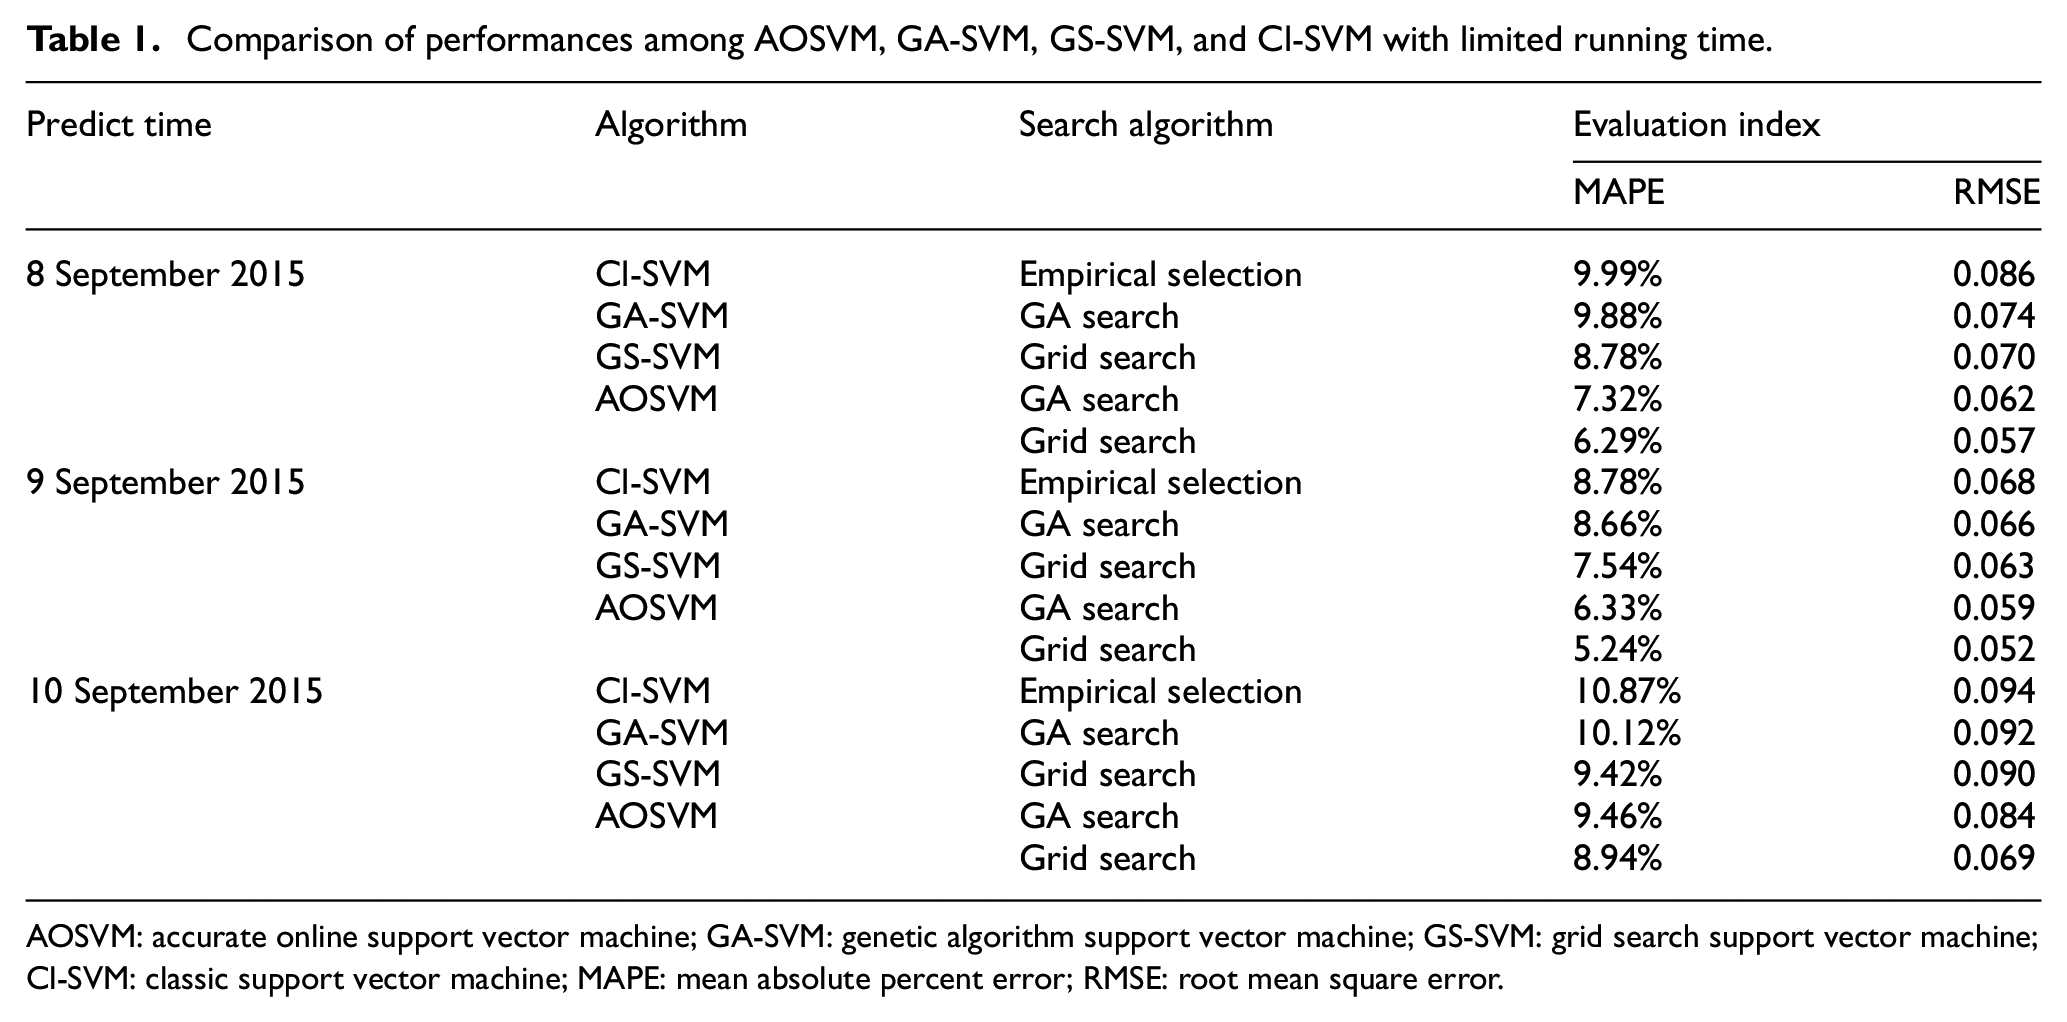
AOSVM: accurate online support vector machine; GA-SVM: genetic algorithm support vector machine; GS-SVM: grid search support vector machine; Cl-SVM: classic support vector machine; MAPE: mean absolute percent error; RMSE: root mean square error.
As we can see from Table 1, the MAPE or RMSE of GA-SVM is smaller than the Cl-SVM, and the performance of the classic SVM is the worst. It is because that in the GA-SVM technology, the parameters of SVM are optimized to reduce the margin of error. Considering the performance of AOSVM, we will find that the MAPE of AOSVM is obviously smaller than that of both Cl-SVM and GA-SVM. Owing to the strategy of adding new sample data to provide better support vector and updating the model online, the prediction accuracy of AOSVM is greatly improved.
The results of AOSVM are also compared with other three models: k-NN (k-nearest neighbors), ANN, and LR. The main reasons of selecting these three models for comparison are that LR is a classic method for regression with mathematical formulation, ANN is a well-known method in aspect of machine learning, and k-NN is an effective non-parameter method in prediction. In order to ensure fairness and scientificity when comparing the models, the same input data and output variable are used in the training and testing of different models. The parameter k in the k-NN model 56 in this paper varies from 1 to 5 and is finally set as 4 according to a comparison. When k = 1, 2, 3, or 5, the accuracy of k-NN is worse than that when k = 4. Therefore, we adopt the best parameter (k = 4) for the further comparison with other models. And a standard three-layer ANN 57 is used to predict the bus stop reliability. The number of hidden units are selected according to experience, generally set as 75% of the number of input layer nodes. The number of hidden units in ANN model in this paper varies from four to six and is finally set as five according to a comparison. As seen in Figure 10, AOSVM has the highest accuracy of prediction, followed by ANN, while LR performs the worst. Using AOSVM to predict the reliability of bus line 10 during a week, the results are shown in Figure 11.
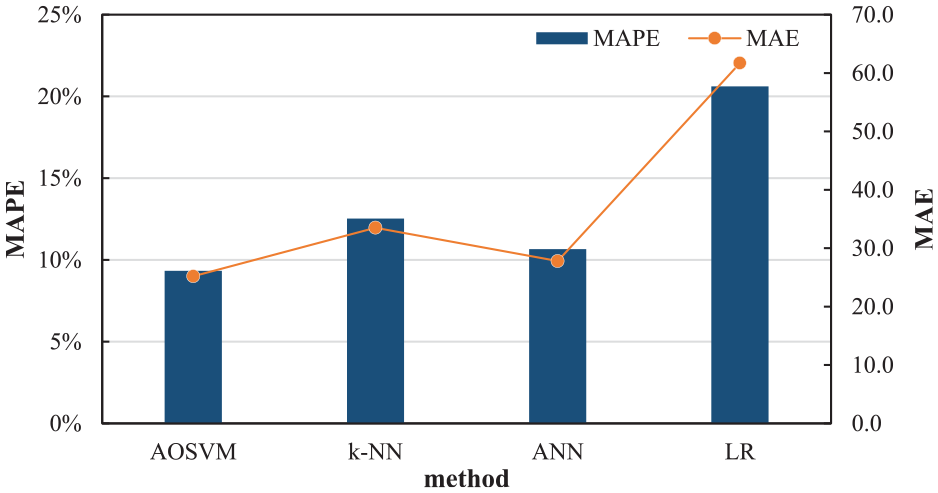
Performance of AOSVM, k-NN, ANN, and LR on predicting bus stop reliability.
Reliability prediction of transit during a week using AOSVM.
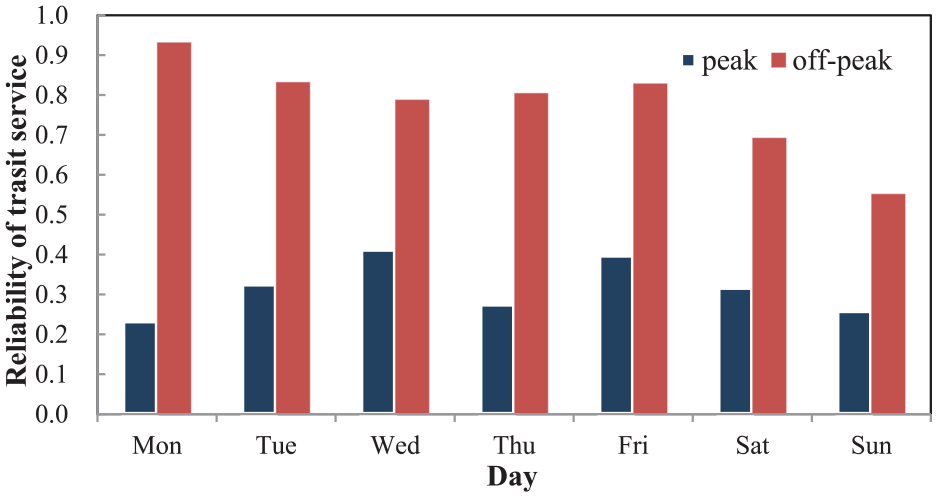
As we can see in Figure 11, the level of the reliability of public transport is around 0.8 in workdays. However, the reliability at the weekend is lower. This is because at the weekend, the passenger flows (Figure 12 shows passenger flows at a bus stop on various days) are relatively larger than workdays, which brings more uncertainty to public transit service. In peak times, the reliability of transit also shows the same trend and the reliability is lower than that in off-peak time. Thus, we can conclude that there is a great potential to improve the reliability of the public transit.
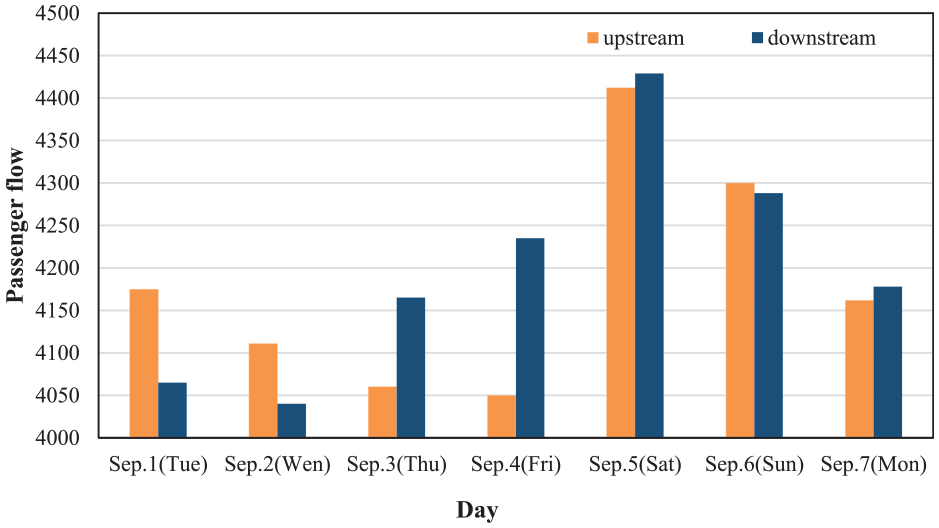
Passenger flows at bus stop 2 in different days (upstream and downstream).
Concerning on the reliability of bus stops, we use the AOSVM method to predict the reliability of stops in morning peak (6:30–8:00) and evening peak (4:30–6:30). Noting that the directions of the upstream and downstream are handled separately. The prediction results are shown in four different scenarios: morning and upstream (MU), morning and downstream (MD), evening and upstream (EU), and evening and downstream (ED). The results are shown in Figure 12.
As Figure 13 shows, the reliability reduces in the direction of upstream, while it increases in the opposite direction. And it can be seen that the transit reliabilities during morning peak and evening peak are similar. Furthermore, in both directions, the reliability during morning peak is lower than that during evening peak. Because of the bottleneck of traffic, the reliability of bus stop 6 is obviously low in both MU and EU. In contrast, the road line 18–19 is straight and smooth, making the reliability of bus stop 19 increase from 0.45 to 0.5.
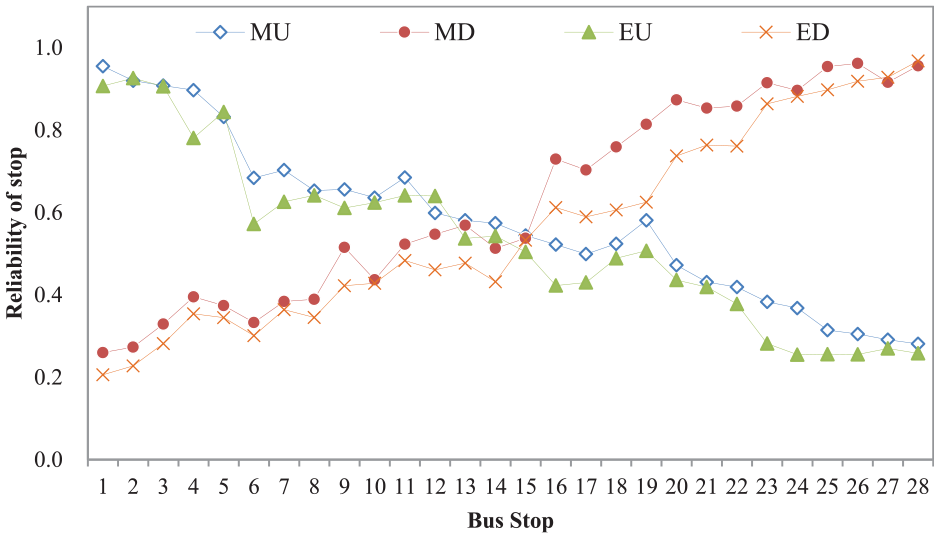
Reliability prediction of bus stops during peak using AOSVM.
Conclusion
In this paper, we proposed a reliability assessment method to obtain the reliability of bus stops and bus route service level. And then a reliability prediction method for future transit service using AOSVM was proposed. Studying the reliability of public transit can support the improvement of the transit service and shorten the actual travel time of passengers. Taking bus route 10 of Dalian as an example, the reliability prediction method proposed in this paper is verified. The prediction of bus reliability can improve the bus service. Better bus reliability prediction can improve the prediction accuracy of bus arrival time and provide better services for passengers.
Based on the above research, herein, we further studied transit service reliability. However, there are still some areas that have not been studied. In the future work, further research and analysis can be made, including the impact and treatment measures under the condition of insufficient reliability.
Footnotes
Declaration of conflicting interests
The author(s) declared no potential conflicts of interest with respect to the research, authorship, and/or publication of this article.
Funding
The author(s) disclosed receipt of the following financial support for the research, authorship, and/or publication of this article: This research was supported by National Natural Science Foundation of China 51578112 and The State Key Laboratory of Structural Analysis for Industrial Equipment S18307.