
Abstract
The application of high-speed real-time data acquisition is becoming increasingly wide spread in industrial field, and its measurement accuracy is also increasing. The closed-loop test system of sine wave signal is constructed by the RIGOL’s DG1022 dual-channel signal source, DS1102C oscilloscope and PCI7489 multifunctional data acquisition card. Three kinds of timing methods, such as Visual Basics (VB) Timer control, multimedia timer function timing and query performance frequency function timing method, were carried out a series of comparative experiments. This paper analyzes the correlation characteristics of the measured voltage peak data, which includes mean value, variance, standard deviation, range, mutation system, deviation, kurtosis and so on, and then finds out the influence rules of software timing error on data acquisition and measurement accuracy. In the high-speed data acquisition, the repeatability error can be reduced from 84.22% to 0.62%, which provides scientific basis and reference for selecting software timing method in different test environment.
Introduction
With the rapid development of various measuring instruments and equipment, the demand for accuracy and real-time of data acquisition system measurement is also increasing.1–4 Usually in the time of data acquisition, it is generally believed that the set of collection time interval is accurate, often ignoring the existence of timing errors, and very few people do this research. However, in the experiment, it was found that the software timing error existed in different timing methods.
In order to improve the accuracy of the data acquisition system, ensure the accuracy and reliability of measurement and control process, the timing error of the system software was analyzed and studied. Sine wave signal was widely used in many fields, such as computer, communication and industrial control and so on.5–11 Therefore, the standard sine wave signal was used as test object, constructed the closed-loop testing system of the sine wave signal, and several different software timing methods were experimentally studied, meanwhile, the influence of software timing error on the data acquisition accuracy was analyzed.
In general, most programming languages use the multimedia timer function timing method and query performance frequency function timing method as the timing control methods in the data acquisition process, also take into account Visual Basic’s (VB) own timer control. The timer control, as a time control with VB, is easiest to use, and it has only one timer event. When the time interval that specified by the interval property is reached, the time control automatically triggers the control. Using the multimedia timer function, it is defined in Winmm.dll and timed for the media playback service. The query performance frequency function is to obtain the oscillation frequency of query performance frequency counter, when this function is called, the function save the oscillation frequency of the system frequency counter. By calling the number of system oscillation and frequency, the sampling time interval = the number of oscillation*frequency, so that the sampling process can be controlled accurately.12–15 In addition, VB can access the port by calling the dynamic-link library (DLL), and realize the real-time programmable control of data acquisition card.
According to the standard sine wave signal with different amplitude and frequency, three different software timing methods were used. In the case of different sampling time length and different frequency, a series of contrast experiments were carried out, and as a result, it obtained the corresponding measurement error, and found the effect of software timing error on data acquisition and measurement accuracy.
Subject and methods
Frame construction of hardware experimental system
The system used sine wave signal of different frequencies and amplitudes outputted by RIGOL DG1022 as test signal, and DS1102C digital oscilloscope is applied to monitor the test signal. RIGOL DG1022 dual-channel function/arbitrary waveform generator, which used Direct Digital Frequency Synthesis (DDS) technology design, not only produced accurate, stable and low distortion output signal but also outputted the highest 20 MHz sine wave, meanwhile, it had seamless interconnect with DS1000 series digital oscilloscope.
At the same time, the system used PCI-7489 board test signal data acquisition. PCI-7489 was a multifunctional high-performance integrated data acquisition interface board designed for industrial PC. The board had 16-bit 16-channel/differential 8-way analog-to-digital (A/D) input, 4-channel 16-bit independent digital-to-analog (D/A) output, and its A/D converter chip adopted high-performance AD676 chips, the highest conversion rate was up to 100 kHz.
The test system is shown in Figure 1. RIGOL DG1022 could generate the sine wave signal; the system used PCI-7489 board to pick up this sine wave signal with three different software timing methods. The results of signal acquisition are compared with DS1102C digital oscilloscope, and the measurement errors of different timing methods are obtained.
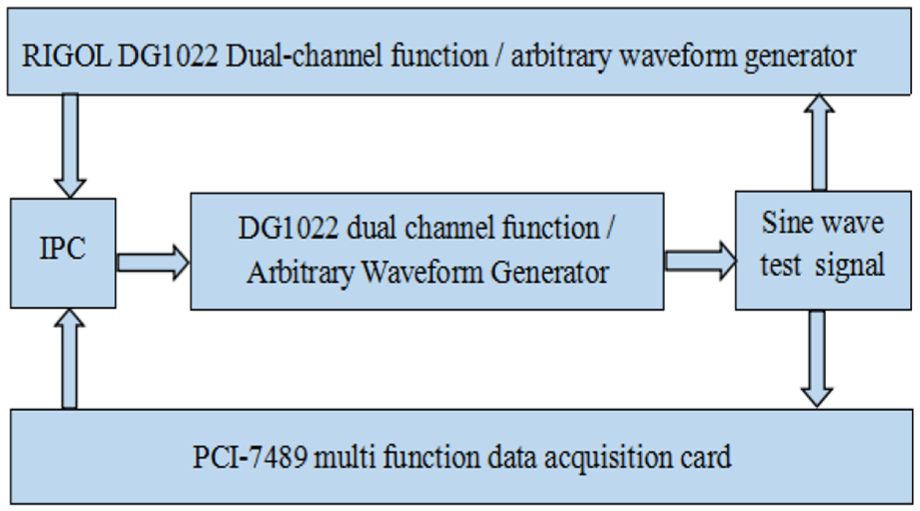
Hardware framework of test system.
Figure 2 showed physical map.
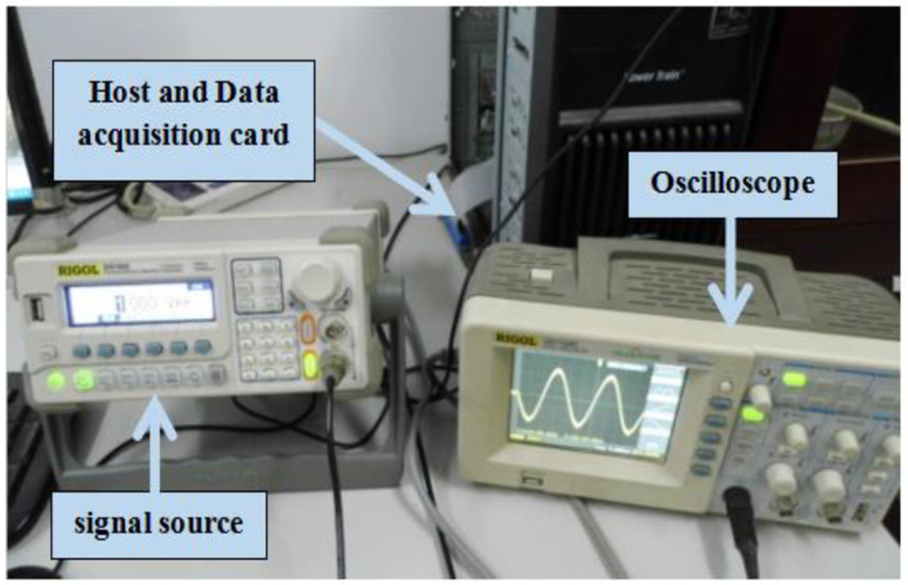
System hardware physical map.
Test system software frame
The system adopted VB program to realize real-time programmable control of data acquisition card PCI-7489. Through the VB program timer control, multimedia timer function time and query performance frequency timing, three kinds of timer method determined the sampling interval of data collection. The data acquisition accuracy of different signals could be obtained, and the measuring precision of the collected datum were compared with each other. The overall test software frame and program interface were shown in Figures 3 and 4.
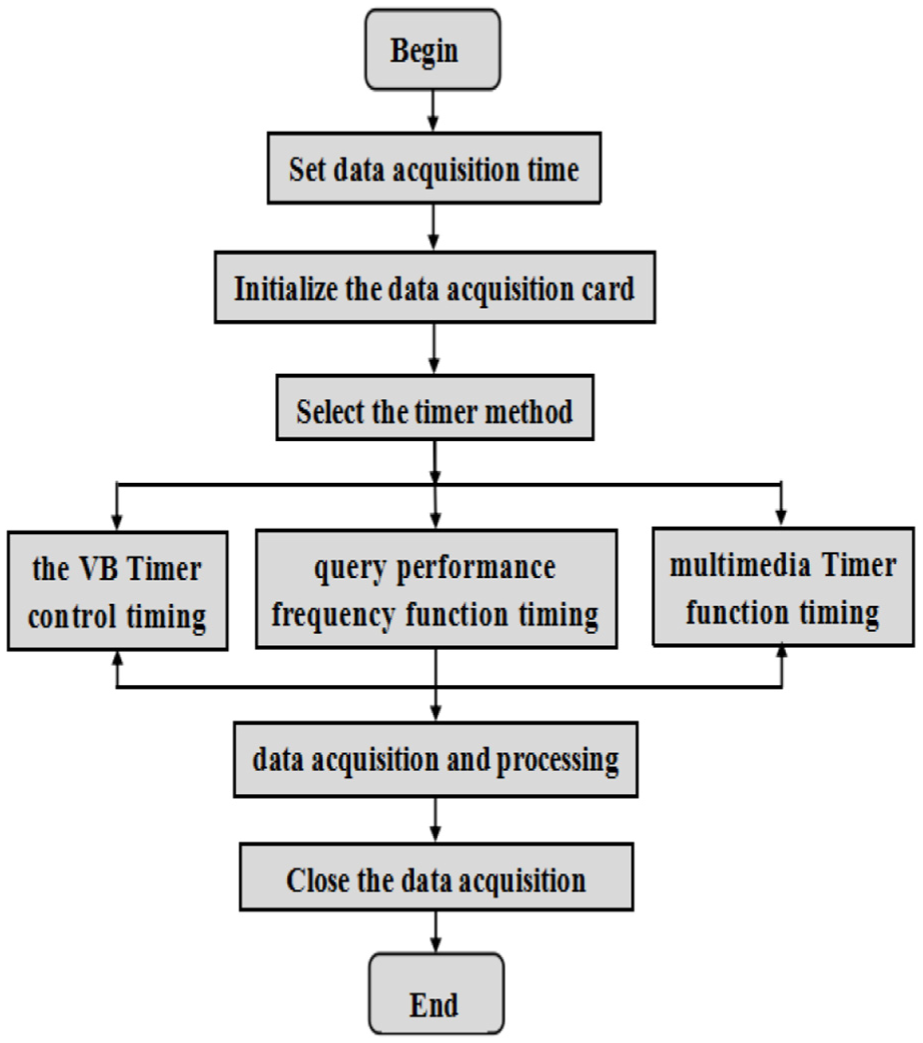
Program flow of data acquisition.
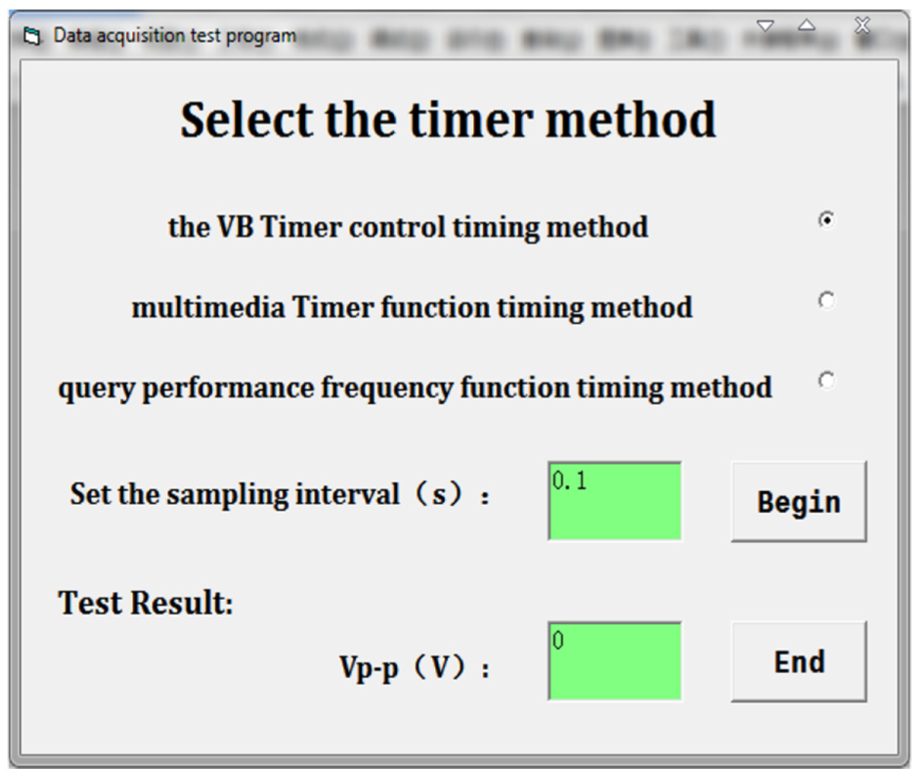
Test program interface.
Characteristic experiment of data acquisition and measurement accuracy
The comparison test of acquisition measurement accuracy of different timing time
Setting RIGOL DG1022 dual-channel function/arbitrary waveform generator to issue a working frequency of 50 Hz, the peak-to-peak value of 1 V sine signal, through the data acquisition card PCI-7489 measured the peak-to-peak value of sine wave signal, where the sampling timing was set to 50 ms, 500 ms, 1 s, 30 s and 60 s, respectively. Three types of timer interval were set to minimum value, carried out comparative test to data measurement accuracy, and each group of tests repeated six times, and the results were as shown in Table 1.
Peak voltage data acquisition at different sampling time (V).
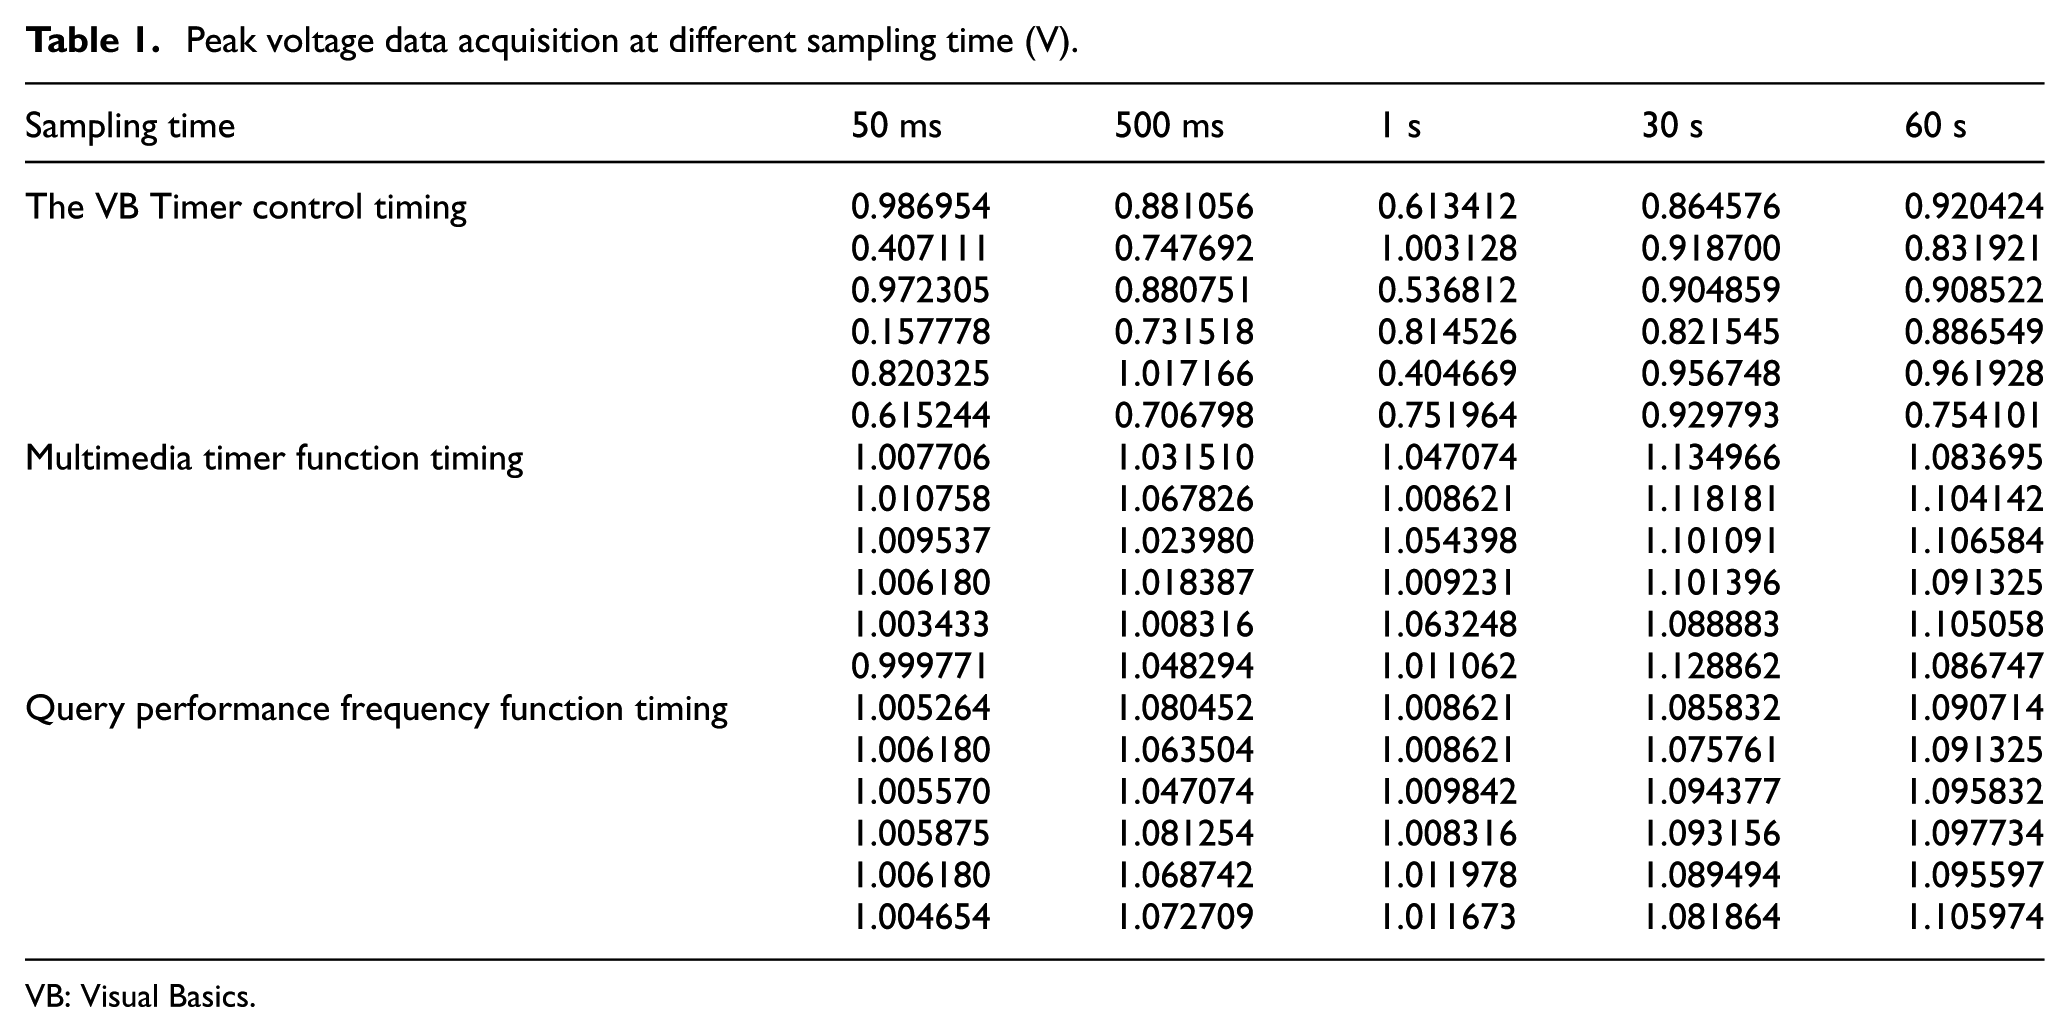
VB: Visual Basics.
Through the comparison of peak data acquisition voltage at different timing time, when the peak-to-peak value of the measurement signal was 1 V, and the operating frequency was 50 Hz, the VB Timer control timing method was very unstable in the acquisition process, and fluctuations and errors were also very large. While the multimedia timer method and query performance frequency function timing method were relatively stable, the data values changed little, and the precision was relatively high. The results were shown in Figure 5, where the horizontal line represents the reference value of the set voltage peak.
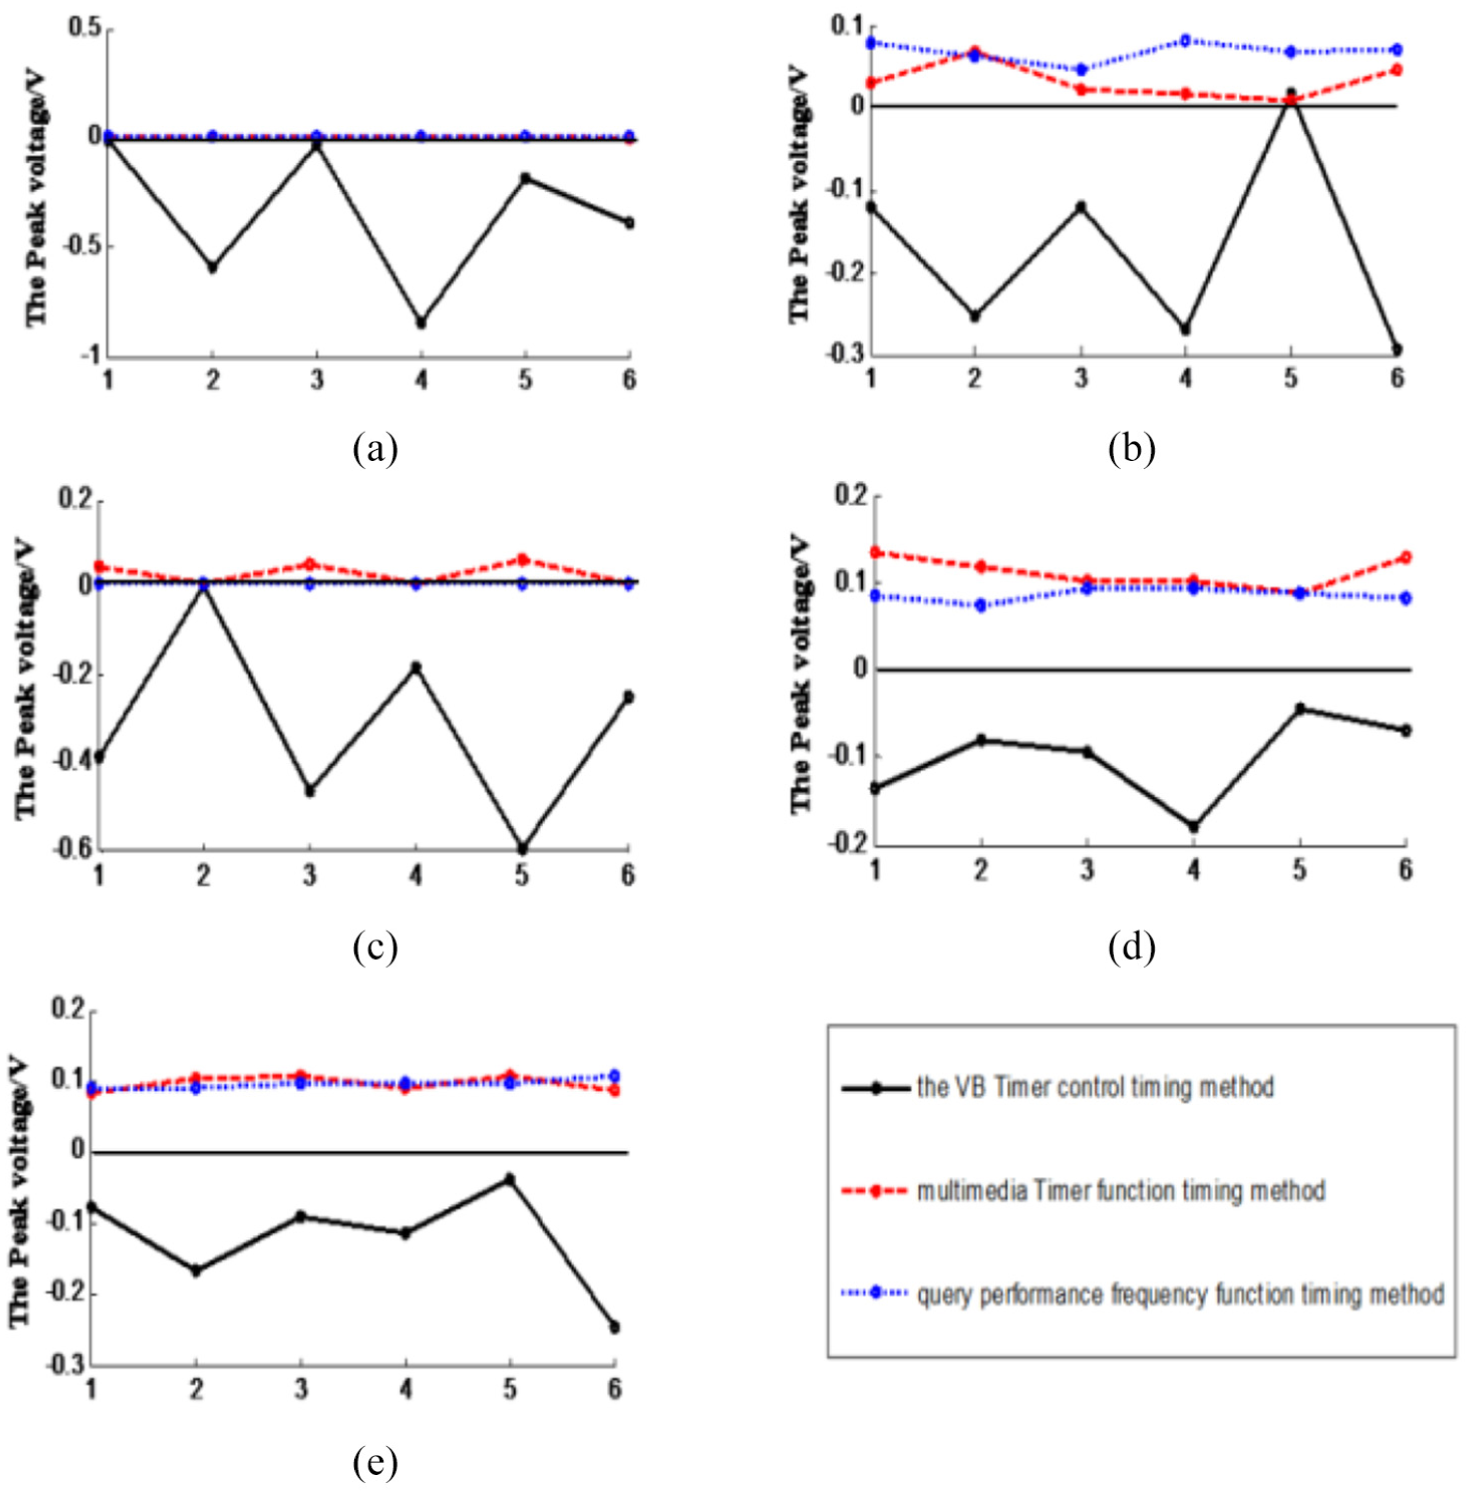
Error curve of acquisition and measurement at different time: (a) sampling interval = 50 ms, (b) sampling interval = 500 ms, (c) sampling interval = 1 s, (d) sampling interval = 30 s and (e) sampling interval = 60 s.
Skewness is also called Partial degrees or Skewness coefficient, is a measurement of the deflection direction and degree of the statistical data distribution and is a numerical characteristic of the asymmetric degree of statistical data distribution. Skewness can be used to characterize the probability distribution density curve relative to the average asymmetry degree of the feature number. Intuitively, this is the relative length at the tail of density function curve, and the calculation formula is defined as
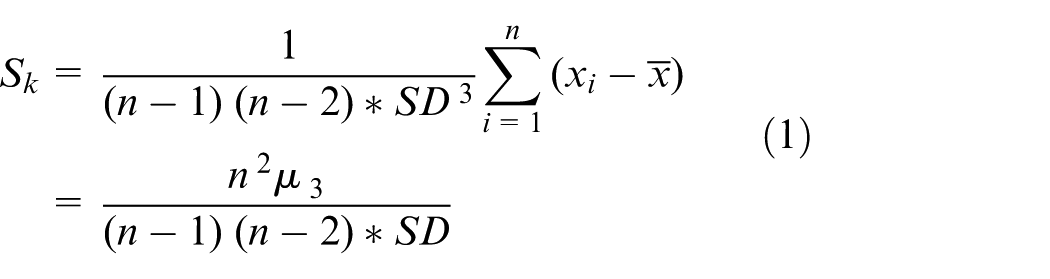
where n is the number of samples, xi is the sample value,
Kurtosis (PK), also known as the peak coefficient, refers to the peak level of the number distribution curve, which is another important feature of the number distribution, and is used to characterize the probability density distribution curve at the average value of the number of special. Intuitively, the kurtosis reflects the thickness of the tail. The calculation formula can be expressed as
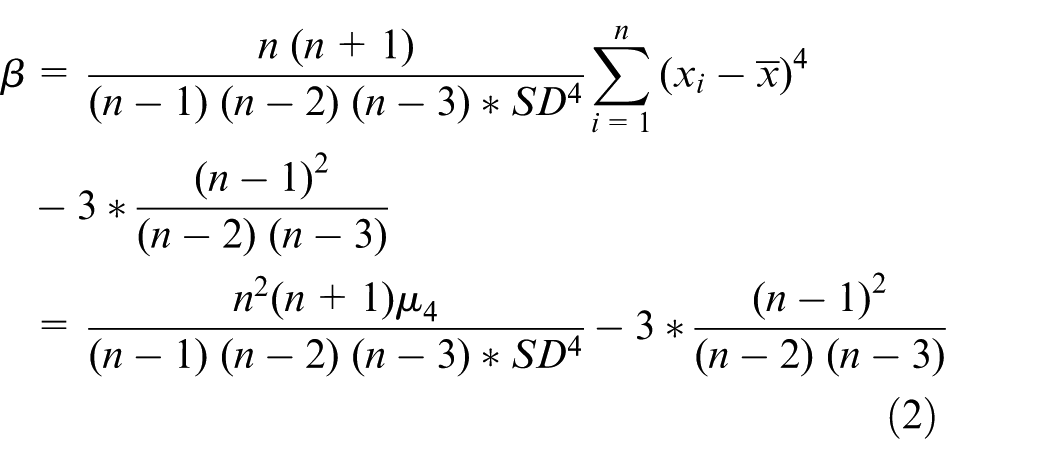
where SD is the standard deviation of sample data,
Repeatability error refers to the random error obtained from the same direction for multiple continuous measurement of the same input value in the whole measurement range and under the same working condition. By comparing the skewness and kurtosis characteristics of multiple data acquisition points at different times, we could see that the data were the most unstable by the VB Timer control method, the range of error was very large, the distribution of the collection point was the most discrete and the repeatability error was the biggest. While the data collected by the multimedia timer function timing method and query performance frequency function timing method were relatively stable, both of which had the advantages of small fluctuation range of error value, centralized distribution of collection point and minimal repeatability error. Among them, the query performance frequency function timing method collected the highest data accuracy. The data of Table 1 were analyzed to obtain the correction characteristics of peak voltage data at different times, including mean value, variance, standard deviation, range, coefficient of variation, deviation, kurtosis and so on, as shown in Table 2.
Correlation characteristics of peak voltage data collected at different timing time.
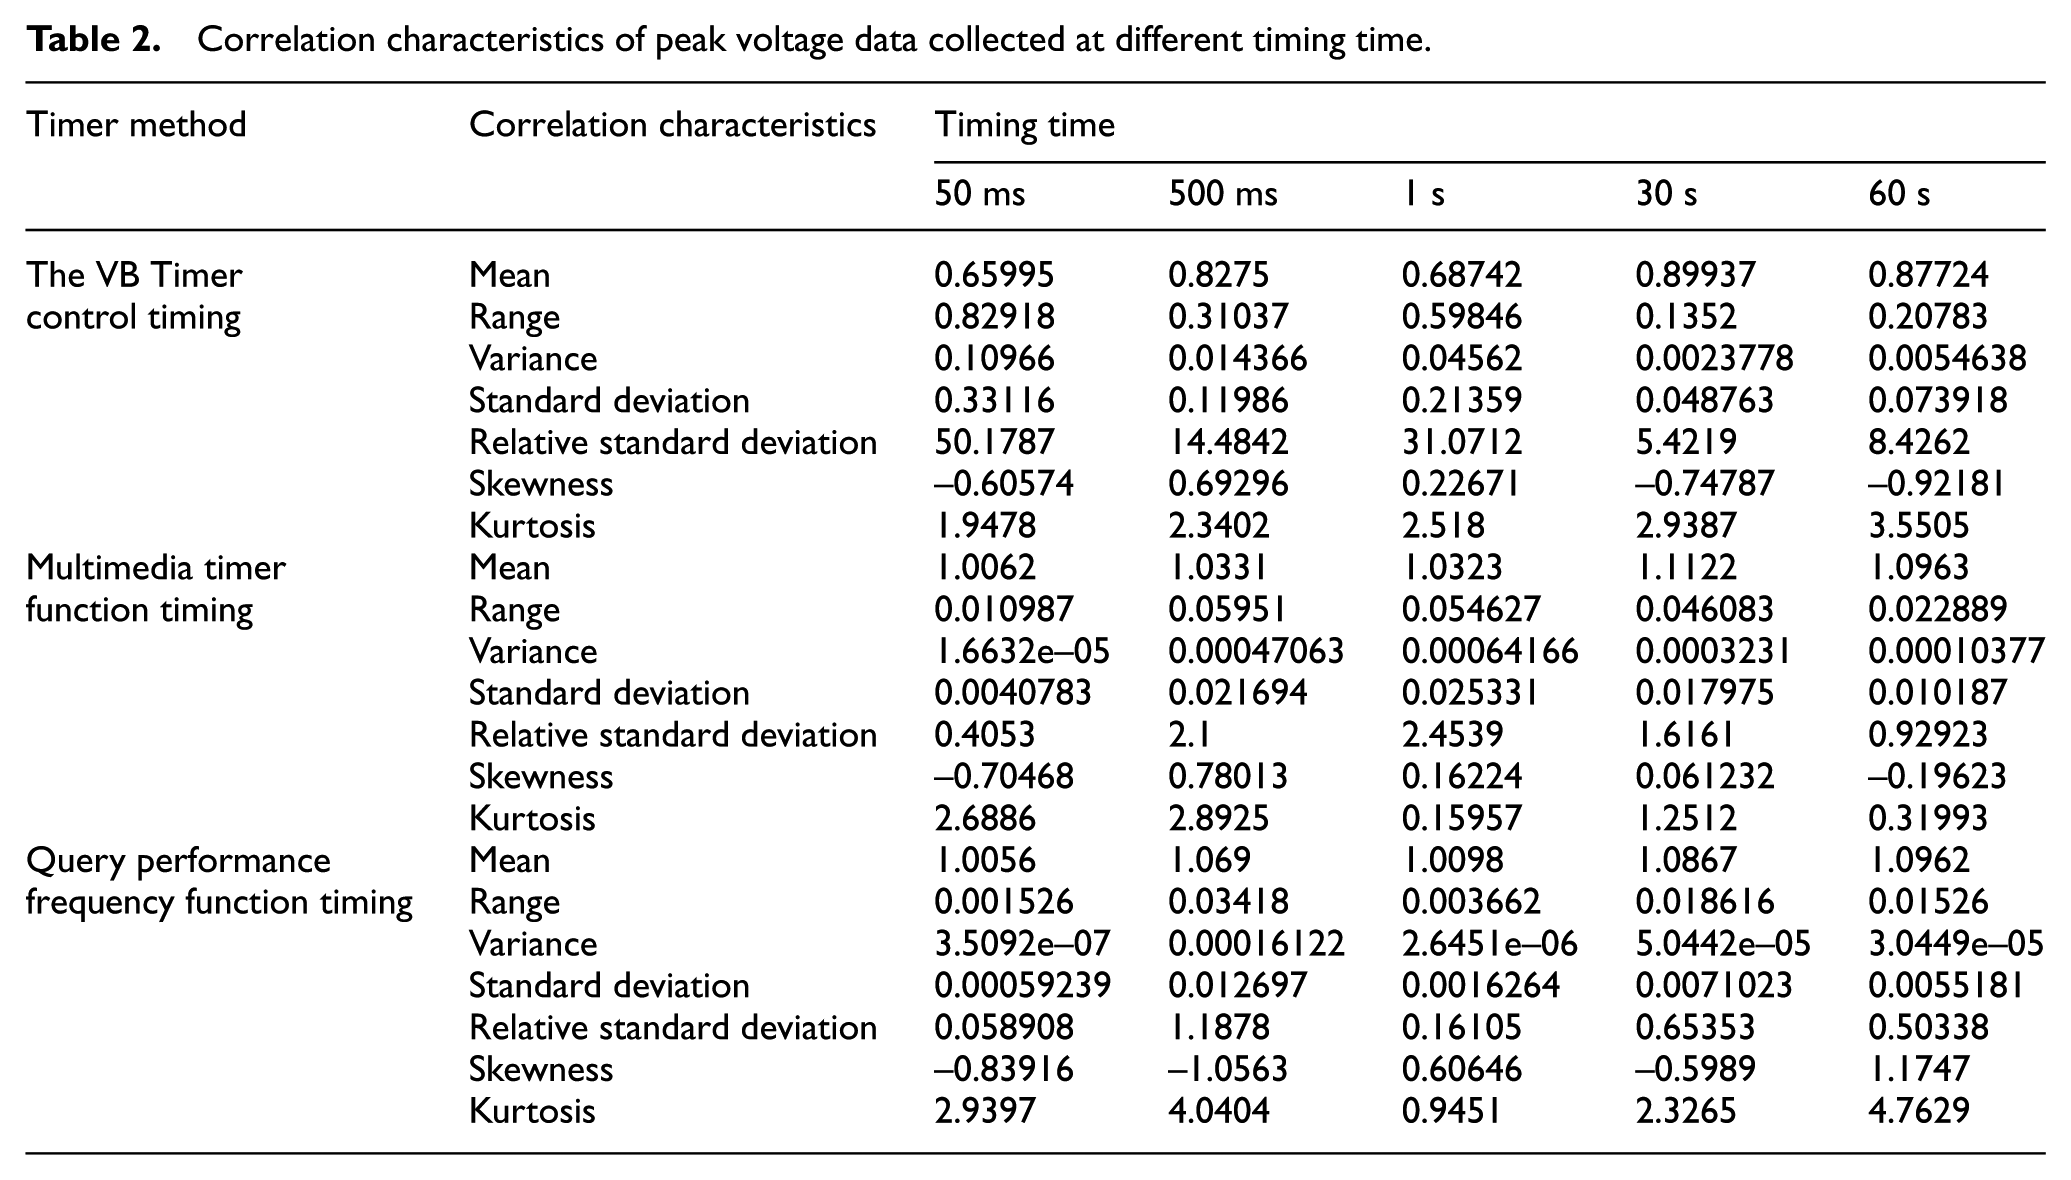
When data collection time is very short, such as 50 ms, and sine wave signal frequency is 50 Hz, theoretically occur up to three peaks, but the VB Timer control timing already has been difficult to control the data acquisition card to capture the peak-to-peak value of sine wave accurately, the results of measurements standard deviation is 0.3312, and the measurement error up to 84.22%. While multimedia timer function timing and query performance frequency function time control to data acquisition card can still relatively accurately capture the peak-to-peak value of sine wave, in which the measurement error of multimedia timer function timing method is 1.16%, the results of measurements standard deviation is 0.0041, while the error of query performance frequency function timing method is only 0.62%, the results of measurements standard deviation is only 0.0006, the measurement accuracy is the highest.
With the extension of data acquisition time, from 50 ms to 60 s, it is clear that the peak-to-peak measurements with three different timing methods are gradually stabilized. With the increasing of sampling interval, the probability to capture the maximum peak value is also greatly increased. After repeated comparison and test, the maximum repeatability error value of data acquisition by VB Timer control timing is 82.9%, and the maximum repeatability error of multimedia timer function timing is 6%, the query performance frequency function timing is 3.4% and the test accuracy is also the highest, as shown in Figure 6.
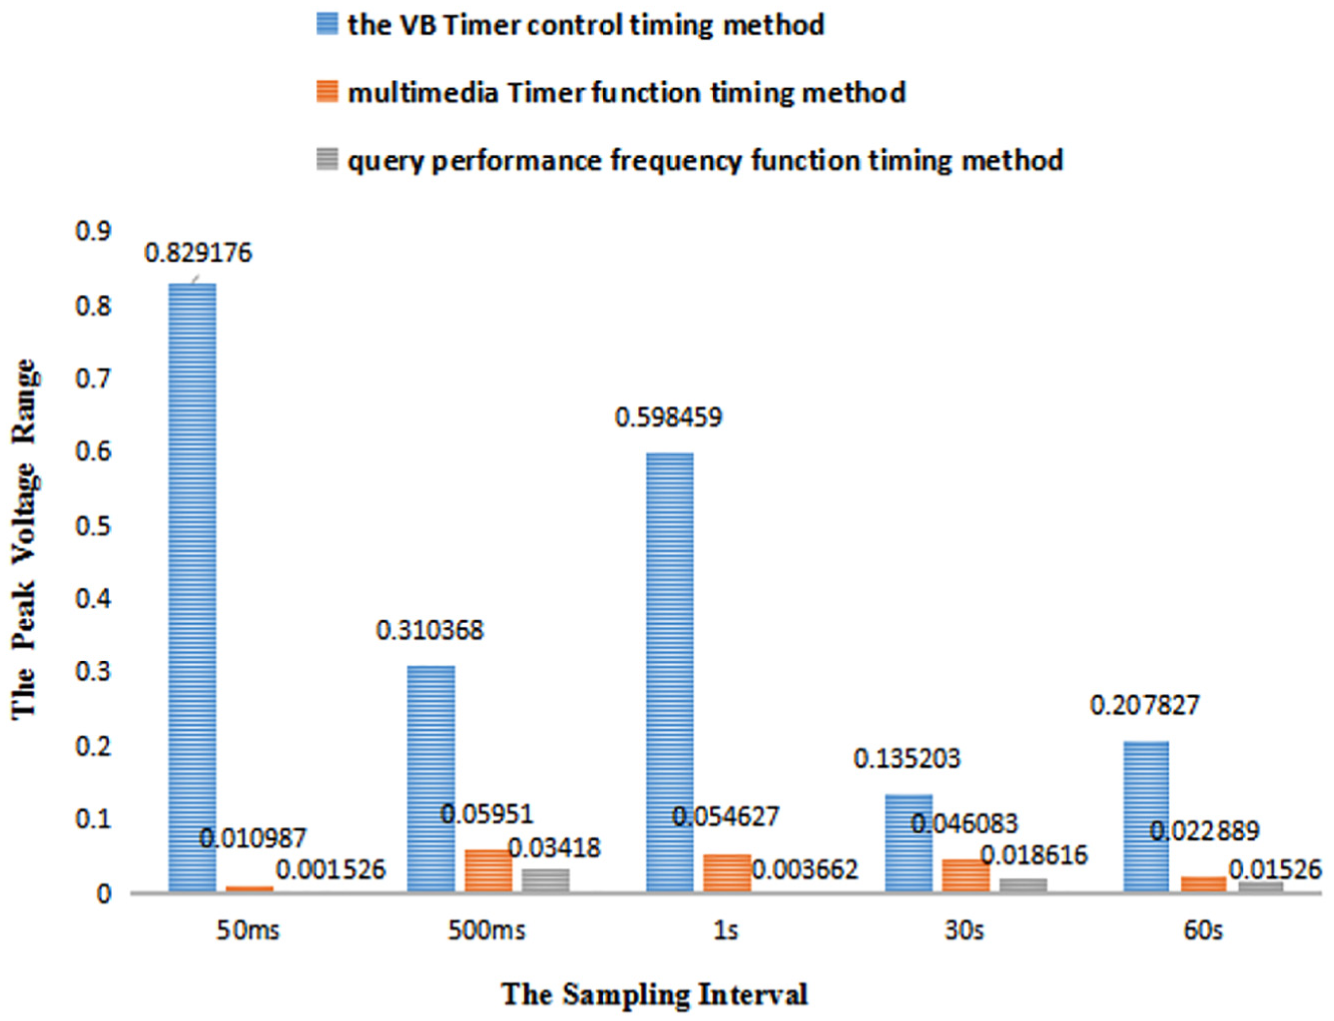
Repeatability error of data acquisition points under different sampling intervals.
Sine wave acquisition signal analysis test
Through the observation and analysis of the test data in Tables 1 and 2, we can clearly find that with the increasing of sampling time, the measured results of peak voltage are gradually getting bigger, and the data results are not getting nearer to the set value of 1 V, but slowly approaching 1.1 V. Is this phenomenon caused by the fact that the actual peak value of the sine wave output from the signal source exceeds 1 V, or is it caused by the measurement error of the data collection method of the acquisition card? For this purpose, sine wave test signal has been tested with RIGOL DS1102C digital oscilloscope and validated. The waveform obtained from the experiment is shown in Figure 7.
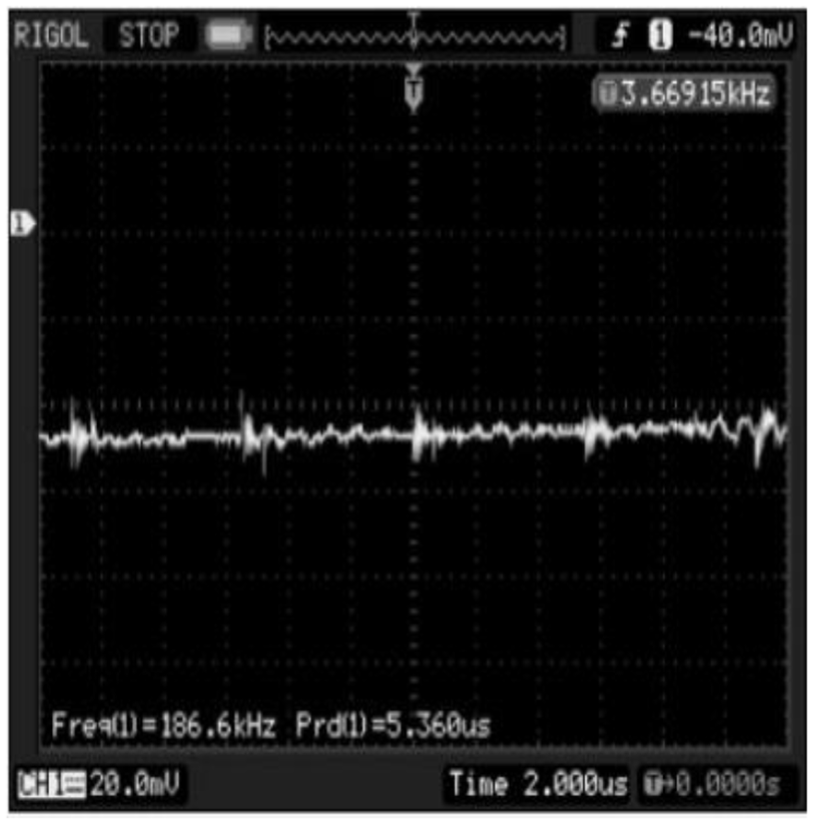
Sine wave test signal.
Theoretically, the working frequency is 50 Hz, and the peak-to-peak value of sine signal should be 1 V; however, the actual measurement result is superimposed on a ripple voltage signal whose peak value is about 100 mV, and the frequency is about 3.7 kHz. It can be concluded that when sampling time of the data acquisition card is long enough, the probability of the measured actual voltage peak is greater, and the measured value is close to the real value—1.1 V.
Comparison test of measurement accuracy with different frequency
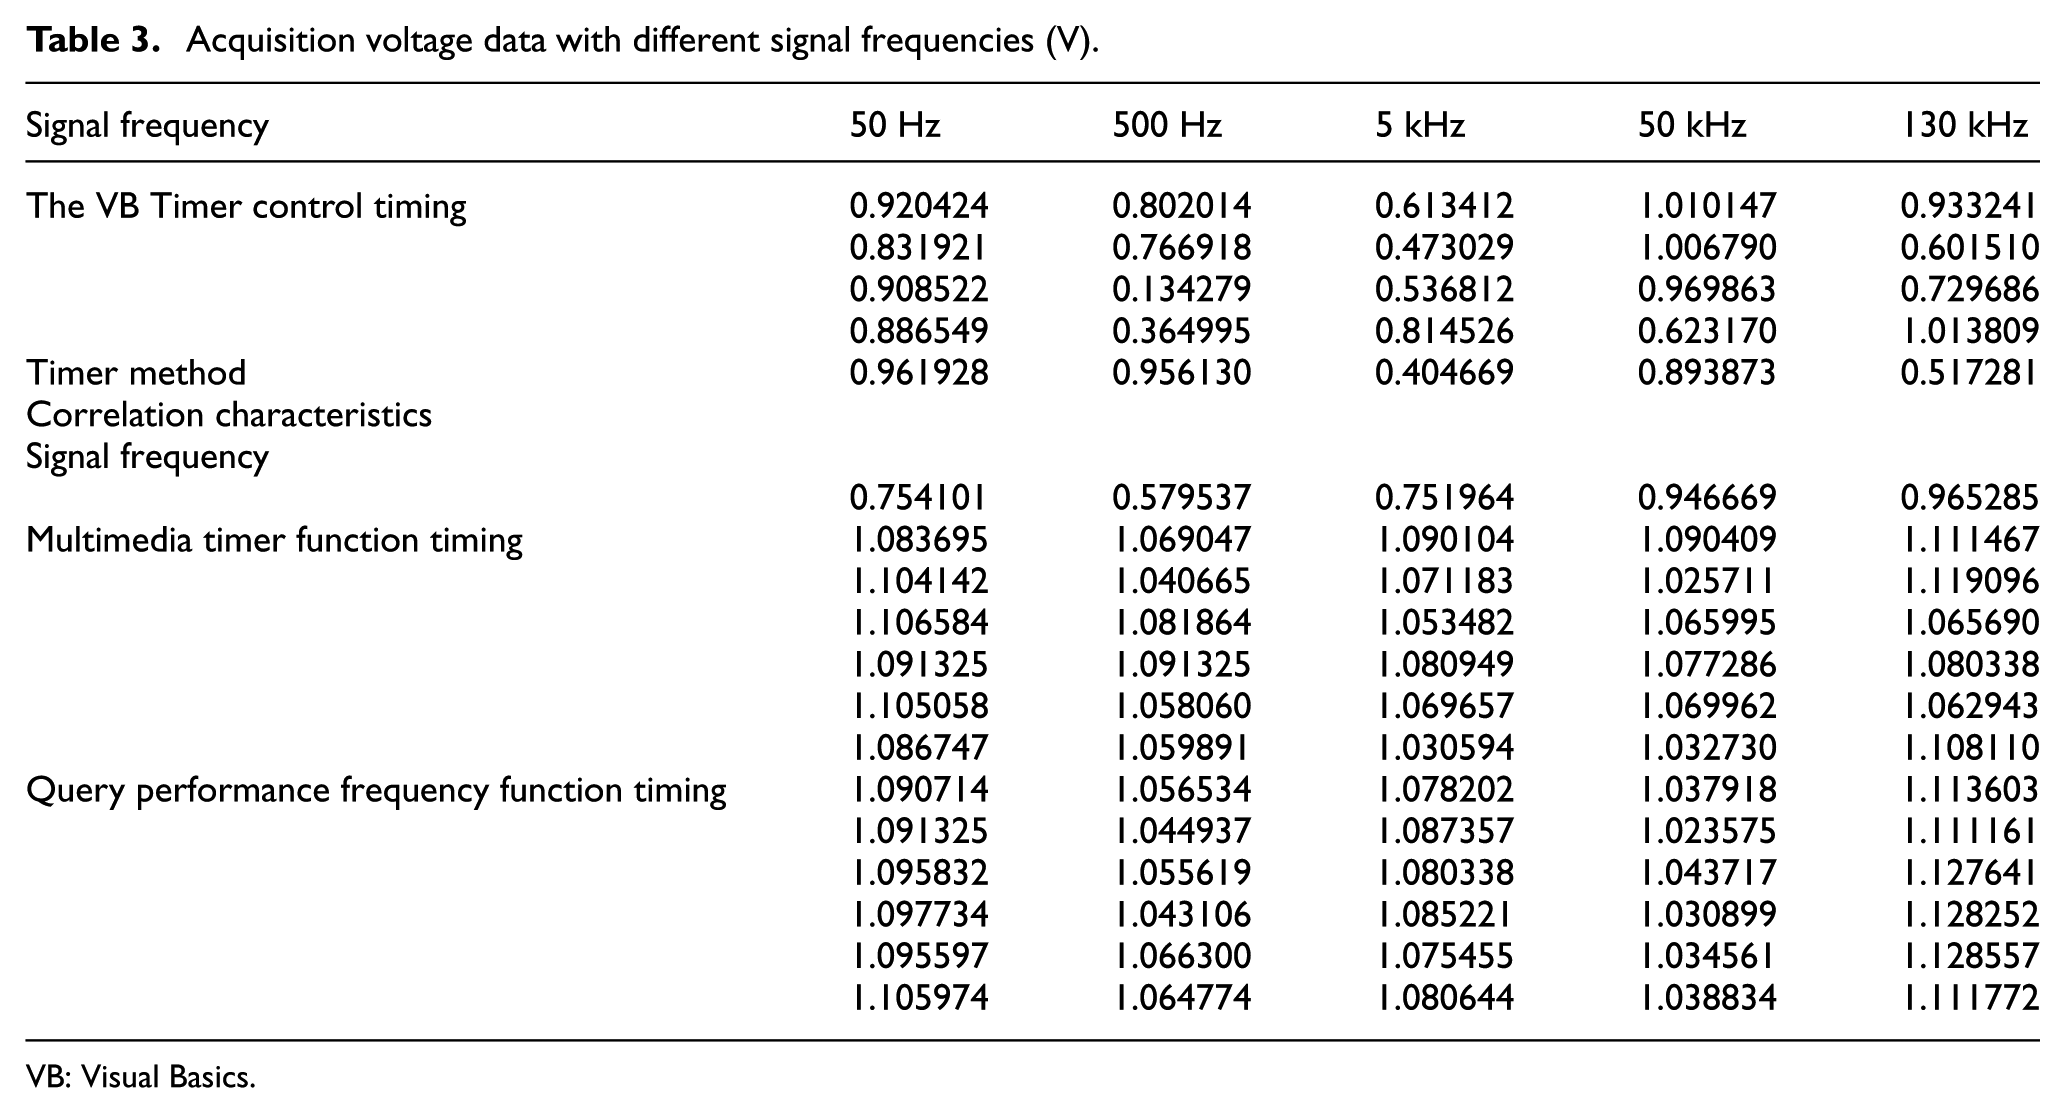
In practical engineering applications, the signal frequency of the object being measured may not be fixed, so how does the working frequency of different timing methods affect accuracy of the data measurement? Therefore, a third experiment was conducted. A sine signal with 1-V peak value was generated by RIGOL DG1022 dual-channel function/arbitrary waveform generator, the frequency were set to 50 Hz, 500 Hz, 5 kHz, 50 kHz and 100 kHz, sampling time was set to 1 s, the data measurement accuracy comparative tests were done and each group still repeated six times. Table 3 shows the experimental results.
Acquisition voltage data with different signal frequencies (V).
VB: Visual Basics.
With the variation trend of the voltage peak point in different signal frequencies, it could be found when peak-to-peak value was 1 V and sampling time was 1 s, the VB Timer control timing method in the acquisition process was still unstable, the maximum measurement error could reach 46.4%, and the measured data value fluctuated greatly with large error. The acquisition process using multimedia timer timing method and query performance frequency function timing method was relatively stable, the data values changed little and the precision was relatively high. The variation curve of the measurement error value of collecting voltage peak data at different signal frequencies was shown in Figure 8.
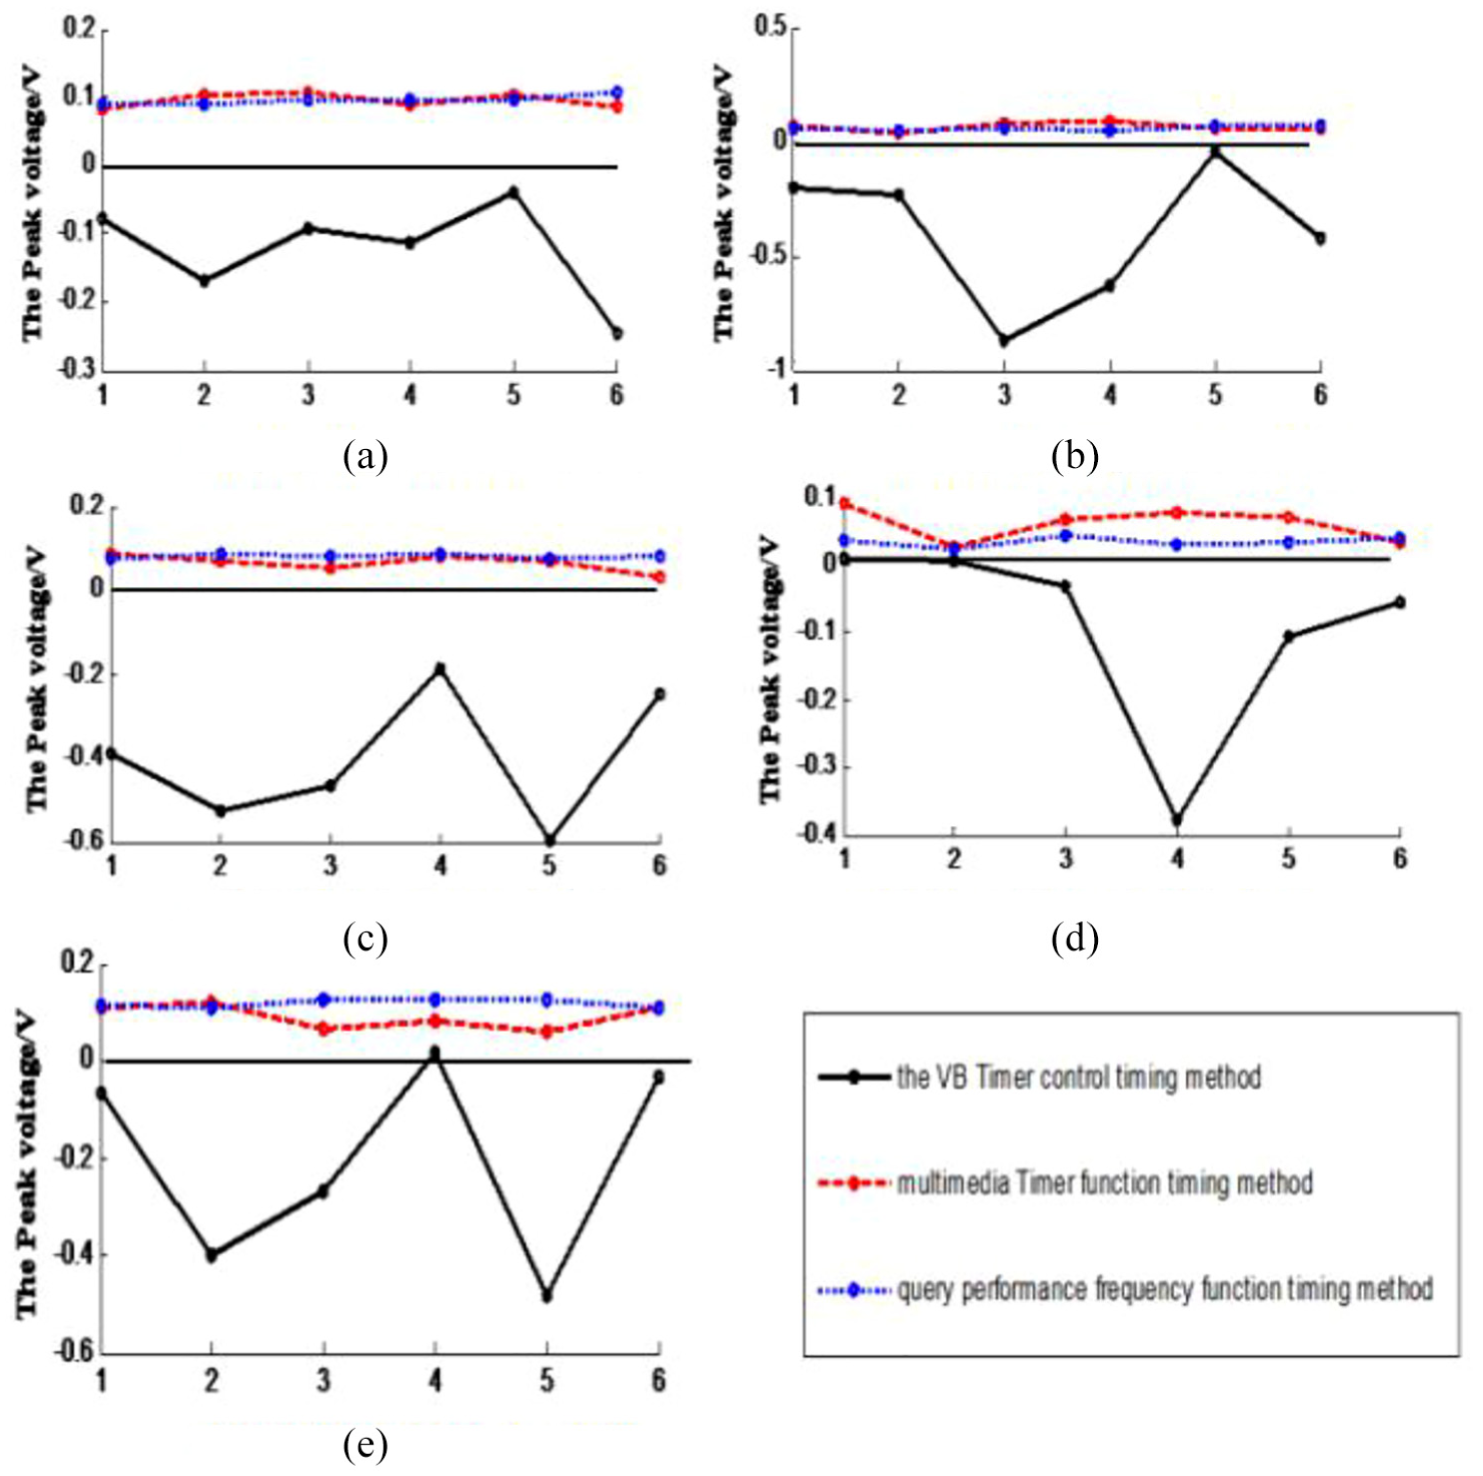
Error curve of acquisition voltage under different signal frequencies: (a) sampling frequency = 50 Hz, (b) sampling frequency 500 Hz, (c) sampling frequency 5 kHz, (d) sampling frequency 50 kHz and (e) sampling frequency 50 kHz.
At different signal frequencies, the data derived from multimedia timer timing method and query performance frequency function timing method were relatively stable, which the maximum error value of multimedia timer method was 3.6%, and the maximum error value of query performance frequency function timing method was 5.5%.
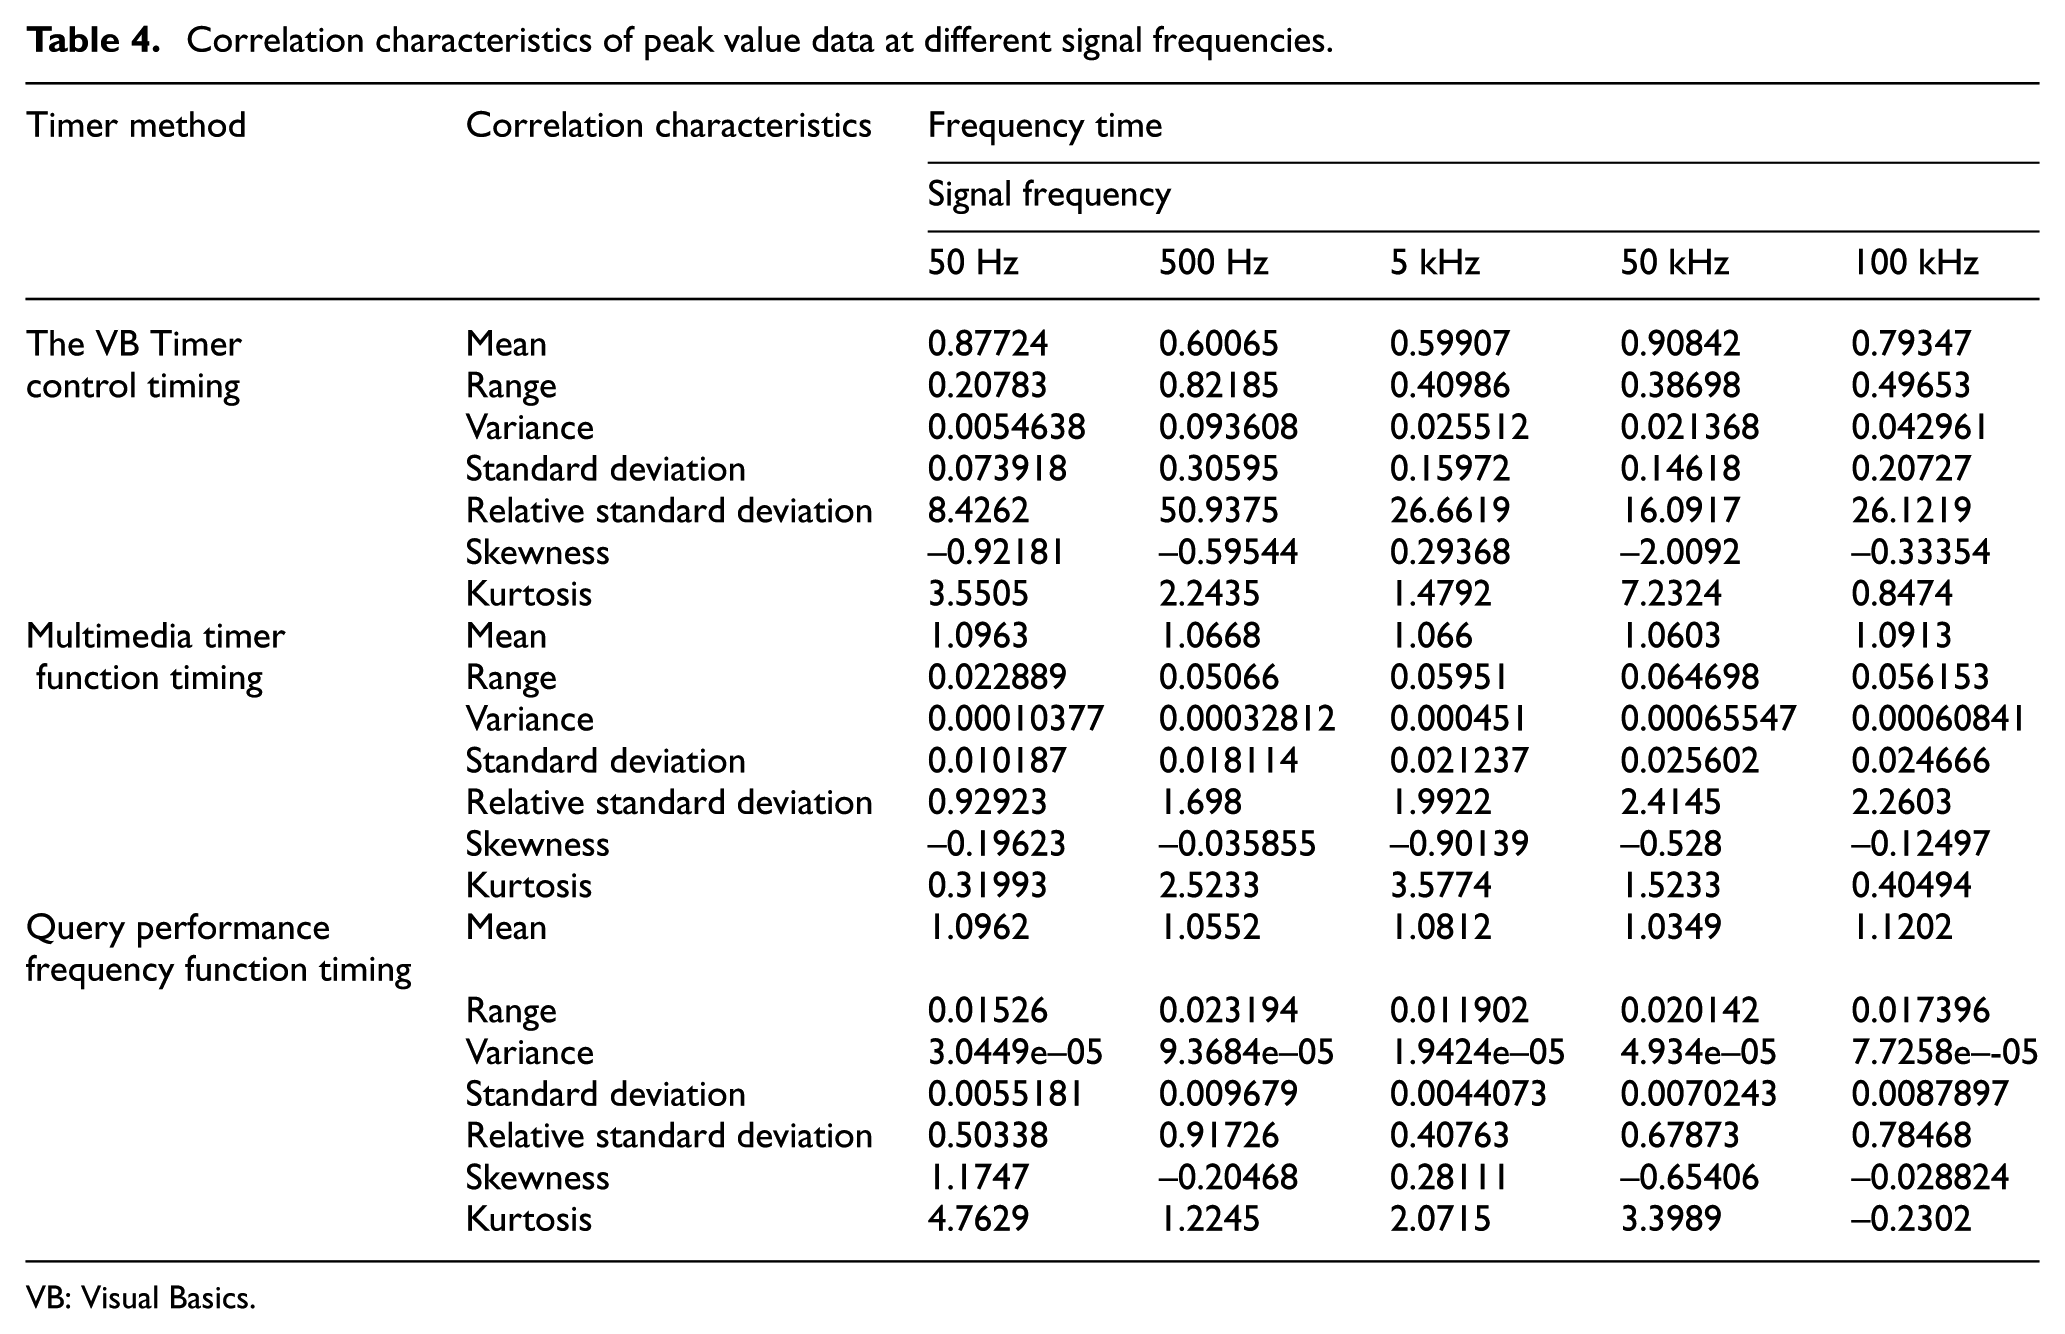
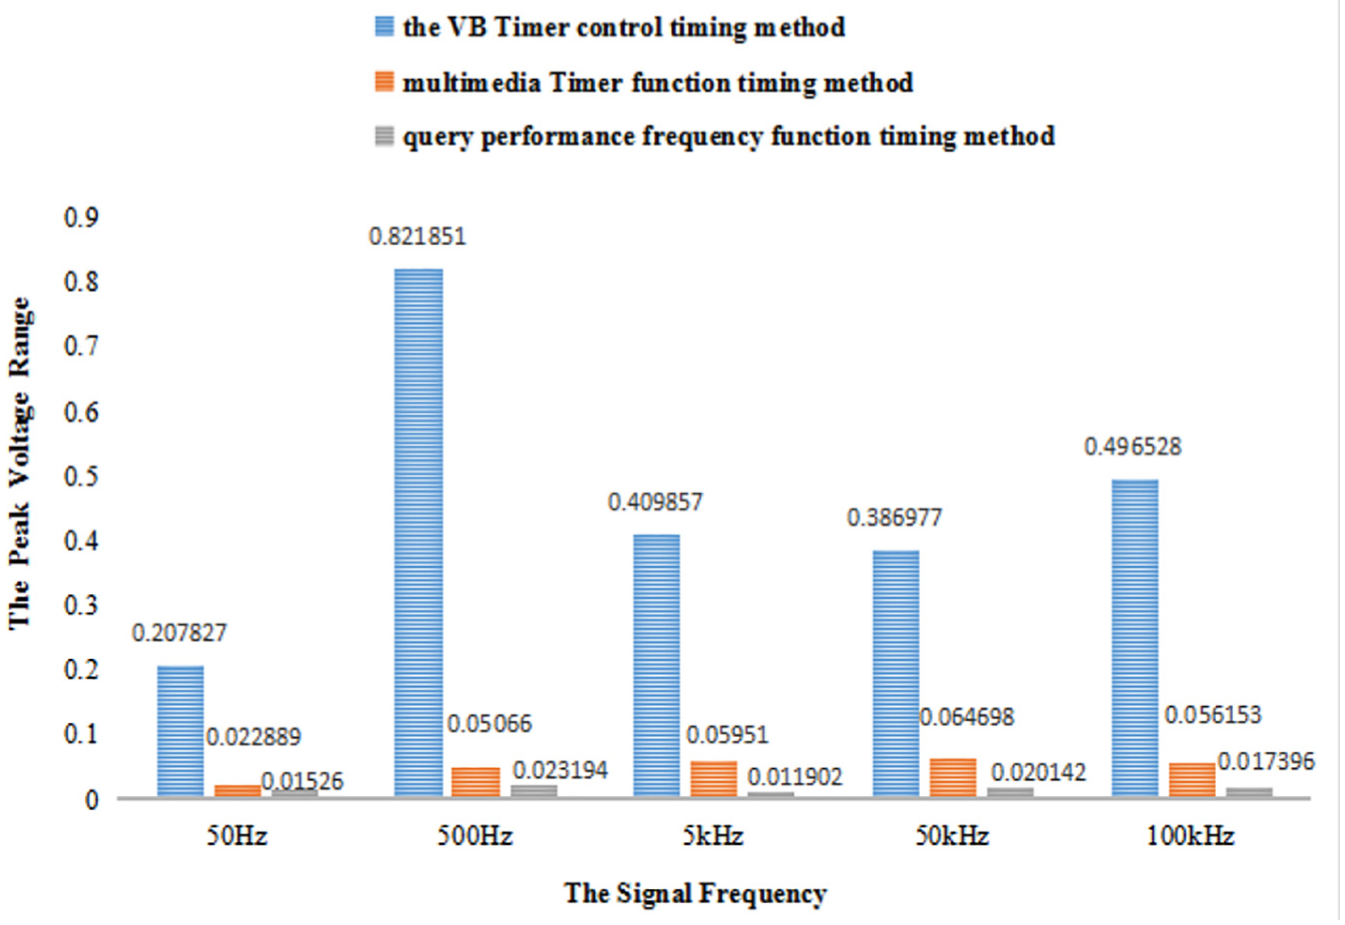
By analyzing the data given in Table 3, the mean value, variance, standard deviation, range, variation coefficient, deviation and kurtosis of the voltage peak data collected at different signal frequencies can be obtained, as shown in Table 4.
Correlation characteristics of peak value data at different signal frequencies.
VB: Visual Basics.
Under the condition of constant sampling time, as the working frequency of the signal source continues to increase, peak-to-peak value of the voltage collected by VB Timer control timing method had largely deviated from the real values. While peak-to-peak value of the voltage accuracy collected by the multimedia timer timing method and query performance frequency function timing method were basically unchanged.
Figure 9 is the repeatability error graph of multiple data acquisition points at different signal frequencies, which can be seen that the maximum repeatability error value of data acquisition by VB Timer control timing is 82.2%, and the maximum repeatability error of multimedia timer function timing is 6.5%, the query performance frequency function timing is 2.3%, the accuracy of the VB Timer control timing method is the worst, while comparing the multimedia timer timing method and query performance frequency function timing method, the latter measure result stability and repeatability are better.
Repeatability error graph of multiple data acquisition points at different signal frequencies.
Conclusion
With the development of testing technology, measurement precision of various modern instruments and photoelectric sensor signal data acquisition are more and more demanding. Many signals change very quickly, so must choose the right timing method to capture these signals accurately. Through a large number of experiments, the measurement errors of the three common software timing methods are verified. The data acquisition and testing system is constructed by RIGOL DG1022 dual-channel signal source, DS1102C oscilloscope and PCI7489 multifunction data acquisition card, which is used to verify the effect of software timing error on data acquisition accuracy when using different software timing methods.
The sine wave of signal generator was used as the contrast test signal, from the sampling time length, the signal waveform analysis and the frequency three aspects, carries on the analysis to the measured voltage peak data correlation characteristic, including the mean value, variance, standard deviation, range, variation coefficient, deviation, kurtosis and so on. Through repeated contrast tests, when the sampling time was very short or measured signal frequency changed quickly, using Timer control timing method control data acquisition card had been difficult to capture the peak-to-peak value of sine wave, measuring error as high as 84.22%. Under the same conditions, the measurement error of multimedia timer function timing method was 1.16%, while query performance frequency function method was only 0.62%. But the VB Timer control timing method Is the most easy to call, as long as a program code instructions can be implemented. Because of its large error and low stability, could only be applied to occasion of the slowly changing signals. In addition, when compared multimedia timer function timing method and query performance frequency function timing method, we could find that the latter was more stable and repeatable in data acquisition, but the code is also the most complex, it takes more than a dozen statements to complete a single call.
Finally, using three different software timing methods and a series of comparative experiments on data acquisition, the influence rules of software timing error on measurement accuracy have been found. At the same time, it also provides some scientific basis and reference for selecting software timing method under different test environments.
Footnotes
Declaration of conflicting interests
The author(s) declared no potential conflicts of interest with respect to the research, authorship, and/or publication of this article.
Funding
The author(s) disclosed receipt of the following financial support for the research, authorship, and/or publication of this article: This research is supported by Quanzhou City Science & Technology Project of China (project no. 2018Z001), 2017 Fujian Provincial Natural Science Foundation funded projects (no. 2017J01086), and National Natural Science Foundation of China (no. 61603144).