
Abstract
A cost-effective measurement of wet-bulb temperature of air has great benefits to fulfill a growing demand of industry, cultivation agriculture, and medication. Applying an appropriate algorithm to wet-bulb temperature of air measurement can effectively improve the accuracy and speed of its measurement. The study aims to research how an improved transmitter system along with the latent heat–based iteration algorithm is used to precisely measure wet-bulb temperature of air. The work consists of (1) simulation of the iteration algorithm and (2) validation via experimental protocol. The simulation results through latent heat–based iteration algorithm were in good agreement (R2≥ 0.99) with the reference. The performance of the improved wet-bulb temperature of air transmitter system was tested by a latent heat–based iteration algorithm experimental setup. The experimental results demonstrate that the improved wet-bulb temperature of air in a good consistency with commercial wet-bulb temperature of air in a range of temperature (15°C–34°C) and relative humidity (28.8%–76.2%). The Bland–Altman plot also shows that the mean value and the standard deviation of the differences between these two systems are 0.14°C and 0.29°C, respectively, which indicates that the improved wet-bulb temperature of air has a good agreement as well. Compared with the commercial wet-bulb temperature of air transmitter system, an advanced processor (STM32F103C8T6) and real-time operating system was applied in the improved wet-bulb temperature of air transmitter system. The experimental results show that its measurement accuracy is closer to the previous study. This study provides an alternative and cost-effective solution to accurately and real-time measure wet-bulb temperature of air.
Introduction
Wet-bulb temperature of air (WBTA) is the temperature that a parcel of air would have if it is cooled to saturation by the evaporation of water into air, with the latent heat (LH) being supplied by the parcel. 1 A wet-bulb thermometer is one of the key elements, which is a thermometer wrapped in a wet cloth. Wet-bulb thermometers are used in conjunction with dry bulb thermometers to measure relative humidity (RH) and dew point, which are the amount of water present in the air and the temperature at which the air reaches 100% RH. A wet-bulb thermometer as the sensor is usually used to indicate WBTA close to the actual (thermodynamic) temperature. Moreover, a WBTA transmitter system is the equipment used to measure WBTA and convert the results to analog or data. It has been widely used in industry, agriculture, and medicine areas. The cooling towers are widely used in most industrial units to reject waste heat into the atmosphere. Wet towers are usually designed to operate in hot and dry weather conditions with narrow range of WBTAs, but many cooling towers are required to operate in weather conditions with large variation in WBTA, which strongly affects the thermal performance of the towers. 2 A virtual outside air wet-bulb temperature sensor was developed to improve water-cooled chiller plant energy efficiency. 3 Thus, WBTA is a vital parameter to save energy in cooling tower operation. A crop water stress index can be developed empirically and theoretically based on the measurement of the foliage, dry bulb, and WBTA. 4 The relative importance of dry and wet-bulb temperatures in the thermorespiratory function in chicken was studied. 5 The calculation method of wet-bulb temperature in agricultural facilities was later proposed. 6 There is a progressive slowing of marathon performance as the wet-bulb globe temperature (WBGT) increases from 5°C to 25°C. 7 A WBGT device is an appropriate measurement tool to be used in ambient temperature, RH, wind, and solar radiation from the sun to get a measure that can monitor environmental conditions during these exercises. Some methods were proposed to work out a consequential WBTA. A method to achieve the WBTA by indirect evaporative cooling of air (without using a vapor compression machine) was studied. 8 An equation is presented for WBTA as a function of air temperature and RH at a standard sea-level pressure. It was found as an empirical fit using gene-expression programming. 9 A calculation method of WBTA and sequence continuity was studied. 10 However, it was calculated based on the historical data without utilization of a microcontroller unit (MCU). A quick calculation method of WBTA at an automatic weather station was proposed based on the Microsoft Excel program. 11 This method did not employ an MCU either. The calculation of WBTA, referring to Newton iteration method, could be consolidated with an MCU. 12 A simplistic algorithm of WBTA, from RH and air temperature, proposed by Rong 13 is also suitable to be used with an MCU. Furthermore, several cWBTA transmitter systems (HMS80/110; Vaisala Inc., Finland and EPOW004001; Ecoa Inc., China) were developed to be applied (on) in different fields. However, these products are either expensive or (inefficient) not efficient enough.
Hence, the proposed study aims to research how a latent heat–based iteration algorithm (LHIA) can work out WBTA together with an alternative engineering system composed of SHT15 sensor modulator with embedding electronics including communication units and a microcontroller. The work consists of (1) simulation of the iteration algorithm and (2) validation via a designated experimental protocol. Meanwhile, an improved wet-bulb temperature of air (iWBTA) transmitter system is to be achieved with a cost efficiency. Moreover, the measurement effectiveness was evaluated by a comparative study between the transmitter (systems) system of commercial wet-bulb temperature of air (cWBTA) and (the) that of iWBTA.
Materials and methods
Engineering architecture of iWBTA transmitter system
Figure 1 shows the engineering architecture of the iWBTA transmitter system consisting of nine functional modules, for example, real-time operating system (RTOS), application layer, LHIA, Modbus RTU protocol stack, peripheral driver, sensor driver, display results, data management, and computer can communicate with RTOS through series protocol. The application layer executes the LHIA and data management through acquiring the dry bulb temperature of air (DBTA) and RH from the sensor. The RTOS synchronizes software and hardware to operate simultaneously. The Modbus protocol stack is responsible for the communication between iWBTA transmitter system and the computer, and the communication bus is RS485. The peripheral driver controls the relative device, whereas the sensor driver controls the sensor system operation.
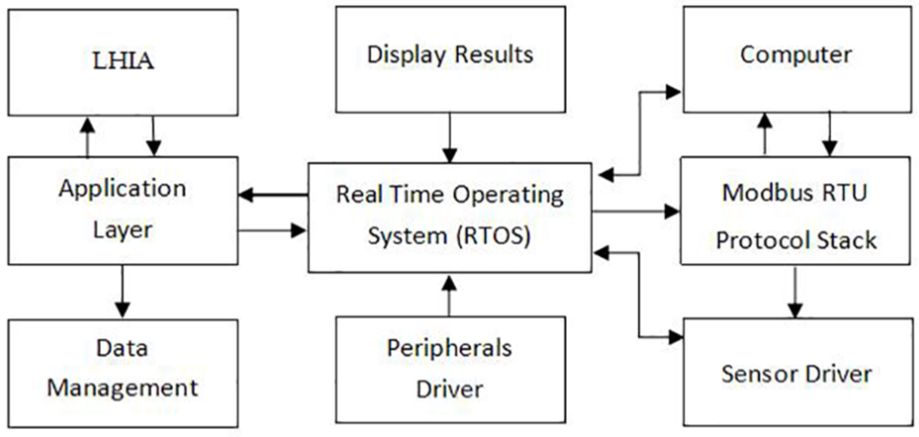
The engineering architecture of the iWBTA transmitter system: real-time operating system (RTOS), application layer, LHIA, Modbus RTU protocol stack, peripheral driver, sensor driver, display results, data management, and computer can communicate with RTOS through series protocol.
Electronic composition
The iWBTA transmitter system, based on a MCU unit (MCU: STM32F103C8T6; STMicroelectronics Inc., Switzerland), implemented multi-functional control and interfacing roles. Figure 2 shows the block diagram of the iWBTA transmitter system. A 485-communication module as the MCU (ADM2483; Analog device, Inc., USA) was used in the system. In addition, the humidity sensor module (SHT15; Sensirion, Inc., Switzerland) and the power converter module (AMS1117; AMS Semitech Inc., USA) were also integrated in the system device. The display screen is an organic light-emitting diode (OLED) (Hangzhou Haishifang Electronic Technology Co., Ltd., China). Figure 3 shows a snapshot of the iWBTA transmitter system (80 mm × 80 mm × 1.6 mm).
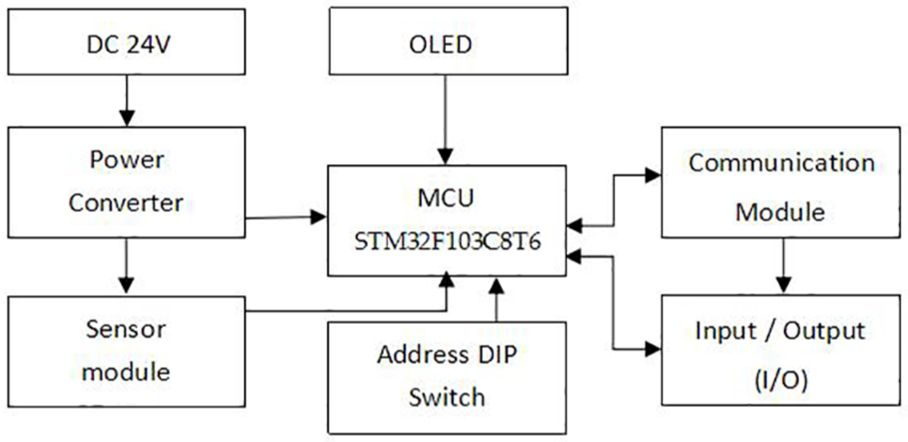
The block diagram of the iWBTA transmitter system circuit with four individual functional modules: OLED: display screen, MCU: STM32F103C8T6, sensor module (SHT15), communication module (ADM2483), and power converter module (AMS1117).
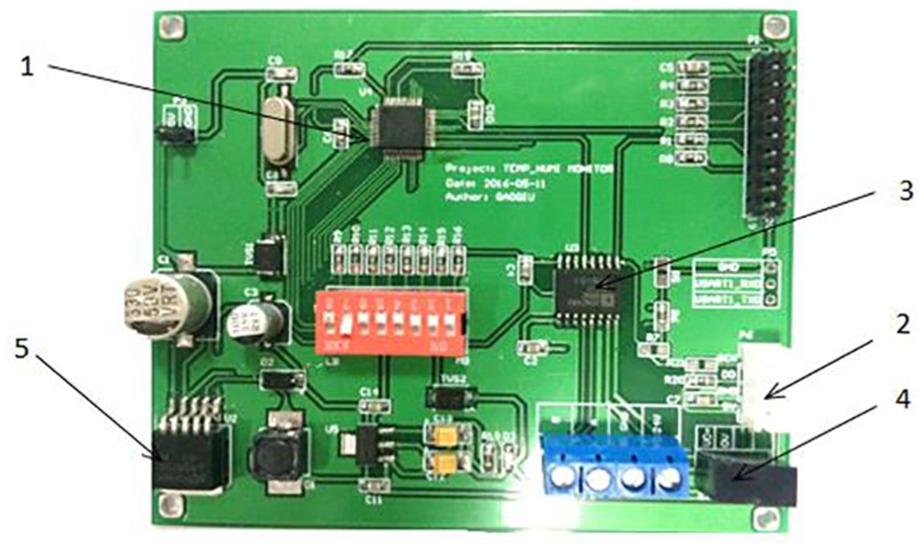
A snapshot of the iWBTA transmitter system. 1: MCU: STM32F103C8T6; 2: sensor module (SHT15) interface; 3 and 4: communication module (ADM2483); and 5: power converter module (AMS1117).
Functional modules
Figure 4 shows a sensor module circuit of the iWBTA transmitter system. A unique capacitive sensor element was used for measuring RH, while the temperature was measured by a silicon band-gap temperature sensor. The humidity sensor module (SHT15; Sensirion, Inc.) is also an integrate sensor element plus a signal processing functionality on a tiny footprint to provide a fully calibrated digital output. The range of RH is ±2.0% with its temperature ±0.3% at 25°C. VDD and GND stand for the power while SCK, and DATA stand for data wires to exchange data between the sensor and the MCU. Figure 5 shows a snapshot of the sensors.
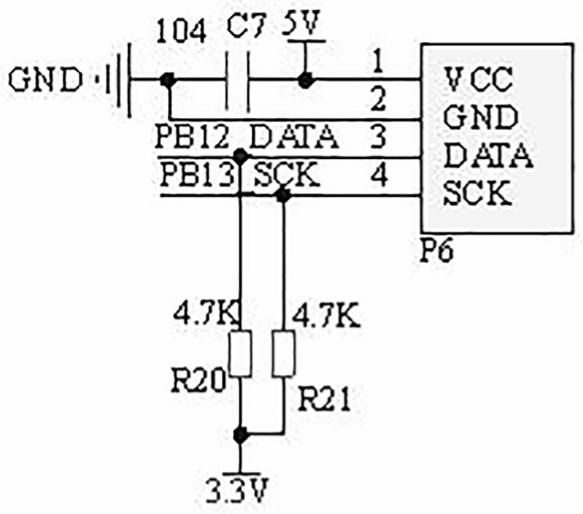
The schematic diagram of circuit (SHT15).
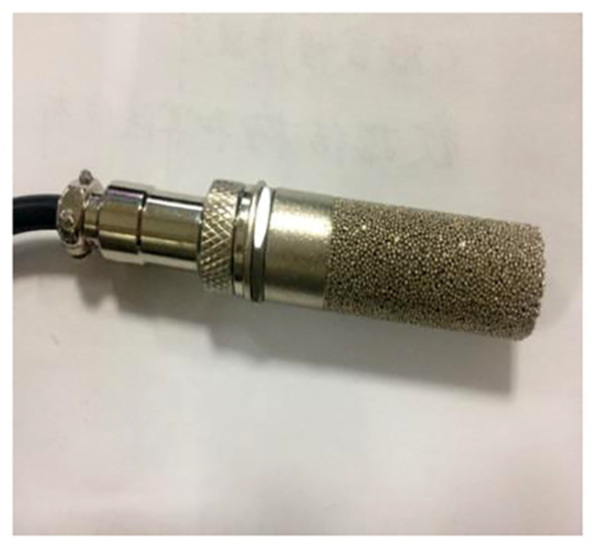
The sensor for DBTA and RH (SHT15).
The sensor module can be applied to monitor DBTA and RH of the environment and is controlled by the MCU. The MCU acquires the DBTA and RH from the sensor module and saves those parameters in identified memory units.
Figure 6 shows a communication module (ADM2483; Analog device, Inc.) of the iWBTA transmitter system. The communication module is applied to exchange data between the MCU and computer.
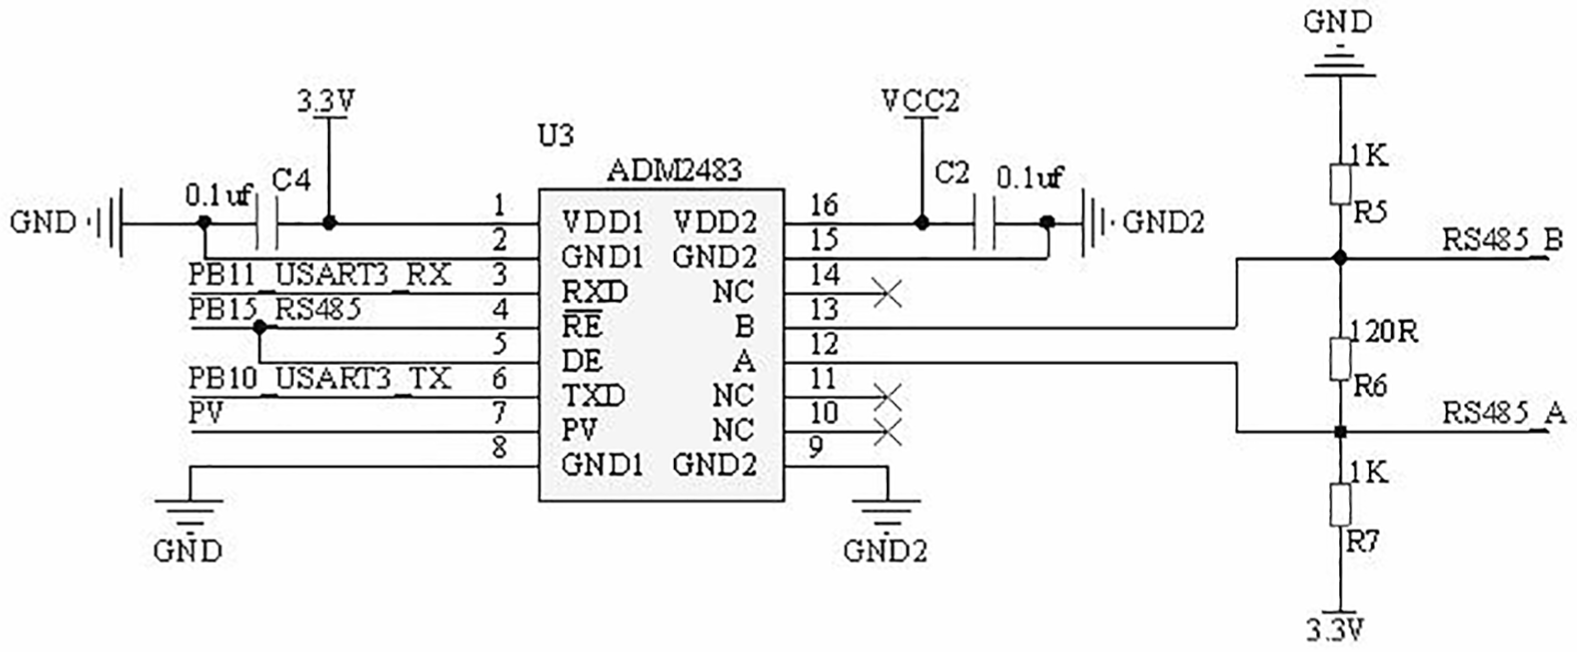
The schematic diagram of communication circuit.
An LHIA to work out iWBTA
The WBTA is the lowest temperature that can be reached under current ambient conditions by the evaporation of water only. The WBTA is attained under conditions of an equivalent LH. The LH of air is calculated through two methods, that is, from RH and DBTA or from iWBTA. Thus, the relationship between iWBTA and RH and DBTA is established. 13
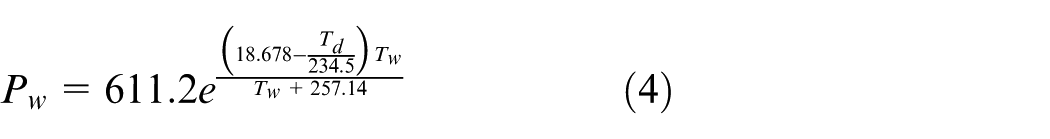
The vapor saturation pressure (VSP) corresponds to DBTA in the air and is calculated as follows
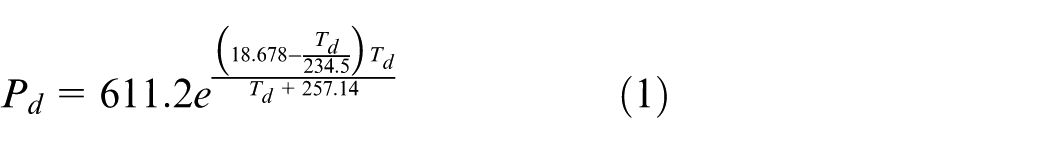
where Td is DBTA (°C) and Pd is VSP (Pa).
The moisture amount (MA) of the air
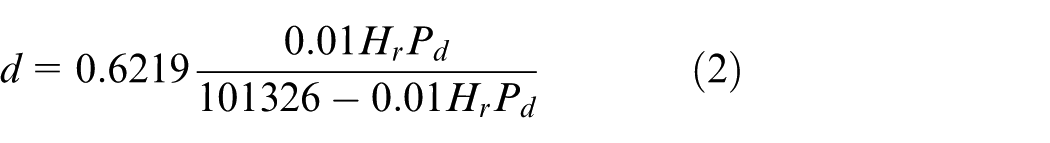
where Hr is RH (0%–100%) and d is MA of the air (kg/kg dry air)
The LH of air

where h is the LH of air.
The VSP corresponds to iWBTA in the air is calculated as follows
where Tw is iWBTA (°C) and Pw is VSP (Pa)
The MA of the air can be also calculated as follows
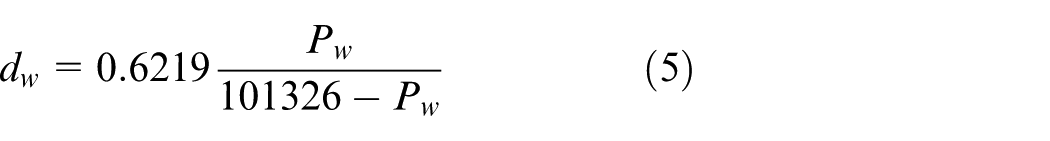
dw is MA of the air (kg/kg dry air)
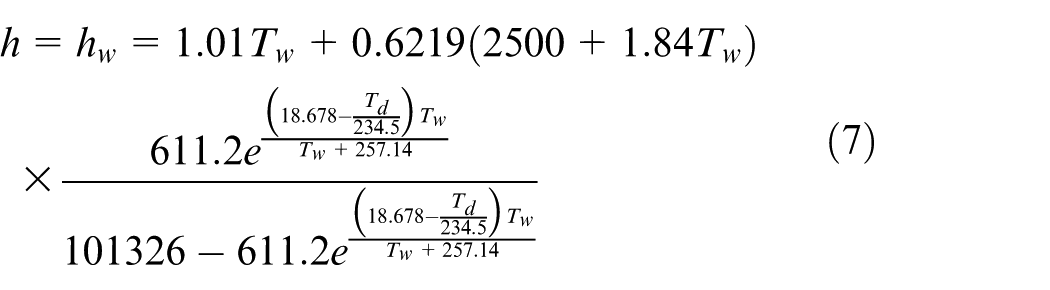
The LH of air

where hw is the LH of air.
According to the definition of iWBTA, when h = hw, the Tw can be attained by iteration through formula (7)
Experimental protocol
The iWBTA through simulation was compared with the reference. 14 The iWBTA transmitter system performance was evaluated under experimental conditions. The WBTAs from the iWBTA transmitter system and the cWBTA transmitter system were acquired and saved simultaneously in a specific period of time at the laboratory through the developed application software. The test range of environmental temperature is from 15°C to 34°C and the range of RH is 28.8%–76.2%. The sampling frequency was once per 15 min, and the sampling duration was 9 days, when nearly 13,000 groups of samples were obtained. The comparison of test results was performed by EXCEL (Microsoft Inc., USA) to evaluate the performance of the iWBTA transmitter system and the cWBTA transmitter system. Figure 7 shows the schematic diagram of the experimental platform.
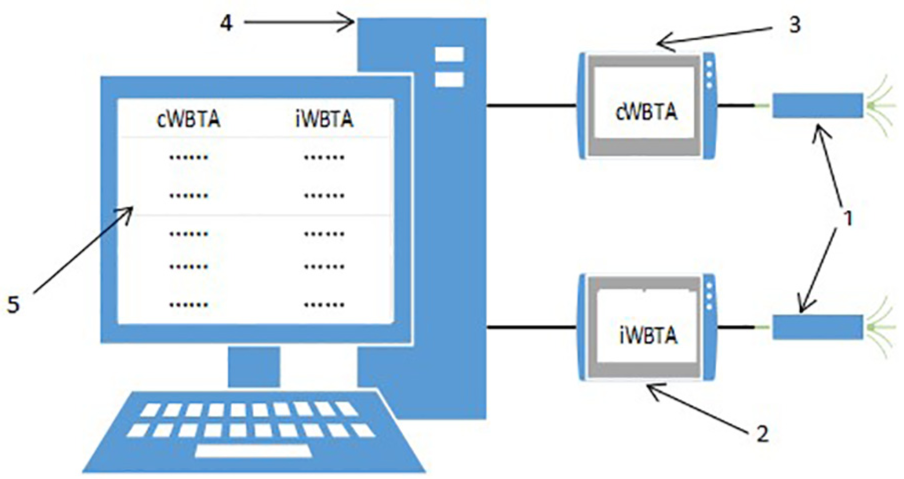
The schematic diagram of the experimental platform. 1: humidity and temperature sensors; 2: iWBTA transmitter; 3: cWBTA transmitter; 4: a PC; and 5: display of the developed application software.
Results
Figure 8 shows the comparison of WBTAs between the iWBTA and reference, 14 where the range of DBTA is 20°C to 40°C while RH = 20%, RH = 40%, RH = 60%, RH = 80%, and RH = 100%, respectively. The comparisons of WBTA between the iWBTA and reference 14 were performed using unpaired t-test. 15 Pearson’s correlation analysis was also used to correlate quantitative variables (R2≥ 0.99).
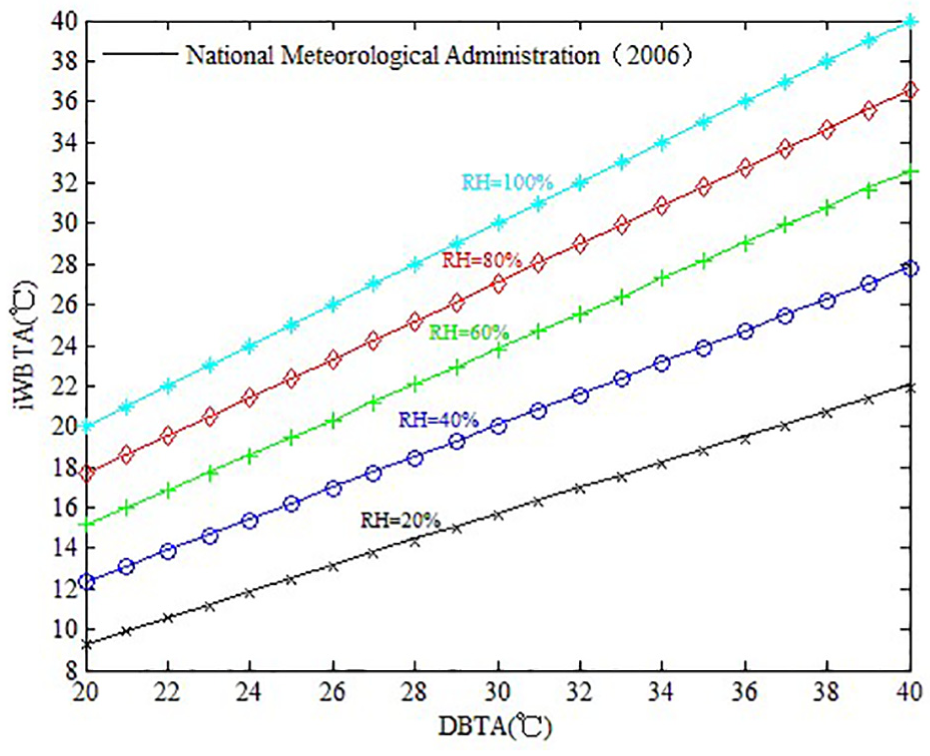
The WBTA comparison study between the iWBTA and a reference. 14
The measured WBTA values between iWBTA transmitter system and cWBTA transmitter system (EPOW004001; Ecoa, inc., China) were compared using unpaired t-test. 15 Pearson’s correlation analysis was used to correlate quantitative variables (R2≥ 0.99), as shown in Figure 9.
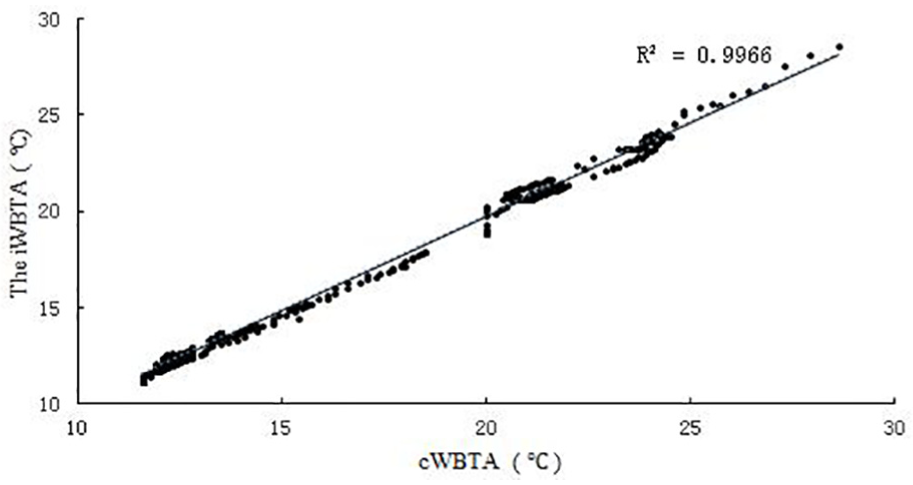
The WBTA correlation between the iWBTA and the cWBTA with (R2= 0.99).
Table 1 shows the performance parameter difference between the iWBTA transmitter system and the cWBTA transmitter system.
The parameters of the iWBTA transmitter system and the cWBTA transmitter system.
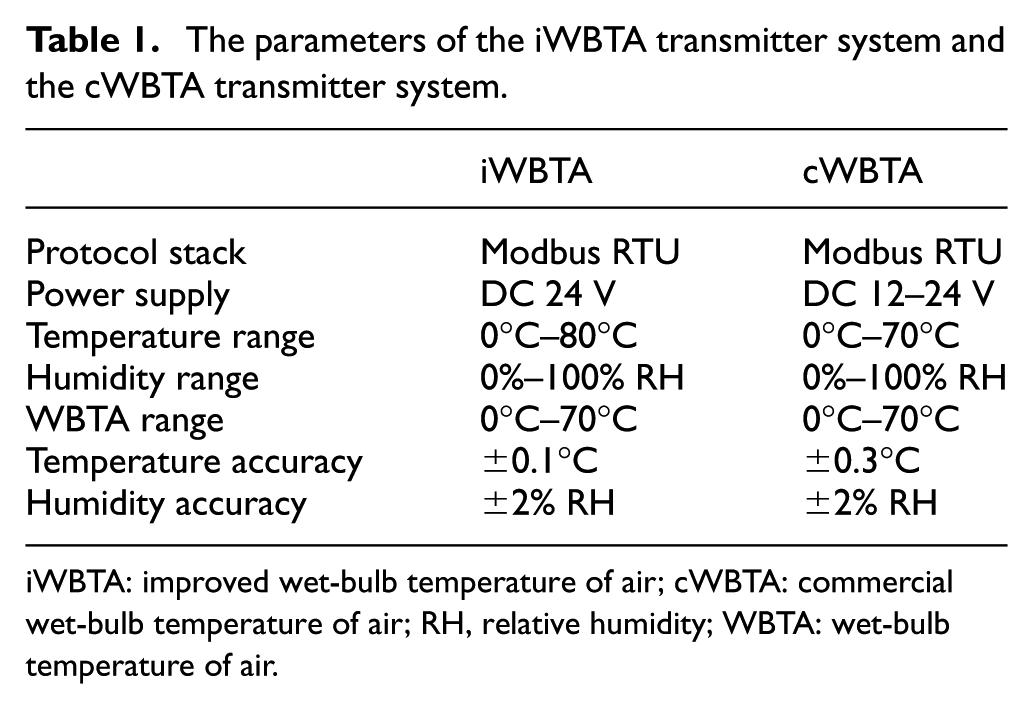
iWBTA: improved wet-bulb temperature of air; cWBTA: commercial wet-bulb temperature of air; RH, relative humidity; WBTA: wet-bulb temperature of air.
The Bland–Altman method was used to compare the values of WBTA obtained between the iWBTA transmitter system and the cWBTA transmitter system. Figure 10 indicates the bias B: 0.14°C and the standard deviation (SD) is 0.29°C, lower and upper limits of agreement, –0.41°C and +1.1°C, respectively.
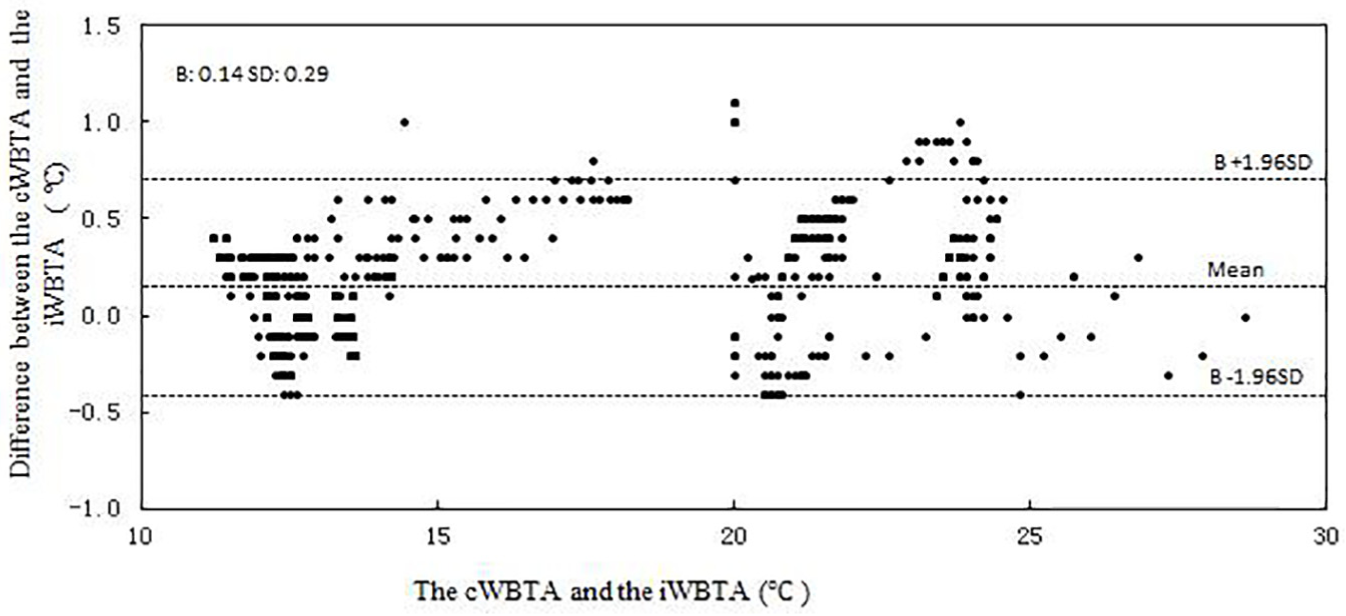
The differences in WBTA outputs recorded in the Bland–Altman plot. The acceptable range: B ± 1.96SD.
Discussion
Figure 7 shows that the iWBTAs from the iWBTA transmitter system are consistent with reference, 14 and their deviations are below 0.1°C when RH is from 20% to 100%. This indicates that the iWBTA transmitter system is able to provide results with high level of accuracy.
The outcome achieved from the implementation, in the designated experimental protocol, has demonstrated that the iWBTA transmitter system, associated with its electronics and algorithms, is able to meet the design requirements through comparison between the cWBTA transmitter system and the iWBTA transmitter system in the laboratory. Figure 8 presents that the cWBTA and the iWBTA under the same conditions have a higher correlation (R2: 0.9966). The Bland–Altman plot in Figure 9 expresses the iWBTA outputs recorded at the laboratory, which are mostly in the acceptable range of B ± 1.96SD in the WBTA difference between the cWBTA and the iWBTA. Figures 8 and 9 explain that the WBTA measurements from the cWBTA and the iWBTA are compatible and acceptable as well.
As presented in Figure 8, the WBTAs were measured by means of the cWBTA transmitter system and the iWBTA transmitter system. The main range of deviations is ±0.6°C. The probability of the deviations is over 95% in 864 records, showing that the iWBTA transmitter system has high precision. The largest deviation is occasionally close to 1.1°C while the DBTA difference is 0.6°C and the RH difference is 6.6%. However, the data statistics show that the probability of the maximum difference occurrence is below 0.5% in 864 records. Hence, the values of iWBTA should be accurate and acceptable.
According to the LHIA, the main influencing factor of the iWBTA transmitter system accuracy is the measurement accuracy of the DBTA and RH obtained by the sensors. The performance of the sensors was occasionally unstable. Hence, the high precision sensor conduces to improvement of the iWBTA transmitter system accuracy.
Conclusion
An improved wet-bulb temperature transmitter system, through the implementation of the designated protocol, has proven to be able to effectively measure the WBTA in the laboratory. The study shows that the approach for acquiring and processing signals could be effectively applied in real time, such as sending results to a computer. By comparing the measurement results, the compatibility between the cWBTA transmitter system and the iWBTA transmitter system was proven to be in an acceptable range of the WBTA difference between the cWBTA and the iWBTA. Specifically, the outcome from the experimental protocol showed that the iWBTA transmitter system was able to measure WBTA effectively in the identified temperature range. The iWBTA transmitter system with a communication module has extended its application scope and could be applied for cost-effective telemonitoring. Yet, several challenges, such as different installment locations of the iWBTA transmitter system outdoors and canceling the artifact of winds, which may affect the measuring results remain and are required to be addressed and overcome in future studies.
Footnotes
Acknowledgements
The authors acknowledge and would like to thank Shanghai University and Loughborough University for this study.
Author contributions
L.Y. supervised the project and guided the project implementation and prepared the manuscript. S.H. organized the manuscript. P.Y. implemented experimental protocol. Q.G. designed and conducted the electronic validation. W.L. carried out the data analysis. F.Q. programmed the test software and established the test platform.
Declaration of conflicting interests
The author(s) declared no potential conflicts of interest with respect to the research, authorship, and/or publication of this article.
Funding
The author(s) received no financial support for the research, authorship, and/or publication of this article.