
Abstract
Intelligent transportation systems are advanced applications that inform vehicle drivers about road conditions. The main purpose of the intelligent transportation systems is to reduce either tangible or intangible loss for the drivers by ensuring the safety of passengers and vehicles. In this study, a system is designed and implemented using wireless sensor networks to inform vehicle drivers about the condition of the road surface. Icing has been chosen as the primary focus of the study since it is considered to be a big threat to road and driver’s safety. The temperature at 10 cm depth of the road, air temperature, relative humidity, air pressure and conductivity values are used as the input data for the prediction of icing on the road surface. The data were previously collected on Raspberry Pi which is a single-board computer and the data were read and processed instantly via k-nearest neighbor algorithm. Using these collected data, the road surface condition is classified as icy, dry, wet or salty-wet. The analyzed results for the road surface condition are presented to the drivers via a mobile application in real time. The drivers are alerted visually and audibly as they approach the coordinates on the road where risky conditions are present.
Keywords
Introduction
The road surface and bad weather conditions can negatively affect driving safety. These factors also affect comfort of the drivers, especially when severe winter conditions are present. Precipitation and sudden temperature drop in air reduce the traction of vehicle tires due to wetness, snow, black ice and freezing on the road surface. Drivers must adjust the vehicle’s speed according to the road conditions. Also, drivers should be aware of the maneuver limits and roadholding capacity of their vehicles for safe driving. Particularly during high-speed driving, the driver may not detect the difference between wet or icy road surface and the likelihood of an accident occurring may increase. Previous research shows that 40% of traffic accidents occur on icy, rainy or snowy roads during winter. 1 Traffic accidents due to road surface conditions can be very damaging for the travelers and can affect the society both economically and psychologically. 2 In order to avoid such accidents, road surface condition should be notified to the vehicle drivers by traffic signs and markers. 3 Awareness of the road surface condition will help driver be cautious while choosing the appropriate route and the traveling speed during the road trip.
The purpose of this study is to develop a highly accurate low-cost system to alert the drivers about the road conditions in real time and provide them fast response if the road conditions change during their trip. The authors of this study used road surface temperature, road temperature at 10 cm depth, relative humidity and air pressure data via the k-nearest neighbor (k-NN) algorithm. Analyses of the data revealed that the road surface condition can be predicted with a high accuracy using this method. In this study, the prediction algorithm runs in real time on the Raspberry Pi embedded platform and the drivers are informed using the developed mobile application when they get closer to the possible icy road conditions.
This article includes five sections and is organized as follows. The related work and motivation for the study are discussed in section “Related work.” Feature selection for classification of the road surface condition and k-NN algorithm are given in section “Methodology.” Section “Experimental setup” presents the hardware and software of the designed and implemented road condition warning system. The success rate of the system and algorithm evaluation are presented in section “Evaluation.” Finally, conclusions and interpretations of this research are given in section “Conclusion.”
Related work
Today, intelligent transportation systems are widely used for transportation safety and drivers’ comfort. Systems such as road information systems (RIS), road traffic information systems (RTIS) and road weather information systems (RWIS) have been developed to provide safety and comfort during transportation. Many studies have been conducted on the prediction of adverse weather and road conditions. Within the scope of this study, a system that will contribute to RWIS was implemented in order to inform the drivers about the weather and road surface condition and take necessary precautions. The road and weather information system has been used since 1980s. RWIS do not only provide travelers with better information for safe and efficient travel, but also provide information about snow or icing on the road surface for both drivers and road maintenance units.
The RWIS infrastructure has two important key points: travel safety and road maintenance. With RWIS, significant savings are achieved in terms of time and road maintenance costs. While the temperatures of the road and air are measured with the help of air stations placed on the sides of the road, ice and snow are detected on the road surface through the cameras used. 4 There are several different approaches that have been used to determine the snow and ice formed on the road surface. Road surface classification studies can be classified into two categories, namely, contact-free and contact systems. If the cameras and sensors are placed in the road stations, the study can be categorized as contact systems. On the other hand, if the sensors and cameras are mounted on the vehicle, the approach is called as contact free. In both systems, the detection techniques are used with either cameras or sensors (sound, heat, light, etc.). Powerful computational machines and lighting sources are needed to enable these methods to work effectively. In contact systems, lighting and powerful machines can easily be positioned at the roadside stations, but it is difficult to accomplish this in portable systems. 5 In contact-free remote measurement systems, image processing has been done with sonic radars, infrared detectors and cameras.6–9 With the help of wavelength-sensitive cameras, 80%–90% success rate was achieved in determining the snowy, icy road condition, while the success rate in determining the dry and wet road condition was 70% at most. 10 Raqip Omer and Liping Fu have identified the road surface condition as contact free using the image recognition system for the points marked by a low-cost global positioning system (GPS). However, they were unable to detect any ice layer on the snow-covered road surface. In addition, there were errors in surface classification due to the sudden change in light intensity and shading on the road. 11 Bent H Sass examined the effect of solar radiation exposed to the road surface. He provided a contact-free system that automatically envisages road surface temperature, which affected slippery road condition at road stations in Denmark. With numerical forecasting, the atmospheric data were collected from the station and an estimate was made about the road surface. The road surface temperature prediction system was developed using the numerical model. The estimation of atmospheric data was used to draw conclusions about the road surface condition, but this system was not efficient enough to make clear statements regarding the regionally changing road surface conditions. 12 RE Gagnon et al. designed a warning system for drivers utilizing optical technologies to measure road surface conditions. They developed a method that was based on the reflection or absorption of light in optical systems. However, their method did not provide accurate results in frosting without air bubbles in it, which is called as black ice. In the reflection method, with the presence of air bubbles in the reflected surface, comments were made about the ice layer. That method did not work in the form of a thin film (black ice) layer. 13 Johan Casselgren et al. identified the instantaneous road surface condition with the near-infrared (NIR) camera measurement technique. However, the established system was neither economical nor feasible. 14 J Alonso examined the noise of tire on the road in real time and classified the asphalt surface as dry and wet. His results achieved high accuracy. 3 J Shao and PJ Lister used meteorological data to estimate the road surface. The estimation rate of accuracy for icy road was 82% and that for wet road was 72%. The accuracy rate of estimation decreased because of the data taken from the salted road surface. However, since salted roads reduced the freezing point, the error rate of the system increased. Thus, the salt concentration on the road surface also needed to be measured. This problem is eliminated in contact systems and therefore on roads where salt is used the contact systems provide more accurate results. 15 Patrik Jonsson et al. classified the road surface via an infrared camera system. They suggested that the k-NN method was more useful than the support vector machine (SVM) method. In their study, the cost and number of devices used were very high and this created limitations to the applicability of their method. 16 Jian Li 17 has indicated that the prediction success is higher if the correct attributes are selected with the feature selection method in the SVM algorithm. The success of road surface prediction is between 80% and 90% in sensor-based optical systems, but for camera-based optical reflection (ICOR) systems it is between 70% and 80%. 5
Contacting systems use different types of sensors placed on the road in order to predict the road surface conditions.18–21 The Model of the Environment and Temperature of Roads (METRo), which operates by combining road condition and road surface temperature, was first introduced in 1999. The METRo system allows preparation for the road maintenance and salting process for the next winter by keeping the ice in memory during the winter months. However, precipitation and icing time vary every winter due to different factors such as climate change and global warming. METRo is a statistical approach to road surface estimation but lacks accuracy due to operating with data recorded in the previous years and because any sudden change in local climate is not taken into consideration. 1 In another study, J Shao developed a short-term road surface temperature prediction using a three-layer artificial neural network (NN). The icing on the road surface was estimated by training on NN with the help of the meteorological data and data from the roadside stations. 22 Antonio Luchetta et al. 23 have indicated that the NN approach along with the road condition sensor network on the motorway has yielded better results than the expert system and analytical approach. J Bogren et al. 24 have examined the relationships among the wind speed, the amount of sunlight and the altitude, which affect the surface temperature of the road. They have stated that the wind speed at the road surface temperature has less influence than the sunlight time. After determining the road surface condition, the results must be transferred to the driver quickly and accurately. The statistical analysis of the accidents caused by the icing and the positioning of the traffic signs in the right place was also performed. The research revealed that traffic signs are insufficient to warn drivers. 25 The traffic signs and markers used on the roadsides do not exactly attract the attention of the drivers. 26 Therefore, variable message boards or traffic signs should be used to attract the attention of the drivers in order to be more effective. The systems that notify drivers immediately before they approach the hazardous zone are more important for preventing accidents and assuring the safety of the travelers.
In the literature, contact and contact-free systems are used for road condition detection. The performance ratio of contact-free detection systems varies between 70% and 95%. However, this performance ratio for ice and snow detection remains low compared to contact systems. The classification performance of the contact systems application is higher than that of contact-free systems application, but there is no quantitative expression. In addition, the sampling time in contact systems is approximately 10 s and it could be considered as quite long for anyone traveling at highway speeds. Stationary traffic signs are used to warn the drivers during their travel for any ice or snow on the road. However, lack of stationary traffic signs or timely update on the message boards may affect the awareness of the drivers in case of any dangerous condition ahead.
Methodology
Feature selection
Analyzing large data sets is a difficult and time-consuming process. Single-board computer (SBC) has been used in the past but it is a limited processor with low memory capacity. For this reason, it is necessary to use machine learning techniques and data mining methods when analyzing large data sets. These methods provide more meaningful results and can process the data more quickly. The accuracy of the results obtained from the data may be affected by the noise in the data. In this study, it was necessary to use a method to reduce the noise and have more accurate results. Dimensionality reduction is a method that can be used to discard any data which does not affect the outcome. This method also reduces the noise in the data set. Dimension reduction techniques can generally be categorized as feature extraction and feature selection. Feature extraction is a process of subtracting new properties that are lower than the size of a multidimensional data set. Feature selection is the process of selecting sub-data sets to be used in the classification by eliminating unnecessary data in the data set used. The feature selection process provides a set of data that consists of original data by creating a new subset of the original data set. Some other methods of dimension reduction used in the literature are subset selection, backward feature selection, forward feature selection, basic component analysis, linear discriminant analysis, decision tree, low-variance and support vector machine recursive feature elimination (SVM-RFE) methods. 27 The SVM-RFE method is used in this study to select attributes for the road condition classification. Based on the SVM-RFE algorithm selection, the best feature list is created. The property ranking accuracy of SVM-RFE depends on the SVM classification model. 28 SVM is a classification algorithm that results in a partially high accuracy in road condition classification. Therefore, the selected subset of features relatively performs better. The subgroups selected in SVM-RFE are compared according to the evaluation function. If the subset chosen in step N+1 results in higher accuracy than the subset chosen in step N, then the subset chosen in step N+1 is the appropriate set to be used for classification. 29
In this study, the intelligent passive road sensor (IRS31) and weather station weather meters (WS600) were used to create the training data set. The data set contained the following variables: temperature at 10 cm depth of the road, surface temperature of the road, air temperature, air humidity, dew-drop point, amount of precipitation, salt concentration of the road surface, wind speed, wind direction and air pressure. As a class set, the data included icy, dry, wet and salty-wet road conditions. The percentage distribution of the road surface condition according to the data set is given in Table 1.
Distribution of road surface condition according to the data set.
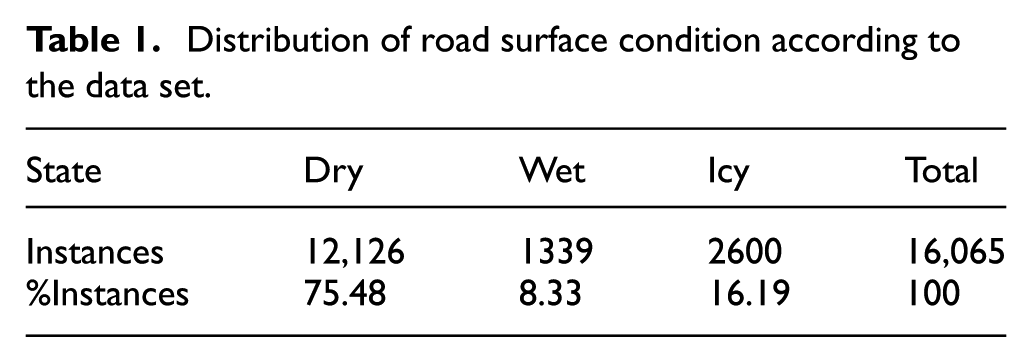
Utilizing the SVM-RFE subset selection size reduction method 30 minimizes not only the needed storage space but also the calculation time for the data sets which are easier to quantify with higher performance. Attributes, which take the highest accuracy scores in the feature selection algorithm, are selected as a subset. Such attributes include the temperature below the road, the air temperature, the amount of moisture, the salt concentration of the road surface and the rate of air pressure. It is well known that the temperature below the road affects the surface temperature of the road. Although the air temperature and humidity values may indicate any ice formation on the road, the underground temperature might also affect such icing forming on the road surface. For this reason, many researchers included soil temperature measurement in their data for the detection and prediction of icing.23,31 Thus, in this study, the temperature at 10 cm depth of the road is also included in the subset selection in order to make more accurate predictions about the condition of the road surface.
k-NN
The k-NN algorithm separates the data points into several clusters by classifying them according to the majority of its neighbors and uses such data to predict the classification of a new sample point. It performs the classification process by looking at the class density of k points that are closest to the new point to be classified. This classification algorithm is one of the well-known, simple and effective machine learning algorithms.32–35 The k-NN algorithm does not require training during classification. One of its strengths is being non-sensitive to the noisy data set.33,36 On the other hand, this algorithm requires excessive memory usage depending on the number and feature of the desired attributes which also causes an increase in the calculation and processing load. Despite such weaknesses, k-NN is one of the most widely used algorithms in research studies and is also appropriate for the purpose of this study. In the k-NN algorithm, the k value and the selected distance criteria affect the calculation load. 21 In addition, the performance of the k-NN algorithm depends on the measurement of the distance between the sample data sets. The proximity between data sets can be calculated by distance measurements such as Euclid, Minkowski, Manhattan and Chebyschev.37,38 The value of k = 5 in the design system has given the highest prediction rate in the classification made by the Euclid distance criterion. To reduce the system’s calculation load, size reduction was done by selecting the attribute before the classification. This allows the system to respond faster. 31
Experimental setup
Hardware
The icing forecasting and information system consists of road and weather sensors, SBC, Internet connection and mobile application. The block diagram of the system is shown in Figure 1.
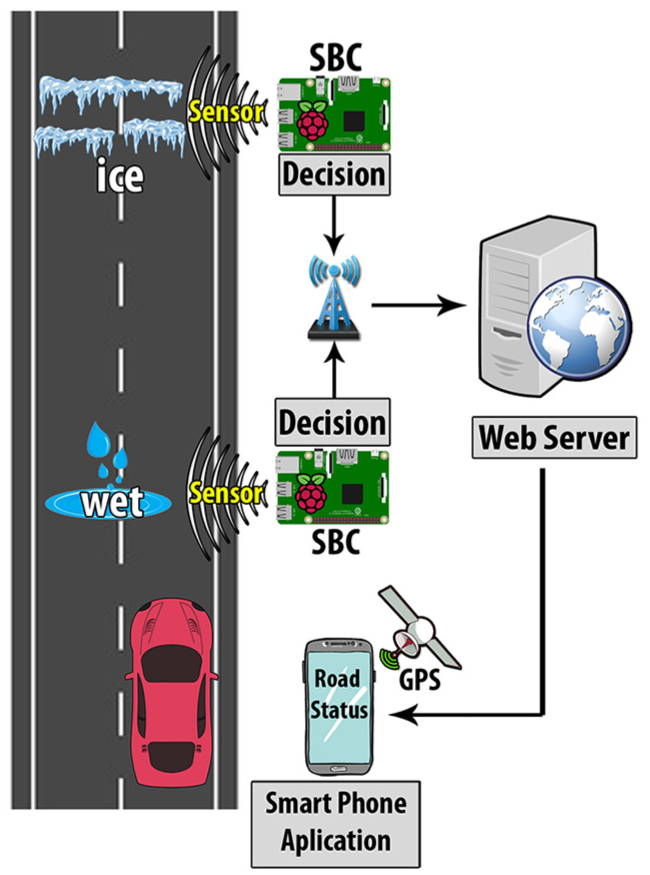
Block diagram of the system.
The designed and implemented intelligent road condition sensor node includes Raspberry Pi 3, road temperature sensor, air temperature and humidity sensor, air pressure sensor, salt concentration sensor with ADS1115 and battery. It is shown in Figure 2.
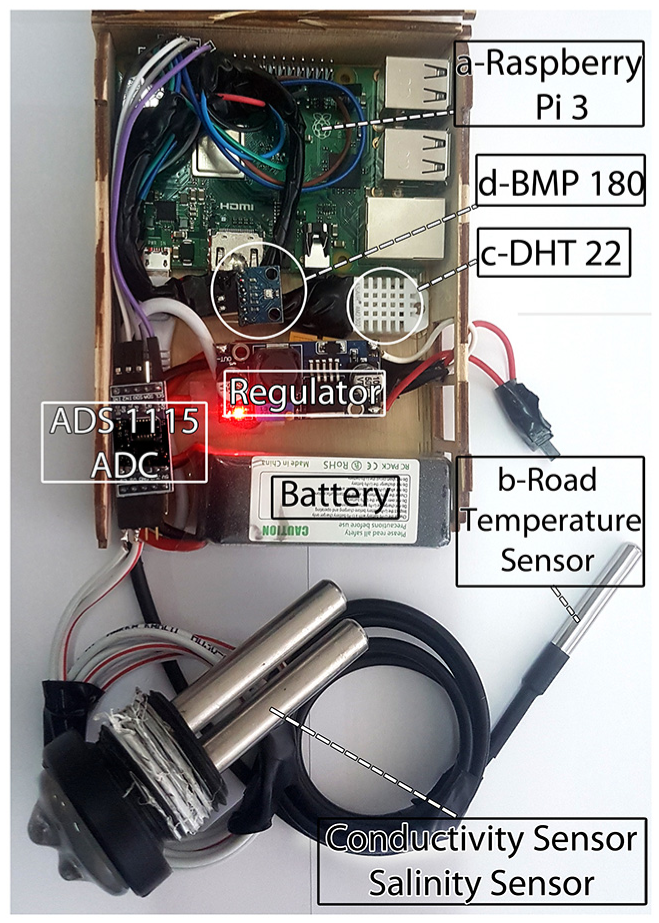
Intelligent road condition sensor node: (a) Raspberry Pi 3, (b) road temperature sensor, (c) DHT22, and (d) BMP108 sensor.
Raspberry Pi 3
Raspberry Pi 3 is selected as the central processing unit of the unit of the single-board computer road condition system with low energy consumption. The Raspberry Pi board contains ARM (Advanced RISC Machines) processors, graphics chip, random access memory (RAM) and various communication ports. The Raspberry Pi also includes a general-purpose input/output (GPIO) unit, HDMI (High-Definition Multimedia Interface) output, USB connection, 1 GB RAM memory, micro SD memory card slot, Ethernet module, Wi-Fi modem and a powerful processor series ARM processor. Raspbian open source is an operating system which is free for installation. Raspbian operating system is installed on a micro SD memory card which also served as a hard drive compatible with the processor. Raspberry Pi 3 is an embedded system suitable for multi-functional flexible programming and electronic project design. Raspberry Pi is affordable and easy to use as a wireless sensor node. Such features of Raspberry Pi 3 mentioned above make it an ideal choice for the purpose of this study. The designed sensor node prototype requires a sensing unit containing analog-to-digital converter (ADC) for the measurement of air temperature, air humidity, air pressure and salt concentration of the road surface. Overall, the proposed system processes the data it collects and transmits it to the recipients through its communication unit. The Raspberry Pi 3 is shown in Figure 2(a).
Road temperature sensor
The soil temperature affects the temperature of the road surface and eventually the icing on the road. In this study, DS18B20 sensor is used to measure the temperature at 10 cm depth of the road. DS18B20 is a 12-bit high-resolution temperature sensor that works digitally. It is able to perform under the temperature measurements between –55°C and +125°C. Through the one-wire communication protocol, it communicates with the SBC over a single line. One-wire communication is a communication protocol with a lower data rate, similar to the Inter-Integrated Circuit (I2C) protocol. The road temperature sensor is shown in Figure 2(b).
Air temperature and humidity sensor
One of the most important conditions that lead to icing is zero or below-zero temperatures with high air humidity. 39 For this reason, it is critical to measure these quantities to determine and predict the formation of icing on the roads. This study uses the DHT-22 sensor to measure the road temperature and the humidity of the air. The DHT-22 sensor is a temperature and relative humidity sensor which is capable of measuring 0%–100% humidity with an accuracy of 2%–5%, as well as temperature measurements from –40°C to 80°C. The DHT-22 temperature and relative humidity sensor is shown in Figure 2(c).
Air pressure
Another factor that plays a role in the formation of icing is air pressure. When the air pressure increases, the freezing point drops and the boiling point increases with the same rate. When calculating the prediction algorithm for any icing on the road, the amount of air pressure plays an important role in addition to the air temperature. A BMP-180 digital air pressure sensor with low power consumption is used in this study to obtain air pressure data. The sensor measures the air pressure with a range of 300–1100 hPa and communicates with the SBC via the I2C protocol. The air pressure sensor is shown in Figure 2(d).
Salt concentration sensor
The salt sprinkled artificially on the road surface will decrease the freezing point and the amount of icing on the road. Therefore, the measurement of salt concentration on the road surface is necessary for accurate estimation of the road surface condition. While the Raspberry Pi 3 is equipped with a general-purpose input and output unit, there is no ADC in it to read analog sensors. ADS1115 is a 16-bit analog signal measurement device that can be used either in microcontrollers with no ADC on sensor card or in systems with low-resolution ADC. The ADS1115 has the ability to convert four 16-bit high-resolution analog signals to a digital signal and obtain 860 sampling rates per second. It has an amplifier for those who deal with small signs. It has an operating voltage between 2 and 5 V. It communicates with the SBC using the I2C communication protocol. Four cards can be added to the system at the same time with a card that has four different addresses. With this functionality of the sensor, a total of 16 ADCs can operate simultaneously. The salt concentration of the road surface is determined by resistance between the two conductive bars placed on the road surface. When there is salt on the road surface, the resistance between the conductive bars decreases and a value close to 0 V reaches the ADC. The prediction algorithm works according to the decrease in the degree of ice. The diagram of the salt concentration sensor with the ADS1115 module is shown in Figure 3.
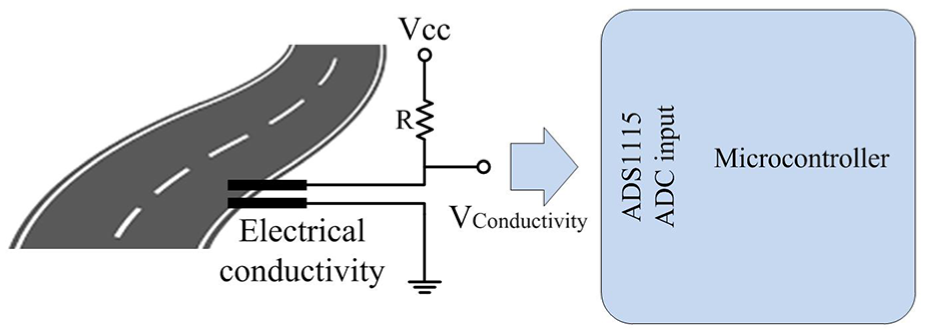
Diagram of the salt concentration sensor.
Software
The intelligent road condition sensor works on Raspberry Pi 3 with the Raspbian operating system. Python programming language is used to encode the algorithm as it has versatile features and requires fewer programming codes. Python is compatible with embedded systems such as Raspberry Pi and the programming language allows developing web services fairly easy. In addition, the availability of extensive library support for hardware elements makes Python preferable and appropriate for the purpose of this study.
The designed system consists of three phases. The first phase is collecting the training data from the risky area. This phase is necessary for data classification. The second phase, subset selection, is selecting the most appropriate subset data to estimate the aggregated data that are highly accurate. The final step is to integrate a low-cost road surface prediction system with Raspberry Pi 3 and sensors, so the end user can be informed.
The road and weather data are collected through IRS31 and WS600 sensors. The data were collected in 1-minute intervals for a 30-day period and recorded in the database. Corrupted or missing data have been removed from the database. The sensor data that came to Raspberry Pi 3 are recorded primarily on the memory card on its own. These data can also be transferred to the database if desired. In the designed system, the road and weather data are read instantaneously and inserted into the classification algorithm along with the previous data. A prediction for road surface condition was made using the classification algorithm between the instantaneous sensor information taken from the peripherals and the information recorded previously. The flow diagram of the system is shown in Figure 4.
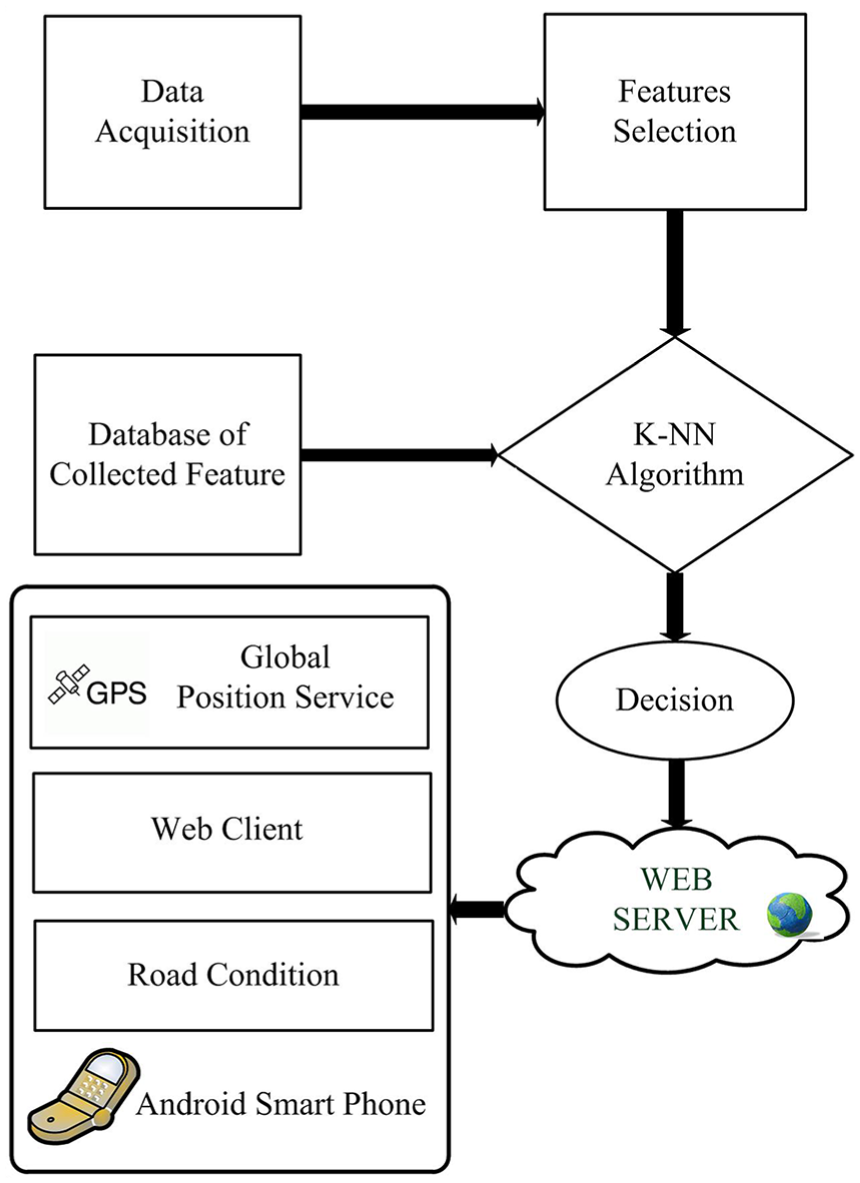
Flow diagram of the system.
This study uses the widely used classification technique, k-NN algorithm, in order to predict road surface conditions. The results from the algorithm are then transmitted to the web page over the modem via Raspberry Pi 3. The designed web page contains latitude and longitude of the sensor node and the road condition information. This information can be obtained from the application’s web address by the drivers.
Vehicle drivers passing through the sensor node point can receive road status information in real time via the mobile application developed. Using this mobile application, vehicle drivers receive the road surface information on the route before they reach the sensor node position.
Evaluation
The designed system measures and records the surface temperature of the road, the air temperature, the air humidity, the air pressure and the amount of salt on the road surface. In addition to the surface temperature of the road, the temperature at 10 cm depth of the road is also added to the system. More sensors can be added to the overall system at any time. The data for this study were collected from a location where previous accidents occurred due to icing on the road during winter months. Regional weather data values were found to be close to general meteorological data values of the region; however, the data from the local risky area were different from the general weather data. Local geographical structure or the differences in solar time may cause sudden changes in the air flow and local weather conditions. Thus, any data collected from the research site should take all these factors into account for an accurate prediction of the road surface condition. The data collected in this study are randomly distributed into two groups and used as the training and test data in the classification algorithm in order to calculate the results.
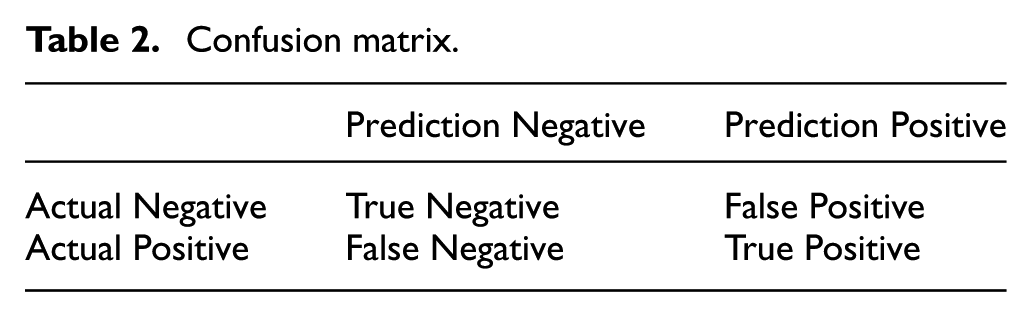
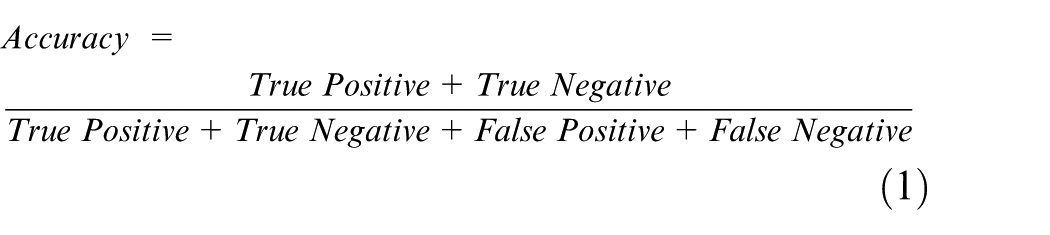
The results of the classification are evaluated through a confusion matrix. The confusion matrix is a controlled data set containing a reference data set with a classification set.40,41 The confusion matrix is a table used to check the efficiency of the classification algorithm. Calculating a confusion matrix also allows researchers to draw conclusions on the errors or determine missing sides of the classification model. Diagonal elements on the confusion matrix show accurate estimates. Values such as accuracy rate, sensitivity and prevalence can be calculated from the confusion matrix as shown in Table 2. The ratio of the sum of the diagonal values to all values provides the accuracy rate. The performance of the classifiers is compared to the accuracy rate and the results are shown using equation (1)
Confusion matrix.
In this study, a confusion matrix is created for four classes of road conditions: icy, dry, wet and salty-wet. The controlled data set is processed on six different classification algorithms and evaluated through the confusion matrix. Classification algorithms are logistic regression, SVM, naive Bayes, decision tree classifier, random forest classifier and k-NN classifier. The confusion matrix values are shown in Table 3.
The confusion matrix values.
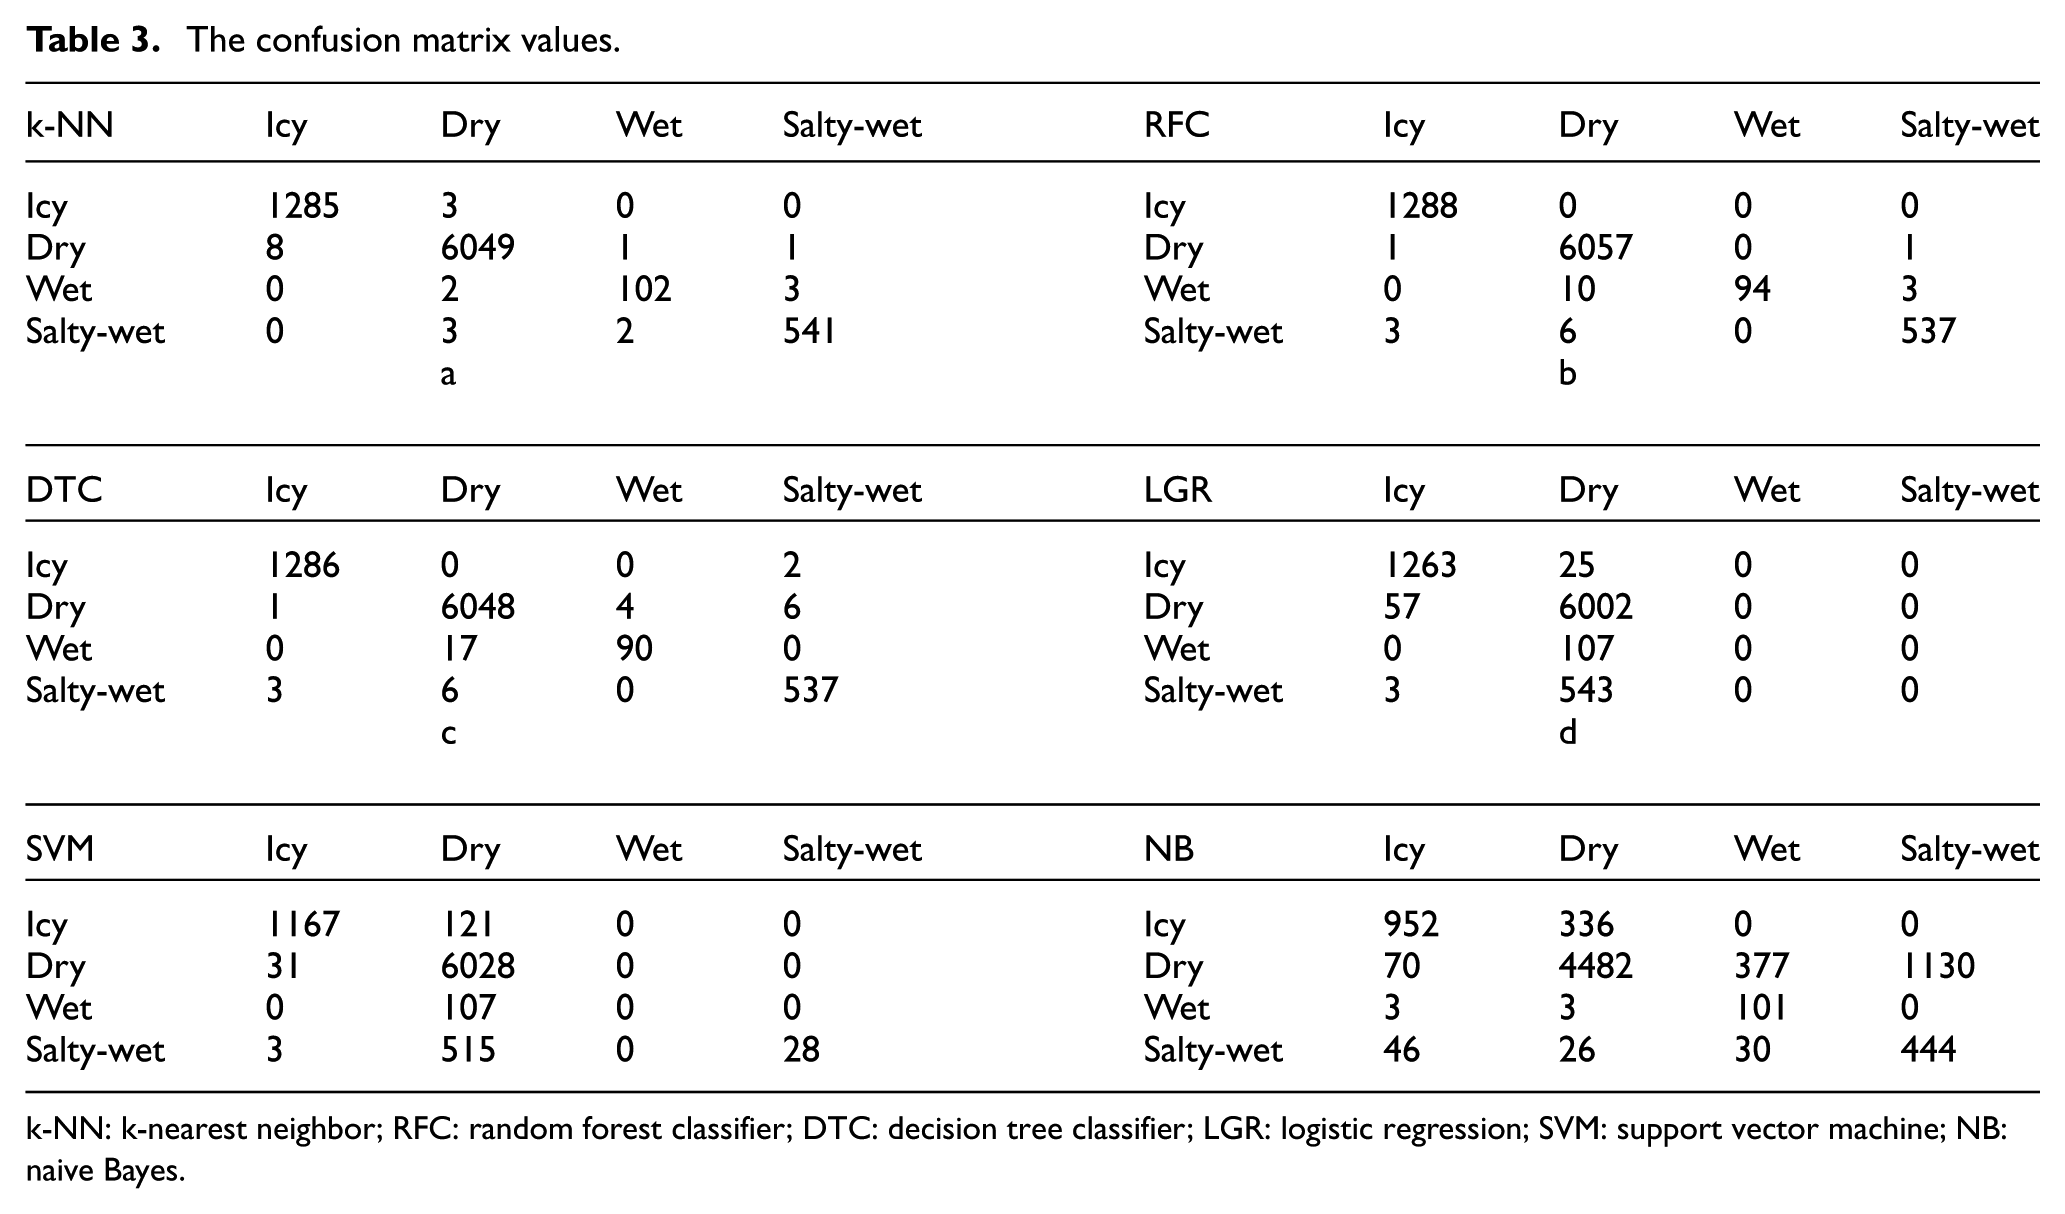
k-NN: k-nearest neighbor; RFC: random forest classifier; DTC: decision tree classifier; LGR: logistic regression; SVM: support vector machine; NB: naive Bayes.
Table 4 shows the most accurate classification in the processed data achieved with the k-NN classifier. Accordingly, the observed success rate of the system is 99.71%.
Success rate of the classifier.
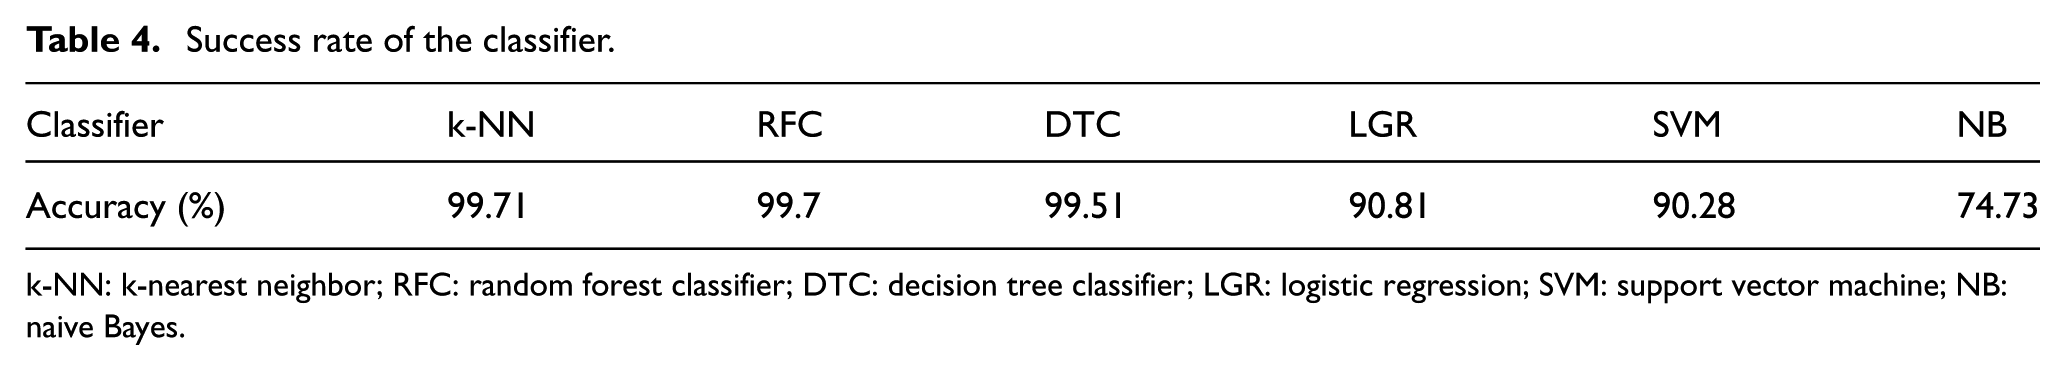
k-NN: k-nearest neighbor; RFC: random forest classifier; DTC: decision tree classifier; LGR: logistic regression; SVM: support vector machine; NB: naive Bayes.
The values of temperature 10 cm below the road surface, air temperature, air pressure, air humidity and salt concentration of the road surface are entered into the SBC. The data previously recorded and the data obtained in real time are both input to the prediction algorithm and the results from the calculations are sent to the web page. The prepared web page shows the coordinates of the positioned sensor node and the surface condition of the road at that location. A new sensor node point coordinate can easily be added to the web page if desired. This feature enables the creation of a wireless sensor network. The surface condition data are received by placing the sensor node at risky coordinates as shown in Figure 5. Subsequently, the final results are listed on the web page of the designed node system.
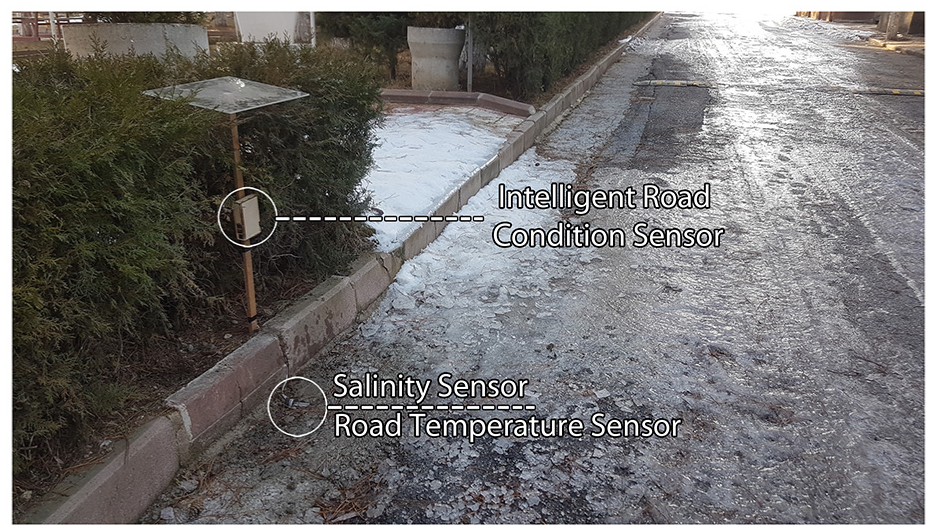
Picture of the intelligent road condition sensor node placed on a risky road.
When the results of the sensor network are published on the web page, using the application written on the Android phone, the coordinates on the web page are constantly listed and updated during the data transition from risky coordinates. Then these coordinates are compared with the driver’s coordinate. In case of a match between driver’s and sensor node coordinates, the mobile application gives warning about the road condition on the screen of a mobile device. In this way, drivers are informed before they arrive at a risky road location. Mobile application for wet and icy road conditions is displayed in Figure 6.
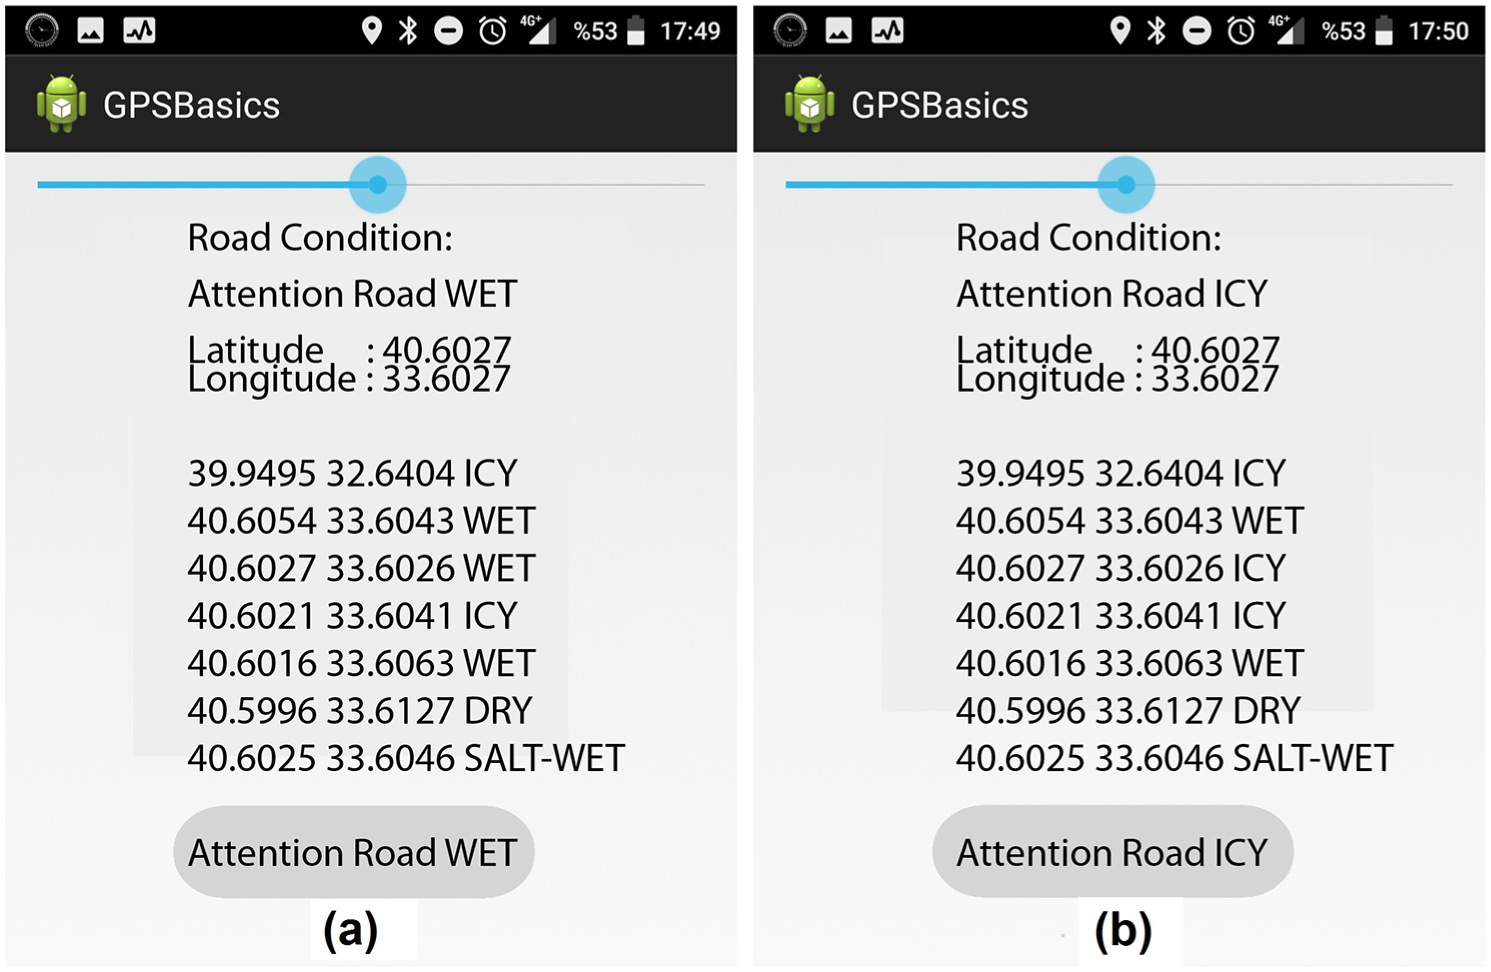
Mobile application screenshot: (a) wet road and (b) icy road.
Conclusion
This newly designed and implemented system will contribute to efficient, safe and predictable driving under the bad weather and road conditions. The superiority of the system is to provide low-cost, real-time information to the drivers on a wireless sensor network. With the help of the mobile application, drivers can be alerted about the road surface conditions instantly via voice and video notifications. The system uses the data recorded on the SBC and contains values for the road surface temperature, air temperature, air humidity, air pressure and salt concentration of the road surface. The collected data are applied to the k-NN algorithm and the authors of this study were able to make predictions for the surface condition of the road with 99.71% success rate. The results from the analyzed sensor network data are then published on the designated web page. The resulting coordinates are compared with the instant coordinates of the driver. In case of a match, the mobile application gives a warning about the road condition on the screen of the mobile device and this allows the drivers to get informed of any risky road conditions in advance during their travel. The system can be transformed into a comprehensive network. This way, intelligent decision support system and artificial intelligence can be used to predict road condition at certain waypoints along the route. It can also be integrated with weather forecasts for critical regions; medium- and long-term forecasting can be studied for road conditions.
Footnotes
Declaration of conflicting interests
The author(s) declared no potential conflicts of interest with respect to the research, authorship and/or publication of this article.
Funding
The author(s) received no financial support for the research, authorship and/or publication of this article.