
Abstract
Hoisting vertical rope is a continuum of one-dimensional movement during operation of hoist, and there are no appropriate ways to measure its vibration displacement at present. In this paper, a non-contact and unmarked machine vision measurement method is proposed for measuring the transverse vibration displacement of hoisting vertical ropes. First, we construct the background image to extract the ropes by the background difference method. Subsequently, a novel row-column data statistics filtering algorithm is proposed and applied to the edge detection image for removing the edges of the unmeasured rope. Finally, Hough transformation is used to locate the two edge lines at the boundary of rope and obtain the line parameters, which can be used to calculate the vibration displacement of the measured points at different times. The transverse vibration displacement of a moving hoisting vertical rope in a mine hoist was measured by using the reported machine vision measurement method, verifying the feasibility of the method. In order to verify the validity of the method, a simulation experimental system was built. The proposed method and the laser displacement sensor were used to measure the artificial transverse vibration displacement of a vertical rope simultaneously. The two results are in good consistency, which indicates that the proposed method can be fairly reasonable and accurate to measure the transverse vibration displacement of vertical rope in mine hoists.
Keywords
Introduction
The dynamic characteristics of hoisting vertical ropes determine the safety and stability of a floor-type multi-rope friction mine hoist as shown in Figure 1(a). The upper and lower ends of vertical ropes are connected with the head sheaves and hoisting conveyance, respectively. The axial vibration of the head sheaves is induced by their own inevitable circular degree or coaxial and installation errors together with the winding motion of the friction pulley. Likewise, the denivellation of cage guide leads to the transverse fluctuation of the hoisting conveyance. The lateral oscillation of the head sheaves and hoisting conveyance will cause transverse vibration of vertical ropes, 1 and the schematic diagram of vibration is shown in Figure 1(b). These transverse vibrations may lead to the collision between adjacent ropes, reducing system safety and shortening the lifetime of ropes. To provide precise data support for reliability evaluation of hoist, researching the vibration abatement ways of hoisting vertical ropes, it is significant to measure the vibration displacement of hoisting vertical ropes.
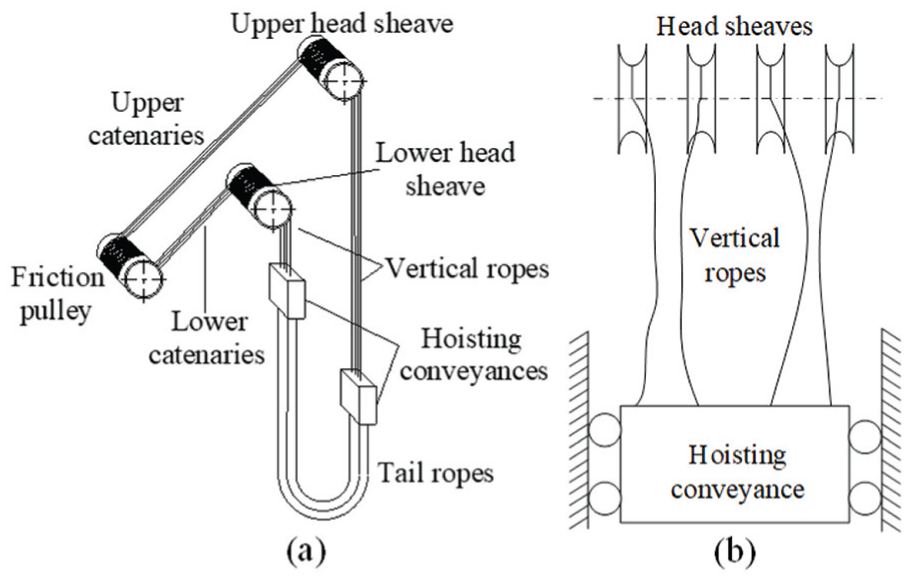
(a) A floor-type multi-rope friction mine hoist and (b) transverse vibration schematic of vertical ropes.
Flexible hoisting rope is a continuum of one-dimensional movement during operation of mine hoists. 2 Traditional vibration measurement technology adopts different accelerometers and displacement sensors attached to the measured object, which affects the inherent characteristics of the system and are difficult to be installed in moving hoisting ropes. And these sensors can only be used for fixed point measurement, which is unsuitable and unreliable for the ropes’ vibration measurement. Therefore, we need to consider adopting non-contact measurement technology to obtain the vibration displacement of hoisting vertical ropes.
Gentile3,4 measured the vibration response of cables by applying the microwave remote sensing technique. Laser measurement system was adopted to monitor stay cables of cable-stayed bridges and bridge deflection and vibration.5,6 Although microwave and laser system have high accuracy and are easy to control automatically, they are rather expensive and can only carry out single point measurement. Watson et al. 7 proposed global positioning system (GPS) technology-based approach to monitor the structural movement of a cable-stayed bridge. Moschas and Stiros 8 used GPS and an accelerometer to measure the dynamic displacements and modal frequencies of a short-span pedestrian bridge. In spite that GPS technology has a certain degree of accuracy for measuring flexible structures’ vibration, the measurement data are not easy to collect and its economy is poor.
At present, the vibration measurement methods based on the image processing are adopted increasingly, which can provide a complete vision field and perform multi-point vibration measurement for flexible structures. 9 Ji and Chang 10 utilized a proof-of-concept image-based technique to measure small cable vibration. Lee et al. 11 made use of a motion tracking method to obtain the dynamic characteristics of a very flexible beam undergoing large displacement. Li et al. 12 studied a non-contact and non-intrusive method based on a square image marching algorithm to observe the large amplitude vibration of stay cable. Kim 13 identified the center of the targets on the cable surface with a multi-template matching algorithm. Kim and Kim 14 investigated the dynamic characteristics of the hanger cable by using the normalized cross-correlation algorithm to match object and by introducing the quadratic polynomial function to correct the geometric distortion between the deformed and undeformed images. Lee et al. 15 used a high-speed camera to measure the thin cantilever bean vibrations by tracking markers on it. Feng et al. 16 adopted vision-based sensor system enabled by the robust orientation code matching (OCM) algorithm to measure the cable vibrations. Chen et al.17,18 used a digital photogrammetry technique based on digital image processing (DIP) to identify the mode shape ratios of stay cables. Ribeiro et al. 19 built a non-contact dynamic displacement measurement system for railway bridges deck based on binary image and image scanning technique to track the central point of the predefined target. Yao et al. 20 applied mean shift tracking algorithm and digital graphics overlay method 21 based on monocular vision to measure the transverse vibrations of hoisting catenaries in mine hoists.
The existing literature indicates that the research objects of flexible structures’ vibration measurement are mainly the stay cables with different kinds of additional markers. The difference between hoisting vertical ropes and stay cables is that the two ends of hoisting vertical ropes are unfixed and the spatial position of a certain point in the rope is changed. Therefore, we proposed a non-contact and marker-less vibration measurement method based on DIP technology to measure the transverse vibration displacement of the interest point in hoisting vertical ropes. In this method, background subtraction method is utilized to extract vertical rope, and rope edge location is measured with Canny edge detection algorithm and Hough transformation. To improve the accuracy of measurement, a new row-column data statistics filtering algorithm is adopted to retain the edges of the measured rope and remove the edges of the unmeasured ropes, and optimize the location results of the Hough transformation to eliminate the inner edges of the rope. The artificial vibration of vertical rope on the simulation platform built by ourselves is measured, validating the proposed method.
Methodology
Measurement principle
The primary vibrations of vertical ropes are obtained from the deflection of head sheaves and the random unevenness of cage guide, which are parallel to the axial direction of head sheaves. So the major mission of hoisting vertical rope vibration measurement is to obtain transverse vibration displacement of an arbitrary point in it.
Obviously, the vertical rope is cylindrical in shape, which displays a rectangle in two-dimensional digital images, so its edge information is easy to be obtained. The position of the target can be determined by locating the edge of the target in the image.22,23 Here, we proposed an edge location measurement method based on DIP to measure transverse vibrations of vertical ropes. The schematic of the measurement principle is shown in Figure 2.
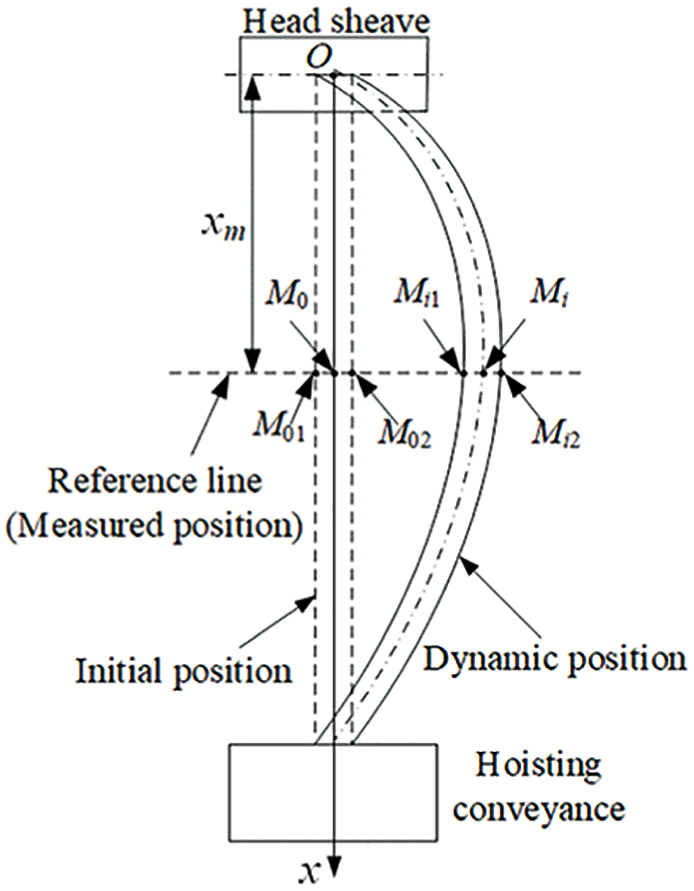
Schematic of the measurement principle.
A vertical rope is in the initial position before the hoist is running. And at a certain time, it is in the dynamic position. The offset distance between the dynamic point position and its original position at the stationary state is its vibration displacement. Because vertical rope has a certain width (the size of rope diameter), the edges of a vertical rope can be regarded as its actual position in images. Therefore, the vibration displacement of the measured hoisting vertical ropes can be calculated after obtaining its edge positions in the images. It is necessary to determine the actual position of the measured point in the vertical ropes before performing vibration measurement. Coordinate system is defined by taking the o point, that is, the tangent point of head sheave and a vertical rope, as the origin, and the axis of vertical rope in initial position is regarded as x axis to determine the measured position. The distance from M0 in vertical rope to the origin is xm, and point M0 can be selected as a measured point.
A virtual reference line that is perpendicular to the vertical rope and passing through the measured point needs to be added, and the intersection point between the vertical rope and the reference line is the location of the measured point in every image. The position of point M0 includes two intersections, and they are M01 and M02, which are the points in the left edge and right edge of vertical rope at time t = 0. And at time t = ti, the position of point M01 and M02 will be in the position of point Mi1 and Mi2 in dynamic vertical rope. The vibration displacement of hoisting vertical rope is the distance from point M0, which is the midpoint of the line segment between point M01 and point M02, to point Mi, which is the midpoint of the line segment between point Mi1 and point Mi2, with respect to time. In the video image sequence, the pixel coordinates of point M01 and M02 at the time t = 0 and pixel coordinates of point Mi1 and Mi2 at the time t = ti can be determined by applying the edge location algorithm proposed in this paper, respectively. Suppose the pixel coordinates of point M01 and M02 and Mi1 and Mi2 be determined as (x01, y01) and (x02, y02) and (xi1, yi1) and (xi2, yi2), the pixel coordinates (x0, y0) and (xi, yi) of point M0 and Mi can be identified easily.
Then the vibration displacement of point M01 at the moment ti can be calculated as follows
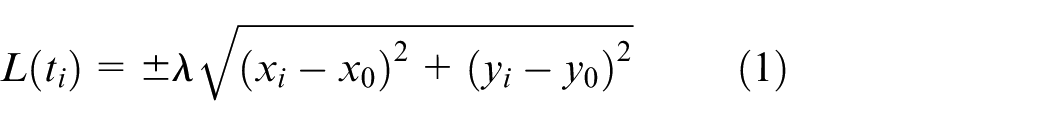
where L(ti) is a transverse vibration displacement; λ is a scale factor with unit mm/pixel, which is used for translating the pixel distance in the image coordinate system to actual distance; i = 1, 2, 3,…, N, and N is the frame number of video image sequence.
According to the measurement principle, we identified the technical methods of implementing the edge location measurement method and their application steps, which were illustrated in Figure 3.
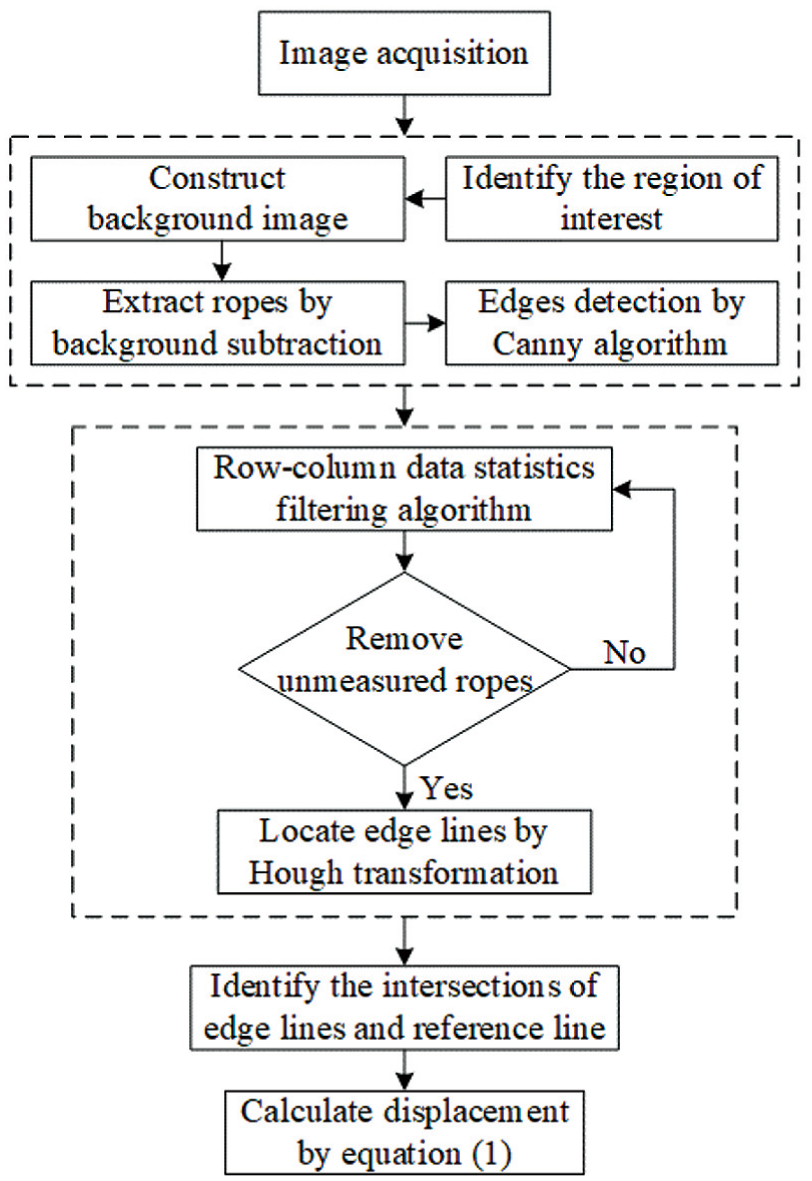
Flow chart of the edge location measurement method.
It can be found from Figure 3 that the proposed method includes three parts in addition to image acquisition: edge detection in the first dotted box, edge location in the second dotted box and displacement calculation. In the following subsections, we will explain these three parts specifically.
Image acquisition
Like the traditional sensor measurement technology, the high-speed camera is a kind of non-contact sensor for image data acquisition. In this work, an easy-to-install and high-speed camera with a couple-charged device (CCD) sensor and portable lenses is adopted. And the camera can capture the video images, which are digitalized at 768 × 1024 pixel resolution and each pixel is 8-bit data type, and its sample rate reaches 1000 fps. And the data acquisition system also includes a portable computer for storing the video image as shown in Figure 4.
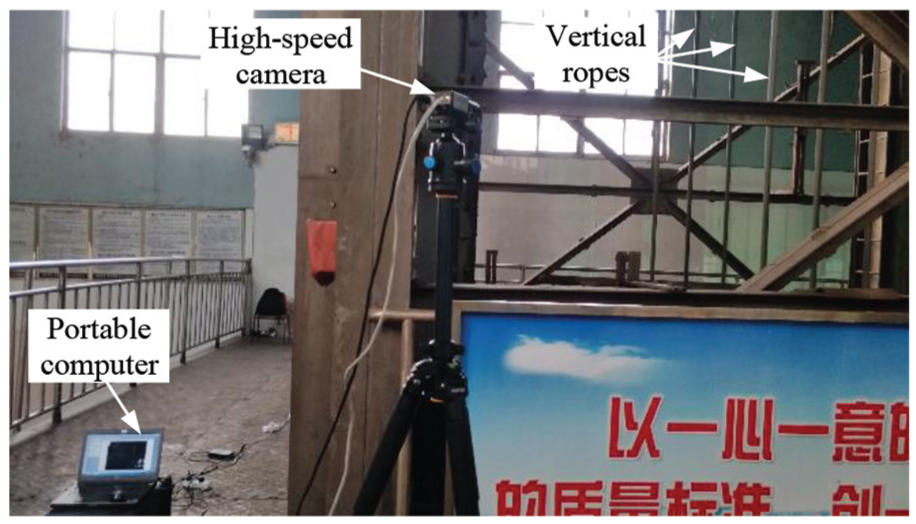
Image acquisition system in field.
During the process of video acquisition, it is usually possible to mount the camera directly to the tripod, making sure that it is on solid ground. In the work, an actual vertical rope vibration measurement was executed at the auxiliary shaft of Yaoqiao Coal Mine attached to China National Coal Group. An original static image captured is shown in Figure 5.
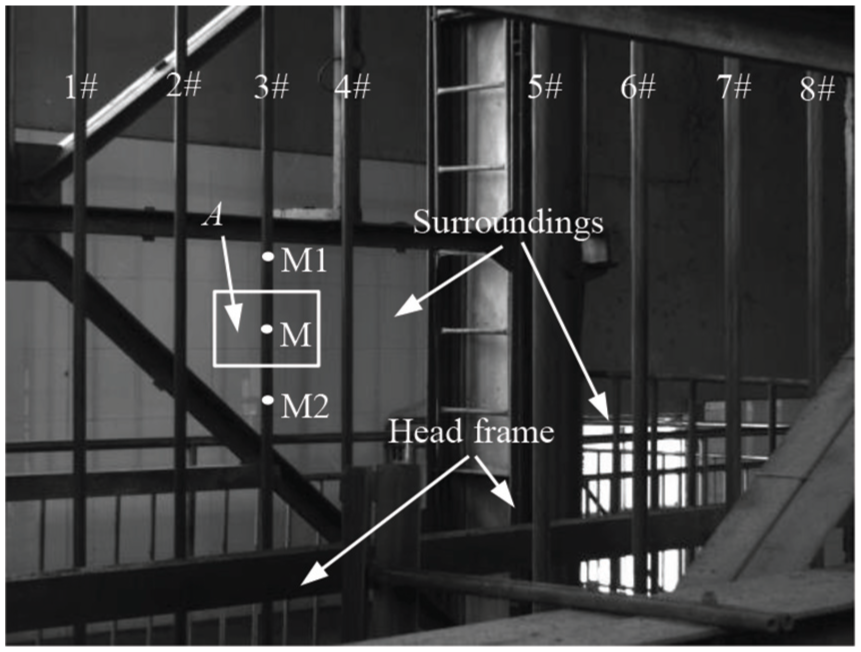
The first-frame original image of vertical ropes.
Figure 5 indicates that not only eight vertical ropes on the upper and lower head sheaves are in the original image, but the head frame and the surrounding environment also are photographed inevitably.
Edge location–based vibration measurement method
Extracting the measured vertical rope
As shown in Figure 5, it is obvious that all of these intricate backgrounds around the vertical ropes will affect the feature extraction of the measured vertical ropes. For solving this problem, we chose the background subtraction method to extract the hoisting vertical rope. Assuming that the current image and its background image are It(x, y) and I1(x, y), respectively, the background subtraction method can be expressed as
where IIt(x, y) is the difference image which only includes vertical rope; i = 1, 2, 3,…, N, and N is the frame number of video image sequence; and τ is the threshold of gray value difference.
Because vertical ropes are in every image, it is impossible to identify the background directly. Therefore, we proposed constructing background method to obtain the background image. Considering that the measurement technology will be used to obtain the vibration displacement of vertical ropes in the pit shaft in future, and in this situation, the wall of well hole will be the background of vertical ropes. And the texture structure of the wall of well hole is also complicated, but it can be consistent in all regions, so constructing background method is suitable. Generally, it is necessary to identify the region of interest (ROI) for performing vibration measurement. Therefore, in the case study that is the fourth section of this paper, the rectangular region A in the original image is regarded as the ROI to investigate the transverse vibration of vertical ropes in mine hoist. Here, we also select region A to present the image processing method. And M is the middle point of vertical rope in region A.
Region A in the first frame of the original image sequence is shown in Figure 6(a). For constructing background, the first step is to locate the region B containing the measured vertical rope through the edge extraction algorithm in Figure 6(b). An edge detection image obtained by using the edge detection method directly is shown in Figure 6(c), which contains the rope edges and some edges of other objects that may affect the location of the measured rope edges. This is also the reason why we chose background subtraction method to extract the vertical rope instead of identifying its edges with the edge detection algorithm directly.
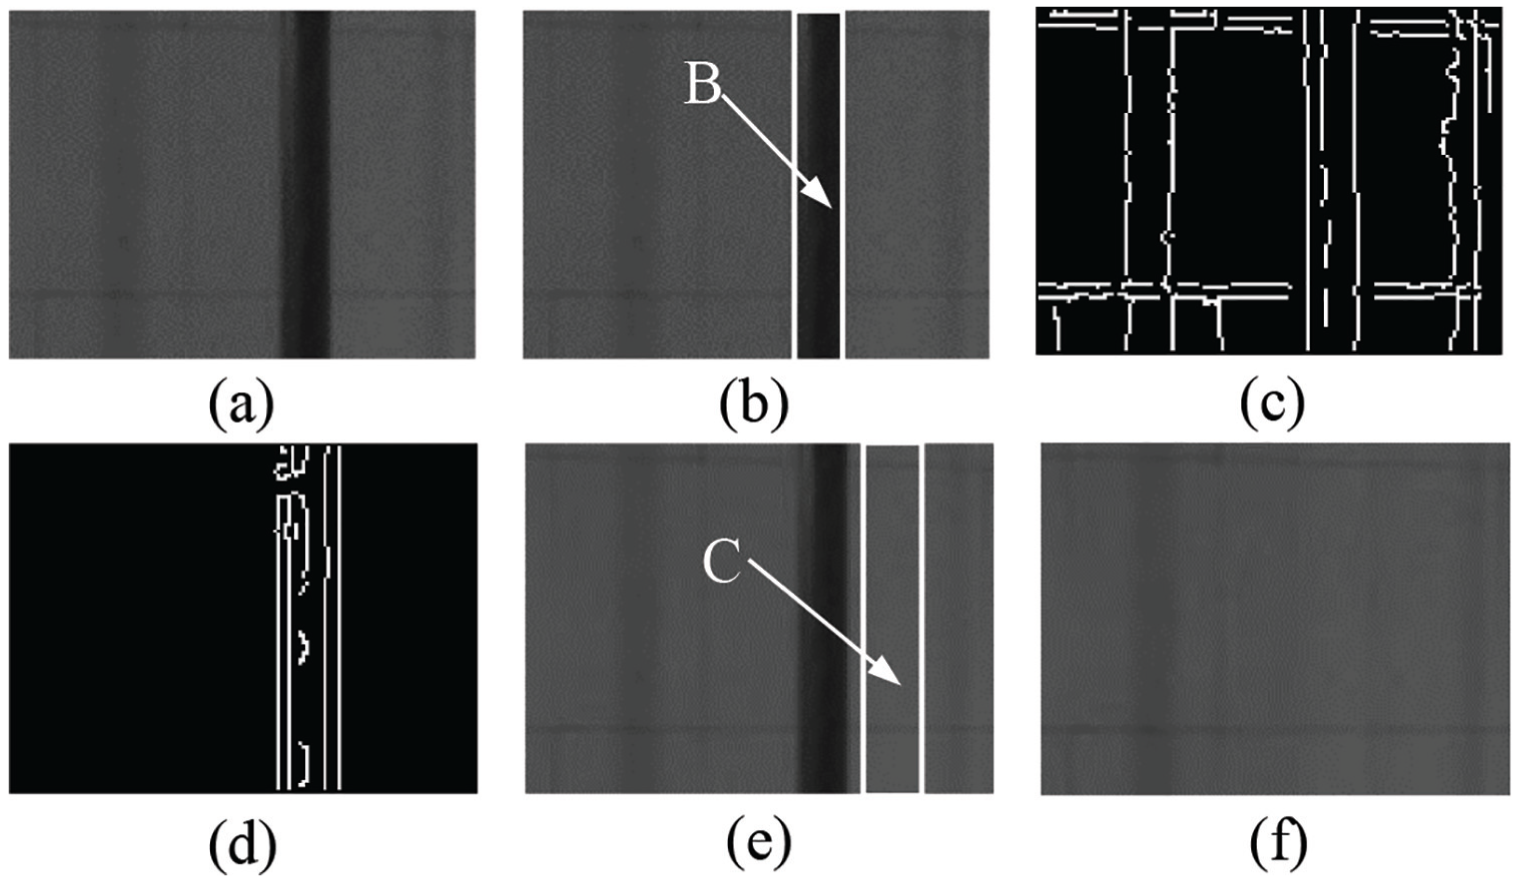
(a) The first original image, (b) the region of vertical rope, (c) edge detection result of the original image, (d) edge detection result of the difference image, (e) background region for replacing rope region and (f) background image.
In order to solve this problem, it is necessary to select two images in the video, and the inter-frame difference method is utilized to obtain the difference image that only contains vertical rope. Then the edge position of vertical rope can be obtained easily, and the image that only includes the edges of vertical rope is shown in Figure 6(d). Next, as shown in Figure 6(e), the region C beside the vertical rope is opted to replace the region B in the original image. Thus, a background image removing the vertical rope, as shown in Figure 6(f), can be obtained, which can be used in the background subtraction method to extract the measured vertical rope.
Figure 7 shows the effective images of extracting vertical rope by applying background subtraction method to the ROI, and the white parts are vertical ropes whose positions are different in every original image. Moreover, it can also be seen that the cylindrical rope in the image is presented as a rectangle in Figure 7, and the two edge lines of each rectangular area also keep very clear, which also proves the effectiveness of the method.
The image of removing the background: (a) 1st frame, (b) 10,000th frame, (c) 30,000th frame, (d) 50,000th frame, (e) 60,000th frame and (f) 80,000th frame.
Edges detection of vertical rope
Applying object edges information for distinguishing the object from the background in image is a main means of machine vision technology. By comparing the different edge detection results of vertical rope by using a variety of different detection algorithms, we chose Canny edge detection algorithm to identify the edges of vertical rope. In this method, Gaussian function is applied to the image filtering, and first-order difference operator is used to calculate the gradient and direction of the image. At the same time, using non-maximum suppression and hysteresis threshold method can determine the maximum gradient value, realizing the edge information acquisition. This algorithm can reach a good balance between edge detection and the removal of noisy points.
In order to confirm that Canny edge detection algorithm is sufficiently accurate to identify the edges of vertical ropes, a new and simple image metric method is designed. First, we built an irregular geometric drawing, as shown in Figure 8(a). Second, Canny algorithm was applied to the geometric drawing, and the detection result was illustrated in Figure 8(b). Finally, we compared some specific parameters obtained from edge detection results with their preset values in the original image to accomplish the metric for edge detection image.
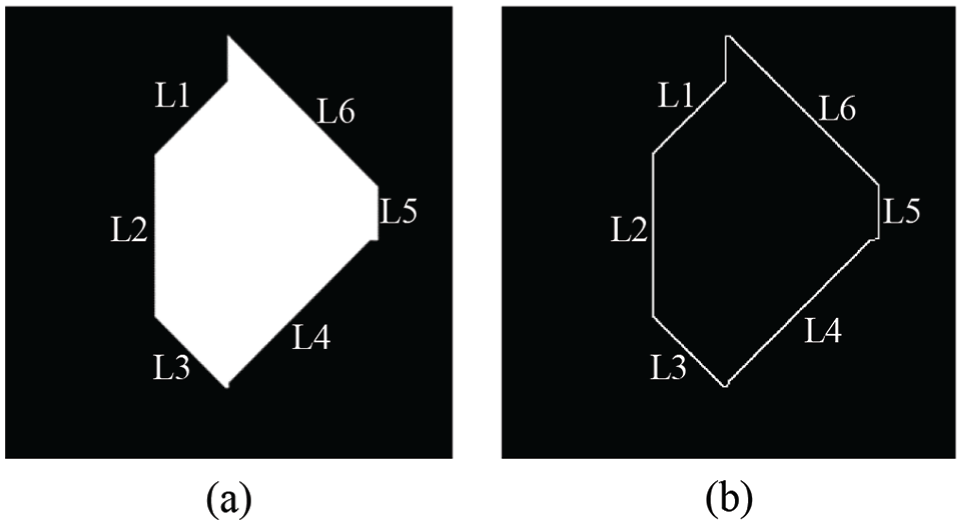
(a) An irregular geometric drawing and (b) the edge detection result from Canny algorithm.
It can be seen from Figure 8 that the edge lines of the irregular geometric drawing are detected absolutely, and some small edges such as the intersection of line L3 and line L4 are also presented originally. In Figure 8(a), the slopes and intercepts of all the six lines, which include the segments L1-L6, respectively, are known. And by using least square fitting method, we determined the slopes and intercepts of all the lines in Figure 8(b), which were compared with prior values in the original image. And the accuracy analysis of Canny algorithm was carried out, which was presented in Table 1.
The relative errors of the slopes and intercepts between the original lines and the fitting lines.
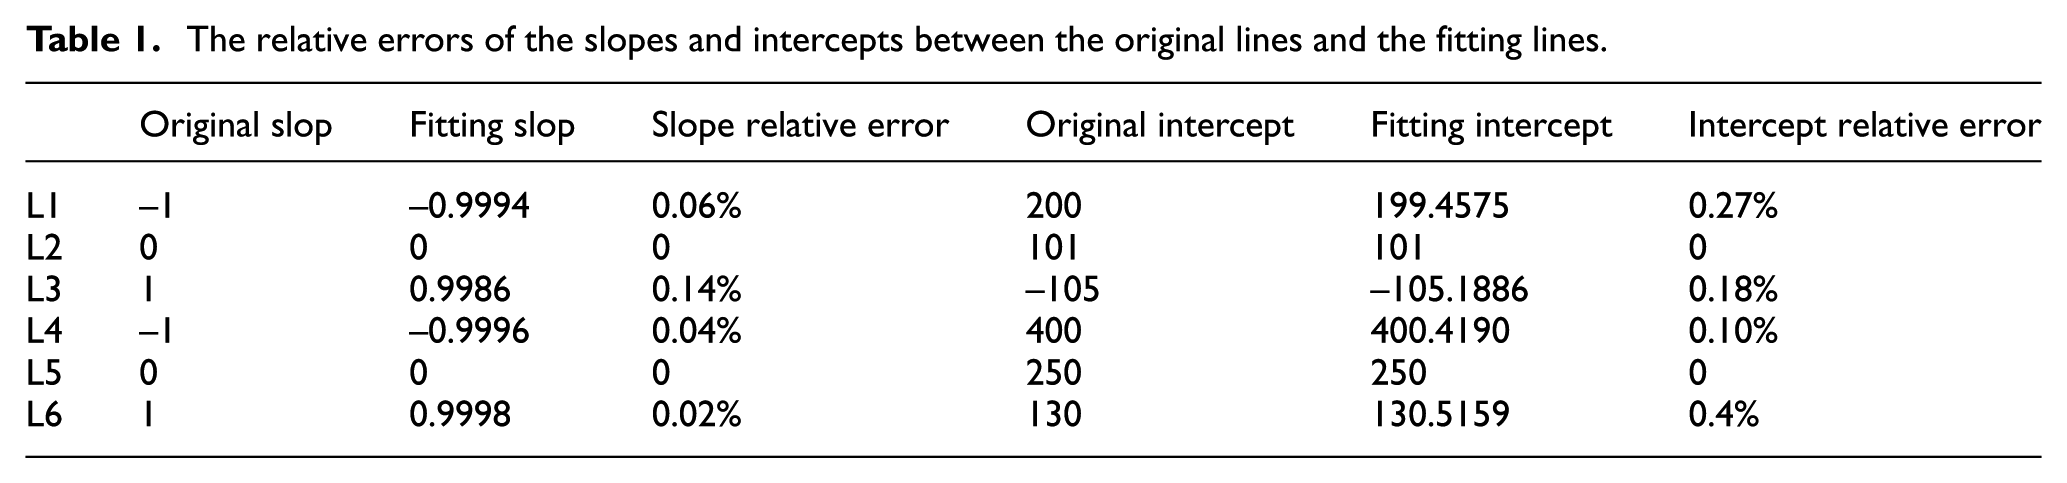
It is found from Table 1 that the relative errors of the slopes and intercepts between the original vertical lines L2 and L5 and the detected vertical lines L2 and L5 are 0. For vertical hoisting ropes, their edge lines are all vertical lines, so the error of using Canny algorithm to identify the edges of vertical hoisting ropes is 0, which indicates Canny algorithm is very accurate to identify the vertical edge lines. In addition, the relative errors from the non-vertical lines are less than 0.5%, which also include the fitting error and can be negligible for the edge location at integer pixel or even sub-pixel level. Therefore, it can be concluded that Canny edge detection algorithm is able to accurately detect the edges of vertical ropes.
A result of using Canny edge detection algorithm to extract the edges of vertical rope of removing the background is shown in Figure 9.
An edge detection image.
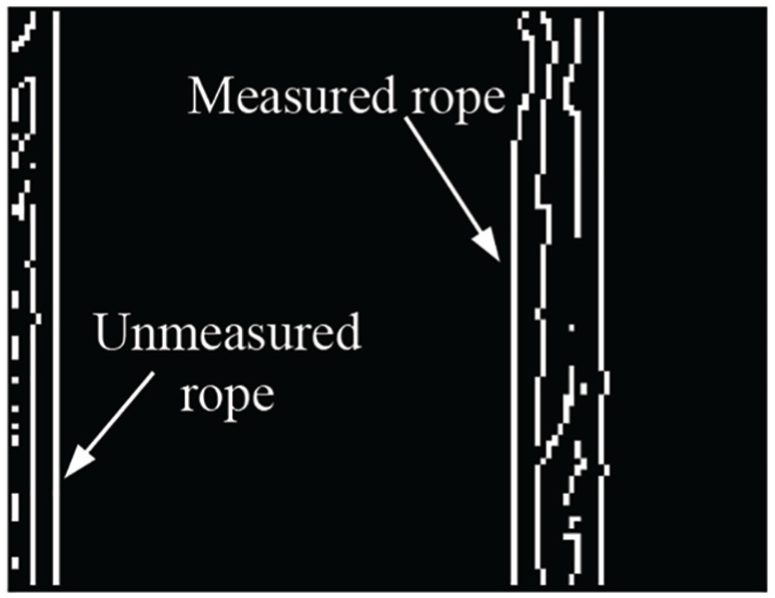
In Figure 9, the edges lines of other unmeasured rope appear in the region A. So in edge locations, it can locate the edges of the unmeasured ropes and the measured vertical rope is ignored in all probability, reducing the measurement accuracy.
To tackle this problem, a novel filtering method named row-column data statistics filtering algorithm is proposed and used to retain the edges of the measured rope and remove the edges of the unmeasured ropes. This method needs to count the number of valid points in each image column. Generally, the edges of the measured vertical rope exist in several columns around the two columns that possess the maximum number of valid points. By comparing the number of valid points in each column, the position of the two columns may contain the leftmost and rightmost edges that are the effective edges of the vertical rope.
What needs to be explained here is that the vertical rope to be measured usually exists in the middle part of the selected region. And it is also noted that every sub-region with the rope should be comprised of a set of continuous pixel columns including the valid points in the edge detection image. And all these sub-regions can be identified according to the statistical results of the valid points in each column.
Suppose that all the columns that may contain the effective edges of vertical ropes are identified as a set U. Thus, if there are three sub-regions including the rope in the ROI, then we find the two columns with their positions in the middle parts of these columns in U.
And if there are two sub-regions including the rope in the ROI, then the region whose positions are farther from the ends of the ROI is the position where the measured rope exists. Thus, we can find the two columns with the maximum and secondary distance from the end of the ROI in these columns in U.
However, the general situation is that only one sub-region includes the vertical rope, and the two columns in U are the edge positions of vertical rope.
In the three cases mentioned above, it can be supposed that the two columns may contain the effective edges of the measured vertical rope and are identified as the columns (a) and (b) in an edge detection image whose column number is m, and a < b < m.
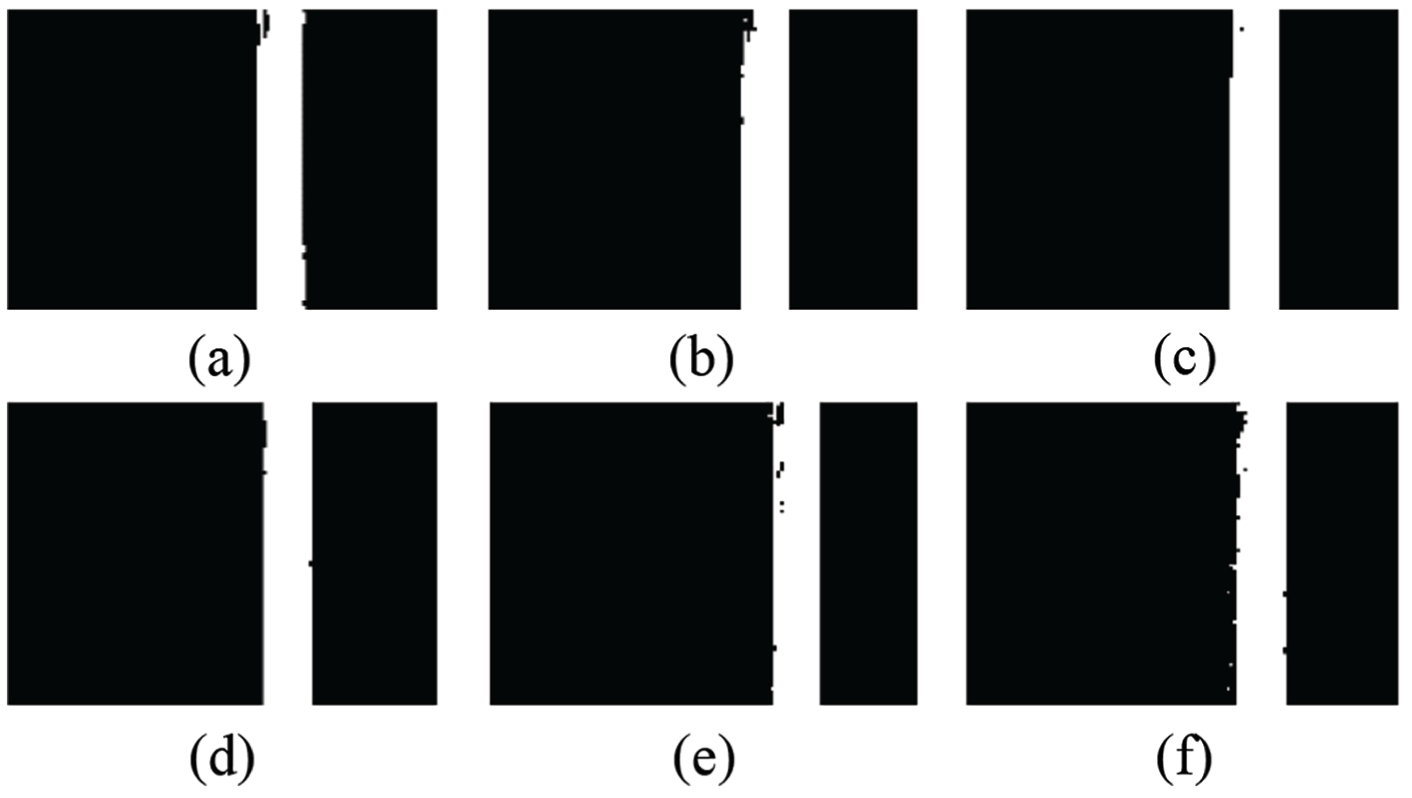
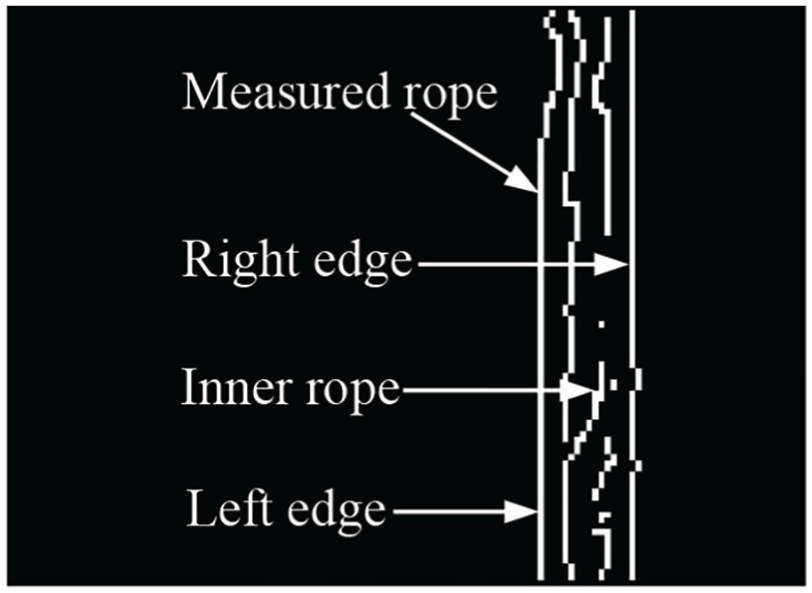
Generally, we can set the gray scale values of the pixel points, those that are out of the columns, between column (a) and column (b) to 0, which can remove the edges of the unmeasured vertical rope. However, it is uncertain whether the column (a) and column (b) of edge detection image are the columns including effective edges. So, the gray scale values of the pixel points in the columns around column (a) and column (b) should not be changed, and the scope is about 2–4 pixels but it may be bigger according to our experience in edge detection of vertical ropes. Therefore, it is reasonable that we set a larger scope to guarantee all possible columns that are including effective edges in it. In this way, the scope between column (a – d) and column (b + d) of edge detection image can be regarded as the area that contains all edges of the measured vertical rope. And d is a set value that represents the size of the area that contains the effective edges. At last, the gray scale values of the pixel points, those that are out of the columns, between column (a – d) and column (b + d) can be set to 0 to get the image that only contains the edges of the measured vertical rope. For example, as shown in Figure 10(a), there are three vertical ropes in the edge detection image, and the middle 3# rope is the measured rope and 2# and 4# ropes are the unmeasured ropes. In order to remove the 2# and 4# ropes, it needs to count the number of the valid points in each column of the image by a statistical method, and the results are shown in Figure 11 where the abscissa c and the ordinate n represent every column of the edge detection image and the number of valid points, respectively.
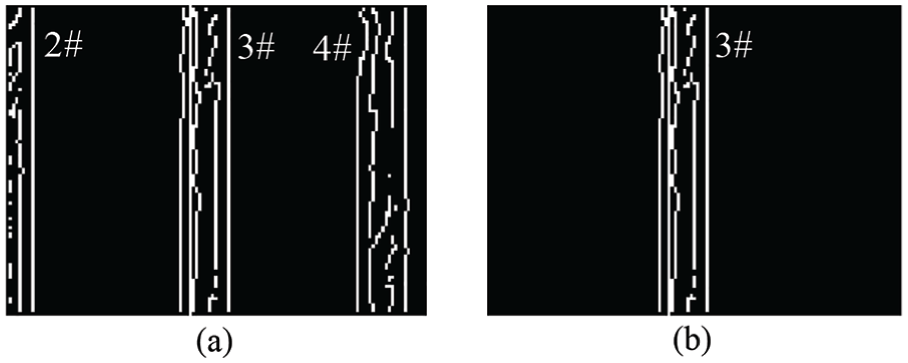
(a) An original edge detection image and (b) a changed edge detection image of removing the unmeasured ropes.
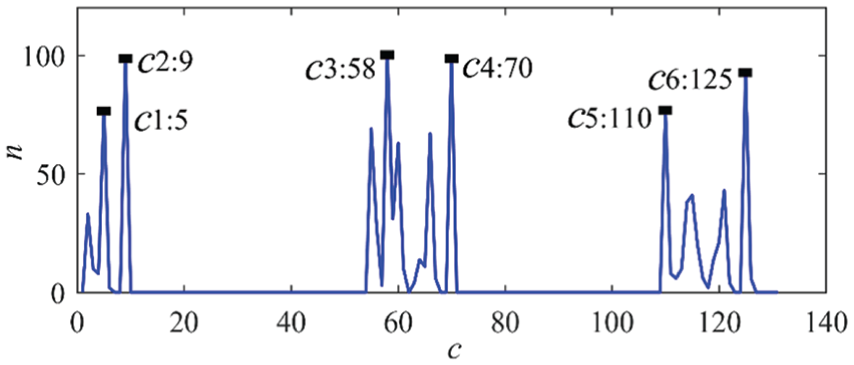
The statistical results of effective points for edge detection image shown in Figure 10(a).
Figure 11 shows three continuous sets of pixel columns that contain valid points, which indicates that there are three sub-regions including the ropes in the ROI. And the possible pixel columns including the effective edges of vertical ropes are in the columns (5), (9), (58), (70), (110) and (125). As mentioned earlier, the measured rope is in the middle part, so the two columns that may contain the effective edges of the measured ropes are the columns (58) and (70) for the measured 3# rope in Figure 10(a). Then, the d is set as 10, and the gray scale values of the pixel points, those that are out of the columns, between column (58–10) and column (70 + 10) is set to 0, and the image shown in Figure 10(a) is changed to the image shown in Figure 10(b). Obviously, the unmeasured 2# and 4# ropes are removed and the measured 3# rope is retained. In computer, the two images shown in Figure 10(a) and (b) were read, and we found that the positions of 3# rope were identical, which were in these pixel columns (55)–(70). All of these results indicate that the row-column data statistics filtering algorithm is valid.
For the edge detection image shown in Figure 9, using the row-column data statistics filtering algorithm and setting d = 10 to remove the edges of the unmeasured ropes are feasible. And the effect image is shown in Figure 12. It is worth noting that the value of d is fuzzy and changeable, but it can be identified as a pixel width as long as it is greater than the scope of effective edges that is about 2–4 pixels mentioned earlier. Therefore, setting d = 10 can make all edge lines in the measured rope be retained.
A processed image by statistical filtering.
Edge locations of vertical rope
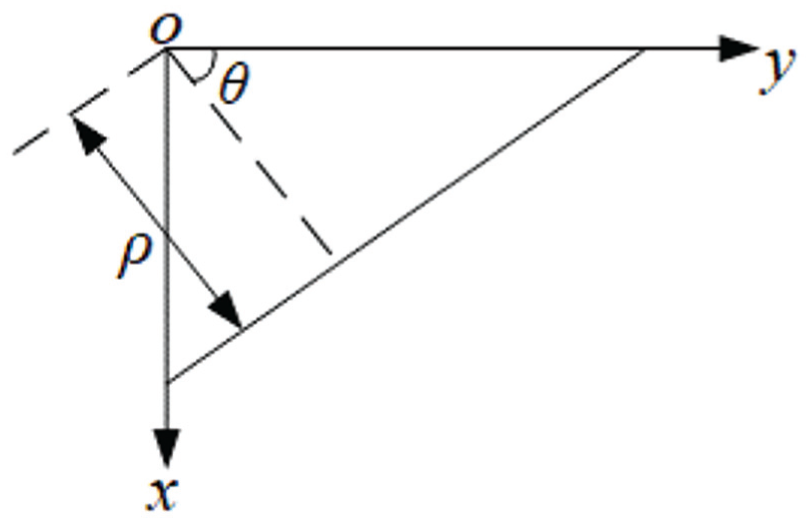
After obtaining the edge detection image that only contains the measured vertical rope, it is necessary to locate the edges so that they are expressed with certain parameters, which can be used to calculate the transverse vibration displacement of vertical rope. Hough transformation is used to locate the edges in this work. Figure 13 shows the schematic diagram of Hough transformation.
Schematic diagram of Hough transformation.
In Figure 13, the point o is the origin of polar coordinate system with a polar axis y and it is also the origin of image coordinate system with the x axis and y axis. In image coordinate system xoy, all of the points (xi, yi) that belong to an arbitrary straight line l can be expressed as

where k is the slope and b represents intercept of line l.
In polar coordinate system, the points (xi, yi) are expressed as

where ρ is the polar radius, that is, the distance from point o to straight line l; and θ represents polar angle that is the angle between the polar axis y and the straight line that passes through origin o and is perpendicular to line l.
In a polar coordinate system, Equation (4) represents a sine curve, which indicates the position of the point (ρ, θ). Obviously, Equations (3) and (4) indicate that a straight line l in image coordinate system can represent many different sine curves in the polar coordinate system and these sine curves intersect at one point (ρ, θ), which is called point-line duality. According to this property, Hough transformation can map the edge line l in image coordinate system to a point (ρ, θ) in polar coordinate system. In polar coordinate system, the number of the sine curves passing through the point (ρ, θ) is obtained by statistical method, and if the number exceeds the set threshold, the coordinates ρ and θ are determined to be the corresponding parameter of a straight line in the image coordinate system.
Owing to that these are some inner edge lines in a vertical rope, as shown in Figure 12, if they are regarded as the left or right edges of a vertical rope, the accuracy of vibration displacement calculation will be reduced. Obviously, the two lines with the largest distance are the edge lines that can be used to identify the position of a vertical rope. Therefore, after Hough transformation is used to locate the edge of vertical rope, it is necessary to select two straight lines with the largest distance as the effective edge lines, thus the effective edges of vertical rope can be located accurately.
Calculating transverse vibration displacement
Applying Hough transformation to edge detection image can determine the parameters of edge lines. Suppose that the effective edge lines of vertical rope can be identified as (ρp, θp) and (ρq, θq) in polar coordinate system, respectively, so arbitrary points (xm, θm) and (xn, θn) in the left edge line and right edge line can be determined as Equations (5) and (6)


So the two edge lines are expressed as Equations (7) and (8) in image coordinate system


Suppose (xa, ya) and (xb, yb) are the initial pixel coordinates of the measured point in the left edge line and right edge line, respectively. Because the two edges of vertical rope are parallel, xa is equal to xb at the situation that the vertical rope is strictly upright in original image, and θp is also equal to θq. Under this circumstance, if θp = 0, then in the first-frame image, the reference line can be expressed as

If θp ≠ 0, then the reference line can be expressed as
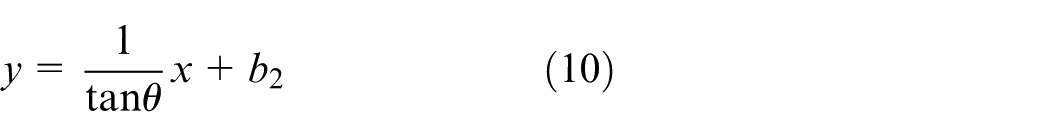
where b1 or b2 represents the intercept of the reference line. And their values are determined by bringing one of the two pixel coordinates (xa, ya) and (xb, yb) into Equation (9) or (10). Thus, the reference line can be identified in the first-frame image, and it is not changed in all images.
As long as b1 or b2 is identified, combining Equation (9) or (10) with Equations (7) and (8) can obtain the pixel coordinates (xi1, yi1) and (xi2, yi2) of the measured point on the left and right edge lines of vertical rope in a certain frame image, respectively.
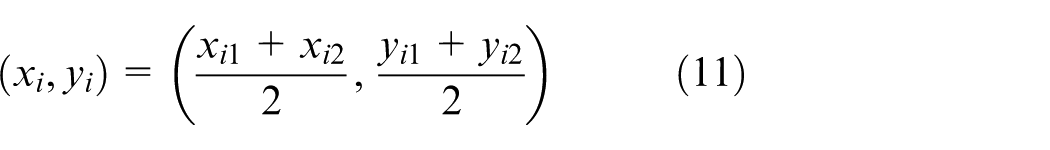
Then the intersection point of the reference line and the middle line of the two edge lines belonging to vertical rope is expressed as
In first-frame image, the pixel width of vertical rope is
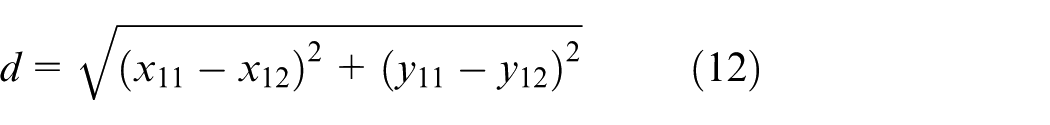
where (x11, y11) and (x12, y12) are the pixel coordinates of the measured points in the left and right edge lines, respectively, and the unit of d is pixel.
Then, the scale factor is expressed as
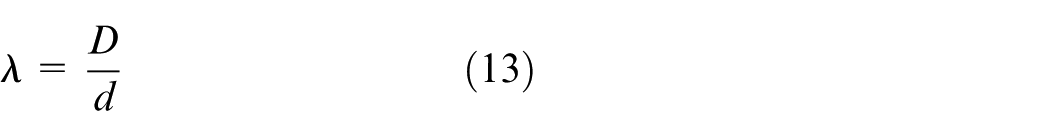
where D is the actual diameter of a vertical rope, and its unit is mm.
Finally, Equation (1) can be used to calculate the vibration displacement of vertical rope at different times.
Case study
In this study, the vibration displacement of a hoisting vertical rope belonging to a mine hoist in service was measured. As mentioned before, the region A in Figure 5 was regarded as the ROI to measure the vibration of an actual vertical rope. The measurement method and the processing of the images that contain the measured vertical ropes have been illustrated before.
And the location result of vertical rope in the first image is shown in Figure 14.
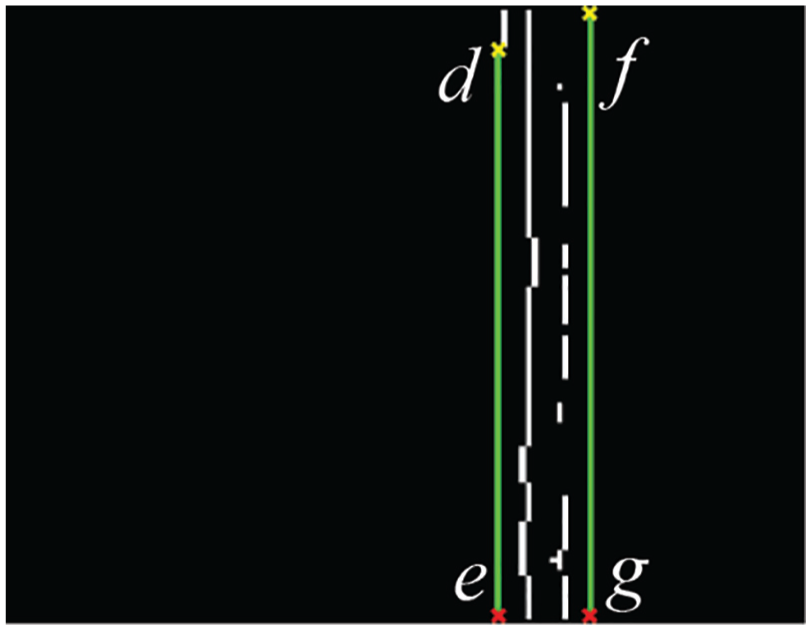
Location result of the edge lines.
It can be seen from Figure 14 that the two green lines are detected and they have the largest distance in all the edge lines. The line between point d and point e is the left edge line, and the line between point f and point g is the right edge line. Obviously, the location result of vertical rope is correct.
The parameters of the two edge lines in the polar coordinate system were (75, 0) and (90, 0). According to Equations (7) and (8), the two lines were expressed as y = 75 and y = 90.
We chose point M that its abscissa was 50, which was the center of vertical rope in region A, to measure vibration displacement. Then, the coordinate of the measured point was (50, 75), which is in the left edge line of vertical rope, and according to Equation (9), the reference line could be expressed as x = 50.
So the intersection points of the two edge lines and the reference line were (50, 75) and (50, 90). The distance between the two points represents the pixel width of vertical rope. The actual width of a vertical rope was 40 mm, and the scale factor of the actual length and the corresponding pixel width can be calculated as 2.6667 mm/pixel with Equation (13). The transverse vibration displacements of the measured point M in the original image obtained by using the edge location method proposed in this paper were recorded in Figure 15(a).
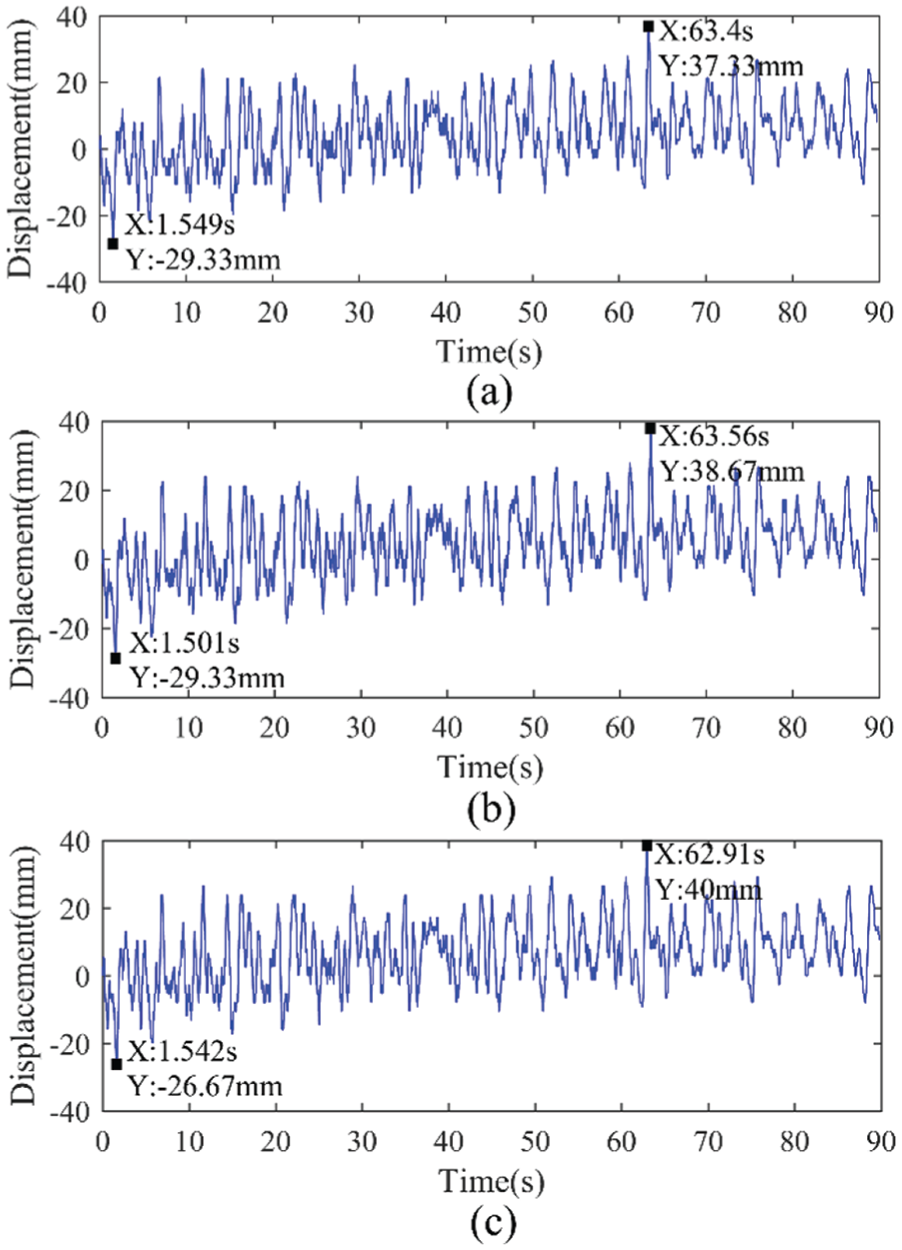
Displacement-time histories of the three test points.
And the method reported in this paper can also carry out multi-point vibration displacement measurement simultaneously. While measuring the vibration displacement of the point M, we also measured the vibration displacements of the other two points M1 and M2 in 3# vertical rope as shown in Figure 5. And the measurement results were recorded in Figure 15(b) and (c). Comparing the vibration displacement measurement results of the three points, we found that the three displacement-time histories are fundamentally the same, only with a difference in amplitude. All of these situations indicate that the method reported in this paper is feasible to measure the vibrations of moving vertical ropes.
As shown in Figure 15, we can also find that the vibration equilibrium position of vertical rope is not a fixed point, and relative to the initial equilibrium position, the subsequent equilibrium position also has a certain positive deviation, indicating that vertical rope moved along the positive direction of y axis belonging to the image coordinate system in the process of vertical rope free vibration. The reason for such a situation may be the offset of the head sheaves or non-vertical installation of cage guide.
Experimental validation
As mentioned in the part of “Introduction” section, there is no effective method to measure the vibration displacement of the hoisting vertical rope in movement. Therefore, it is impossible to do a contrastive experiment to verify the proposed vibration measurement method based on edge location directly. However, we can verify the proposed method indirectly by establishing a simulation experiment system and adopting appropriate experimental method. A laser displacement sensor with high accuracy and a high-speed camera were used to conduct a contrastive experiment that could identify the artificial transverse vibration displacement of vertical rope to verify the validity of the proposed method reported in this paper.
Figure 16 shows the simulation experimental system that a laser displacement sensor was fixed to magnetic stand through an iron sheet. There was a suitable distance between the laser displacement sensor and the vertical rope. And the high-speed camera was installed at the right place for video capture.
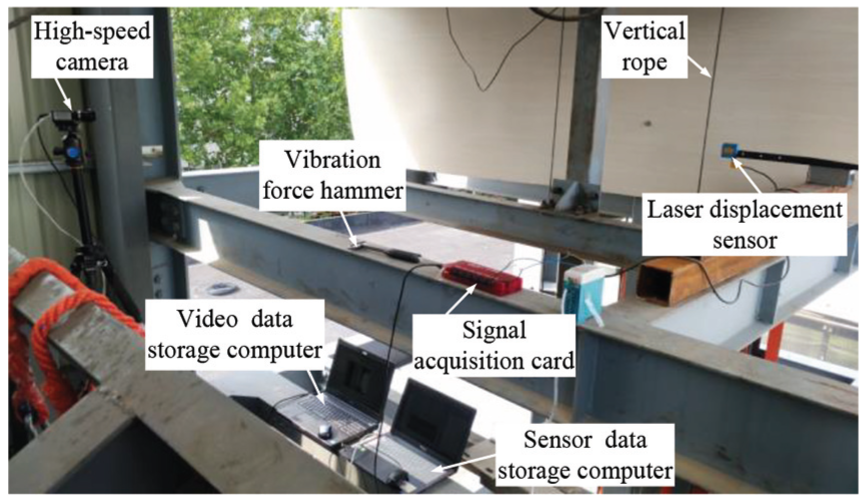
Simulation experimental system.
After installing all the experimental devices, in order to simulate the vibration of vertical rope in one direction, we used the vibration force hammer to knock at the appropriate position of the vertical rope, which was in static state, so that it produced horizontal vibration with a certain largest displacement. In the process of vertical rope vibration, the laser displacement sensor and high-speed camera were utilized to collect the vibration data simultaneously and store them in the computer for calculating the vibration displacement. An original image with a pixel of 1024 × 768 captured by the high-speed camera mentioned previously is shown in Figure 17, and the measured point H is the intersection point of the experimental vertical rope and the laser beam produced by the laser displacement sensor.
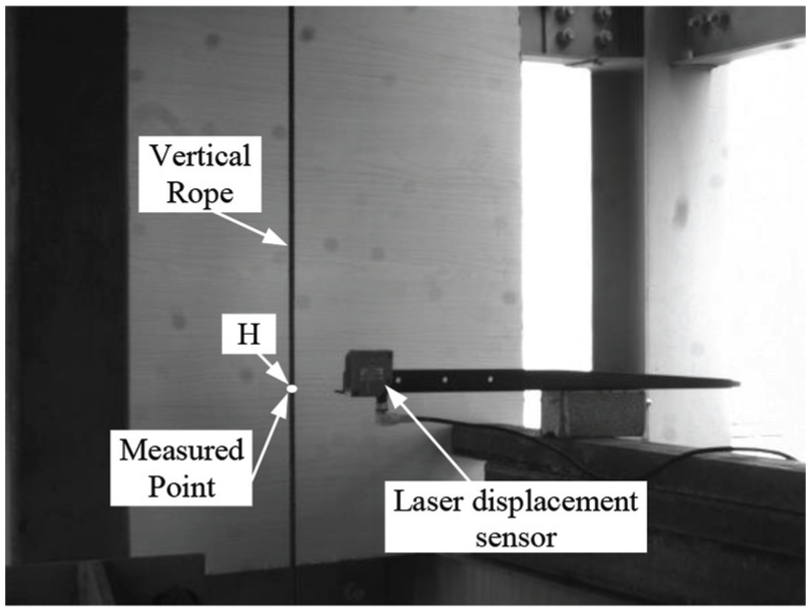
An original image contains experimental vertical rope.
In order to corroborate that the edge location vibration measurement method proposed in this paper is valid and reliable, we measured several different vibrations of the measured point H with different amplitudes. And we found that all of the measurement results from the edge location measurement method were very consistent with those results obtained by the laser displacement sensor. Here, we recorded the measurement results of three different vibration signals, and they were shown in Figure 18(a)–(c), respectively.
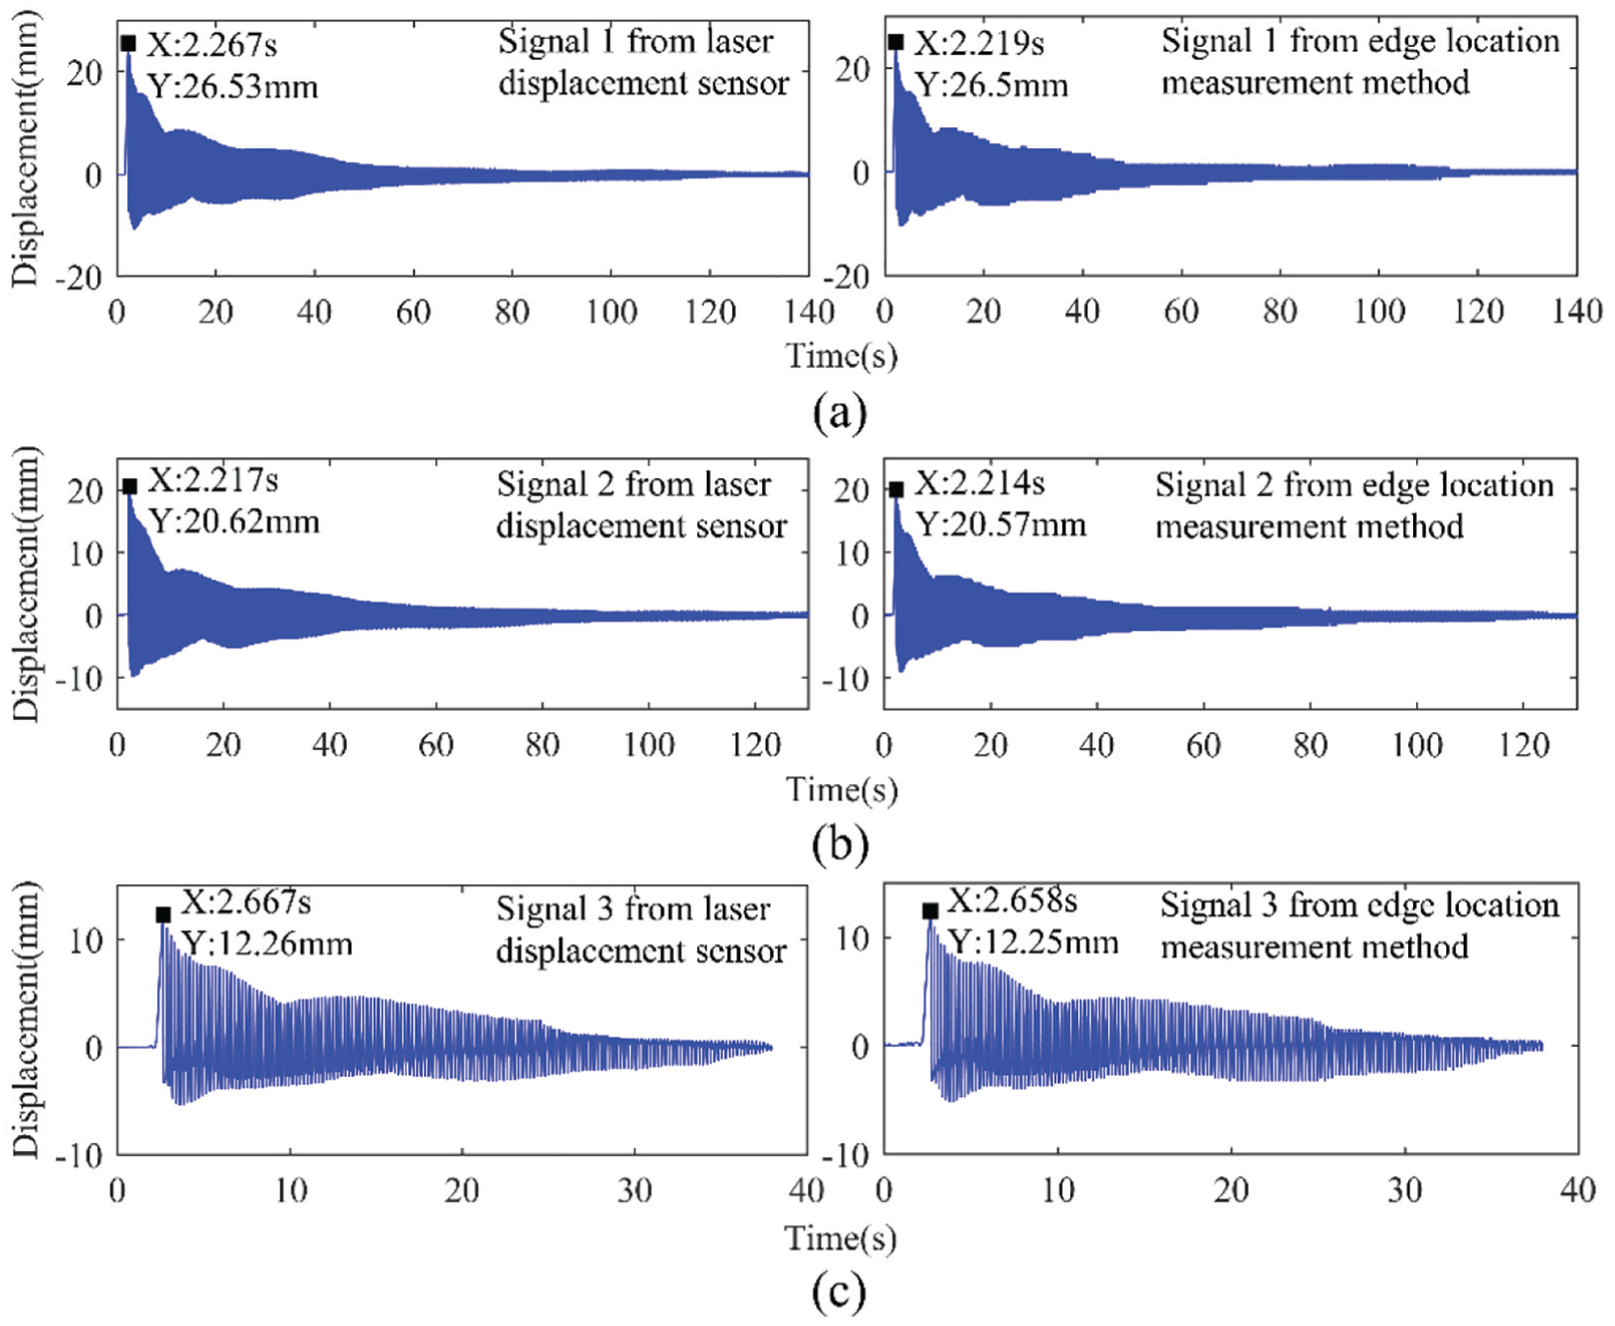
Displacement-time histories of the measured point H with different vibration signals: (a) signal 1, (b) signal 2 and (c) signal 3.
Seen from Figure 18, it can be discovered that the vibration waveforms obtained using the measurement method reported in this paper are very consistent with the vibration waveforms obtained from the laser displacement sensor. It can also be seen that the three maximum vibration amplitudes of the measured point H reach 26.53 mm at 2.267 s, 20.62 mm at 2.217 s and 12.26 mm at 2.667 s, respectively, which were identified by the laser displacement sensor. And their maximum vibration amplitudes identified with the measurement method proposed by us is 26.5 mm at 2.219 s, 20.57 mm at 2.214 s and 12.25 mm at 2.658 s, respectively. Obviously, all of the measurement results from edge location measurement method are almost identical with them identified by the laser displacement sensor.
Then, fast Fourier transformation (FFT) was used to convert each vibration measurement result in the time domain into the frequency domain. The amplitude spectra of the three different vibration signals are shown in Figure 19(a)–(c), respectively.
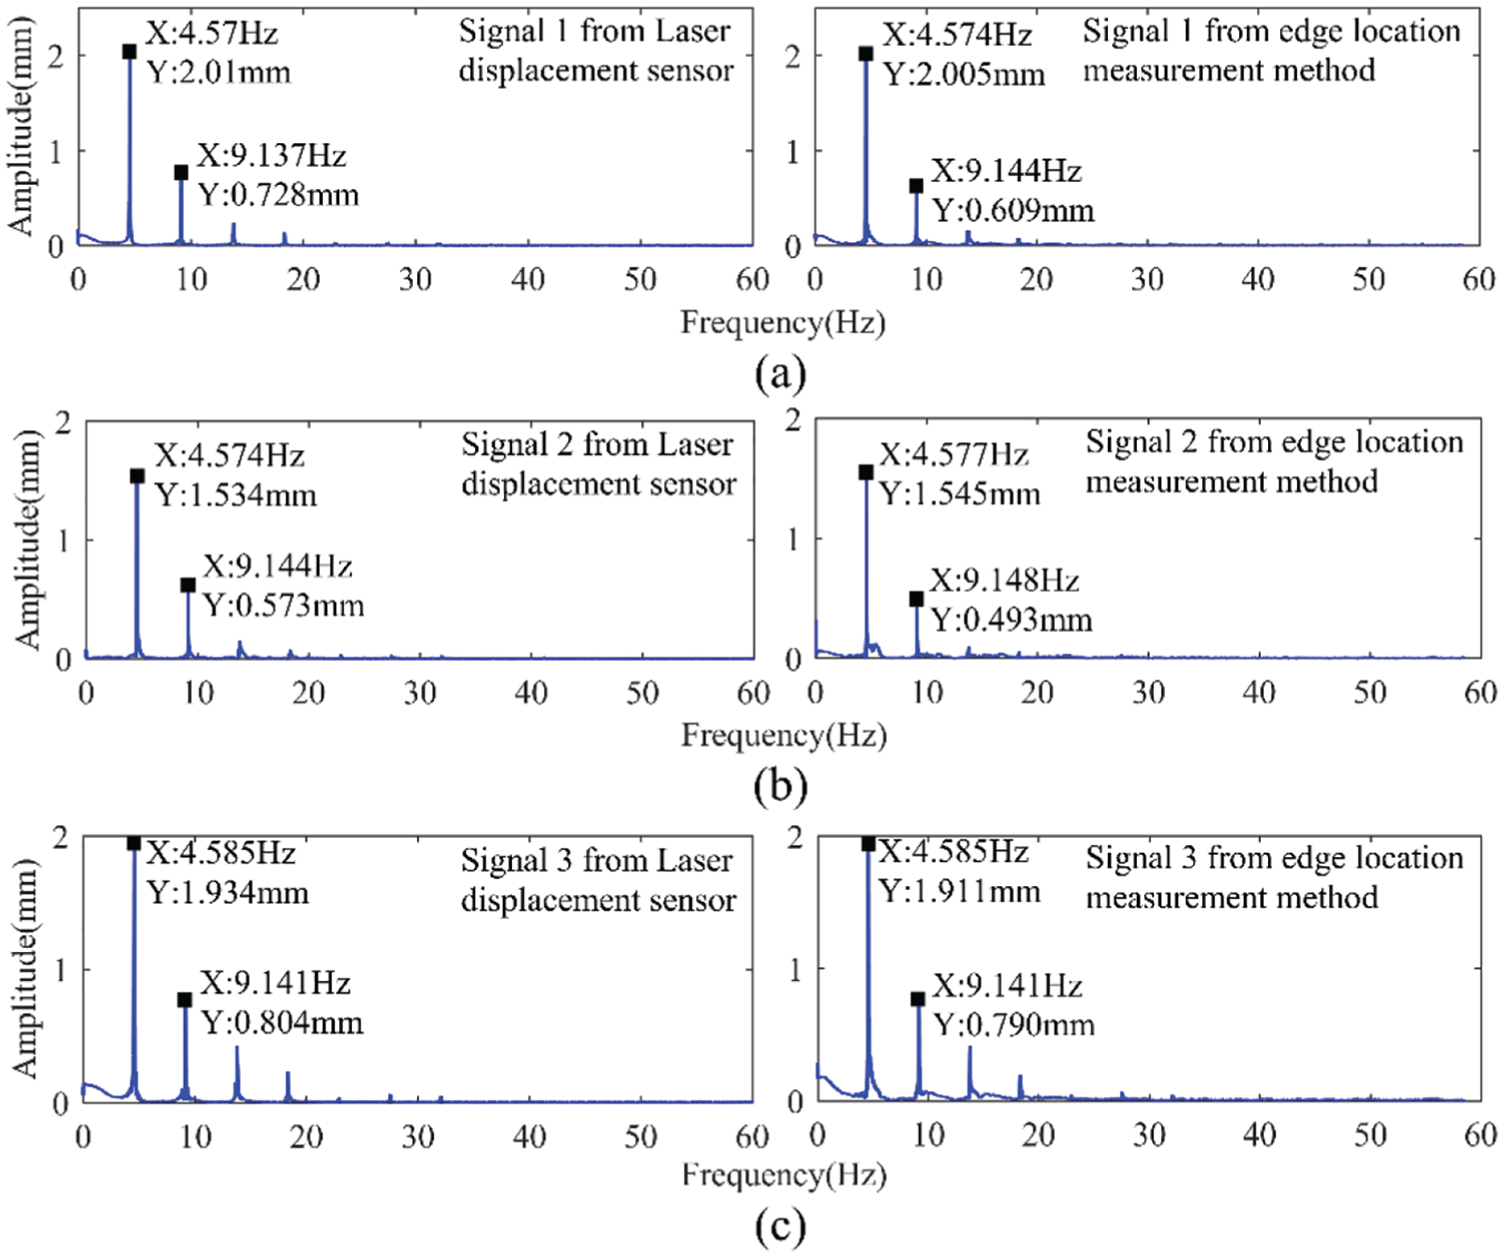
Amplitude spectra of the three vibration signals: (a) signal 1, (b) signal 2 and (c) signal 3.
It can be identified from Figure 19(a) that the first-order vibration frequency and amplitude of the first vibration signal are 4.57 Hz and 2.01 mm, and the second-order vibration frequency and amplitude are 9.137 Hz and 0.728 mm from the laser displacement sensor. And these frequencies and amplitudes are almost equivalent to those frequencies and amplitudes that are 4.574 Hz and 2.005 mm as well as 9.144 Hz and 0.609 mm identified by the edge location measurement method. And at the same time, we can also find from Figure 19(b) and (c) that all of the vibration frequencies and amplitudes of the second and third vibration signals obtained by the edge location measurement method are also very consistent to them from the laser displacement sensor.
The discrepancies between the measurement results on the basis of the edge location method and those obtained by using a laser displacement sensor may result from the low resolution and poor quality of the images. To get better results, it is possible to adopt higher resolution cameras. In addition, inevitable algorithm and calculation errors may also cause these discrepancies. However, the displacement-time histories and amplitude spectra of the three different vibration signals from the two measurement methods are reasonably consistent, which can verify the validity and reliability of the proposed edge location vibration measurement method for different vibrations. So the reported method in this paper can be applied to the actual vibration displacement measurement of hoisting vertical ropes in mine.
Conclusion
A non-contact and unmarked machine vision measurement approach by using edge location algorithm is presented, which makes it possible to measure the transverse vibrations of an interesting point in moving hoisting vertical rope that is a continuum of one-dimensional movement in the operation process of a multi-rope friction hoist. Obviously, it is needless to add surface preparation for distinguishing the measured point from other points on objects with same surface characteristics. And this method solves the problem of interference from a complex background to ropes in mine by constructing background and using background subtraction method to process the original images. In addition, we proposed a new row-column data statistics filtering algorithm to retain the edges of the measured rope and remove the edges of the unmeasured ropes, and optimize the location results of the Hough transformation to eliminate the inner edges of the rope, improving the accuracy of measurement.
A case study in a hoist system already used in practice was performed and an experiment was made in an experiment rig set up by us, which verified that the reported approach is feasible and accurate to measure the transverse vibration displacement of hoisting vertical ropes. In future, a more suitable edge detection algorithm for complex mine environment needs to be studied for improving the edge location of vertical ropes; moreover, it is also necessary to research the multi-vision measurement method to identify the spatial position of vertical ropes. All of these researches can improve the accuracy of vibration measurement. Under the situation that the vibration information of hoisting vertical ropes is obtained, we can get their vibration performance, which provides reliable data support for reliability evaluation of hoist and researching on vibration mechanism and vibration abatement of hoisting vertical rope. In addition, this method is very universal and can also be applied to other flexible structures’ vibration measurement.
Footnotes
Declaration of conflicting interests
The author(s) declared no potential conflicts of interest with respect to the research, authorship, and/or publication of this article.
Funding
This work was supported by the National Natural Science Foundation of China (grant number 51675520 and 51805273) and the Natural Science Foundation of Jiangsu province (grant number BK20170441).