
Abstract
Increased utilization of nonlinear loads and fault event on the power system have resulted in a decline in the quality of power provided to the customers. It is fundamental to recognize and distinguish the power quality disturbances in the distribution system. To recognize and distinguish the power quality disturbances, the development of high protection schemes is required. This paper presents an optimal protection scheme for power quality event prediction and classification in the distribution system. The proposed protection scheme combines the performance of both the salp swarm optimization and artificial neural network. Here, artificial neural network is utilized in two phases with the objective function of prediction and classification of the power quality events. The first phase is utilized for recognizing the healthy or unhealthy condition of the system under various situations. Artificial neural network is utilized to perceive the system signal’s healthy or unhealthy condition under different circumstances. In the second phase, artificial neural network performs the classification of the unhealthy signals to recognize the right power quality event for assurance. In this phase, the artificial neural network learning method is enhanced by utilizing salp swarm optimization based on the minimum error objective function. The proposed method performs an assessment procedure to secure the system and classify the optimal power quality event which occurs in the distribution system. At that point, the proposed work is executed in the MATLAB/Simulink platform and the performance of the proposed system is compared with different existing techniques like Multiple Signal Classification-Artificial Neural Network (MUSIC-ANN), and Genetic Algorithm - Artificial Neural Network (GA-ANN). The comparison results demonstrate the superiority of the SSO-ANN technique and confirm its potential to power quality event prediction and classification.
Keywords
Introduction
Power quality (PQ) is an important factor for electric power utilities and its clients, and thus the exploration on the protection scheme is attracting more attention in the recent years. Voltage sag, swell, interruption, flicker, notch, transients, and harmonics are the types of power line events. These events are the real causes which devalue the quality of electric power in the system. 1 These events may likewise prompt malfunctions, instabilities, reduced lifetime, failure of electrical equipment, and so on. These events are expected to distinguish before the protection move could be made to restrict the PQ events. 2 To decide the sources and reasons for events, the PQ events are recognized and characterized into various kinds which are the significant issue in the protection scheme being investigated. The real requirements in the assurance plot inquire about the capacity to perform programmed PQ monitoring and data analysis. 3 In such a manner, the important role exhibited by the PQ event classification system is feature extraction and classification in which the PQ occasion forecast requires feature extraction from the disturbances. 4 For this reason, spectral analysis using discrete Fourier transform (DFT) and fast Fourier transform (FFT) 5 , 6 has been performed. But, due to the nonstationary nature of the PQ events, such transforms are not powerful in distinguishing the disturbance waveforms. To overcome the drawbacks of both DFT and FFT, wavelet transform (WT) has been broadly utilized, since the WT can dissect the different PQ events at the same time in both time and frequency domains. 7 , 8 Still, it has some drawbacks like excessive computation, sensitivity to noise level and the dependency of its accuracy on the selected wavelet.
In many papers fuzzy rules are utilized to decide the characterization of event.9–11 In such techniques, an extensive number of contributions to the fuzzy system increase the right distinguishing proof rate of the disturbances. In any case, the disadvantage is that it likewise builds the strategy unpredictability and reduces its speed. Be that as it may, no consideration has been paid on the forecast of multiple PQ events. Obviously, different strategies, for example, S-transform, 12 discrete wavelet transform (DWT) and artificial neural network (ANN) with fuzzy logic, 13 Hilbert and Clarke transform, 1 S-transform and TT-transform, 14 multi-wavelet transform–based neural network, 15 S-transform and fuzzy expert system, 16 modified S-transform (MST) and particle swarm optimization, 17 and wavelet packet transform 18 have been introduced for the prediction and classification of PQ events. All the previously mentioned systems can distinguish the PQ occasions; however, it requires a large number of samples and henceforth the unpredictability of the algorithm is sufficient. 19 Increased utilization of nonlinear loads and fault event on the power system have resulted in a decline in the PQ provided to the customers. It is fundamental to recognize and distinguish the power quality disturbances (PQDs) in the distribution system. To recognize and distinguish the PQDs, the development of high protection schemes is required. This paper presents an optimal novel protection scheme for PQ event prediction and classification in the distribution system. The proposed protection scheme combines the performance of both salp swarm optimization (SSO) and ANN. The proposed technique is clearly described in detail. The rest of this article is organized as follows: the recent research work and the background of the research work are discussed in section “Recent research works: a brief review.” Thorough explanation of the proposed technique is explained in sections “The proposed protection scheme for the distribution system from single and multiple PQ events” and “Prediction and classification of PQ events based on ANN.” The suggested technique’s results and the related discussions are given in section “Results and discussion” and the paper is concluded in section “Conclusion.”
Recent research works: a brief review
Various research works on the prediction and classification of PQ in the distribution system utilizing different methods and perspectives have already been reported in the literature. A portion of the works is reviewed here.
Khokhar et al. 20 have proposed a novel approach to deal with optimal feature selection for the classification of PQDs to recognize the PQ events. For optimal feature selection, their approach comprises the DWT and probabilistic neural network–based artificial bee colony (PNN-ABC). The feature was extracted from the disturbances utilizing DWT with multi-resolution analysis (MRA). For the classification of PQDs, the PNN classifier was utilized. DWT-MSD (multi-resolution signal decomposition)–based prediction and classification of 10 classes of all the single PQ events combined with various PQ events has been performed by Puliyadi Kubendran and Loganathan. 12 For extracting the features of different disturbances, the DWT coefficient–based approach for the energy contents in different frequency zones and the coefficients at each level was utilized.
A smart sensor network was proposed by Morales-Velazquez et al. 21 that permits reviewing an electrical installation. It conveys standard estimations and permits inspecting PQD events in detail and interactions between lines, identifying electrical equipment, and correlating events between monitoring points. The proposed smart sensor network, which can conceivably identify disturbances in the system, is capable of assessing an electrical system. A productive classification approach in view of MST and extreme learning machine (ELM) has been recommended by Zhang et al. 22 for classifying PQDs. To enhance the adaptability of the objective function, the estimable parameters were presented in MST which was more helpful to discover the time and frequency resolutions. To identify and arrange control quality unsettling influence in the power system, Kanirajan and Suresh Kumar 23 have presented a novel approach utilizing radial basis function neural network (RBFNN). For the characterization of events, the feature extracted through the wavelet was prepared by an RBFNN.
The improvement of an organized procedure in combination with a mathematical model was introduced by Rodriguez-Guerrero et al., 24 for portraying waveforms that contain synchronous PQDs. It was comprehensive because of the way it can repeat a large number of synchronous PQDs from a single descriptive expression. Ahila et al. 25 have introduced a fast classification strategy called the ELM algorithm for multi-class power system disturbances. With no variation, ELM could perform the multi-category classification. The execution of ELM classifiers was enhanced by the presented approach as well as classification accuracy by recognizing the best subset of accessible features and the method also solves the uncertain model determination issue.
The use of hybrid Fuzzy-Flower Pollination Algorithm (FFPA) for performance enhancement of a radial distribution system (RDS) was proposed by Mariaraja et al. 26 Under normal and abnormal working conditions, to actualize an algorithm for the distribution system reconfiguration use was the main objective of this work. For a continuously stirred tank reactor and pH neutralization process, the double-layered nonlinear model predictive control method was proposed by Cai et al. 27 The nonlinear systems can be described as a Hammerstein–Wiener model. Mouzakitis 28 have reviewed the existing fault diagnosis methods and their main benefits. In three main categories, namely, model-based, hardware-based, and history-based fault diagnoses, the fault diagnosis classification was investigated.
Background of the research work
A review of the recent research work shows that the quality of electrical power is an important contributing factor in the distribution system and this can be achieved through continuous PQ monitoring which helps to detect, record, and prevent PQ problems. However, the power line disturbances such as voltage sag, swell, harmonic distortion, notch, flicker, and transients are some of the most influencing PQ problems in the distribution system. Voltage swell and sag occur due to electrical drives starting, nearby circuit faults, or accidents. Use of nonlinear loads, arc furnaces, capacitor switching, and lightning strikes are also the causes of PQDs. These disturbances result in malfunctions, reduced lifetime, and failure of electrical equipment. However, there have been many techniques implemented for the detection and classification of the PQ events such as Fourier transform, S-transform, Hilbert–Huang transform, and WT. Fourier transform has been applied for detecting feature extraction, but due to the nonstationary nature of the PQDs such transforms are not effective in detecting the disturbance waveforms. WT has the capability of extracting features from the signal in both time and frequency domains simultaneously. But it exhibits limitations like excessive computation, sensitivity to noise level, and less accuracy. Although the above techniques are used for detecting the PQDs, the complexity of the algorithm is very high due to an increased number of samples required. To overcome these challenges, optimal detection using advanced technology is required. In related works, few control techniques are presented to solve the PQ problem; the above-mentioned limitations have motivated us to do this research work.
The proposed protection scheme for the distribution system from single and multiple PQ events
Figure 1 displays the proposed protection scheme of PQ event prediction and classification in the distribution system. In the proposed structure, the input power signal from the distribution system is dissected for prediction. At first, in the preprocessing phase, the normalization and segmentation processes are completed in light of the single- or three-phase event data. The recognized data are passed to the feature extraction stage which distinguishes the distinctive features of an event signal. In this phase, ANN is utilized for the prediction of PQ events in view of the extracted features. Here, single and multiple PQ events are recognized based on the cross correlation function (XCF). The recognized PQ events are dissected in the second phase of ANN for classification. Here, the amplitude demodulation has been utilized to recognize the envelope of single and multiple PQ events. The modulating signal may have high-frequency segments; hence, to identify those high-frequency segments, SSO calculation is used.
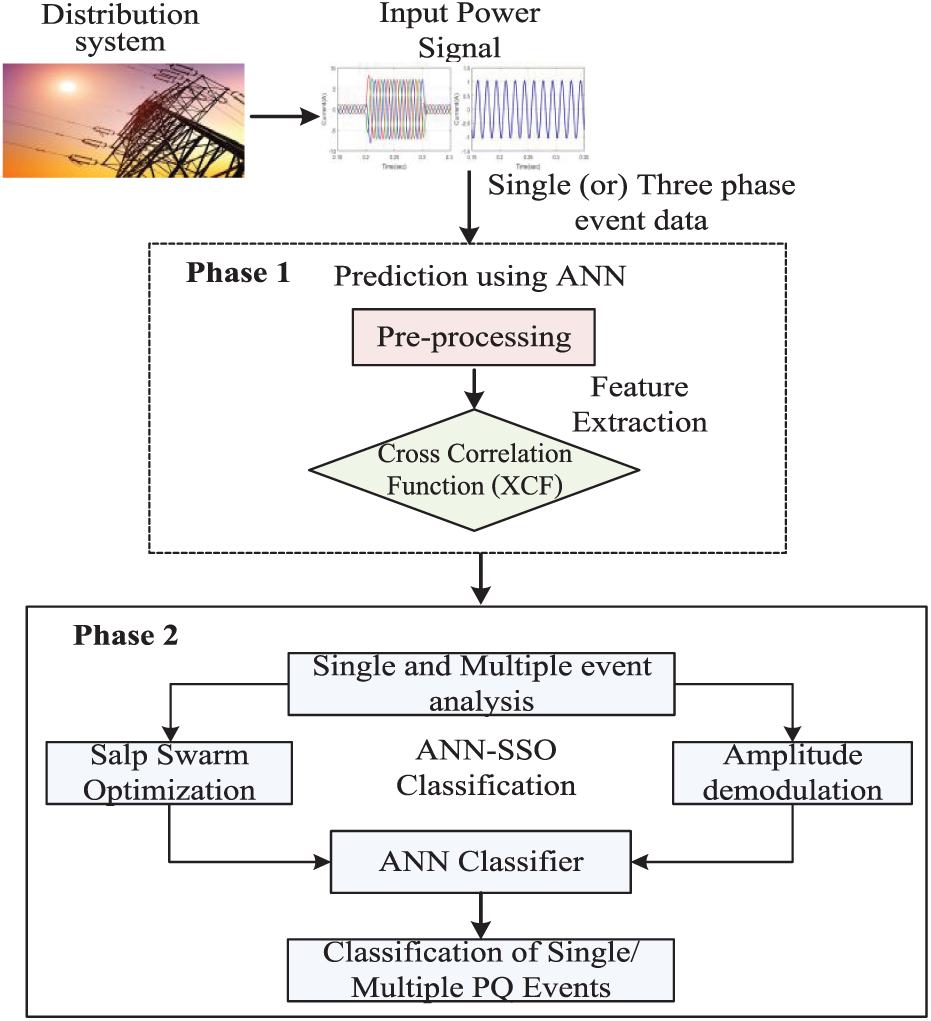
The proposed protection scheme for single and multiple PQ events.
Generation of single and multiple PQ events
In the distribution system, the PQ events can be considered as single and multiple PQ events. 9 , 19 , 29 The single PQ event implies a single sort of PQ event in the modulated signal such as sag, swell, harmonics, notch, and noise. These events are mainly caused because of automatic separation of load, tripping of protection devices, insulation failure, lightning, and insulator flashover. Then again multiple PQ events imply more than one type of PQ event such as sag with harmonics, swell with harmonics, sag with transient, and swell with harmonics. These events are caused due to the nonlinear loads, oscillations, additional energy losses, and overheating. Some unsafe impacts of poor PQ events are overheating of lines, untimely maturing of equipment and appliances, mal-activity of protective equipment, motor disappointments, mistaken metering, and interference with communication circuits. These are the events created in the distribution system. To detect and classify the PQ events, the proposed algorithm has been tested in real time to demonstrate its superiority. The prediction and classification analysis of PQ events by the proposed technique is depicted in detail in the accompanying section.
Prediction and classification of PQ events based on ANN
In the proposed approach, ANN is utilized in two phases with the objective of prediction and classification of the PQ events. In phase 1, the ordinary ANN is used to perceive the system signal’s healthy or unhealthy condition under different situations. In phase 2, the ANN performs the classification of the unhealthy signals to recognize the optimal PQ event for protection. In this phase, the ANN learning procedure is enhanced by utilizing the SSO algorithm from the perspective of the minimum error objective function. The proposed protection scheme performs an assessment procedure to secure the system and classify the optimal PQ event which occurs in the distribution system.
Phase 1: ANN prediction
In the prediction phase, the power signal information is preprocessed which includes normalization and segmentation of single- or three-phase PQDs. In the normalization process, all the PQ event data at various voltage levels are scaled to the per unit (p.u.) values by isolating the instant voltage values during the event with the maximum voltage value. The segmentation process is performed to improve the classification accuracy of the proposed system. In the segmentation process, the three-phase PQ events are isolated into three single-phase PQ events at first. At that point, the section of the event signal is extracted at the beginning of the event. The distinguished data are passed to the feature extraction stage which recognizes the different features of an event signal. Here, the feature is extracted from the ANN based on the XCF.
Modeling of ANN
The feedforward NN is natural for its learning and recognizing capacity, which comprises an interconnected gathering of artificial neurons.30–32 It is trained to provide a specific capacity by changing the estimations of connections (weights and biases) between the neurons of various layers. The ANN utilized as a part of this work comprises the input layer, hidden layer, and the output layer. The input layer has nodes which represent the normalized features extracted from the calculated event signals. In the hidden layer and the output layer, the activation functions of sigmoid are utilized. The objective estimations of two output nodes can have the binary levels representing “Healthy” (H) and “Faulty” (F) conditions. Here, the ANN is constructed, composed, and executed by utilizing the MATLAB/Simulink platform. The ANN is trained iteratively by limiting the execution capacity of mean square error (MSE) between the network output and the corresponding target values. The MSE work is expressed as
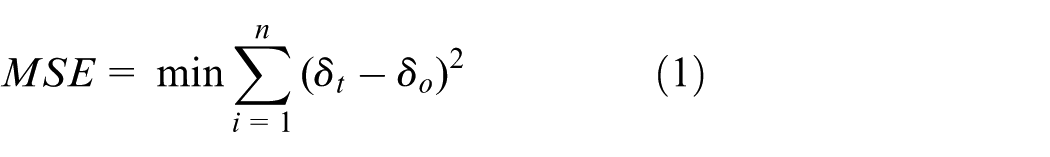
where
Phase 2: ANN-SSO classification
The aim of designing phase 2 is to recognize the single and multiple PQ events in the distribution system. To accomplish this point, XCF is utilized to quantify the degree of similarity between two power signals. The type of PQ events has been distinguished in light of the threshold value. The present threshold value of XCF coefficient has been defined. This correlation chooses and determines whether the modulated signal at input contains a single or multiple PQ events. Keeping in mind the end goal to classify the correct PQ event, the investigation is completed between the single and multiple events. To identify the single and multiple PQ events, the amplitude demodulation is utilized. There might be a shot of high-frequency components in the modulated signal. To distinguish these segments, the ANN second phase has been executed with demodulation techniques. In the ANN second phase, the SSO algorithm is utilized to upgrade the learning procedure of ANN from the perspective of the minimum error objective function. The SSO algorithm finds the high-frequency components in the modulated signals. Finally, the identified events can be ordered by utilizing the ANN classifier which classifies the single and multiple PQ events introduced in the modulated signal.
SSO for accurate classification
The SSO is a novel algorithm for solving single- and multi-objective optimization issue proposed by Mirjalili et al. 33 and El-Fergany. 34 The main inspiration of SSO is the swarming behavior of slaps when navigating and foraging in oceans. The SSO has an adaptive mechanism to reject from restraining out into a nearby minima or maxima. Amid the optimization process, SSO finally produces an exact optimal or even close to optimal arrangement. At the beginning of the optimization process, the SSO investigates the search space and after that exploits it to keep up the harmony between exploration and exploitation.
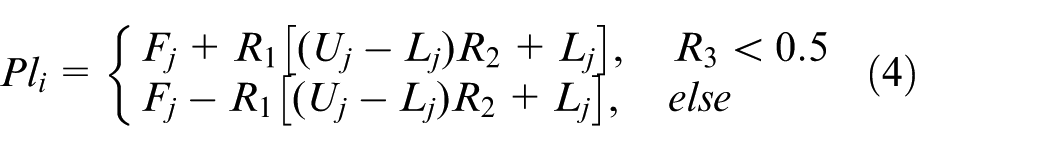
Step 1—Initialization. In the first step of SSO, the positions of the salps are randomly initialized similar to other optimization techniques which is expressed as

where
Step 2—Evaluation. In this step, the objective function is evaluated based on calculating the accuracy of each classification. The accuracy is calculated as
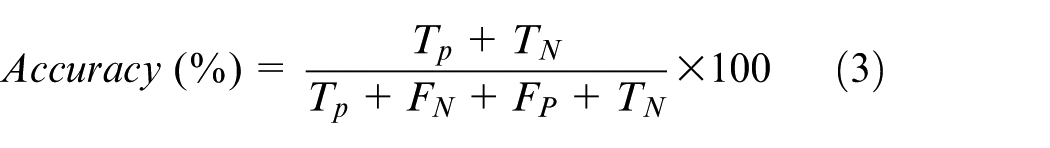
where
Step 3—Updating leader position. The position of the leader salps is updated with respect to the food source based on the accompanying formula
Step 4—Exploration and exploitation. The most effective parameter in the SSO algorithm is the initial random number which makes the exploration and exploitation phases in the balanced state and is expressed as
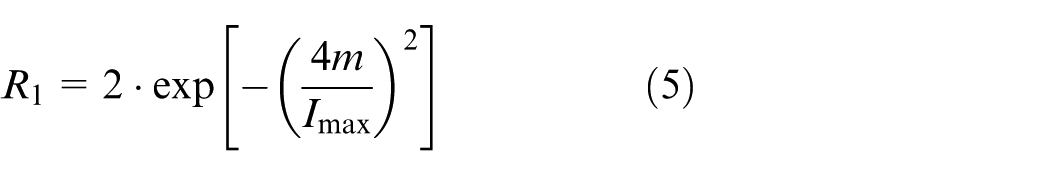
where m represents the current iteration and
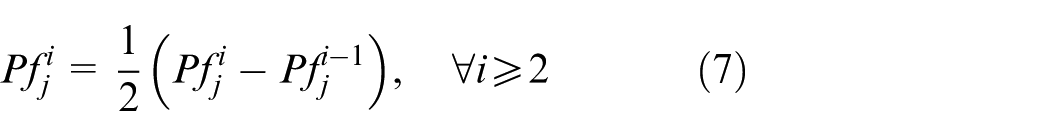
Step 5—Updating follower position. The positions of the follower salps are updated based on Newton’s law of motion which is revealed as
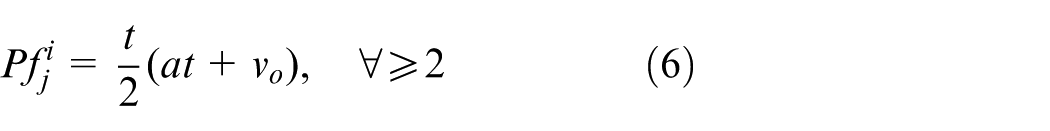
where
From the above conditions, it is observed that the number of search salps and maximum iteration number are expected to tune the features of the SSO algorithm. The general procedure of the SSO algorithm is shown as a flowchart in Figure 2.
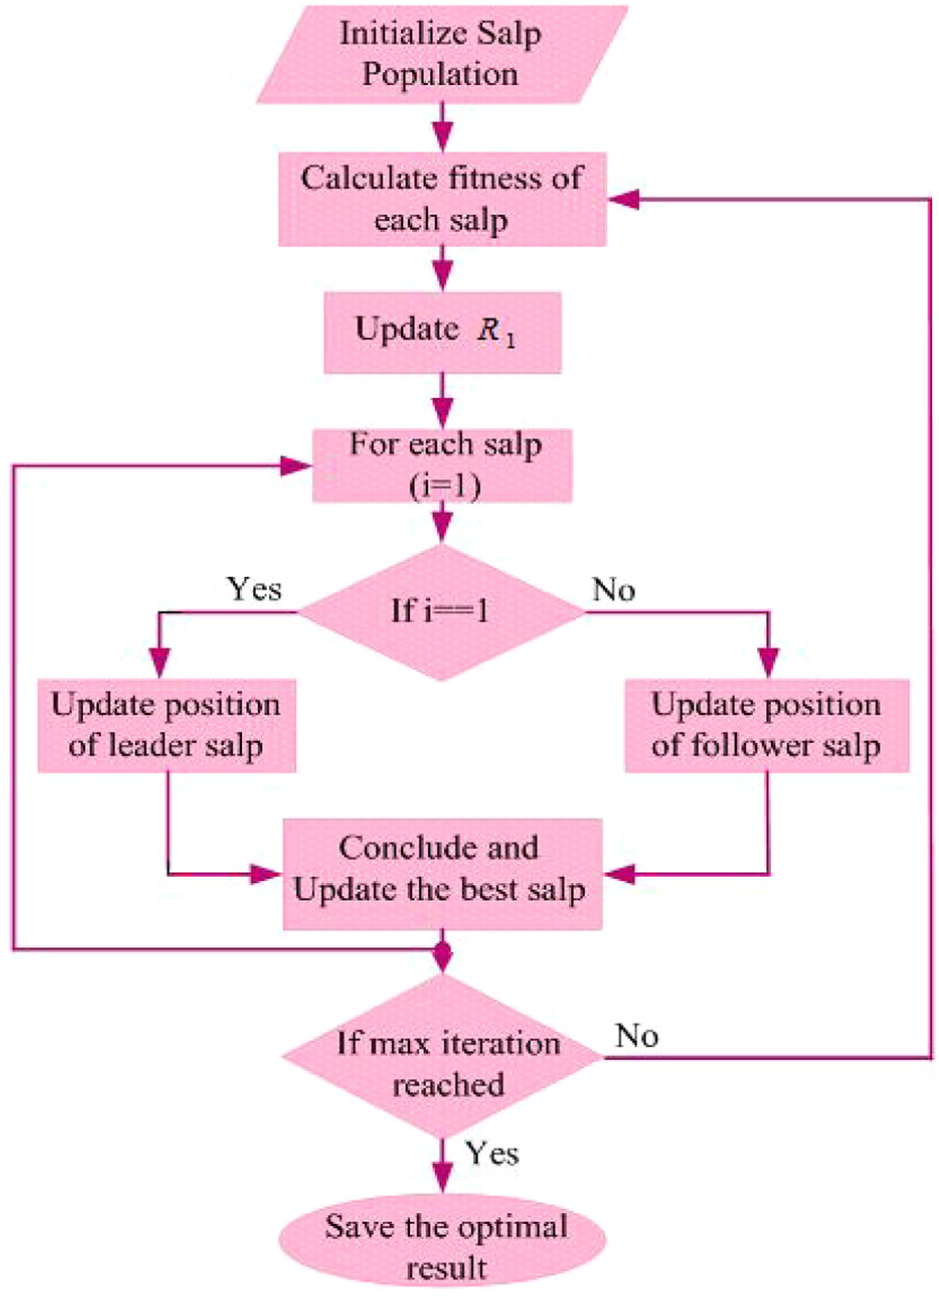
Flowchart of the SSO algorithm.
Results and discussion
In this paper, the proposed strategy is presented for the prediction and classification of single and multiple PQ events in the distribution system. The proposed methodology is actualized in the MATLAB/Simulink working stage. The PQ event is analyzed in both the single- and three-phase distribution lines and the event data are gathered. Two test cases of single and three phases are utilized with the goal that the execution of the proposed procedure is illustrated. Here, the proposed technique detects and classifies the PQ events in light of the XCF of the power signal. The XCF distinguishes the power signal in light of the threshold value. 19 The threshold values of XCFs are shown in Table 1.
Threshold values of XCFs.
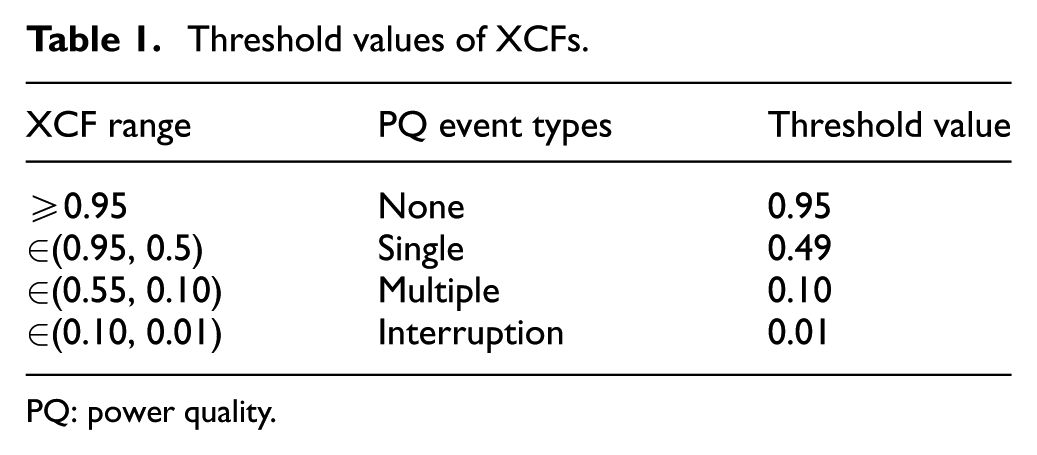
PQ: power quality.
In case the threshold value is equal to 0.95 and the XCF is more than or equal to 0.95, there is no event predicted in the cycle. Here, the XCF is ascertained for the specific cycle and the event is considered as single or multiple events. In case the estimation of XCF is more than 0.5, it is considered as a single event and examined. Correspondingly, if the estimation of XCF lies in the range of 0.1–0.5, the cycle has been distinguished as a multiple PQ event. In addition, if any estimation of XCF is in the range between 0.1 and 0.01, the cycle has been classified as an interruption, and if the estimation of cycle is under 0.01, at that point the cycle has been considered as an outage PQ event. The proposed technique is mainly employed here to recognize the correct PQ events, that is, whether it is sag, swell, or sag with swell that is present in the power signal.
Test case 1
In this test case, the single and multiple events of the single-phase distribution system are analyzed. The single events of the single-phase current and voltage are analyzed and delineated in Figure 3. The performance comparison between the 10% sag current and voltage is depicted in Figure 3(a). Here, the sag condition occurred in the time intervals of 0.15–0.2 s and 0.3–0.35 s. Likewise, in the voltage waveform, the sag occurred in the time interval of 0.2–0.3 s. After this time, the voltage goes to the typical position with no sag condition. The comparison between harmonic current and voltage is analyzed as shown in Figure 3(b). Here, the harmonic state of current extends from 0 to 0.03 s. Likewise, the harmonic condition of voltage ranges from 0 to 0.02 s. After the disappearance of harmonics, the system goes to a typical operating condition. The comparison between sag current and voltage is analyzed as shown in Figure 3(c). At the point when the system begins at heavy loads, the sag condition of current effects from 0.15 to 0.2 s and 0.3 to 0.35 s. Likewise, in the voltage waveform, because of the heavy loads, the sag condition of voltage influences from 0.2 to 0.25 s. The comparison demonstrates that the swell current and swell voltage are depicted in Figure 3(d). Because of the short circuit in the system, the swell state of current effects from 0.2 to 0.3 s. Likewise, the swell state of voltage fluctuates from 0.15 to 0.2 s and 0.3 to 0.35 s.
Single-event analysis of the single-phase system: (a) 10% sag current and voltage; (b) harmonic current and voltage; (c) sag current and voltage; and (d) swell current and voltage.
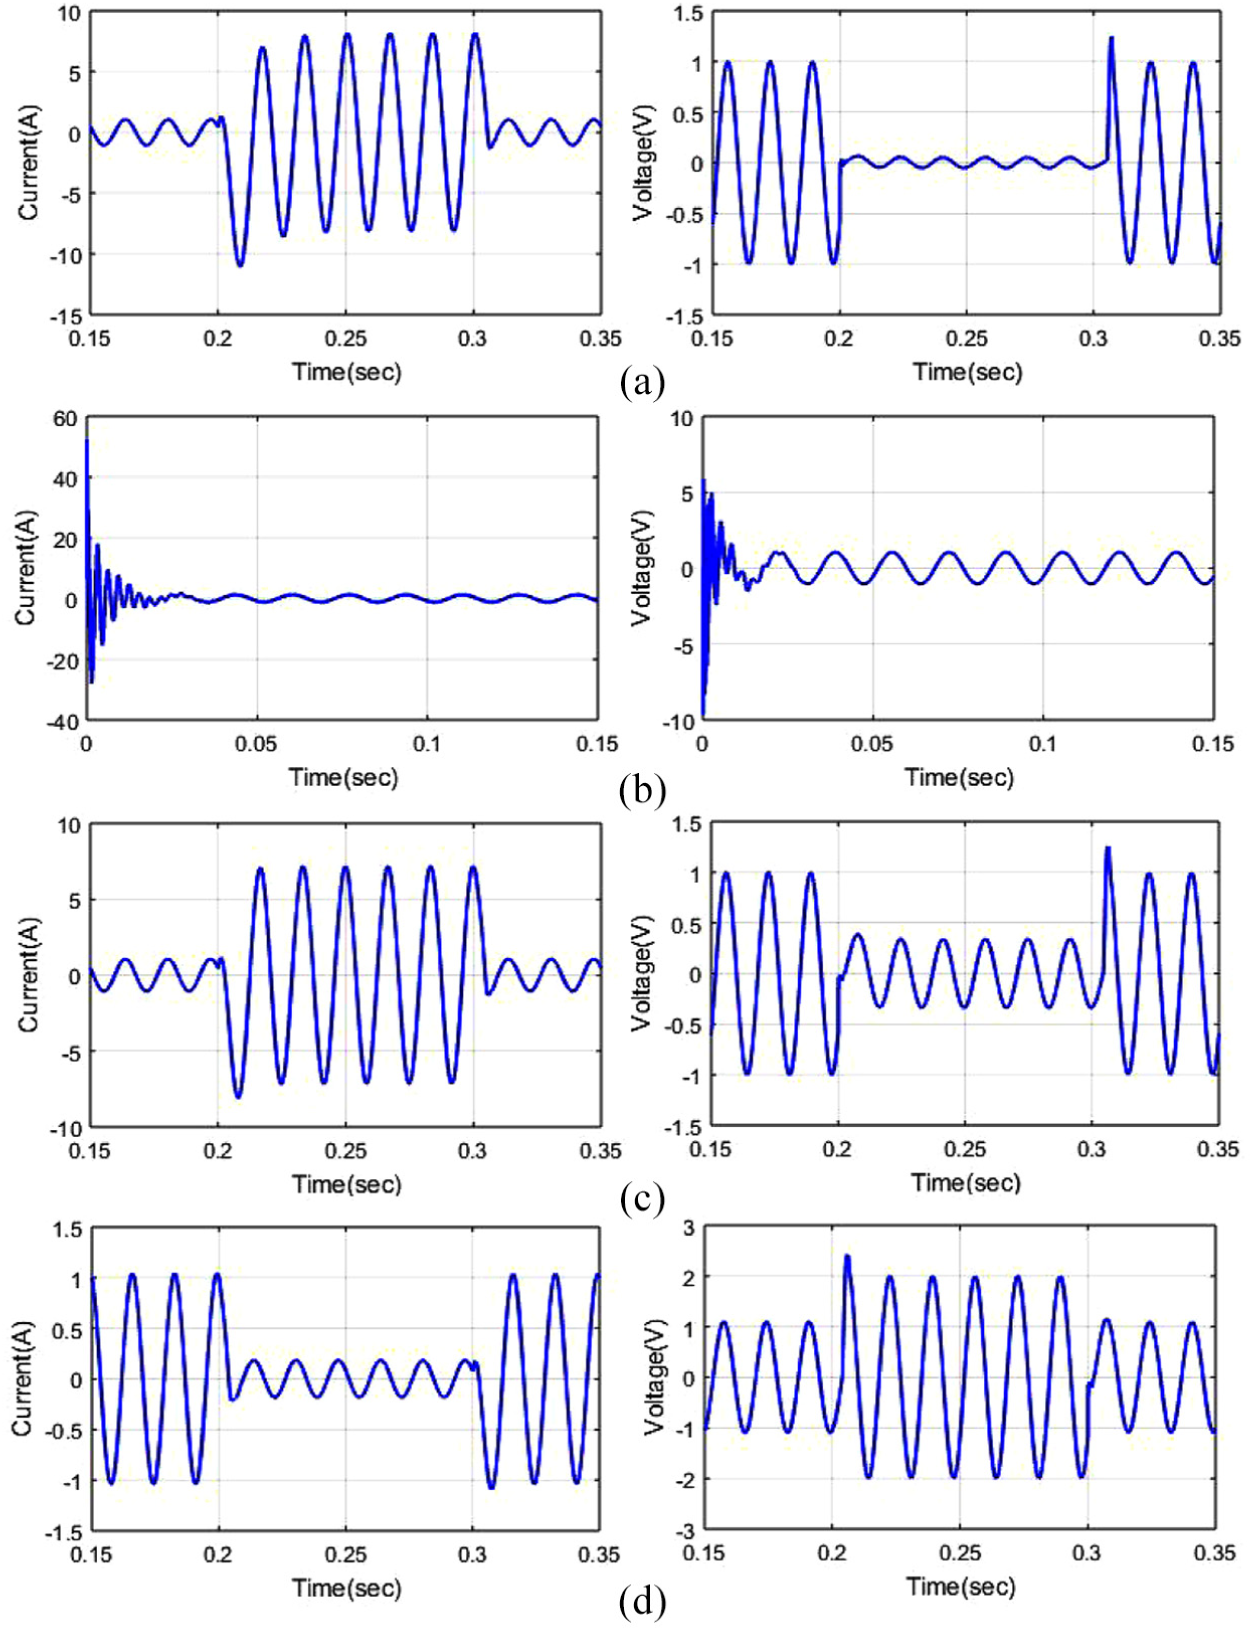
The multiple events of the single-phase current and voltage are analyzed as shown in Figure 4. The comparison between the 10% sag-harmonic current and voltage is depicted in Figure 4(a). Here, the sag-harmonic current showed up in the time intervals of 0.15–0.2 s and 0.3–0.35 s. Furthermore, the sag-harmonic voltage is depicted in the time interval of 0.2–0.35 s. Figure 4(b) demonstrates the comparison between the 90% sag-harmonic current and voltage. The 90% sag-harmonic current differs from 0.15 to 0.2 s and 0.3 to 0.35 s and 90% sag-harmonic voltage ranges from 0.2 to 0.35 s. The comparison between the sag-harmonic current and voltage is depicted in Figure 4(c). Here, the sag-harmonic current extends from 0.15 to 0.2 s and 0.3 to 0.35 s. In addition, the sag-harmonic voltage shifts from 0.2 to 0.35 s.
Multiple-event analysis of the single-phase system: (a) 10% sag-harmonic current and voltage; (b) 90% sag-harmonic current and voltage; (c) sag-harmonic current and voltage; (d) swell-harmonic current and voltage; and (e) swell-transient current and voltage.
The comparison between the swell-harmonic current and voltage is depicted in Figure 4(d). Here, the present waveform begins in an ordinary condition. After the sudden load diminishes, there is a disturbance in the waveform ranging from 0.2 to 0.3 s. In addition, the voltage waveform gets disturbed in the scope of 0.15–0.25 s and 0.3–0.35 s. The comparison between the swell-transient current and voltage is shown in Figure 4(e). Here, the current waveform changes from 0.2 to 0.3 s. In addition, the voltage waveform ranges from 0.15 to 0.25 s and 0.3 to 0.35 s.
Test case 2
In this test case, the single and multiple events of the three-phase distribution system are dissected and assessed. The single events of the three-phase current and voltage are investigated and shown in Figure 5.
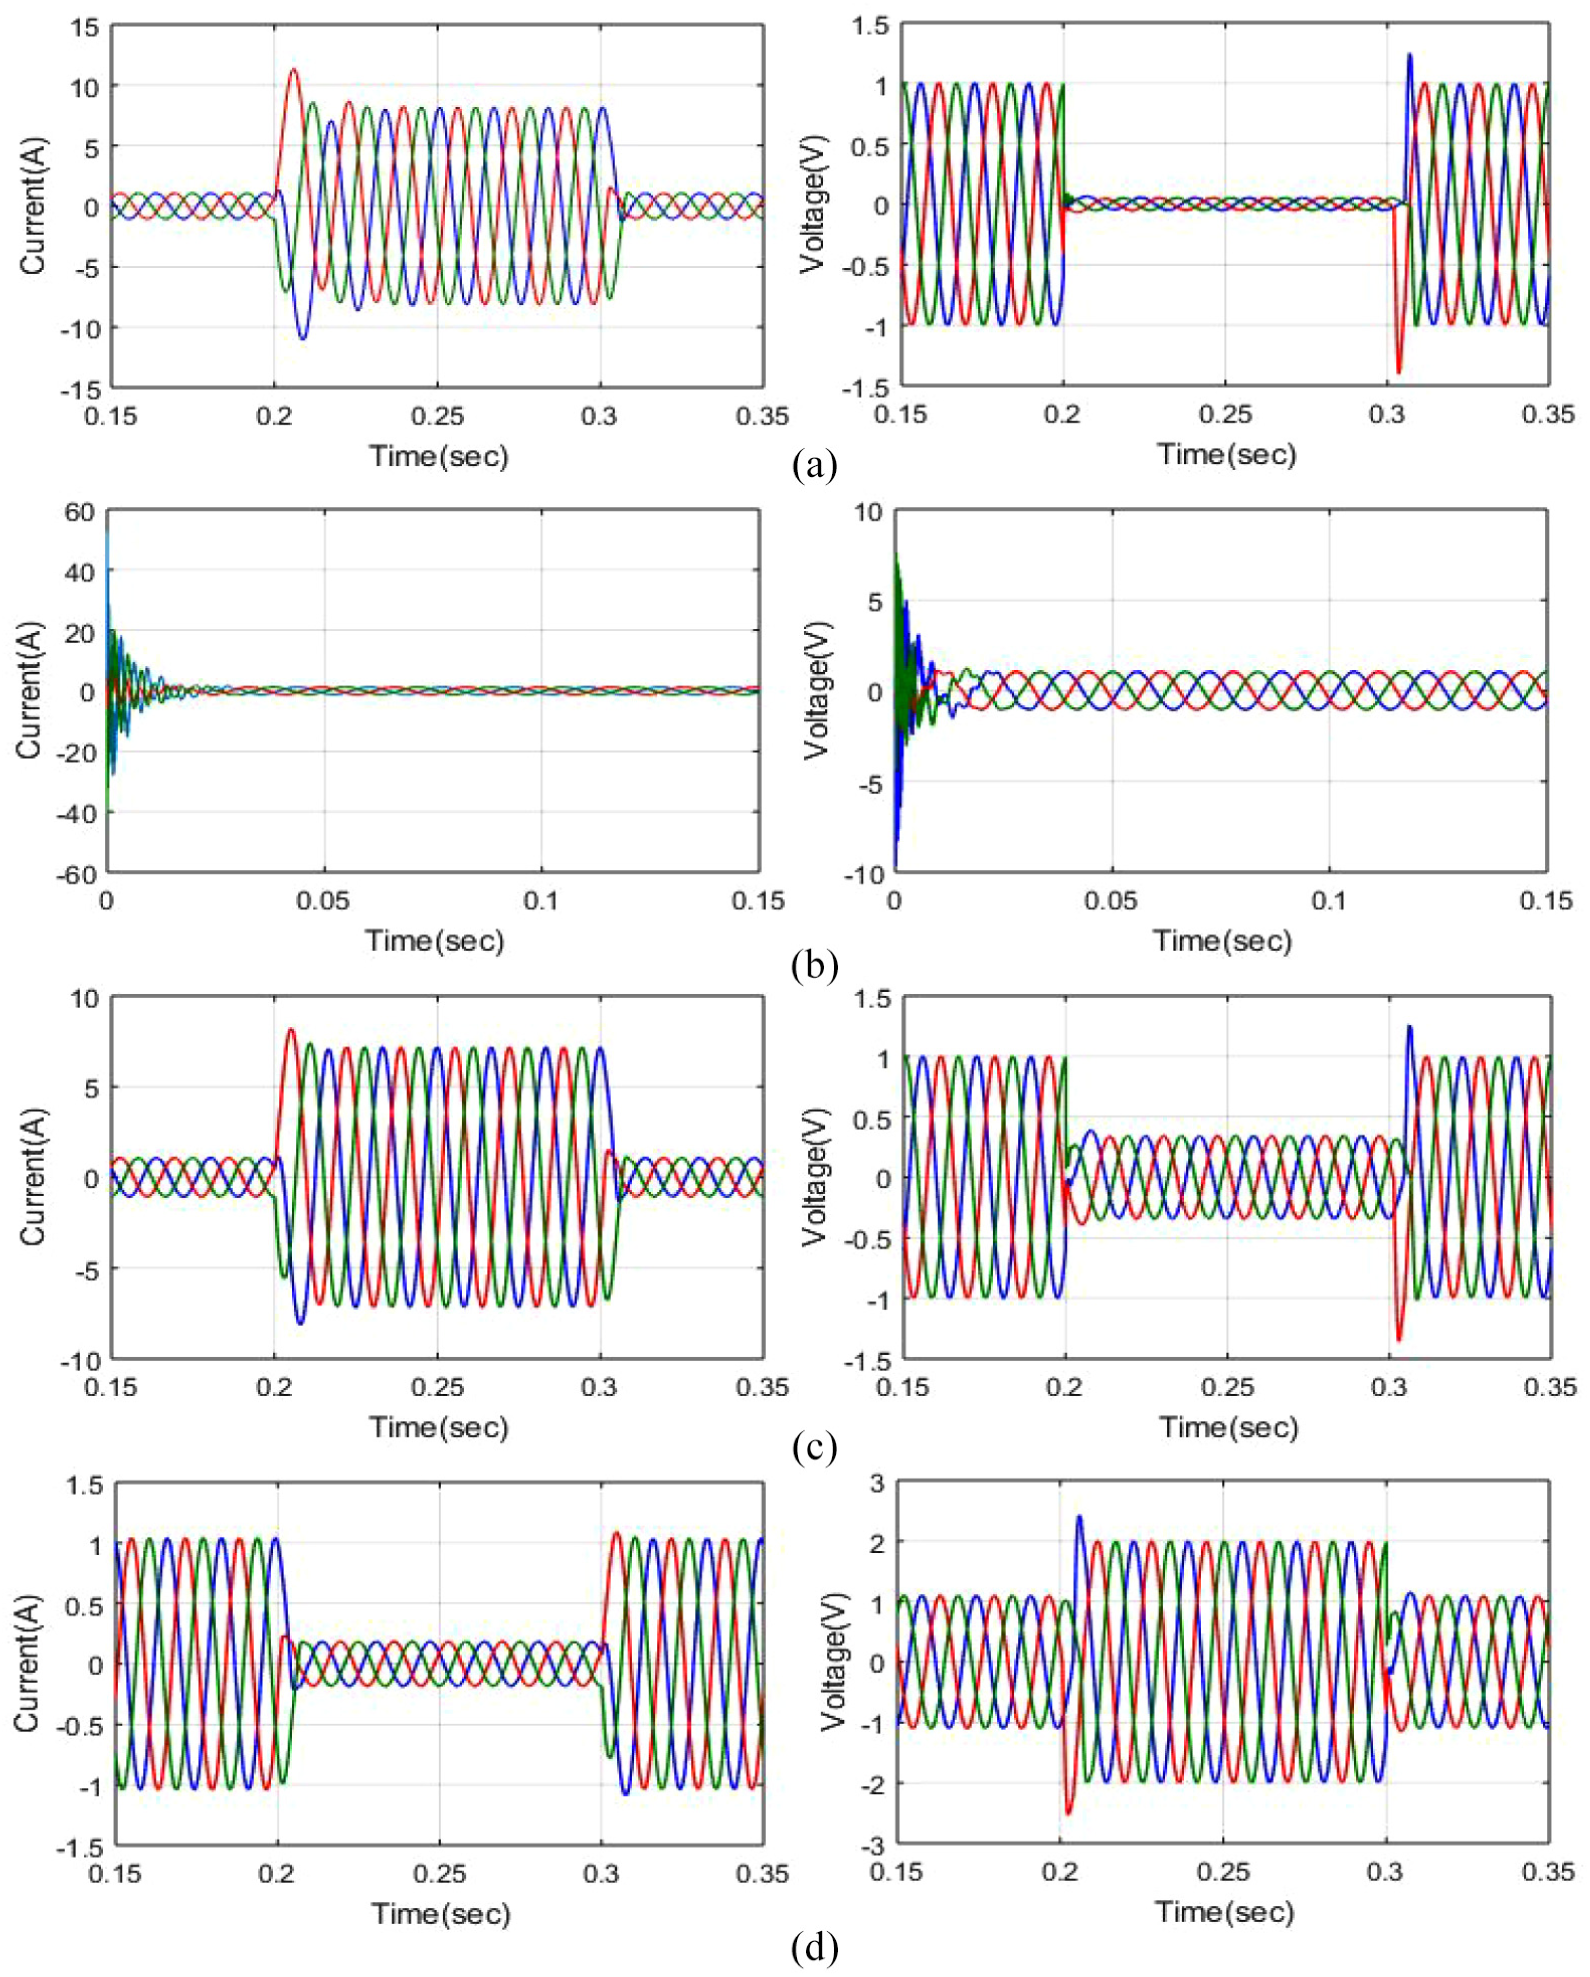
Single-event analysis of the three-phase system: (a) 10% sag current and voltage; (b) harmonic current and voltage; (c) sag current and voltage; and (d) swell current and voltage.
The comparison between the 10% sag current and voltage is depicted in Figure 5(a). Here, the current waveform shifts from 0.15 to 0.22 s and 0.3 to 0.35 s. In addition, the voltage waveform ranges from 0.2 to 0.32 s. The performance comparison between the harmonic current and voltage is depicted in Figure 5(b). Here, the current waveform shifts from 0.01 to 0.15 s. Likewise, the voltage waveform shifts from 0.02 to 0.15 s. The performance comparison between the sag current and voltage is depicted in Figure 5(c). Here, the sag condition for the current waveform ranges from 0.15 to 0.2 s and 0.3 to 0.35 s, and the sag condition for the voltage waveform ranges from 0.2 to 0.31 s. The performance comparison between the swell current and voltage is depicted in Figure 5(d). Here, the swell condition for the current waveform changes from 0.2 to 0.3 s. In addition, the voltage waveform shifts from 0.15 to 0.2 s and 0.3 to 0.35 s.
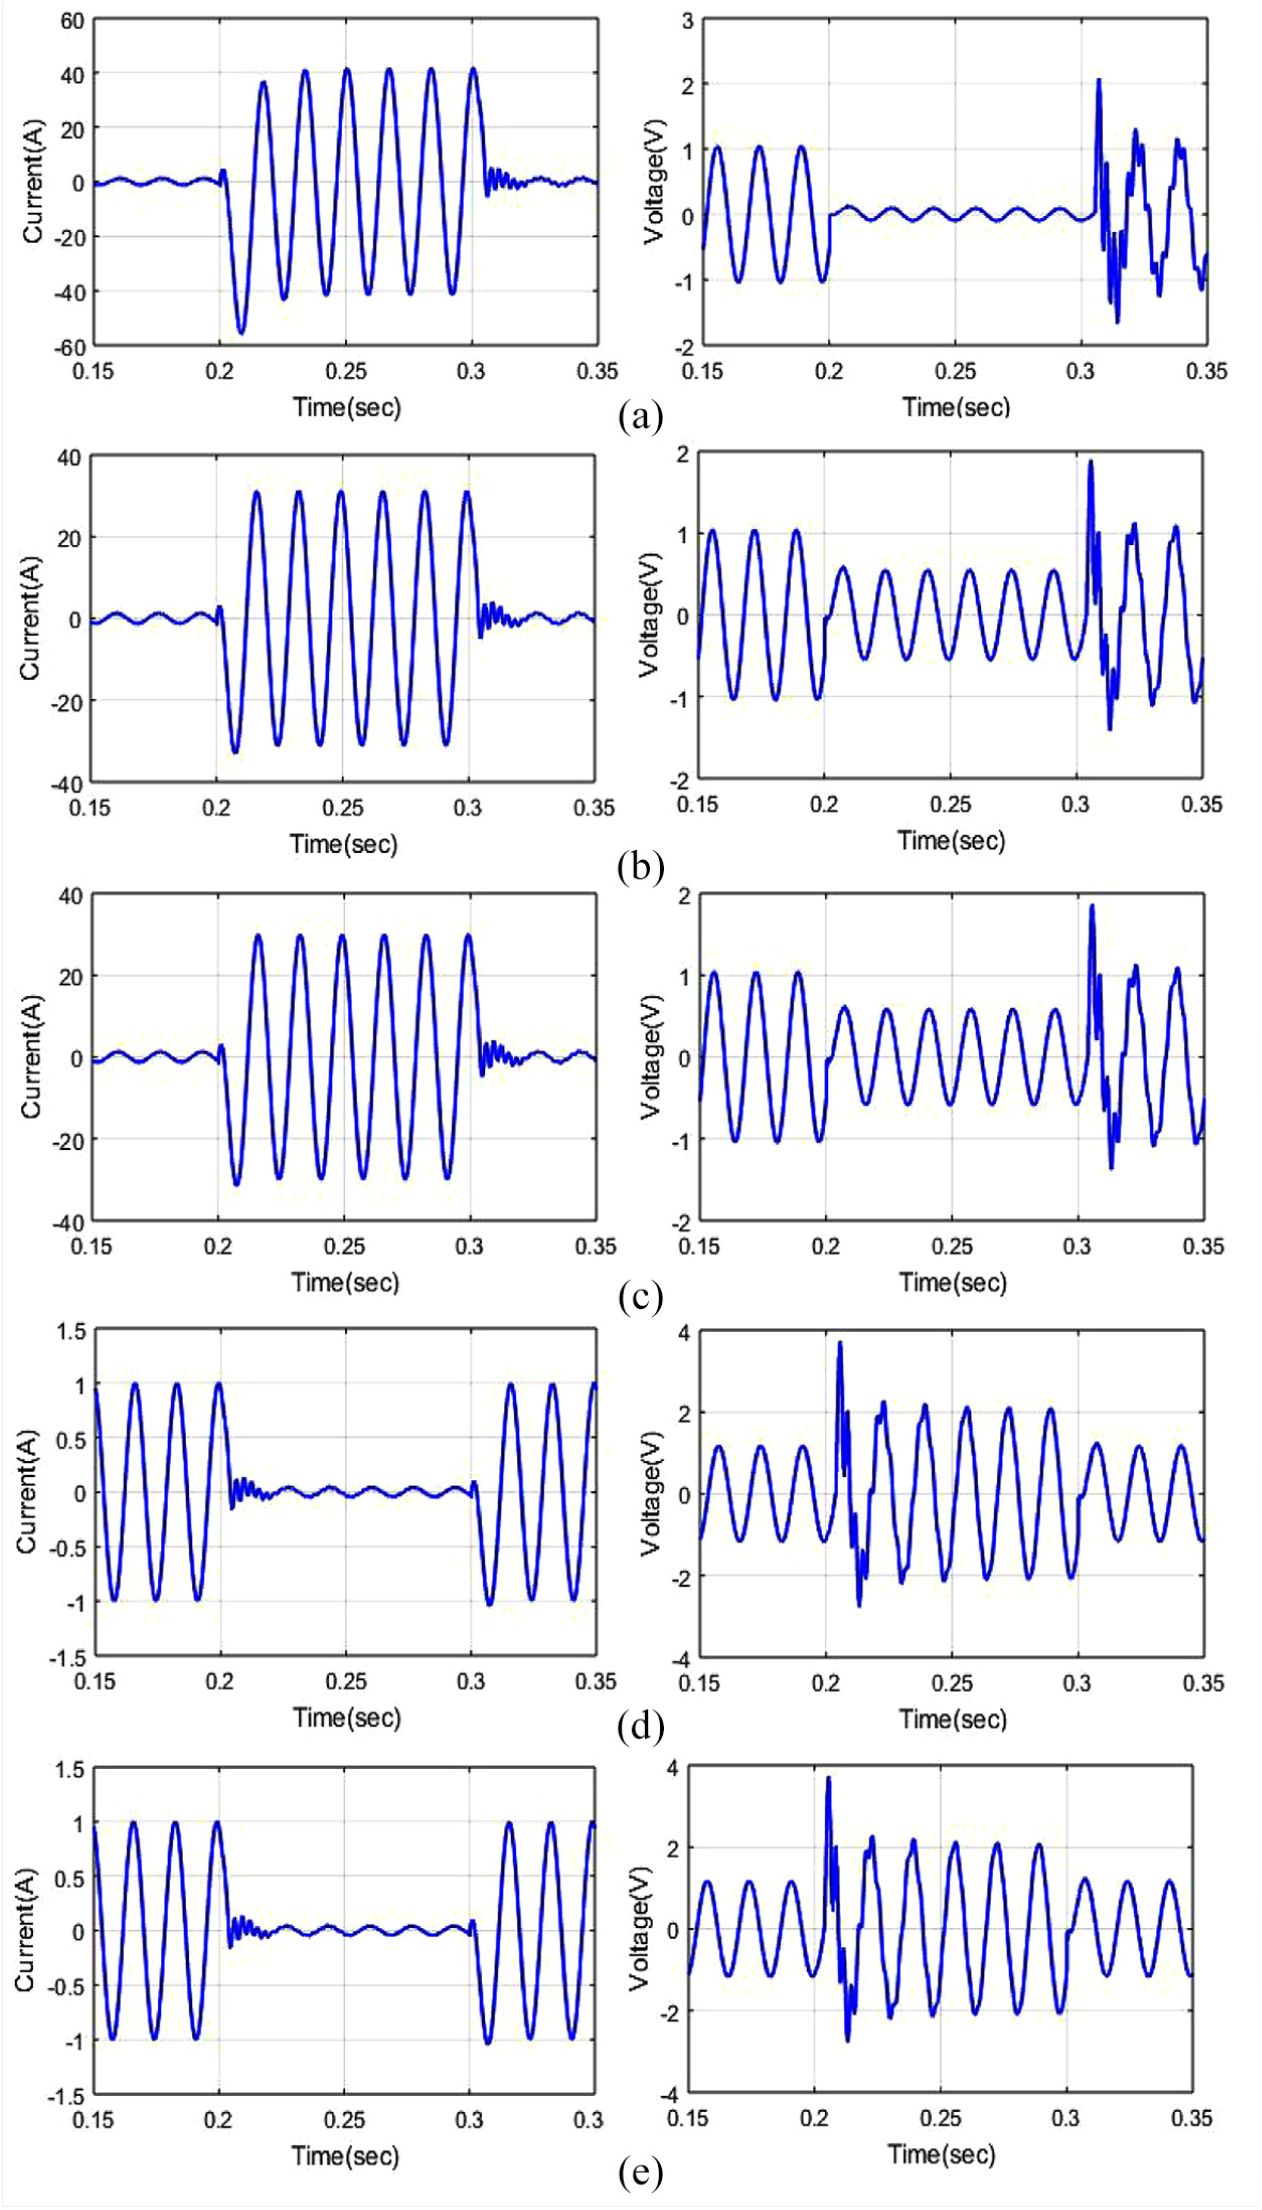
The multiple events of the three-phase current and voltage are dissected and presented in Figure 6. The performance comparison between the 10% sag-harmonic current and voltage is depicted in Figure 6(a). Here, the sag-harmonic state of the current waveform ranges from 0.15 to 0.2 s and 0.3 to 0.35 s. In addition, the sag-harmonic state of comparison voltage waveform ranges from 0.2 to 0.31 s.
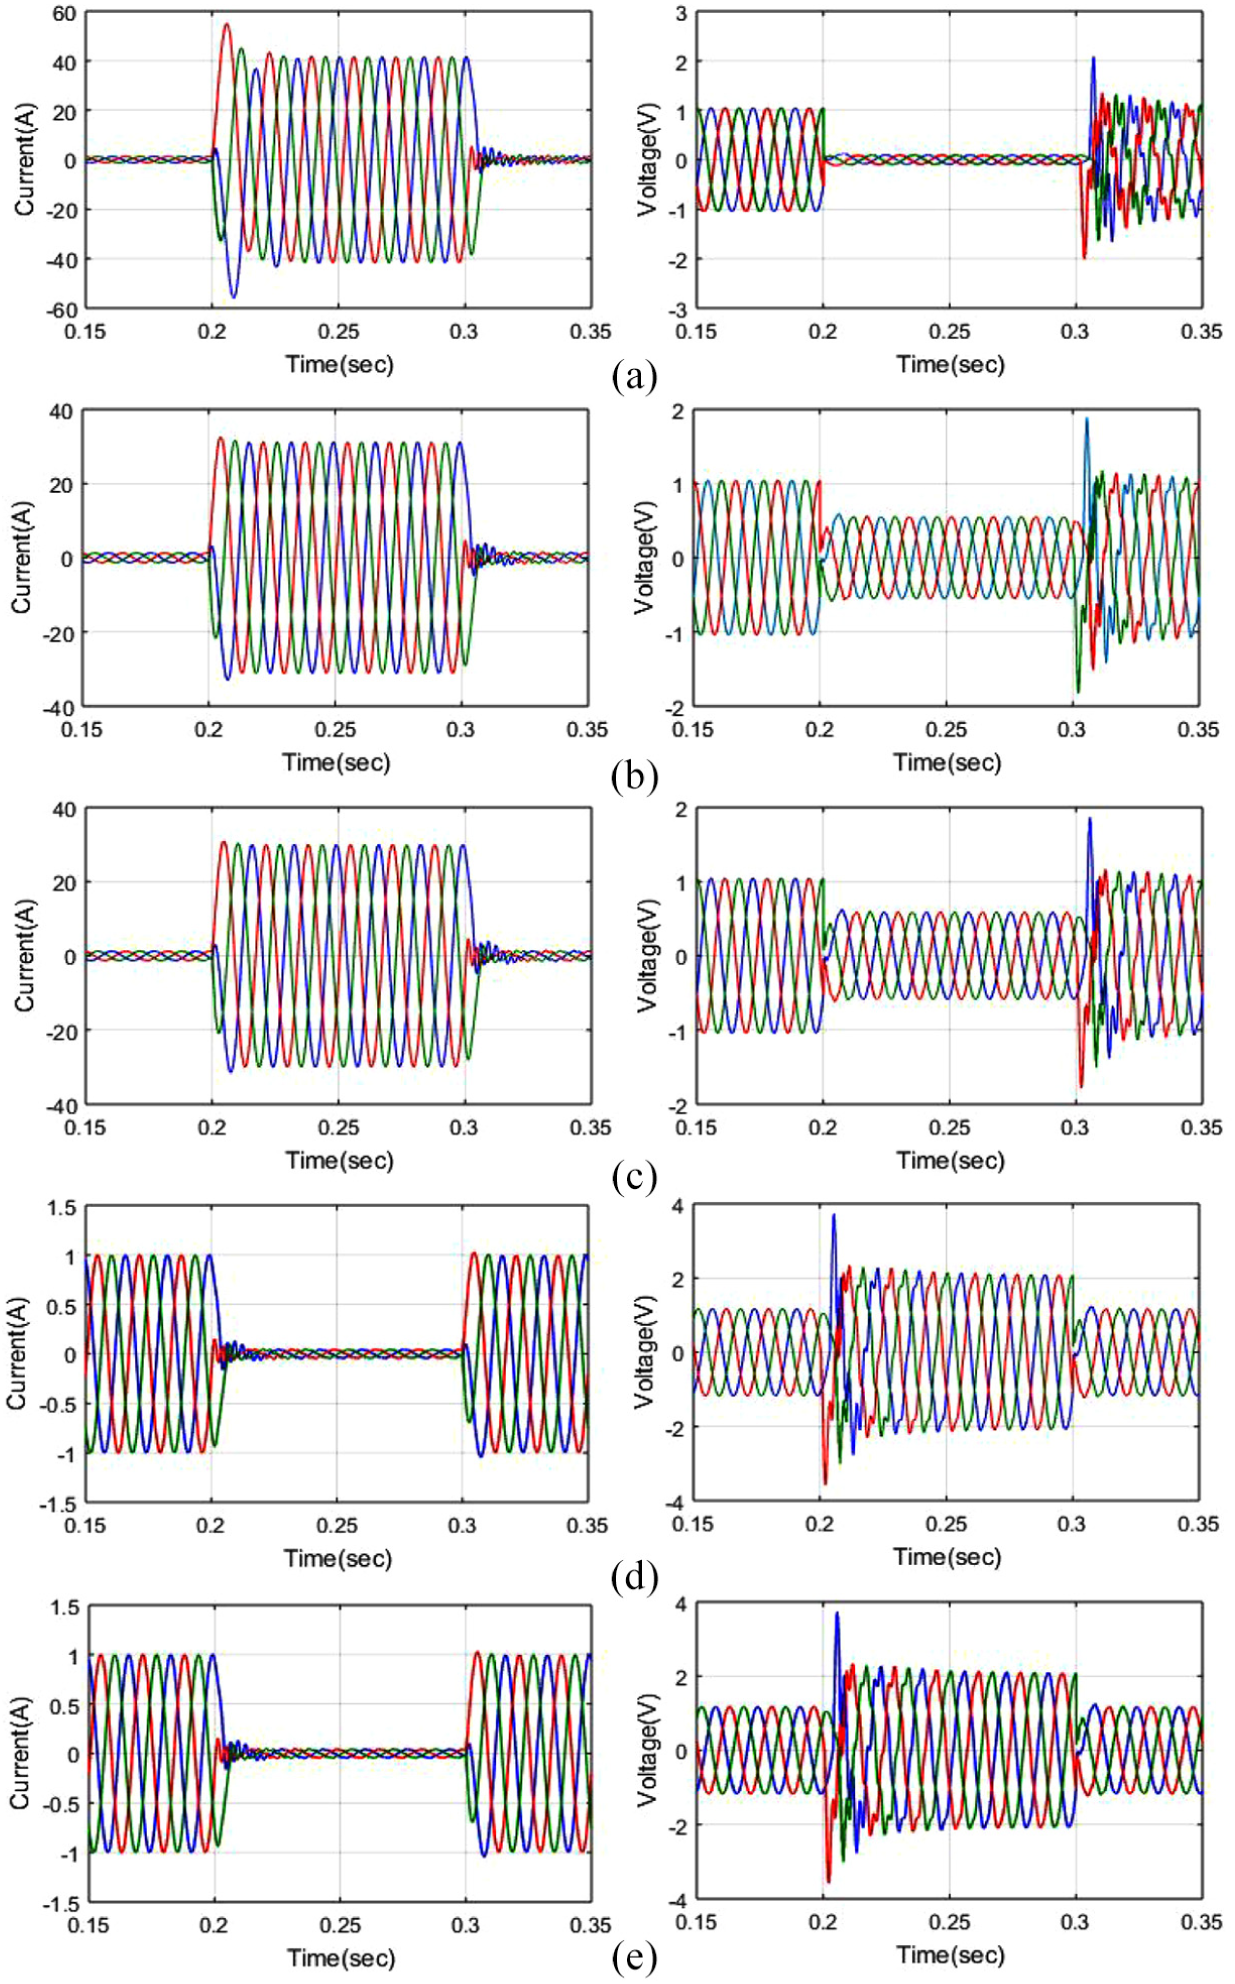
Multiple-event analysis of the three-phase system: (a) 10% sag-harmonic current and voltage; (b) 90% sag-harmonic current and voltage; (c) sag-harmonic current and voltage; (d) swell-harmonic current and voltage; and (e) swell-transient current and voltage.
The performance between comparison 90% sag-harmonic current and voltage is shown in Figure 6(b). Here, the sag-harmonic condition of the current waveform fluctuates from 0.15 to 0.2 s and 0.3 to 0.35 s; likewise, the sag-harmonic condition for the voltage waveform shifts from 0.2 to 0.31 s. The comparison between sag-harmonic current and voltage is depicted in Figure 6(c). Here, the sag-harmonic condition for the current waveform ranges from 0.15 to 0.2 s and 0.3 to 0.35 s and furthermore the sag-harmonic condition for the voltage waveform changes from 0.2 to 0.3 s. The comparison between the swell-harmonic current and voltage is depicted in Figure 6(d). The swell condition for the current waveform ranges from 0.2 to 0.3 s, and the swell condition for the voltage waveform differs from 0.15 to 0.23 s and 0.3 to 0.35 s. The comparison between the swell-transient current and voltage is depicted in Figure 6(e). The swell-transient condition for the current waveform ranges from 0.2 to 0.3 s and the swell-transient condition for the voltage waveform differs from 0.15 to 0.23 s and 0.3 to 0.35 s.
The XCF of the single-event voltage is dissected and delineated as shown in Figure 7. The correlation of the 10% sag voltage is depicted in Figure 7(a). Here, the sag condition for the voltage waveform changes in the scope of 20–30 tests and the amplitude of the waveform is 0.1 to ‒0.1. The comparison of the harmonic voltage is depicted in Figure 7(b). Here, the harmonic condition for the voltage waveform ranges from 2 to 50 samples and the amplitude of the waveform is 1 to ‒1. The performance comparison of the sag voltage is portrayed in Figure 7(c). Here, the sag condition for voltage ranges from 20 to 30 samples and the amplitude scope of the waveform is 0.4 to ‒0.4. The performance of the swell voltage is showed in Figure 7(d). The swell state of the voltage waveform ranges from 0 to 20 tests and 31 to 50 tests and the amplitude range is from 1.2 to ‒1.2.
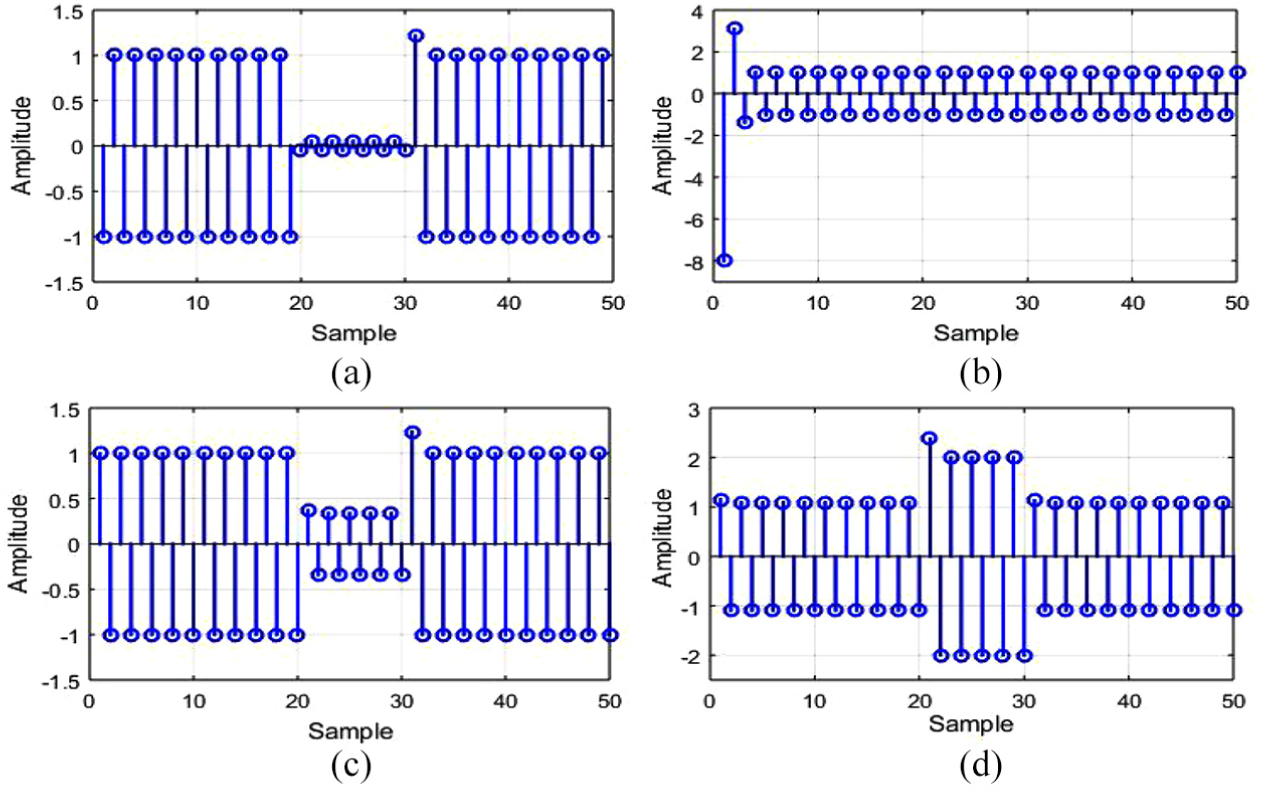
XCF of single-event analysis: (a) 10% sag voltage, (b) harmonic voltage, (c) sag voltage, and (d) swell voltage.
The XCF of the multiple-event voltage is examined as shown in Figure 8. The performance comparison of the 10% sag-harmonic voltage is examined as shown in Figure 8(a). Here, the sag-harmonic state of voltage ranges from 2 to 50 samples and the amplitude is from 0.2 to ‒0.2 and 1 to ‒1. The performance comparison of the 90% sag-harmonic voltage is examined as shown in Figure 8(b). Here, the sag-harmonic condition of the voltage waveform ranges from 5 to 50 samples. The amplitude estimation of the waveform is 1 to ‒1. The performance comparison of the sag-harmonic voltage is examined as shown in Figure 8(c). Here, the sag-harmonic condition for the voltage waveform ranges from 5 to 50 samples and the amplitude ranges from 3 to ‒3 and 1 to ‒1.
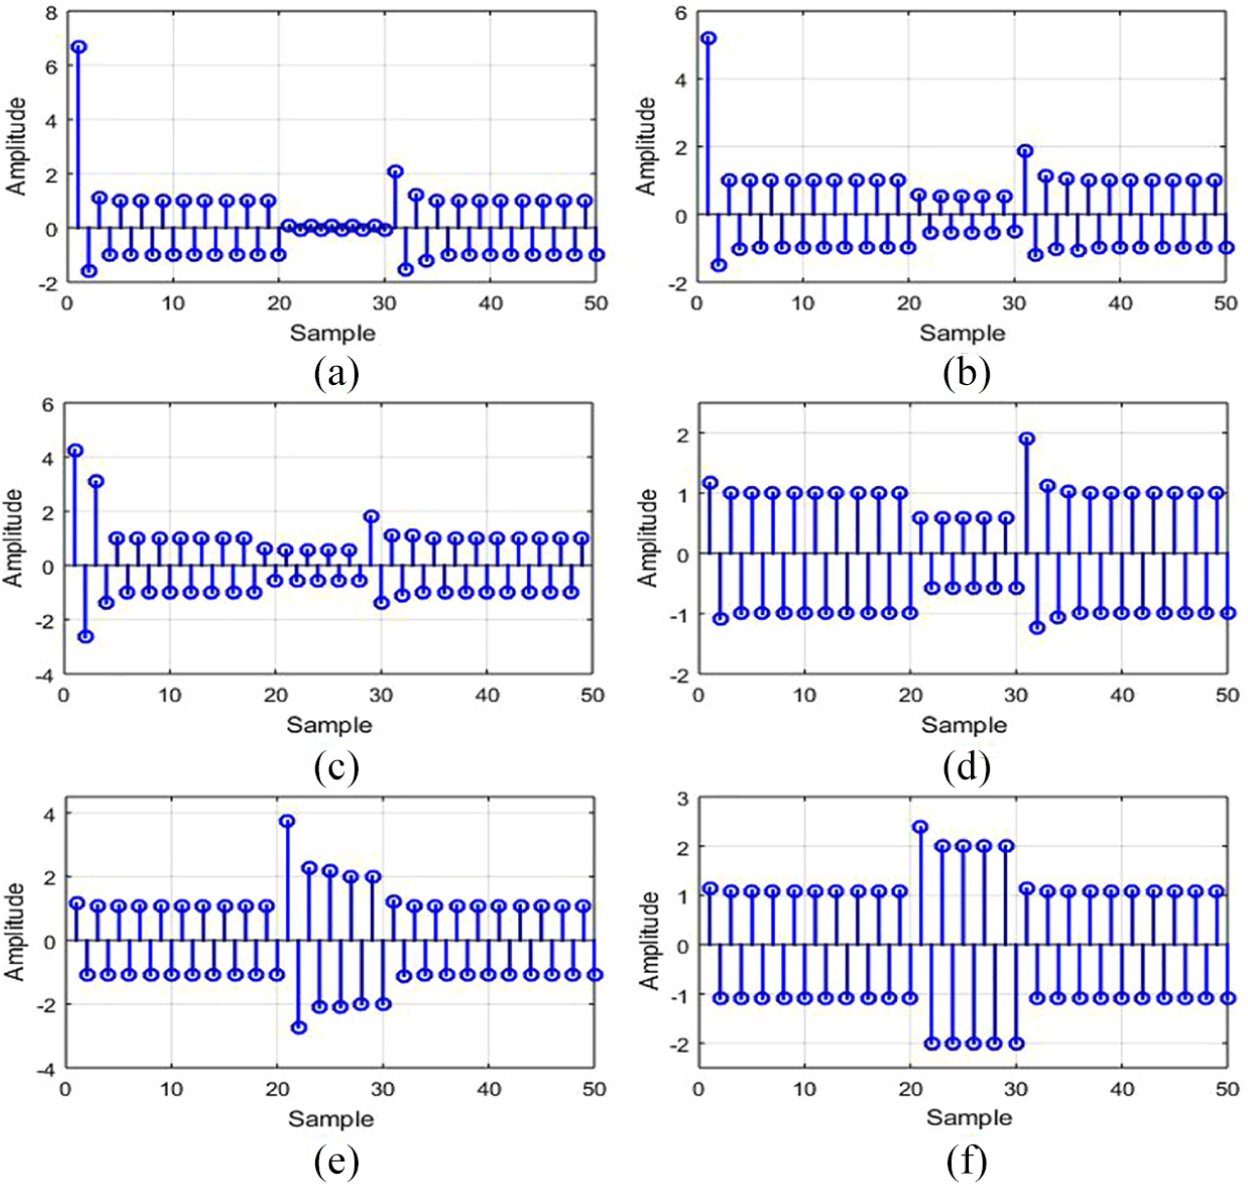
XCF of multiple-event analysis: (a) 10% sag-harmonic voltage, (b) 90% sag-harmonic voltage, (c) sag-harmonic voltage, (d) sag-transient voltage, (e) swell-harmonic voltage, and (f) swell-transient voltage.
The comparison of the sag-transient voltage is depicted in Figure 8(d). Here, the sag-transient condition for the voltage waveform ranges from 0 to 30 samples and 32 to 50 and the amplitude value ranges from 0.5 to ‒0.5 and 1 to ‒1. The comparison of the swell-harmonic voltage is depicted in Figure 8(e). Here, the swell-harmonic condition for the voltage waveform ranges from 0 to 20 samples and 24 to 50 samples and the amplitude value ranges from 1 to ‒1 and 2 to ‒2. The performance comparison of the swell-transient voltage is depicted in Figure 8(f). Here, the swell-transient condition for the voltage waveform ranges from 0 to 20 samples and 32 to 50 samples and the amplitude value ranges from 1 to ‒1.
With a specific end goal to enhance the superiority of the proposed methodology, different algorithms are presented for performance comparison. The classification accuracy and the parameters of the proposed system are compared with the existing techniques like MUSIC-ANN and GA-ANN as shown in Figure 9. When comparing the proposed one with the existing techniques, the accuracy of the algorithm is in the order of SSO-ANN → MUSIC-ANN → GA-ANN. Thus, the superiority of the proposed technique is demonstrated in the above order. Accordingly, the proposed algorithm brings about preferred economic impacts over the existing algorithms. In addition, it prompts a high-quality solution than different existing techniques.
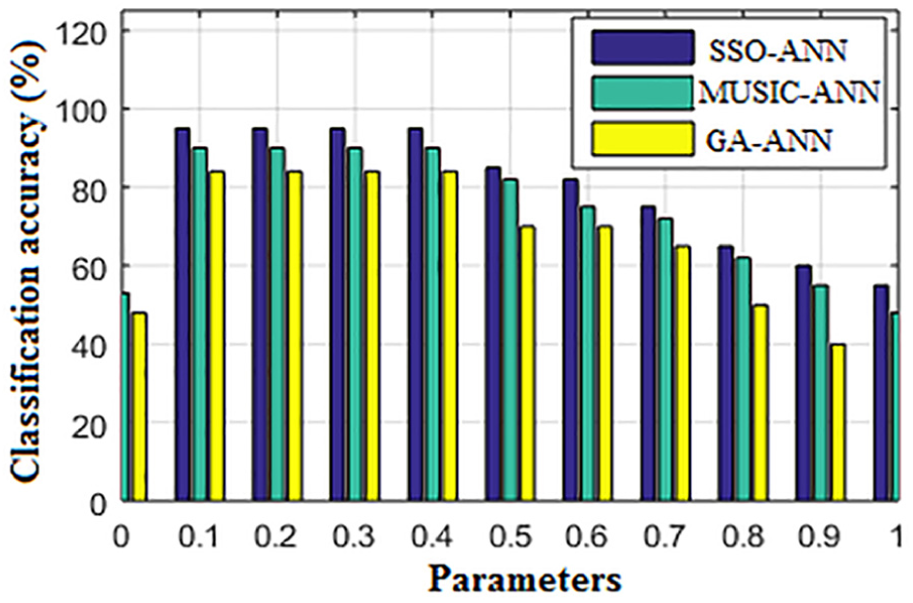
Classification accuracy comparison of the proposed method with existing techniques.
Conclusion
In this paper, a novel protection scheme is proposed for PQ event prediction and classification in the distribution system. In the proposed approach, ANN is used to perceive the system signal’s healthy or unhealthy condition in the first phase. The second phase of the ANN is utilized for the classification of the unhealthy signals, and during this stage the ANN learning procedure is enhanced by utilizing the SSO algorithm. At that point, the proposed technique is actualized in the MATLAB/Simulink working stage for prediction and classification of the PQ event. The effectiveness of the proposed system is compared by different existing methodologies. By this proposed technique, several PQ problems of single events such as 10% sag current and voltage, harmonic current and voltage, sag current and voltage, swell current and voltage, and XCF are analyzed. Furthermore, the 10% sag-harmonic current and voltage, 90% sag-harmonic current and voltage, sag-harmonic current and voltage, swell-harmonic current and voltage, swell-transient current and voltage, and XCF are also analyzed. The simulation result shows that the proposed strategy is effective in protecting the distribution system’s PQ events with a high precision. Likewise, the proposed method ensures the system with a decreased complexity for the prediction and classification of PQ events and subsequently the accuracy of the system is improved.
Footnotes
Declaration of conflicting interests
The author(s) declared no potential conflicts of interest with respect to the research, authorship, and/or publication of this article.
Funding
The author(s) received no financial support for the research, authorship, and/or publication of this article.