
Abstract
This paper presents a regression model for prediction of idler rotational resistance on belt conveyor. The advantage of the regression model is that it is created according to the real experimental measurement. Besides, the predicted model corresponds with real operational parameters, such as radial force, rotational speed and measurements, conducted via using a laboratory test facility; several criteria have been used to verify the presented regression model. Finally, by analyzing the regression model combined with influence of radical force and rotational resistance on idler rotational resistance, this paper presents an operable control ideal to achieve energy-saving.
Keywords
Introduction
Belt conveyor is the most popular type of continuous bulk material transport system. With the gradual popularization of pipe belt conveyor, energy consumption should be considered. Besides, speed control acts as an effective way to improve energy efficiency of belt conveyor;1–3 in order to design excellent speed control algorithm, it is indispensable to establish a regression model of idler rotational resistance.
In general, idler rotational resistance contributes between 5% and 15%4–6 of motion resistance in belt conveyor. Compared with other resistance that accounts for 95%–75% of main resistance, idler rotational resistance may be considered a relatively small contribution; yet, once considering belt conveyor will be many kilometers in length, reducing idler rotational resistance is essential to achieve energy-saving in belt conveyor.
Among the components of belt conveyor, idler plays a role in supporting belt and bulk material that produces rotational resistance primarily dependent on the type of bearings, temperature of the lubricant, seal type and configuration, and rotational speed.
A number of the researchers have contributed to the analysis on rotating resistance of idler. Generally, these studies can be categorized based on the theoretical and experimental approaches. Reicks 7 in the paper mainly concentrates on the impact of life of bearing and seal design on rotational resistance in detail. Krol et al. 8 carried out idler rotational resistance experimental investigation via measurement apparatus; on the contrary, Lu and Lin9,10 design a test rig that imitates real belt conveyor for measuring idler rotational resistance indirectly. In addition, some researchers concentrate on theoretical approximations in respect of idler diameter and grease viscosity. In especial, Wheeler 11 develops a beneficial study on the influence of various factors on rotational resistance theoretically. Wang and Lin 12 discuss the relationship between rotational resistance and frictional characteristic of deep-groove ball bearings which is subjected to radical load.
In spite that idler rotational resistance is primarily dependent on the seal type and configuration, type of bearings, and so on, nevertheless, in consideration that the primary function of idler is to support the conveyor belt, predicting the resistance by a proper regression model that can reflect the influence of radial force, rotational speed is vitally important on calculating belt tension and power requirements, particularly for long belt conveyor. Undoubtedly, radial force and rotational speed correspond to bulk material and belt speed, respectively; belt speed can be varied via frequency control technology and bulk material can also be monitored in the field; this paper mainly concentrates on establishing a proper regression model that can present the relationship between resistance and radial force, and rotational speed consequently.
Experimental rig
Experimental measurement is an indispensable method for verifying the accuracy of regression model; consequently, it is essential to design an appropriate test rig.
Description of preliminary experimental rig
In order to develop rotational resistance measurement in real operating condition, Lu and Lin9,10 have designed a test facility which imitates a real belt conveyor. This test rig which is shown in Figure 1 is similar with the designed facility by Paul Munzenberger and Wheeler.13,14 The novelty and difference of experimental rig compared with real belt conveyor is that the idler is located above the conveyor belt and plays a role in testing resistance which is connected to the “S” type load cell by a thin rope. However, in the experimental rig, the idler is located under the frame of real belt conveyor and acts as supporting belt and bulk material.
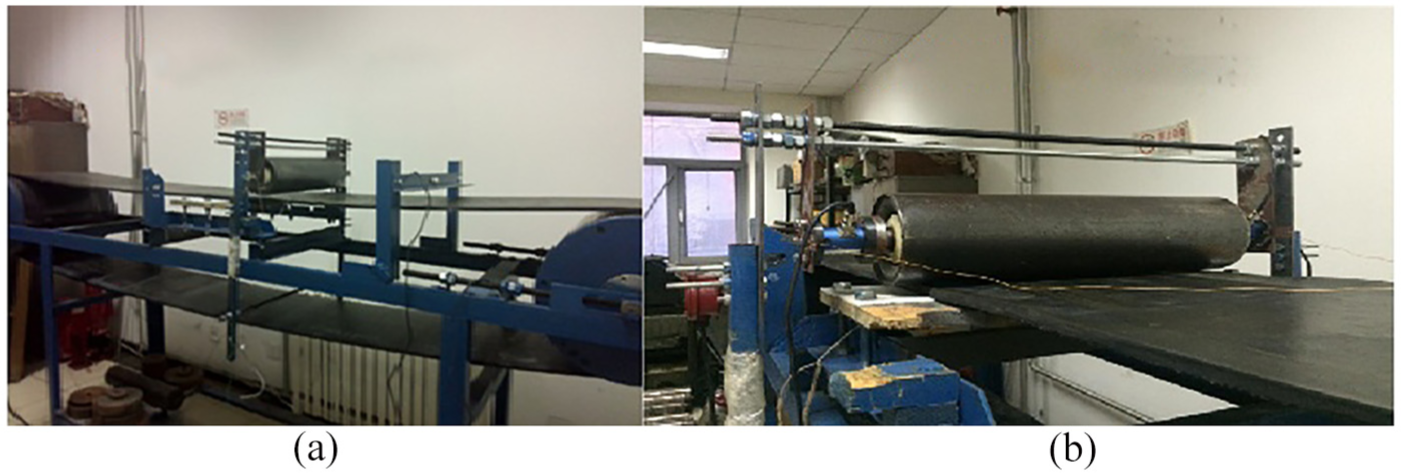
An indirect test rig of idler rotational resistance: (a) side view of test rig and (b) front view of test rig.
This test rig measures idler rotational resistance indirectly. A horizontal force is measured by the “S” type load cell. It is noticeable that because the rotational resistance is just a component of this horizontal force, it must be subtracted from overall horizontal force consequently. As a result, this test rig has some significant difficulties. In order to make up for the shortcomings, the author designs another test rig 15 based on the lathe to measure the rotational resistance under simulated operating conditions which is shown in Figure 2.
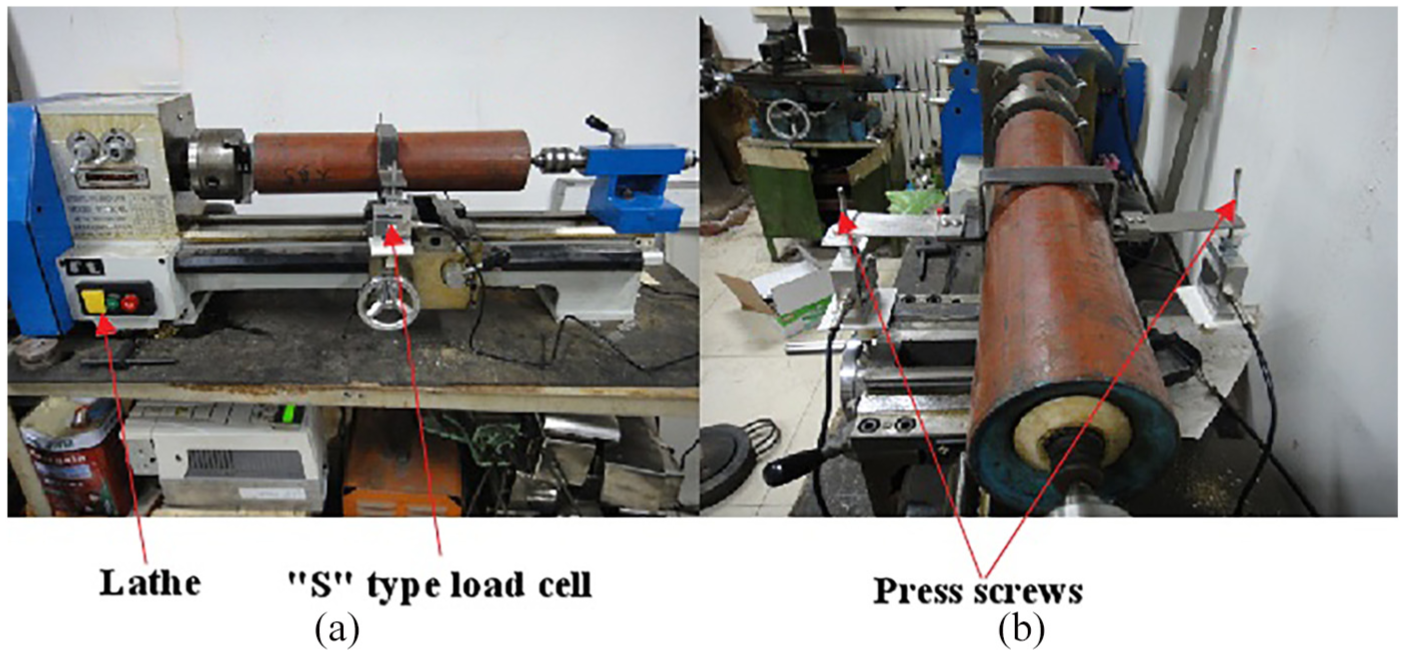
A test rig for measuring idler rotational resistance based on lathe: (a) front view of test rig and (b) side view of test rig.
This test rig uses two press screws to apply press radical force at the axial direction, and they are linked with “S” type load cells that measure both radical force and rotational resistance. The advantage of this rig is convenient; however, the load cannot be varied to achieve a wide range.
An optimal idler rotational resistance test facility
On the basis of previous research work, an optimal idler rotational resistance is designed, constructed, commissioned, and extensively tested by Lu-Yan, Yan-Fu Lin, and Luo-Rou. This test rig is pictured in Figure 3.
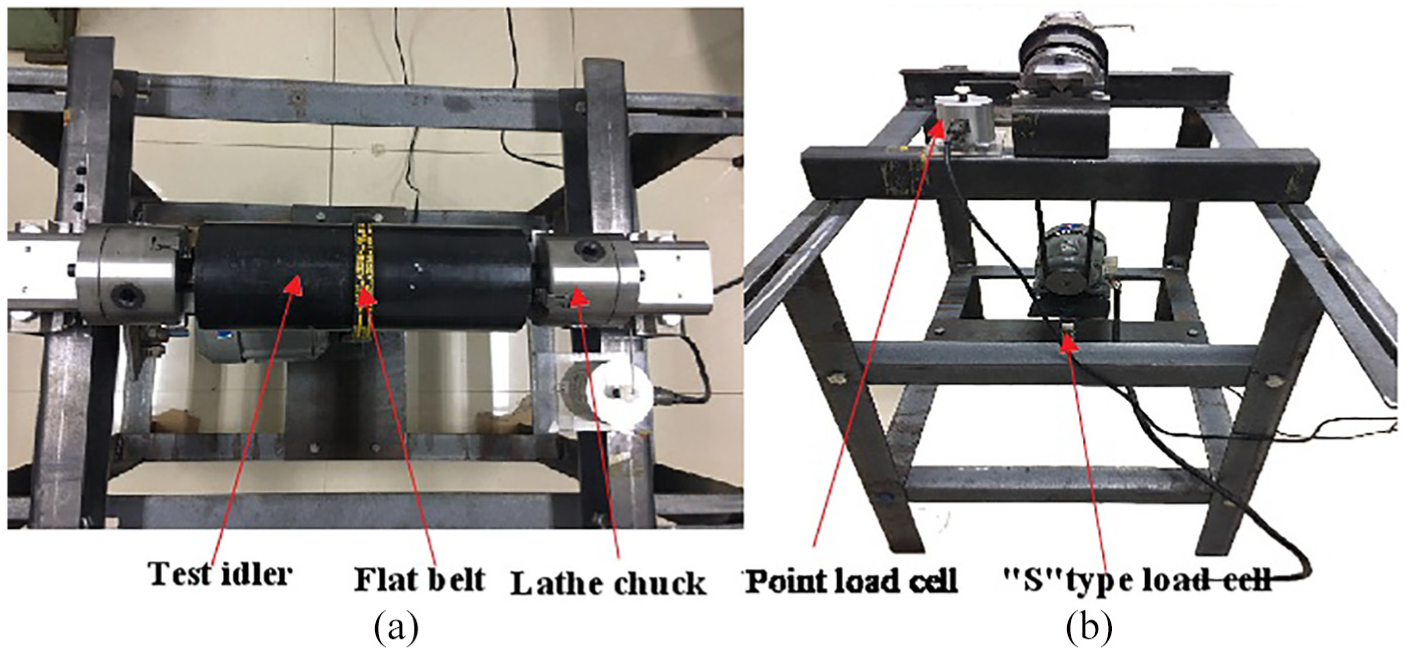
Idler rotational resistance test facility: (a) top view of test rig and (b) side view of test rig.
The vast majority of optimal test facility is devoted to simulate structure of real belt conveyor. In the subsequent experiment, the main adjusting parameters are radical force Pr and rotational speed n. As test facility uses a flat belt to drive the idler, a tension screw is employed to provide radical force via flat belt shown in Figure 4. On the contrary, in order to vary the rotational speed, an inverter that is connected with electric machinery is utilized. One “S” type load cell is employed to measure radical force, and the idler rotational resistance is continuously monitored by another point load sensor BK-3A.
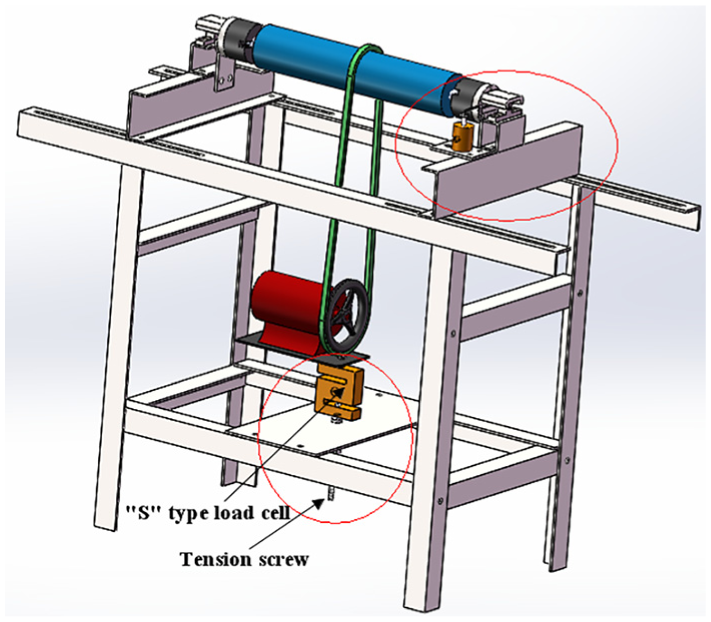
A 3D geometrical model of test facility.
Measurement values are recorded by the software NI LabVIEW and A/D converters with amplifiers, obtained from the company of National Instruments. Besides, when test facility is in a stable state, the corresponding resistance is a constant value that infers it is a DC component; in order to avoid noise and other factors that will affect the measurement results of sensor, the software uses Wavelet toolkit of LabVIEW to extract the DC component.
Measurement frame
As shown in Figure 4, the vast majority of idler rotational resistance test facility is devoted to simulate essence of real belt conveyor; only a small section on top of test facility provides the actual idler rotational resistance measurement. This part of the test rig is known as the measurement frame. A view of the measurement frame is shown in Figure 5.
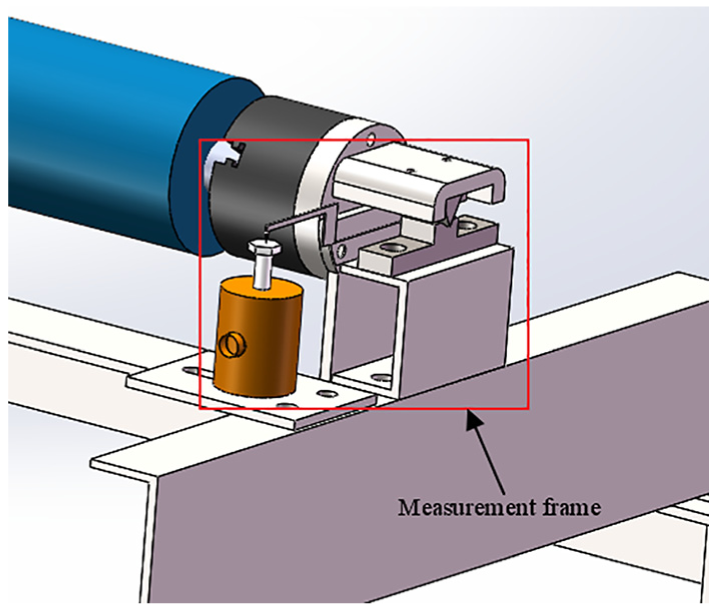
A 3D geometrical model of measurement frame.
The measurement frame consists of four main sections. The first is a lathe chuck whose purpose is to fix shaft of test idler. The second is a set of knife edges; they are connected with lathe chuck to achieve supporting lathe chuck. Knife edges are a hardened steel triangular prism whose bottom edges are located at the axis of the test idler. The knife edge seat that is with a 60° cut out which can provide a space for the 30° knife edge to locate allows the shaft of idler to rotate up to ±15. The third, whose purpose is to transmit the rotational resistance to the point load cell, is a torque arm. The four is point load cell which is to measure resistance. Obviously, if the knife edge is ground to a fine sharp edge, the magnitude of frictional resistance generated between seat and knife edge can be negligible by their radius of contact. As a result, the rotational resistance can be measured accurately. When the idler shell is in rotation and the idler shaft holds stationary status, the rotational resistance can be measured from the following equation, and this measurement system is shown in Figure 6

where Fresistance is the idler rotational resistance (N), d is the diameter of idler (m), L is the torque arm length (m), and Fsensor is the resistance recorded on point load cell (N).
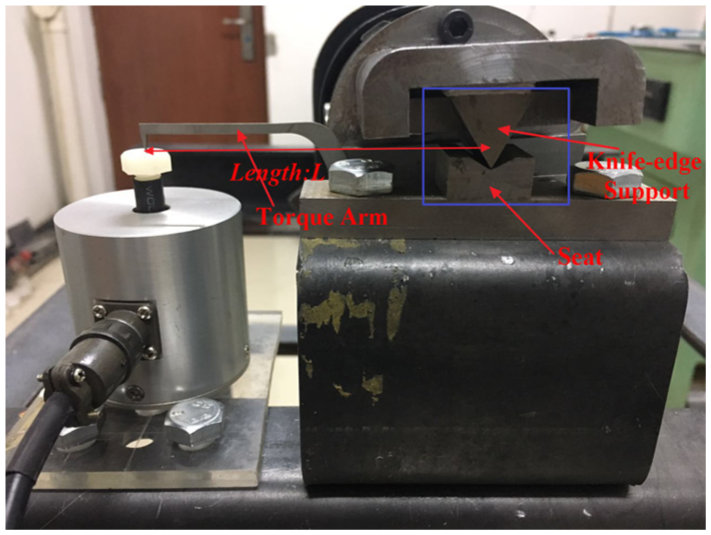
Measurement frame.
Vertical load application
To conduct an idler rotational resistance test, a radical load needs to be applied to the measurement idler. Furthermore, the load also needs to be varied to get a range of measurement. Finally, the test facility uses a tension screw to apply a variable load to test idler as shown in Figure 7.
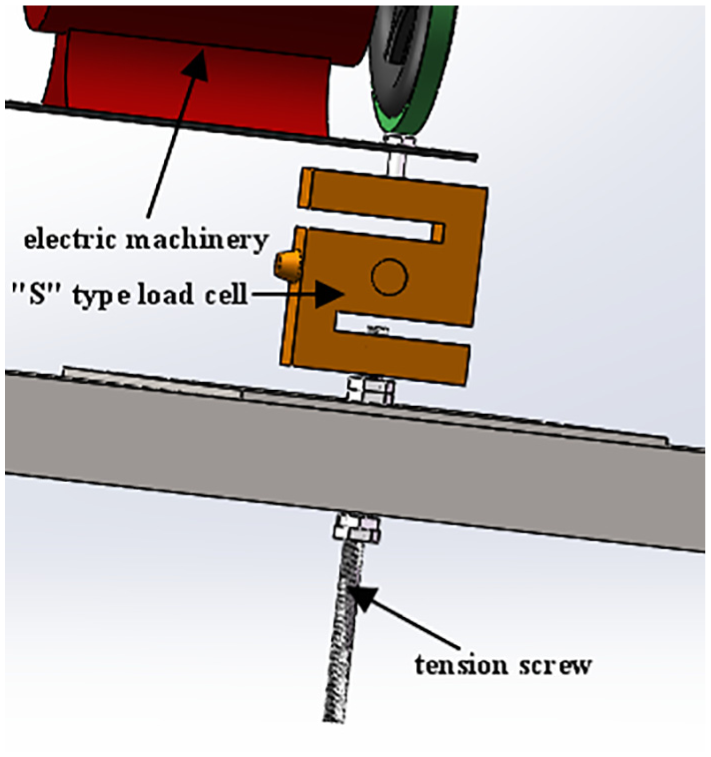
A 3D geometrical model of vertical load application.
Theory/calculation
Based on the measured values of rotational resistance, it is possible to create regression models that can predict the resistance. Several authors16–20 have discussed this problem: Remus et al. 16 mainly concentrates on the appropriate regression model for unstable environment, Bosnić and Kononenko17,18 defines empirical measures for estimation of regression’s prediction accuracy and proposes a method to achieve correction of regression prediction, Andrejiová and Marasová 19 analyzes the regression model of functional dependency on impact force from conveyor belt’s weight of ram and height of falling, Molnár et al. 20 examine a regression model for prediction of pipe conveyor belt contact forces, and Yang et al.21–23 publishes a series of academic papers on modeling of practical system.
Description of the measuring method
An integrated computer system measures idler rotational resistance; the integrated system uses NI LABVIEW2013 to achieve automatic measurement. The measuring system consists of two sensors that are “S” type load cell and point load sensor, respectively, and the output analog signals can be converted to digital signal by using the NI A/D converter for the subsequent processing on the computer.
The measuring consists three phases:
The idler is applied a desired radical force and rotated at desired rotational speed.
Measuring the rotational resistance with operational condition.
Calculating the average value by four sets of ascending and descending measurements.
Test result
A series of measurements have been created according to the experimental rig and a Ф89 mm idler is used in the experiment. The test result is shown in following.
Building the regression model
A proper regression model is indispensable to analyze the relationship between resistance and various factors; speed n is a kernel variable. On the contrary, radical force Pr also has a far-reaching effect. In view that speed control is a very common energy-saving means, the corresponding regression model should be practical to guide speed control; linear model and polynomial model are good choices consequently.
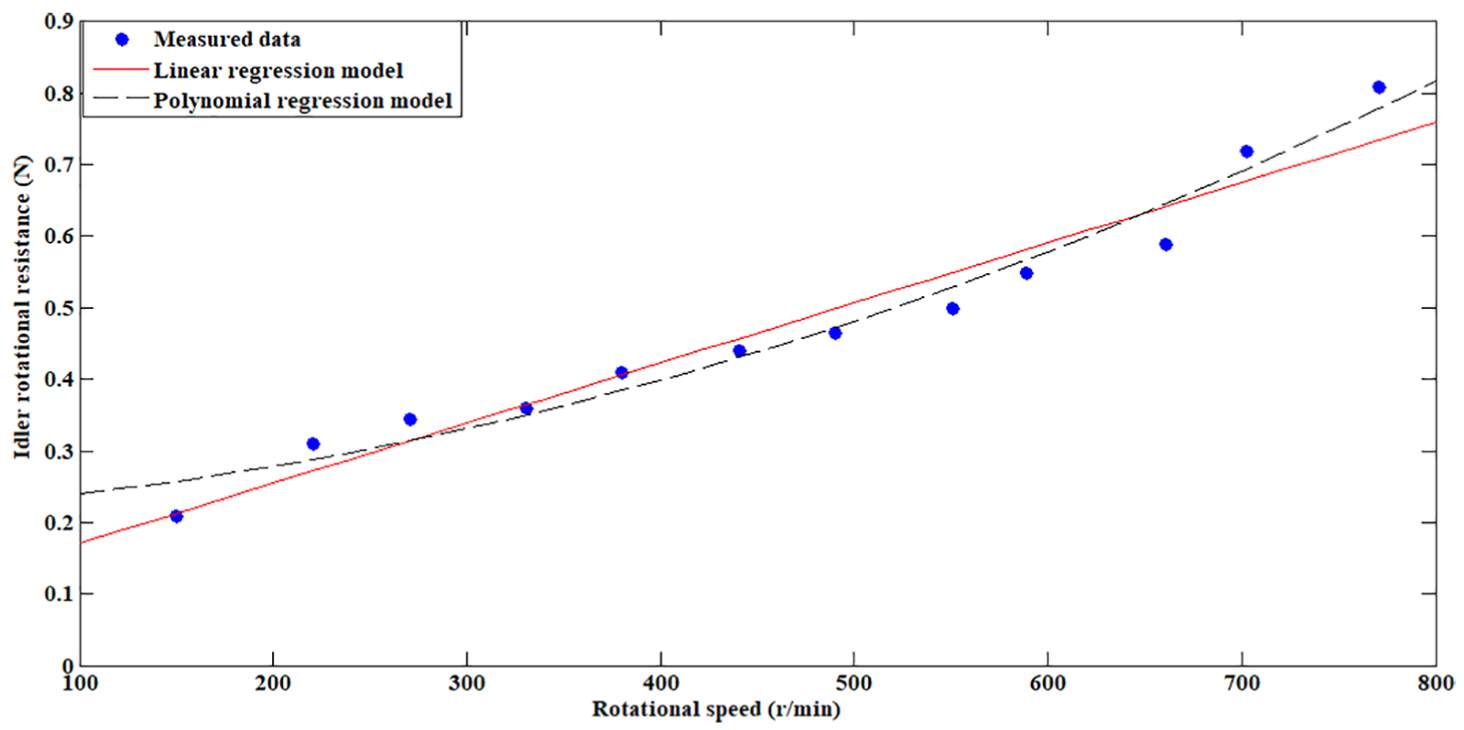
The resulting idler rotational resistance Fr is assumed that it depends on the regressor variable “rotational speed n”; the regression model can be described by using the following formula

Parameter
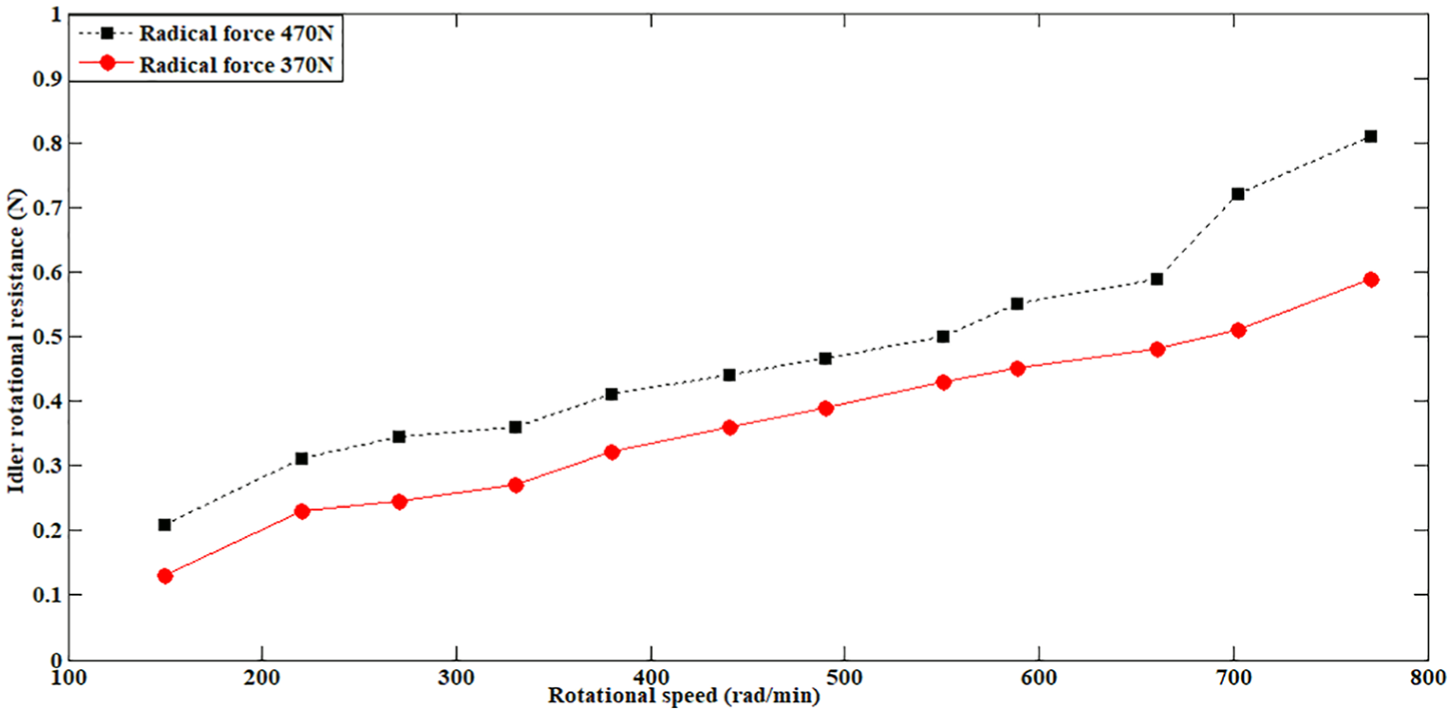
Idler rotational resistance from test rig over rotational speed for two experiments.
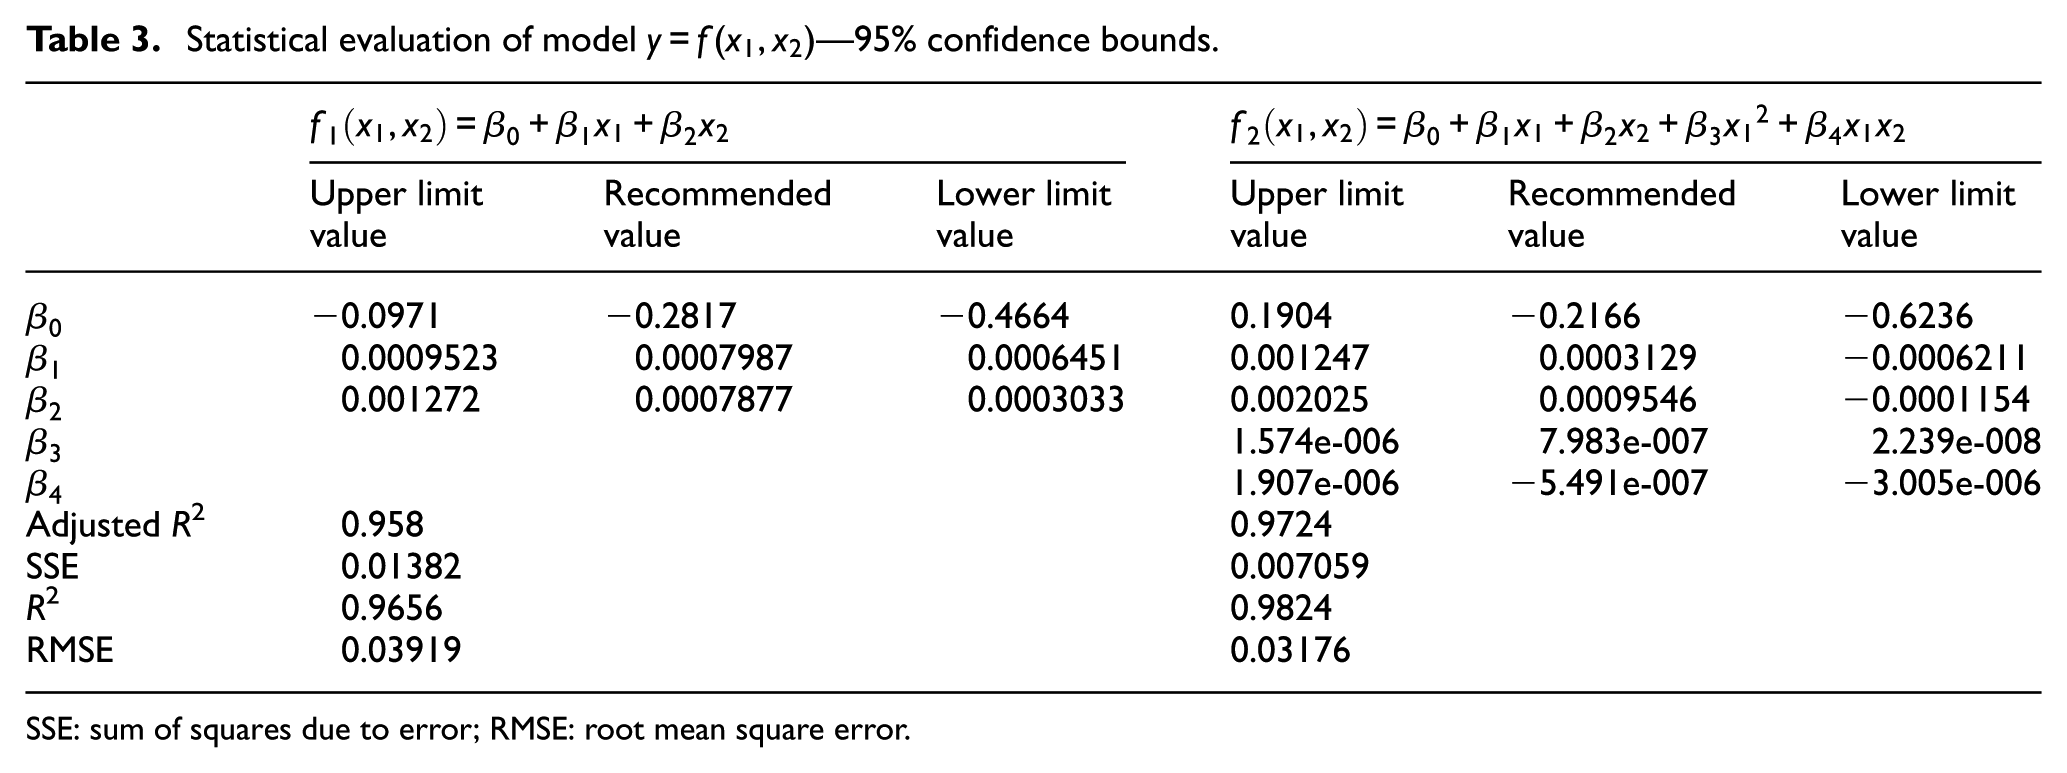
Statistical evaluation of model
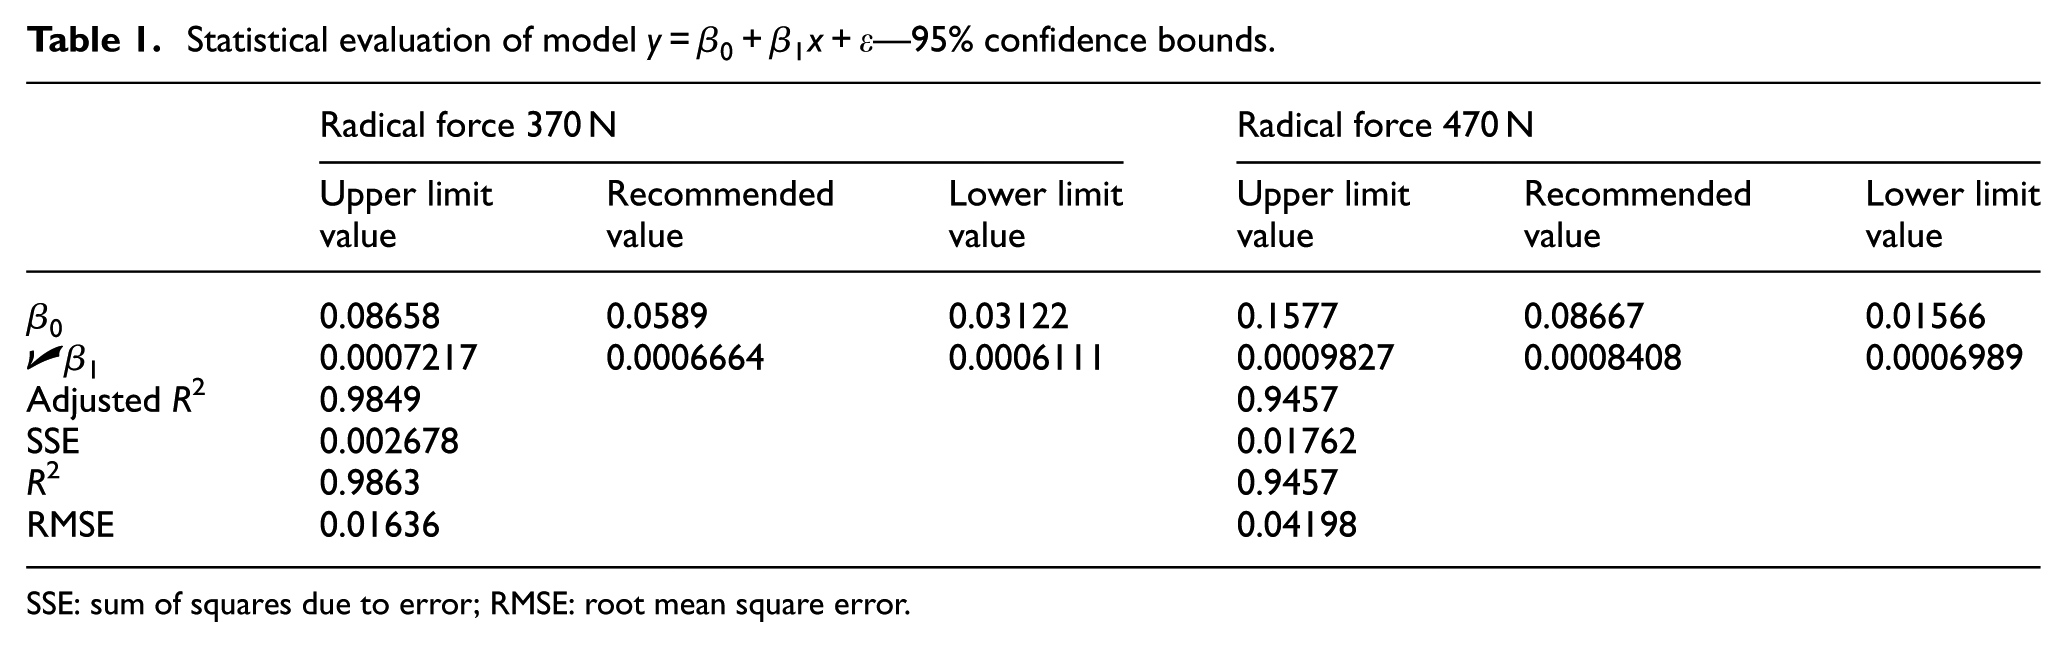
SSE: sum of squares due to error; RMSE: root mean square error.
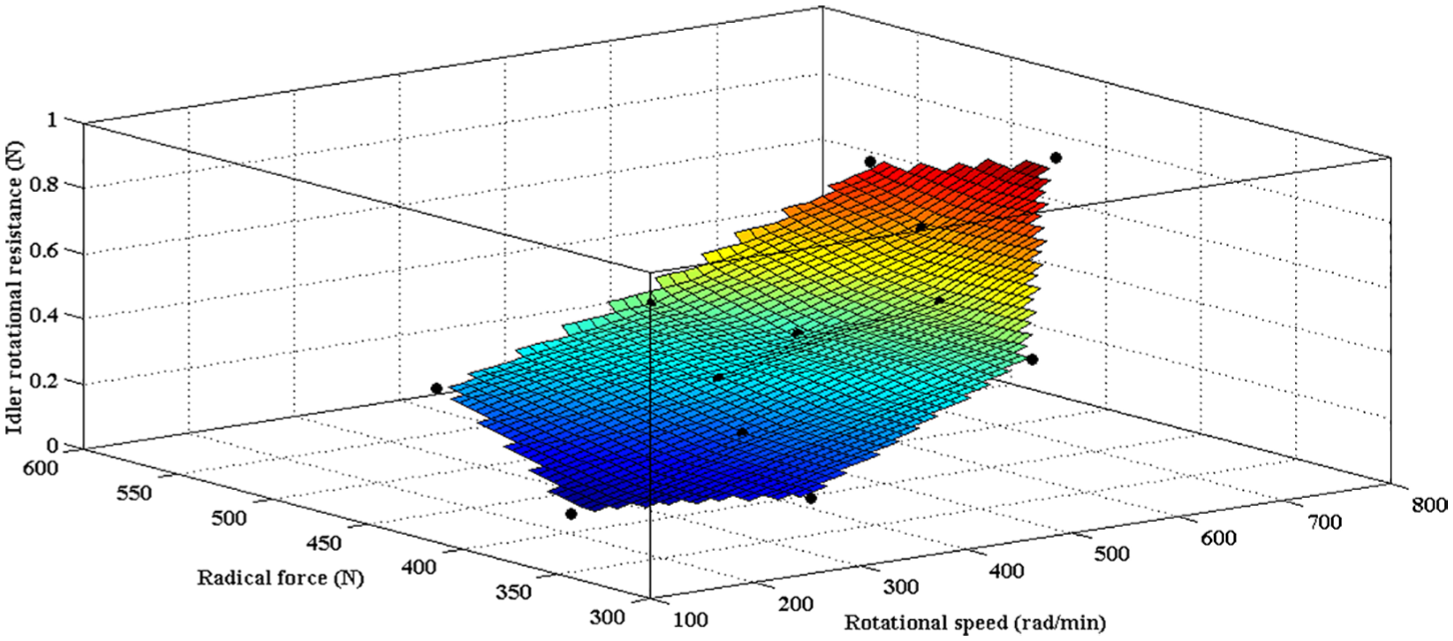
Idler rotational resistance from test rig over rotational speed and radical force.
To compare the performance of different regression models, another regression model is recommended by the following formula. Table 2 shows the estimated parameters of regression model
Statistical evaluation of model
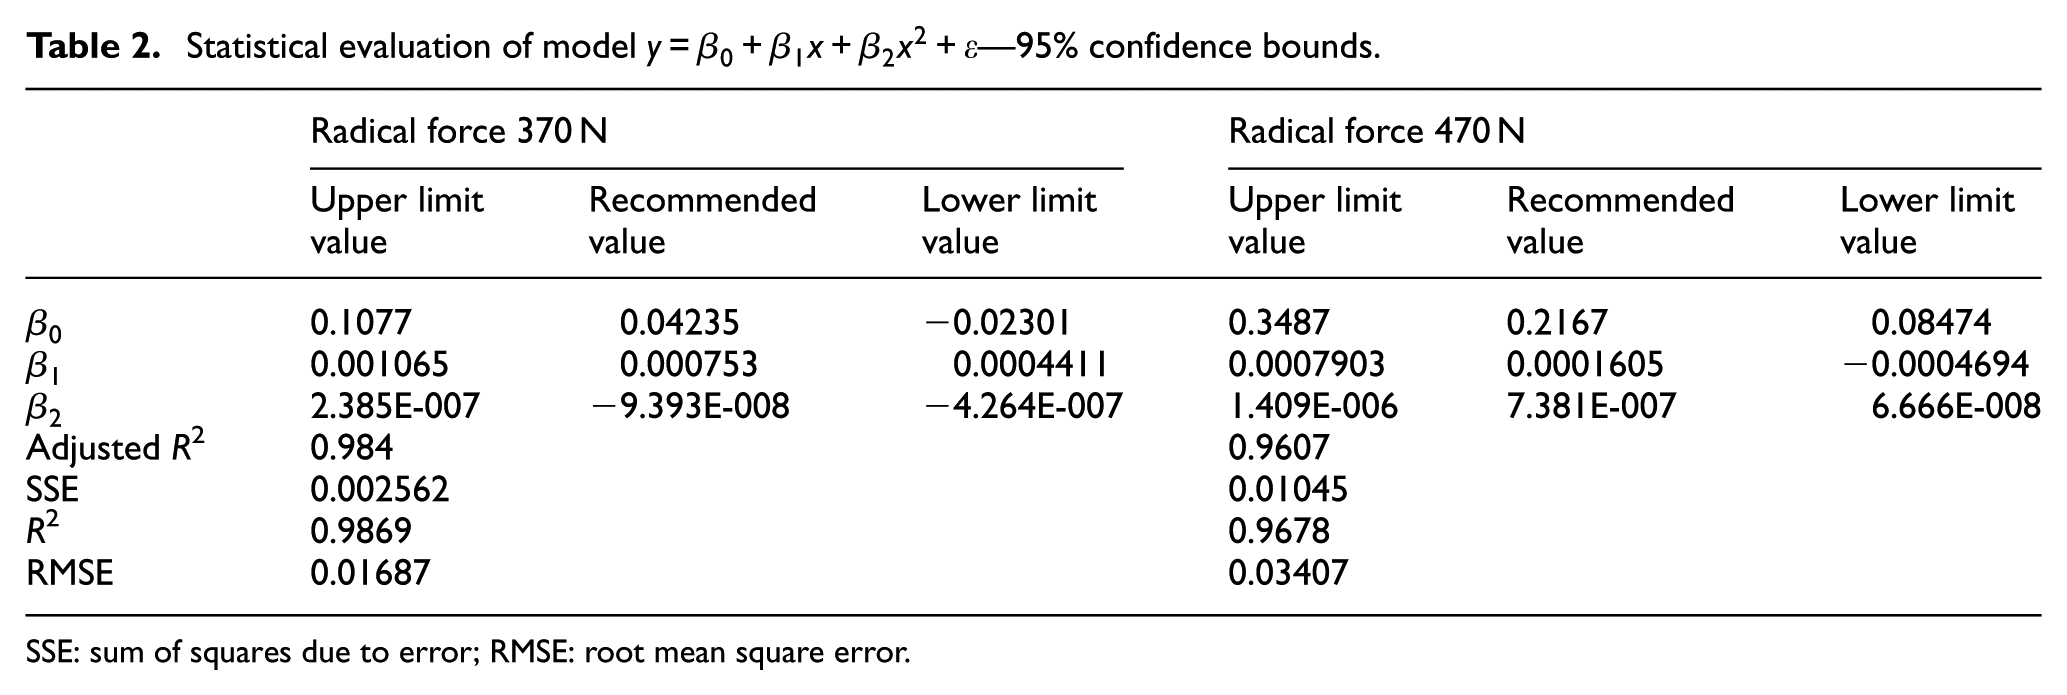
SSE: sum of squares due to error; RMSE: root mean square error.

It is notable from graph in Figures 10 and 11 and confirmed by Table 1 that when the idler is applied a lower radical force 370 N, the linear regression model and polynomial regression model both have a sufficient precision. Besides, when the rotational speed ranges from 300 to 600 r/min, both regression models can well predict the variation trend of idler rotational resistance. However, once idler is applied a high radical force, compared with linear regression model, polynomial regression model can more accurately reflect the variation law of idler rotational resistance. Finally, R2 coefficient is high, concluding that this regression model can properly describe a large proportion of the variability on rotational resistance and root mean square error (RMSE) coefficient is lower, inferring that the regression model performs excellently.
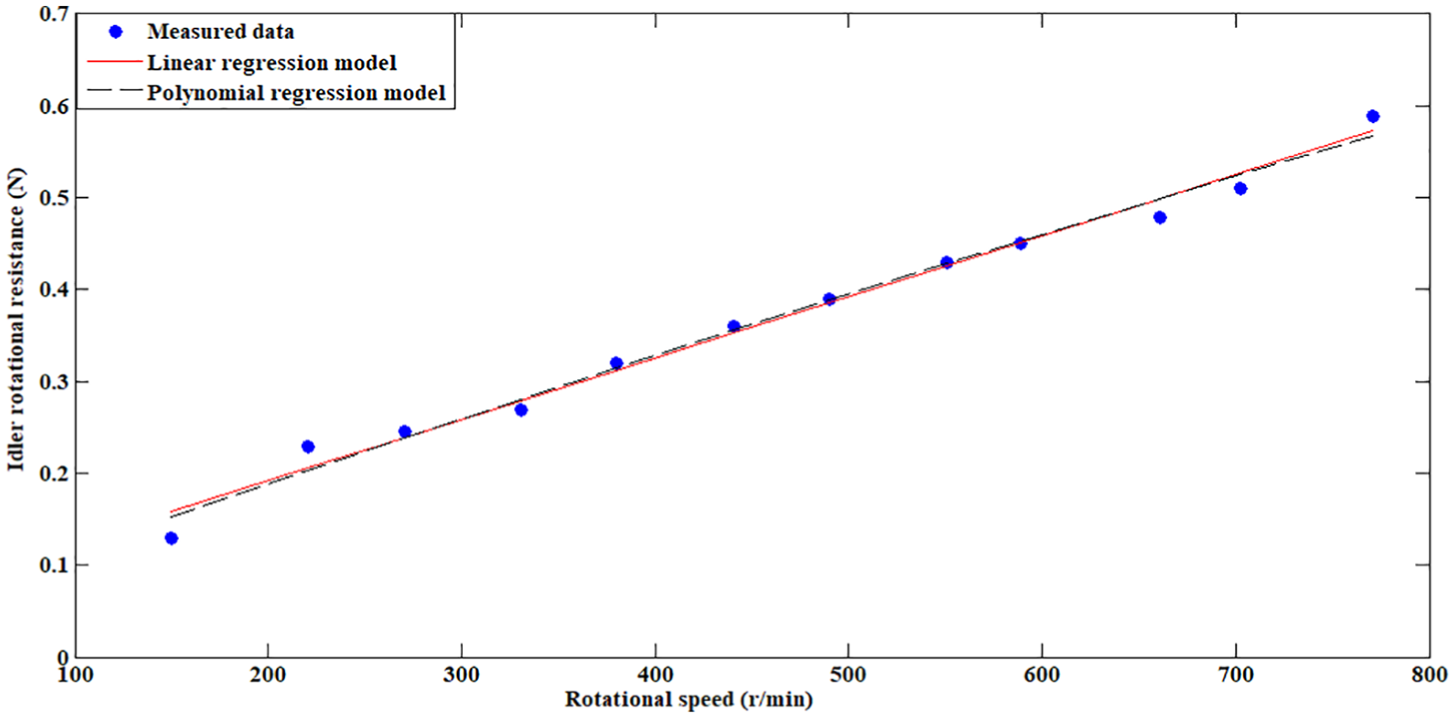
Regression of idler rotational resistance for radical force 370 N.
Regression of idler rotational resistance for radical force 470 N.
Besides, in order to analyze the connection between idler rotational resistance Fr and rotational speed n combined with radical force Pr according to measured values, different regression models contrasted with each other can be described by the following formula

Regression variables
Statistical evaluation of model
SSE: sum of squares due to error; RMSE: root mean square error.
In order to improve the reliability of the regression model, this paper also establishes other forms of regression model, such as
Analysis of regression model
As shown above, rotational speed n and radical force Pr have a compact link with idler rotational resistance. Analysis on the regression model of resistance has multiple significances, such as for optimal design of idler, designing control algorithm to achieve energy-saving (Figure 12).
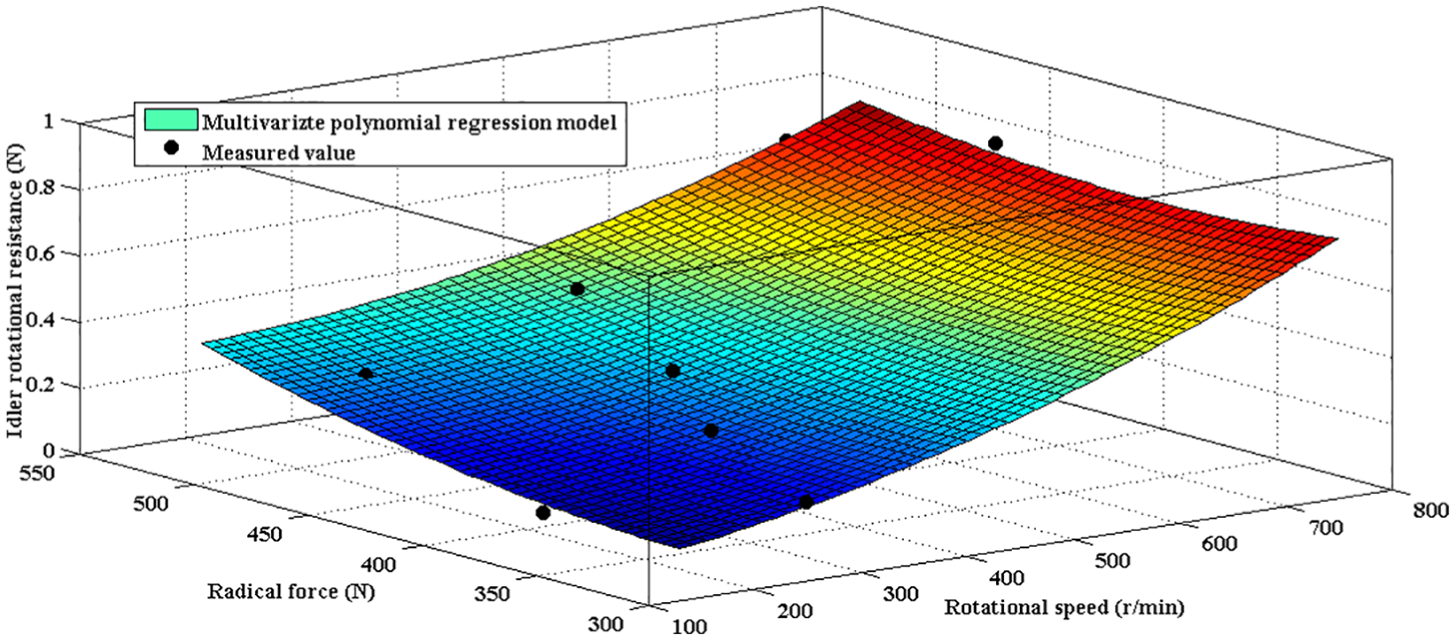
Multivariate polynomial regression model.
It is notable that taking effective technique can significantly reduce energy consumption. Compared with the effect of radical force on idler rotational resistance, the influence of rotational speed is principal that infers speed control is a better choice. On the contrary, in the case of this paper, the speed threshold is 400 rad/min. Once value of rotational speed exceeds threshold, the idler rotational resistance increases drastically that infers the key of speed control is to keep rotational speed vary within a certain range. Besides, considering that the running field is complex, the author conceives fuzzy speed control is a good control strategy which has strong anti-interference ability.
Conclusion
In this paper, the author mainly focuses on establishing appropriate regression model of idler rotational resistance. In a series of influential factors, the author mainly concentrates on radical forces and rotational speed, as they correspond to bulk solids and belt speed, respectively, which are the most valuable variables in the working field. The author also discusses the error of regression model; finally, on the basis of regression model, this paper suggests that utilizing fuzzy speed control scheme can achieve energy-saving efficiently. Some conclusions can be inferred by this paper.
In general, idler rotational resistance Fr is proportional to rotational speed n; however, the mathematical model between them is affected by radical force Pr. When idler is applied a lower radical force, the regression model is a linear function; nevertheless, once a higher radical force is applied, regression model becomes a concave polynomial function. Finally, these details reflect speed control can effectively achieve energy-saving.
By analyzing multivariate polynomial regression model, it indicates that among a series of influential factors, rotational speed plays a leading role. Considering monitoring rotational speed is more convenient than bulk solids in field, this conclusion infers that in order to achieve optimal energy-saving, it should primarily design a speed control algorithm.
The practical application effect of speed control is based on the control theory; as idler usually is working in a complex circumstance which is vulnerable to various disturbances, fuzzy control scheme does not require high precision of the regression model and multivariate polynomial regression model is practical and threshold can be convenient to be confirmed. Therefore, fuzzy speed control integrated with multivariate polynomial regression model should be advisable.
Footnotes
Declaration of conflicting interests
The author(s) declared no potential conflicts of interest with respect to the research, authorship, and/or publication of this article.
Funding
The author(s) received no financial support for the research, authorship, and/or publication of this article.