
Abstract
The bunching and deflection characteristics of low-power laser beam were investigated under electromagnetic field. On the basis of the Faraday effect, the cylindrical electromagnetic cavity was designed and implemented in the experiments. Several types of the magneto-optical elements were placed in the electromagnetic cavity individually. In the test of the deflection characteristics of low-power laser, the rotating angle, the polarization plane of linearly polarized light which passed through electromagnetic cavity, was measured by polarization extinction. We focus on the relation between the coil current and the rotating angle. The experimental data show that when the coil current varies in the range of 0–5 A, the rotating angles changed from 0° to 24.1°. Then, a fitting formula about the coil current and the rotating angle was obtained from the experimental data using the least square algorithm. The analysis shows that the rotating angle is proportional to the excitation current and the correlation coefficient is more than 0.9995. In order to study the beam bunching characteristics of low-power laser, the area of the laser facula was measured after the low-power laser passed through the electromagnetic cavity. The experiment data show that the laser facula area changes in a small range and the experimental data meet 3σ criteria.
Introduction
Lasers have been widely used in the fields of industrial manufacture, medical, and communications applications. Magneto-optical glass is a good candidate for application for multiple components (optical isolators, circulators, fiber switch, and so on) in fiber communication systems and high-power laser systems, owing to its outstanding optical performances.1,2 The laser with smaller divergence angle is more suitable for long distance transmission in the satellite laser communication system (SLCS). Although there are many researches on the improvement of laser performance parameters recently, these confine to the adjustment of auxiliary optical devices in the laser structure. Along with the people to improve the performance requirements of the laser beam, especially the strong demand of the high-beam laser beam, research method of poly laser has been extremely urgent. At present, the emission angle of high-precision laser is less than 0.1 mrad.3,4 However, the performance of this laser still cannot meet the requirements of long distance and high-precision measurement system.
Shen et al. 5 investigated the effect of the optical emission from laser-induced plasma plumes expanding across an external transverse magnetic field magnetically confined laser-induced breakdown spectroscopy. Waheed et al. 6 investigated laser-induced breakdown spectroscopy of ZrO2 plasma in the presence and absence of magnetic field. They observed the existence of magnetic confinement effects. Brady et al. 7 observed differences in laser-produced plasmas with and without a magnetic field using interferometric measurements. Phuc et al. 8 investigated that the effects of the intense laser field, the magnetic field, and the temperature on the magneto-optical absorption coefficient (MOAC) and full-width at half-maximum (FWHM) of absorption peaks. Li et al. 9 investigated the effect of steady magnetic field (0.8 T) on laser-ablated plasma by employing spectral- and temporal-resolved emission spectroscopy. Significant enhancements of the spectral lines for all neutral, singly, and doubly ionized species are observed.
Resulting from its outstanding magneto-optical performances, the magneto-optical glass has attracted more and more attention. Liu et al.10,11 investigated the optical performances of magneto-optical glass waveguides formed by multiple methods. Chen et al. 12 studied the factors that influence the Verdet constant of chalcogenide glasses. Linganna et al. 13 fabricated and characterized a lanthanum boroaluminosilicate glass fiber, for which Verdet constant is larger than those of the commercial coreless multimode fibers.
Furthermore, some scholars investigated the magneto-optic effect. Joman et al. 14 performed the dynamic measurements of transverse and longitudinal magneto-optic effects and magnetic properties of ferrofluids. Wang et al. 15 studied the reciprocity of Faraday effect in ferrofluid and its diluents using transmission light intensity method. They discovered that the rotation direction of the polarized light did not change in case of the direction of magnetic field was reversed. In addition, some researchers investigated noncontact measurement of glucose concentration using magneto-optic effect.16,17
In this paper, three different electromagnetic cavities with diameter of 6, 10, and 15 mm, respectively, are utilized to investigate the beam bunching and deflection characteristics of low-power laser under the electromagnetic effect. The relations among the coil current, the laser facula area, and the rotating angle of the polarization plane of linearly polarized light are explored to study the magnetic confinement effects.
Experiments theory and method
Magneto-optical rotation principle
Faraday discovered that when the light passed through matter in the direction of the lines of force of an applied magnetic field, the polarization plane of linearly polarized light rotated. This phenomenon is called the magneto-optical rotation effect, also known as Faraday effect. Mathematical description of Faraday effect is given in equation (1)
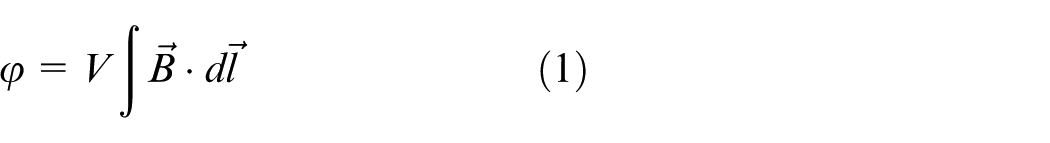
where
Experiment method of deflection characteristics
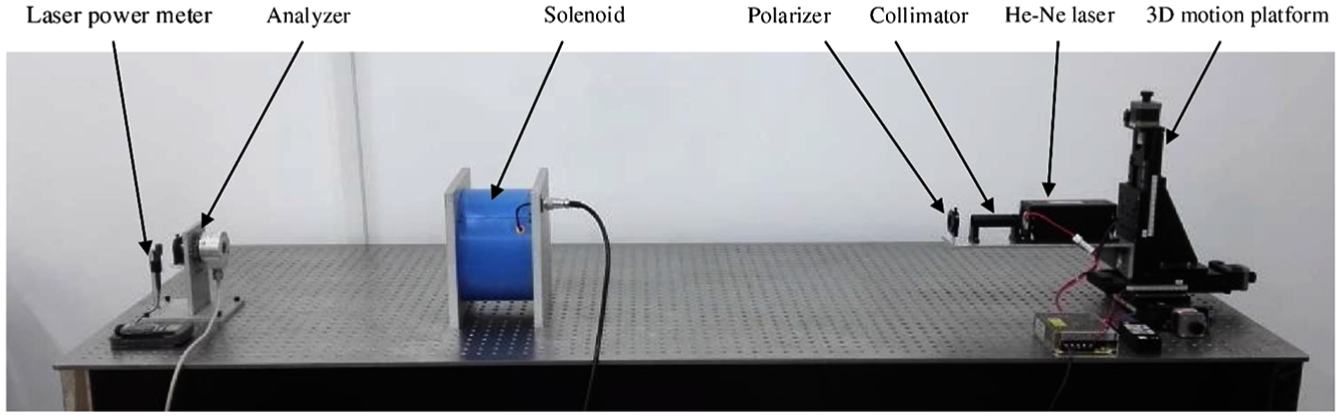
The angle of the rotating angle of the polarization plane of linearly polarized light is unable to be measured directly by sensor. In this paper, the rotating angle is measured by polarization extinction method. Therefore, the experimental device used in this study is shown in Figure 1. The measurement system is composed of He-Ne laser, collimator, polarizer, electromagnetic cavity, magneto-optic glass, analyzer, and laser power meter. In this paper, the laser type is 1107P, which has the characteristics of good measurement, low noise, stable high power, long service life, and so on. The operating wavelength of the laser is 632.8 nm, and the polarization mode is random.
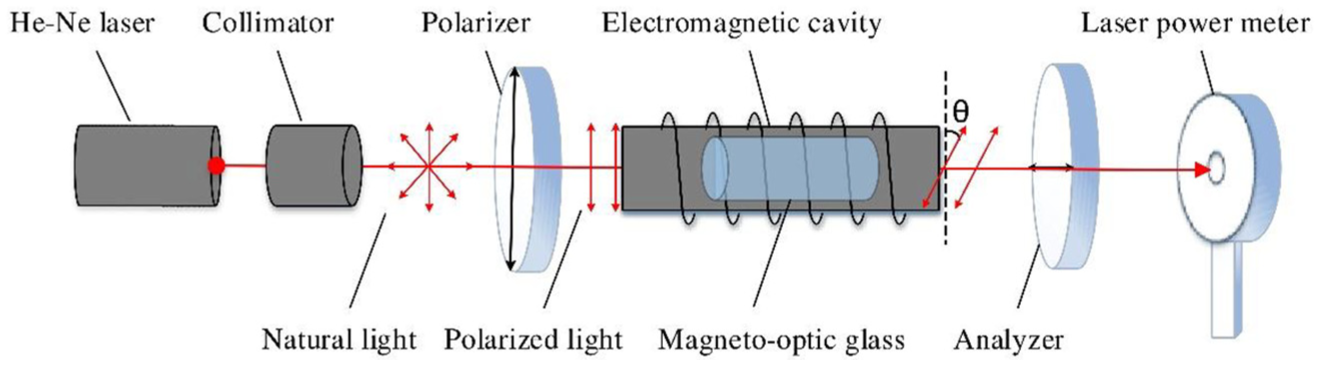
Schematic diagram of the experimental device for polarization extinction.
As shown in Figure 1, the polarizer is fixed in front of He-Ne laser and the analyzer is placed in front of the photosensitive surface of the laser power meter. The laser beam changes into linearly polarized light beam while it passed through the polarizer. First of all, there is no current in the coil of the electromagnetic cavity, the linearly polarized light passes through the magneto-optical glass and the analyzer. Then, it falls on the photosensitive surface of the laser power meter. We rotate the analyzer to make the laser power meter read the minimum and then record the position of the analyzer at this point. The DC excitation current in the coil of the electromagnetic cavity is supported to certain sizes, and the stable electromagnetic field appears inside the electromagnetic cavity. Since the linearly polarized light rotates with a definite angle under the electromagnetic effect, the reading of the laser power meter becomes large. We rotate the analyzer to make the laser power meter read the minimum once more and then record the position of the analyzer at this point. The difference between the position values of the analyzer is the rotating angle of the linearly polarized light. The direction of the magneto-optical rotating angle coincides with the direction of rotation of the analyzer.
Experiment method of beam bunching characteristics
In this section, we study the effect of electromagnetic fields on the laser emission angle, and the laser facula area as the characteristic value is used to analyze the beam bunching characteristics of low-power laser under the electromagnetic effect. So far, the facula area of low-power laser cannot be measured directly. Charge-coupled device (CCD) cameras are widely used to measure laser beam quality parameter.18,19 We find that when the laser beam is directly irradiated on the photosensitive surface of the industrial camera, the photosensitive element will go beyond the linear region and become saturated, and the laser facula area cannot be measured accurately.
According to above-mentioned facts, we decide to use the contrast method to measure the facula area of low-power laser. Figure 2 shows the schematic diagram of the experimental device for the facula area measurement.
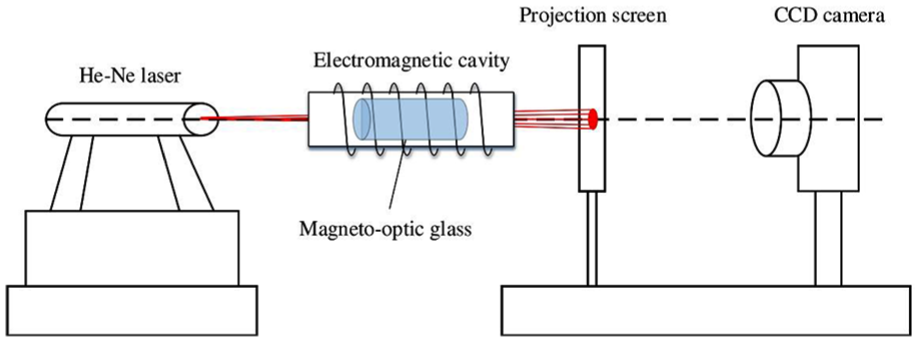
Schematic diagram of the experimental device for the facula area measurement.
As shown in Figure 2, a translucent projection screen is fixed at a distance of 160 mm in front of the CCD camera. We ensure the center of translucent projection screen and the center of the CCD camera at the same height in the experiment. In this way, the photosensitive element will not go beyond the linear region and become saturated, and the definite profile of the laser facula is maintained. CCD camera takes the facula projection on the back of the projection screen while the laser beam passes through the electromagnetic cavity and is projected onto the screen. Gray processing and binarization method are utilized to process the facula image. 20 And, the corresponding pixels of facula image are obtained by image processing program.
Calibration work is completed before the acquisition of laser facula image. A series of standard diameter wafers are pasted on the back of translucent projection screen. A fitting curve for the area and the corresponding pixels of wafers was obtained according to the experimental data. In the experiment, the laser facula area is calculated and obtained from corresponding pixels according to the fitting curve.
Simulation analysis of electromagnetic field
It is necessary to study the size and distribution of the electromagnetic field for the research on beam bunching and deflection characteristics of low-power laser under the electromagnetic effect. In this paper, we establish a magnetic field using solenoid utilizing energized DC current. The electromagnetic solenoid is shown in Figure 3. The solenoid is made up of 2943 turns of copper wire reinforced. The supporting frame of solenoid is made of hard aluminum alloy. The aluminum alloy, of which the relative magnetic permeability is about 1, barely has influence on the distribution of magnetic field. The middle part of the solenoid is an electromagnetic cavity, and the diameter of the electromagnetic cavity has three different specifications, namely,
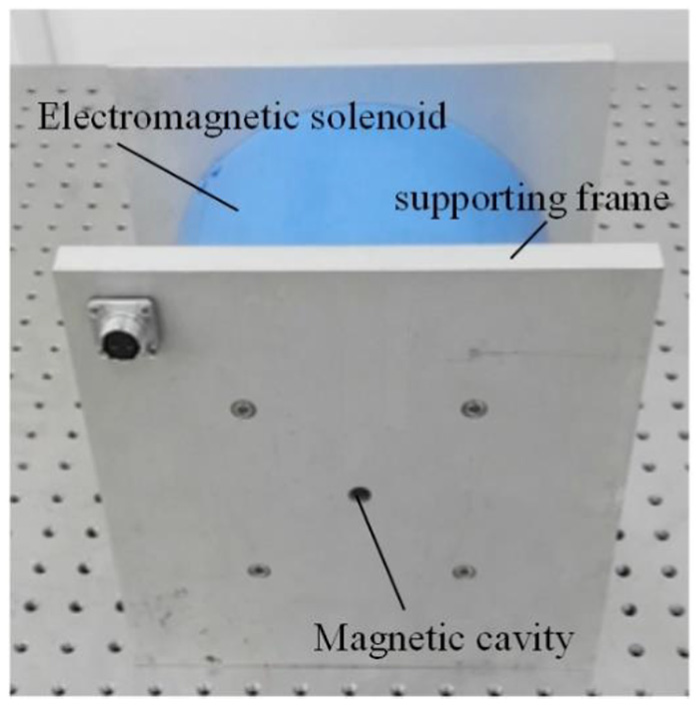
Electromagnetic solenoid.
In order to analyze the characteristics of the electromagnetic field accurately, finite element analysis (FEA) software is used to build the electromagnetic solenoid model. Taking an electromagnetic solenoid with a magnetic cavity diameter of 15 mm as an example, the FEA results of the magnetic cavity section are shown in Figure 4 when the coil passes through the 4 A current.
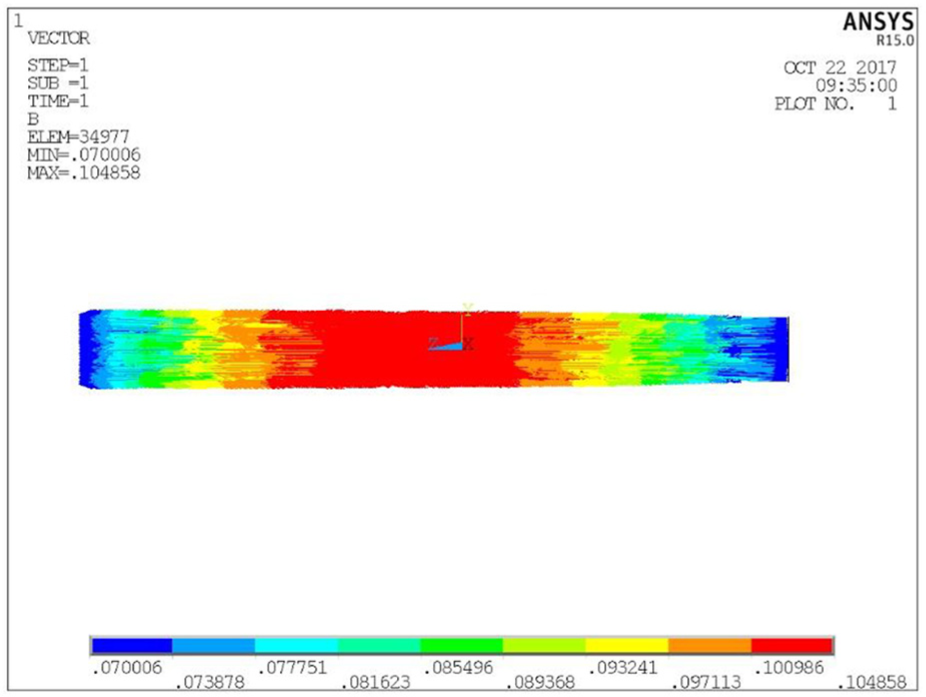
Finite element analysis of the magnetic cavity section.
Characteristic of solenoid magnetic field distribution is given below. As shown in Figure 4, in the small range of the center of the solenoid, the axial magnetic induction intensity varies little along the radial direction, and there is an approximate uniform region of the axial magnetic induction intensity. To observe the distribution of magnetic field on the axis of the electromagnetic cavity, the fitting curves of position x and B are plotted using the least square method based on data obtained by FEA, as shown in Figure 5. The data show that the difference between the maximum and minimum values of B is more than 34% in the whole electromagnetic cavity and is less than 9% in the 1/2 length range of center of the electromagnetic cavity.
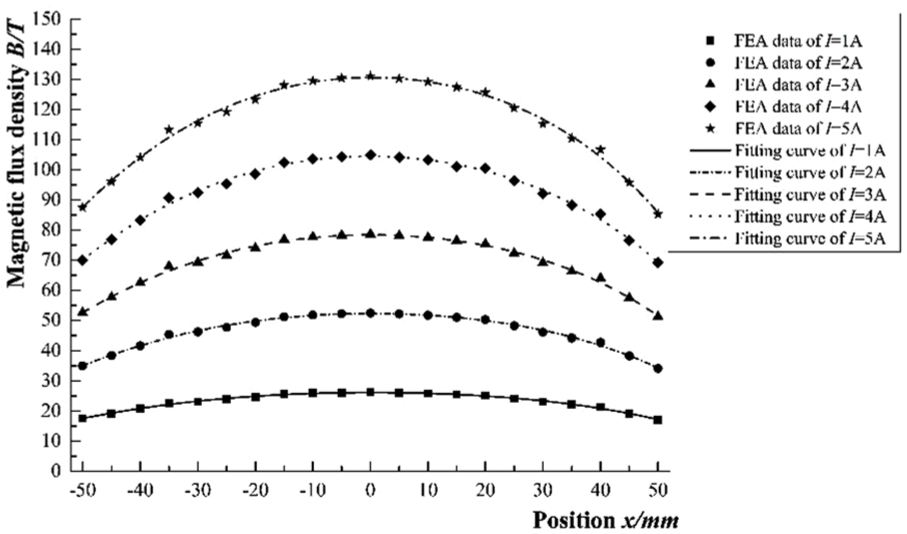
Variation trend between magnetic flux density and position.
Experiment and discussion
Experiment of magnetic field characteristics
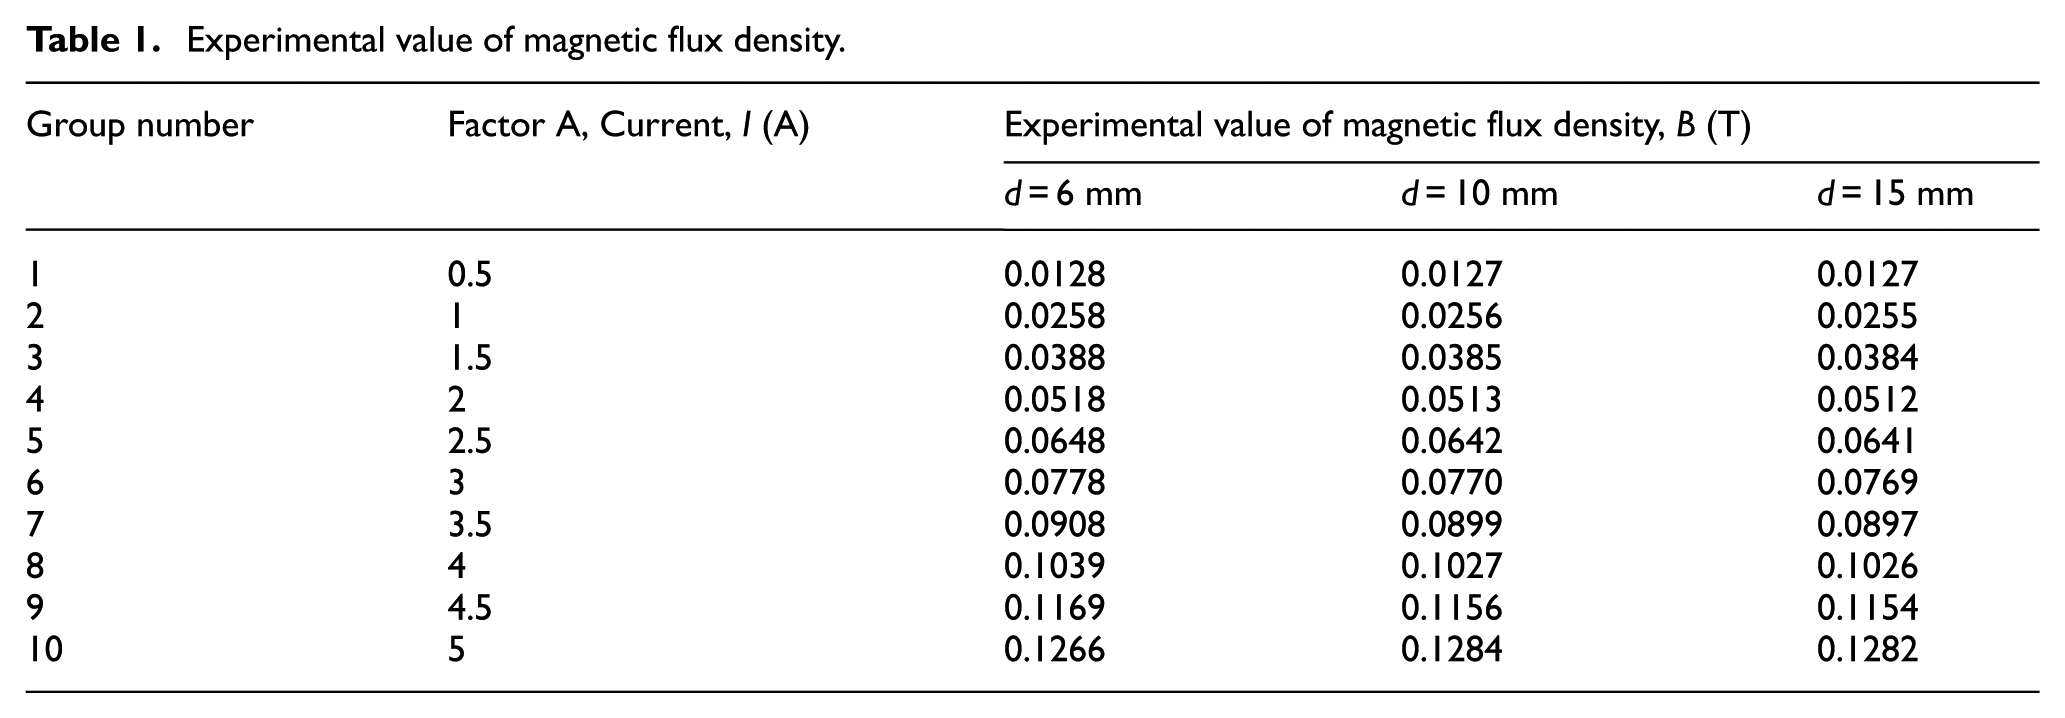
First of all, we study the effect of excitation current on the magnetic flux density at the midpoint of the electromagnetic cavity. We regulate the current I in the solenoid coil and then use the Tesla meter to measure the magnetic flux density B at the midpoint of the electromagnetic cavity. The experimental data are shown in Table 1.
Experimental value of magnetic flux density.
To observe the relation among excitation current and magnetic flux density, the fitting lines of I and B are plotted using the least square method, as shown in Figure 6. It shows that the magnetic flux density is proportional to the excitation current.
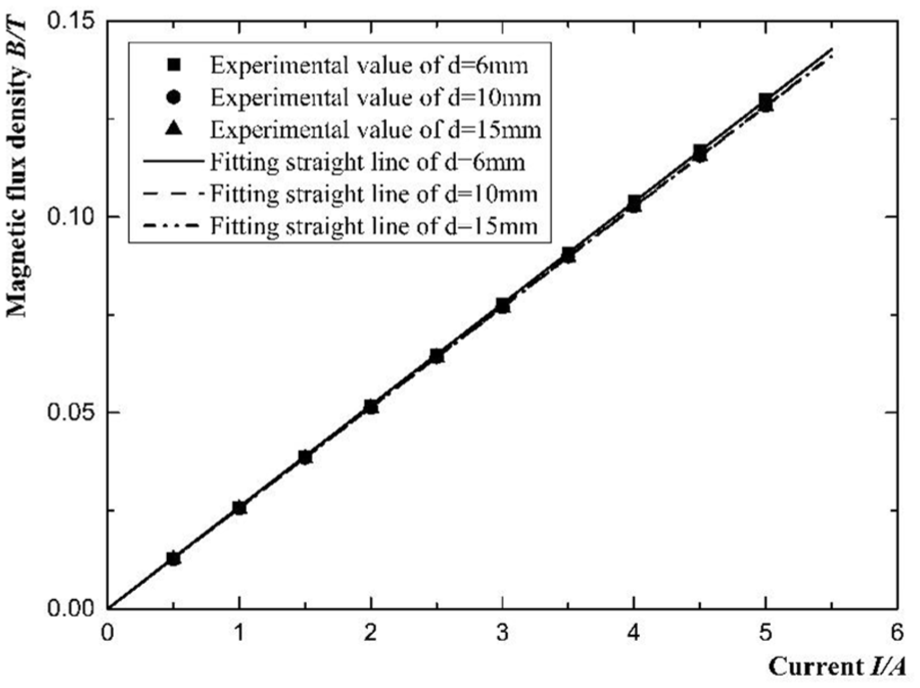
Variation trend between magnetic flux density and current.
Fitting formulas describing the relationship between among excitation current and magnetic flux density were obtained from the experimental data using the least square algorithm, which were given in equations (2)–(4), respectively


As shown in Figure 6, we conclude that the magnetic flux density increases proportionally with the coil current. And, the magnetic induction intensity decreases with the increase in the diameter of the electromagnetic cavity with the same current.
Experiment of deflection characteristics
Figure 7 shows the experimental device used to measure the rotating angle by polarization extinction method.
Experimental device of measuring angle of the rotating angle.
In this section, we study the effect of excitation current on the rotating angle of the polarization plane of linearly polarized light. As shown in Figure 8, the sizes of paramagnetic magneto-optical glass we selected are
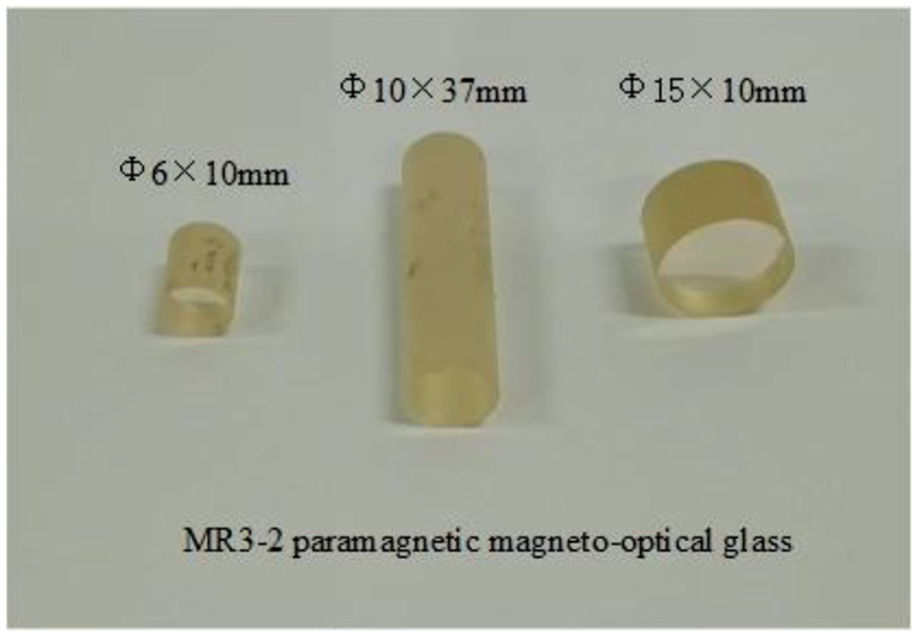
Paramagnetic magneto-optical glass.
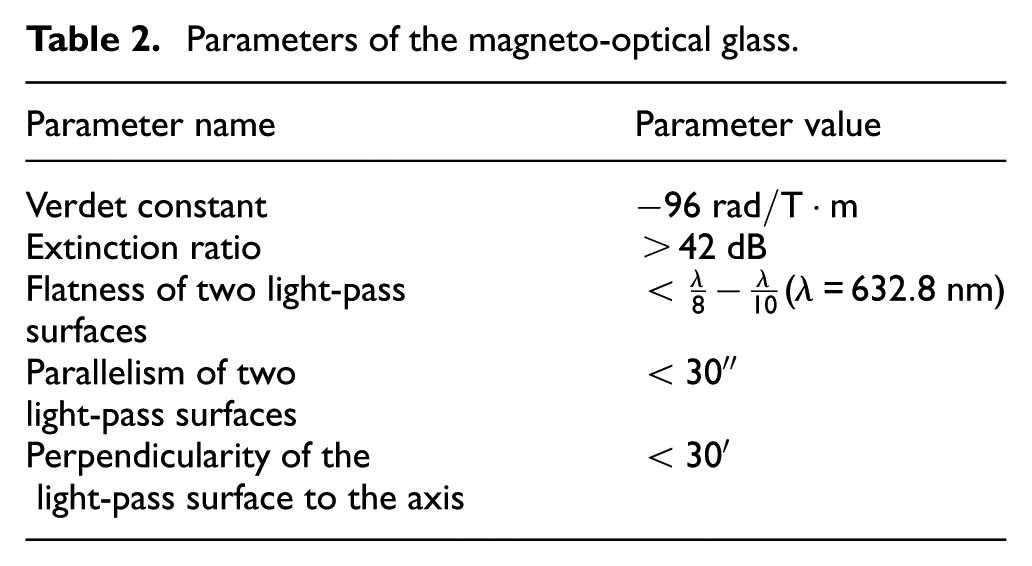
Parameters of the magneto-optical glass.
We place magneto-optical glass at the midpoint of the electromagnetic cavity on condition that the diameter of the glass is equal to the diameter of the magnetic cavity. The experimental data are shown in Table 3.
Experimental value of the rotating angle.
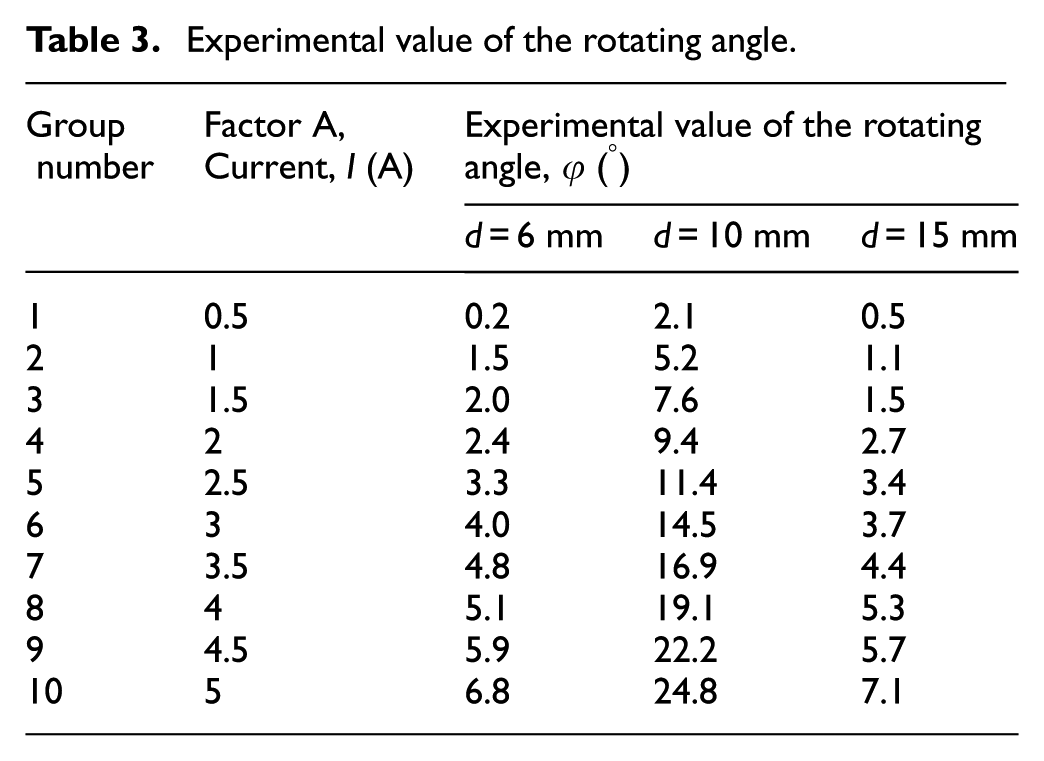
In the case of fixed values of the electromagnetic cavity diameter, the linear relation between the excitation current and the rotating angle is well described by Figure 9. As the excitation current I increases, the rotating angle


As shown in Figure 9, we come to a conclusion that the rotating angles of linearly polarized light increases proportionally with the coil current, and the rotating angles increase with the growth of the length of the magneto-optic glass, which is consistent with acknowledged Faraday effect. However, there is almost no difference in the rotating angles on the condition of different diameters of the magneto-optic glass.
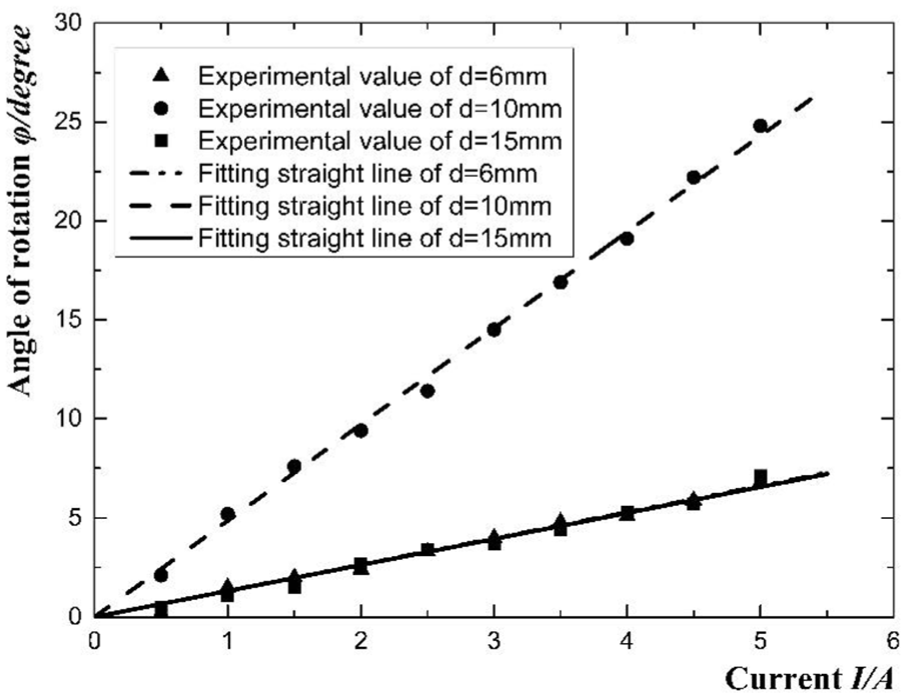
Variation trend between rotating angle and current.
Experiment of beam bunching characteristics
In this section, we study the effect of excitation current on the laser facula area. Figure 10 shows that the experimental device to measure the laser facula area.
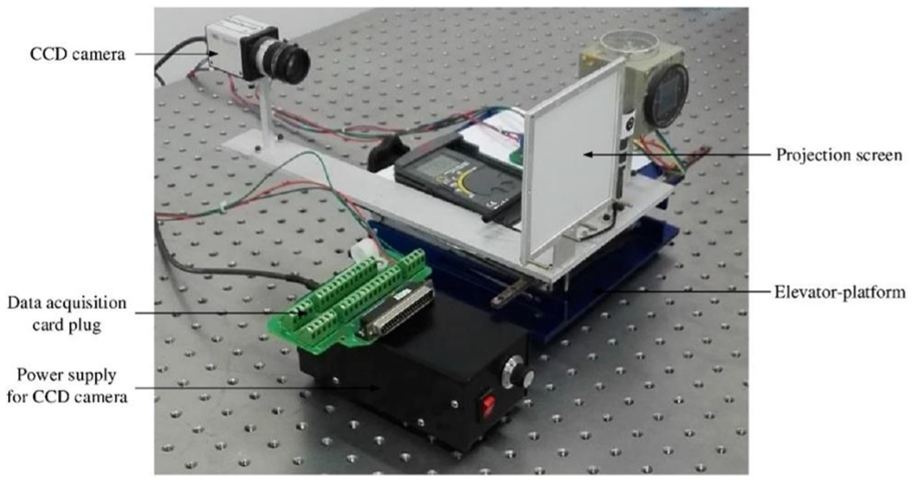
Experimental device to measure the laser facula area.
Before the facula area detection, we are supposed to complete the calibration of linear relationship between the pixel number of the laser facula and the facula area, and keep the laser optical axes, geometric center axis of magneto-optic glass and magnetic cavity, center of CCD industrial camera, and center of projection screen on a straight line.
Figure 11 shows the laser facula image taken by the CCD industrial camera. After the laser facula image is processed by the upper computer software, the gray scale image and the binarization gray scale image of the laser facula are obtained, as shown in Figures 12 and 13, respectively. The experimental data of the laser facula area are shown in Table 4.
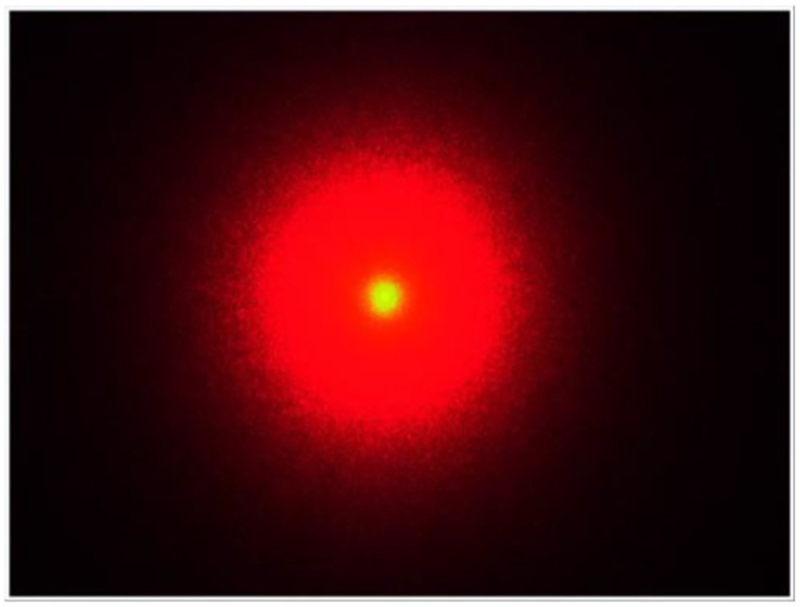
Laser facula image taken by the CCD industrial camera.
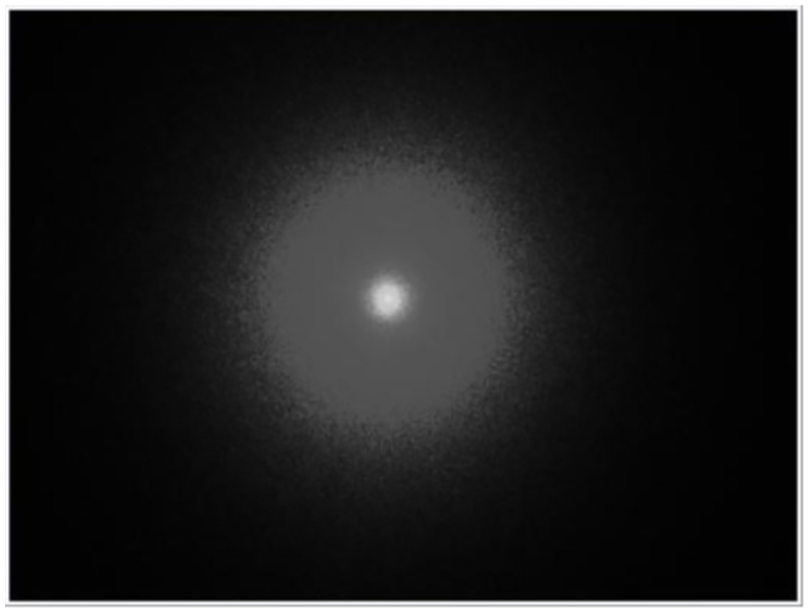
Gray scale image of laser facula.
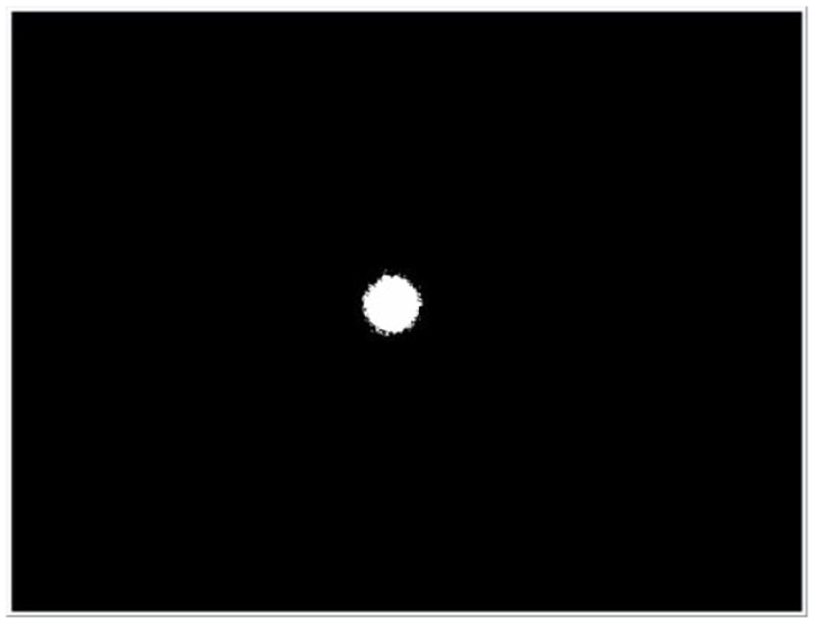
Binarization gray scale image of laser facula.
Experimental value of laser facula area.
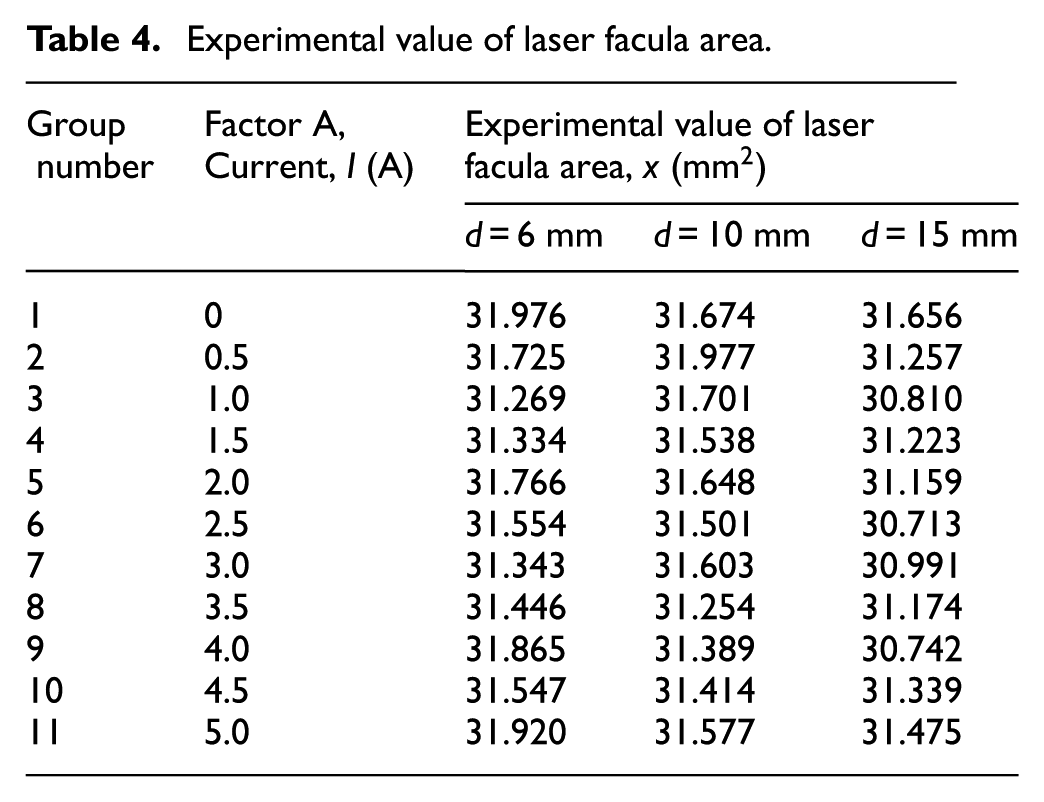
The analysis of experiment data shows that when controlling the current increase in the range of 0–5 A, the laser facula changed in a small range and there is no regular change. In order to observe the relation among current and laser facula area, the variation trend lines of I and x are plotted using polyline, as shown in Figure 14. It shows that there is no regular relation among current and laser facula area.
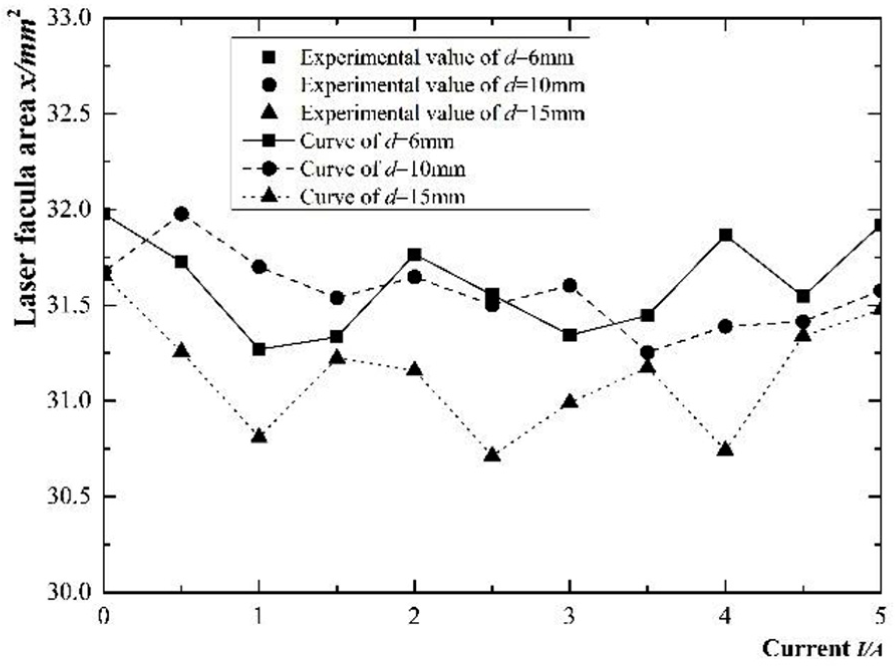
Variation trend between laser facula area and current.
The 3σ criterion (Pauta criterion) in statistics was used to test the validity of the experiment data and determine whether there is any singular value. In equation (8),
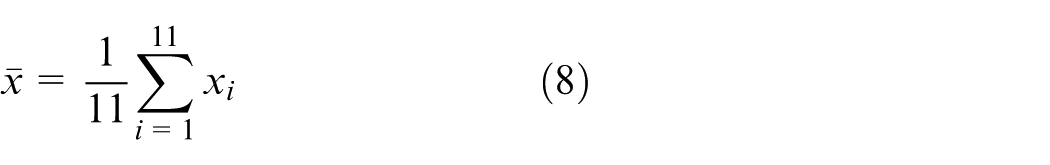

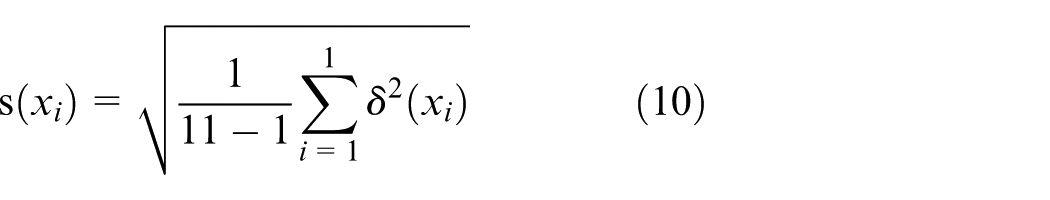

The calculation results show that the experimental data meet the 3σ criterion. In other words, the experimental data are valid and there is no singular value. It is most certain that the reason of that the experimental data changed in a small range is the power voltage fluctuation of low-power laser.
Conclusion
This paper is dedicated to studying the beam bunching and deflection characteristics of low-power laser subjected to the electromagnetic action. In the research on deflection characteristics of low-power laser, experimental data showed that when the current was in the range of 0–5 A, a linear relation was observed between angle of the rotating angle and current. In the research on beam bunching characteristics of low-power laser, though there is no regular change of the laser facula area when the current was in the range of 0–5 A, magnetic confinement effects need more deep investigation.
Footnotes
Declaration of conflicting interests
The author(s) declared no potential conflicts of interest with respect to the research, authorship, and/or publication of this article.
Funding
This work was supported by the National Natural Science Foundation of China (no. 51575277).