
Abstract
The reliable operation, dynamic performance analysis and control strategy research of a switched reluctance motor (SRM) require an online monitoring system to display and record its operating status. However, due to the large amount of data, the nonlinear electromagnetic characteristics and the harsh working environment of SRM, it is very difficult to monitor a SRM’s operation status in real time. In order to solve these problems, a new structure of the SRM monitoring system, which uses Digital Signal Processor (DSP) and the hardwired Transmission Control Protocol/Internet Protocol embedded Ethernet controller W5500, is presented in this paper. The W5500 and DSP’s direct memory access modules are employed for data capture and transfer to reduce the digital signal processing workload. The digital signal processing program is implemented by the hybrid programming method, which shortens the filtering time. Consequently, the DSP has sufficient resources to acquire multiple signals with a high sampling frequency and can adopt a more complex filtering algorithm, which enhances the accuracy and real-time performance of the system. Moreover, the amplitude–frequency characteristics of signals are analyzed. Then, the detection circuits and finite impulse response filters are designed to achieve the targeted acquisition and filtering. Besides, the impact of harsh environment on the system is reduced by adjusting the data transmission modes according to different working conditions. As a result, the scope of application of the system has been extended. The proposed system has a novel structure and strong practicability, which exhibits great guiding significance for the development of a SRM.
Keywords
Introduction
Switched reluctance motor (SRM) has the advantages of low cost, simple structure, wide speed range, excellent speed regulation performance and strong fault tolerance. It is widely applied in electric vehicle driving, aerospace, mining and other fields where reliability is highly demanded or the working environment is harsh. In such applications, once the motor drive system fails to run or stops running, it will not only affect the normal operation of the whole system, but also cause great economic loss and even endanger personal safety.1–5 Therefore, the reliability and stability of the SRM have attracted much attention. At the same time, due to the characteristics of SRM, such as multi-variable, strong coupling and nonlinear electromagnetic feature, it is very difficult to establish the nonlinear accurate model of SRM. Consequently, a large amount of experimental data is needed for SRM’s dynamic performance analysis, parameter optimization and control strategy research. Hence, a monitoring system is necessary for an SRM to display its operating status in real time and provide experimental data. However, the characteristics of SRM require the monitoring system to have a high sampling frequency and a high detection accuracy, and can adapt to the harsh working environment, which makes it very difficult to monitor the operating state of the SRM in real time.
At present, the development and research of motor monitoring systems mainly focus on the synchronous alternate current (AC) motor, asynchronous AC motor and direct current (DC) motor,5–10 but pay less attention to the SRM monitoring system.11–15 The traditional motor monitoring system is mainly a single-machine online monitoring system. That is, the voltage, current, speed and other parameters of a single motor are collected by microcontrollers (MCUs), digital signal processors (DSPs), field-programmable gate arrays (FPGAs) or data acquisition cards.9,16–21 Then the collected data are transmitted to an upper computer through RS232 or peripheral component interconnect (PCI).19,22–31 This kind of monitoring systems, the transmission distance of which is short, can only save the measured data in the specific upper computer. Thus, it is needed to equip one upper computer for each motor. Consequently, it results in the increased cost of the whole system. The sharing and utilization of data are also inconvenient. In addition, the upper computer usually requires the working environment to be relatively stable and tidy, which also narrows the scope of applications for the monitoring system.
With the development of technologies such as the Internet, computer and data processing, the monitoring and data collection of the motor through the network exhibit the advantages of low hardware cost, long transmission distance and convenient information sharing. Moreover, it is easy to realize remote data acquisition of multiple motors.9,16,17,32–36 Therefore, the motor monitoring technology began to evolve from early single-machine online monitoring to distributed monitoring and remote monitoring. So far, some motor monitoring systems can set up a local area network (LAN) through ZigBee chips to achieve distributed acquisition.16,17 Others adopt MCU and DSP to complete part of the Transmission Control Protocol/Internet Protocol (TCP/IP) stack or through Wi-Fi and other chips to achieve network connection.37–41 However, these methods are not suitable for the SRM monitoring system. In the work environment with severe electromagnetic interference (EMI), the network connection or data transmission of Wi-Fi, ZigBee and other wireless chips may be unstable. Moreover, using the lower computer to implement the TCP/IP usually occupies a lot of resources of the lower computer. As a result, the basic functions of the lower computer to complete data capture and digital filtering are inevitably affected. In consequence, the SRM monitoring system needs to access the Internet in a way that is stable and reliable and occupy fewer resources of the lower computer.
Aimed to address the problems of high sampling frequency, high precision requirement, poor working environment and lack of network access mode with low capacity and high reliability, a new structure of remote distributed monitoring system (RDMS) of SRM, which uses DSP chip TMS320F28335 and the hardwired TCP/IP embedded Ethernet controller W5500, is presented in this paper. The proposed system captures and transmits data through W5500 and DSP on-chip direct memory access (DMA) module. As a result, the amount of codes and interrupts of the DSP are both reduced. More importantly, this method releases the DSP workload, so the DSP has enough resources to capture the motor data with a high sampling frequency. In addition, the system implements the DSP program by means of hybrid programming, which shortens the digital filtering time. Therefore, a more complex digital filtering method can be implemented. It not only enhances the accuracy of the system, but also further improves the real-time performance. In order to accurately restore the signal waveform, this paper analyzes the amplitude–frequency characteristics of different variables of SRM and designs the hardware acquisition circuits and finite impulse response (FIR) filters according to their characteristics. The DSP will select the corresponding filter arrays for different signals during filtering and achieve targeted filtering to ensure the accuracy of the system.
On this basis, the proposed system can realize three data transmission modes that can be flexibly changed without increasing the cost of the system and changing the basic system structure. In other words, in the working environment with severe EMI, data are transmitted through the network cable to ensure its stability, whereas, in other environments with less interference, data can be transmitted in any of different ways. It contributes to avoiding the influence of harsh environment on data transmission. As a consequence, the application range of the monitoring system is greatly extended.
The main contribution of this paper can be summarized as follows:
At present, the sampling frequency of some monitoring systems is not very high. However, the system designed in this paper adopts the hybrid programming method, the DMA function of DSP and W5500 to reduce the DSP workload and shorten the DSP filtering time. Thereby, it not only realizes the function of collecting multiple parameters at a high sampling frequency, but also makes it possible to implement more complex filtering algorithms. In such way, the accuracy and real-time performance of the system are both enhanced as well.
Some current motor monitoring systems are less concerned with filtering, and SRM monitoring systems usually only use hardware circuits or simple digital filtering methods to filter. In this paper, both detection circuits and FIR filters, which are optimized according to different signals’ characteristics, are used to reduce the interference of noise on the signals. This makes the filtering process of the system more targeted and more accurate.
Compared with the traditional motor monitoring system, the RDMS of SRM has the advantages of longer transmission distance, lower implementation cost and the ability to collect multiple motor data. Besides, in contrast to the method of completing the TCP/IP stack by MCU and DSP, the proposed system employs hardware circuits to handle the TCP/IP. It further reduces the amount of codes and interrupts of DSP, increases the data transmission speed and enhances the stability of data transmission. Moreover, the employment of W5500 to access the Internet has a shorter development cycle, lower development cost and wider application scope, when compared to the methods through Wi-Fi or ZigBee to access the Internet.
In general, the RDMS proposed in this paper has a novel structure and a strong practicability, and can be used to accurately and stably monitor the real-time operation status of SRM, which is of great significance to the development and research of SRM.
Design of RDMS of SRM
To reflect the operating conditions of the SRM, the motor voltage, current and speed, as well as the rotor position and output torque of the SRM, are detected. In addition, the bus current of the switched reluctance motor driver (SRD) is also necessary to be obtained for some situations where the bus current is required to achieve phase current reconstruction, rotor position estimation and fault diagnosis. 42 Therefore, the SRM monitoring system needs to detect eight sets of variables, including the stator winding three-phase current, bus voltage, bus current, torque, speed and rotor position.
The lower computer in the system is used to complete the capture, filtering, calculation and data transmission of these signals. The upper computer is employed to acquire the data collected by the lower computer remotely, display waveforms and values of signals and establish independent files for different motors. The structure of the monitoring system is shown in Figure 1.
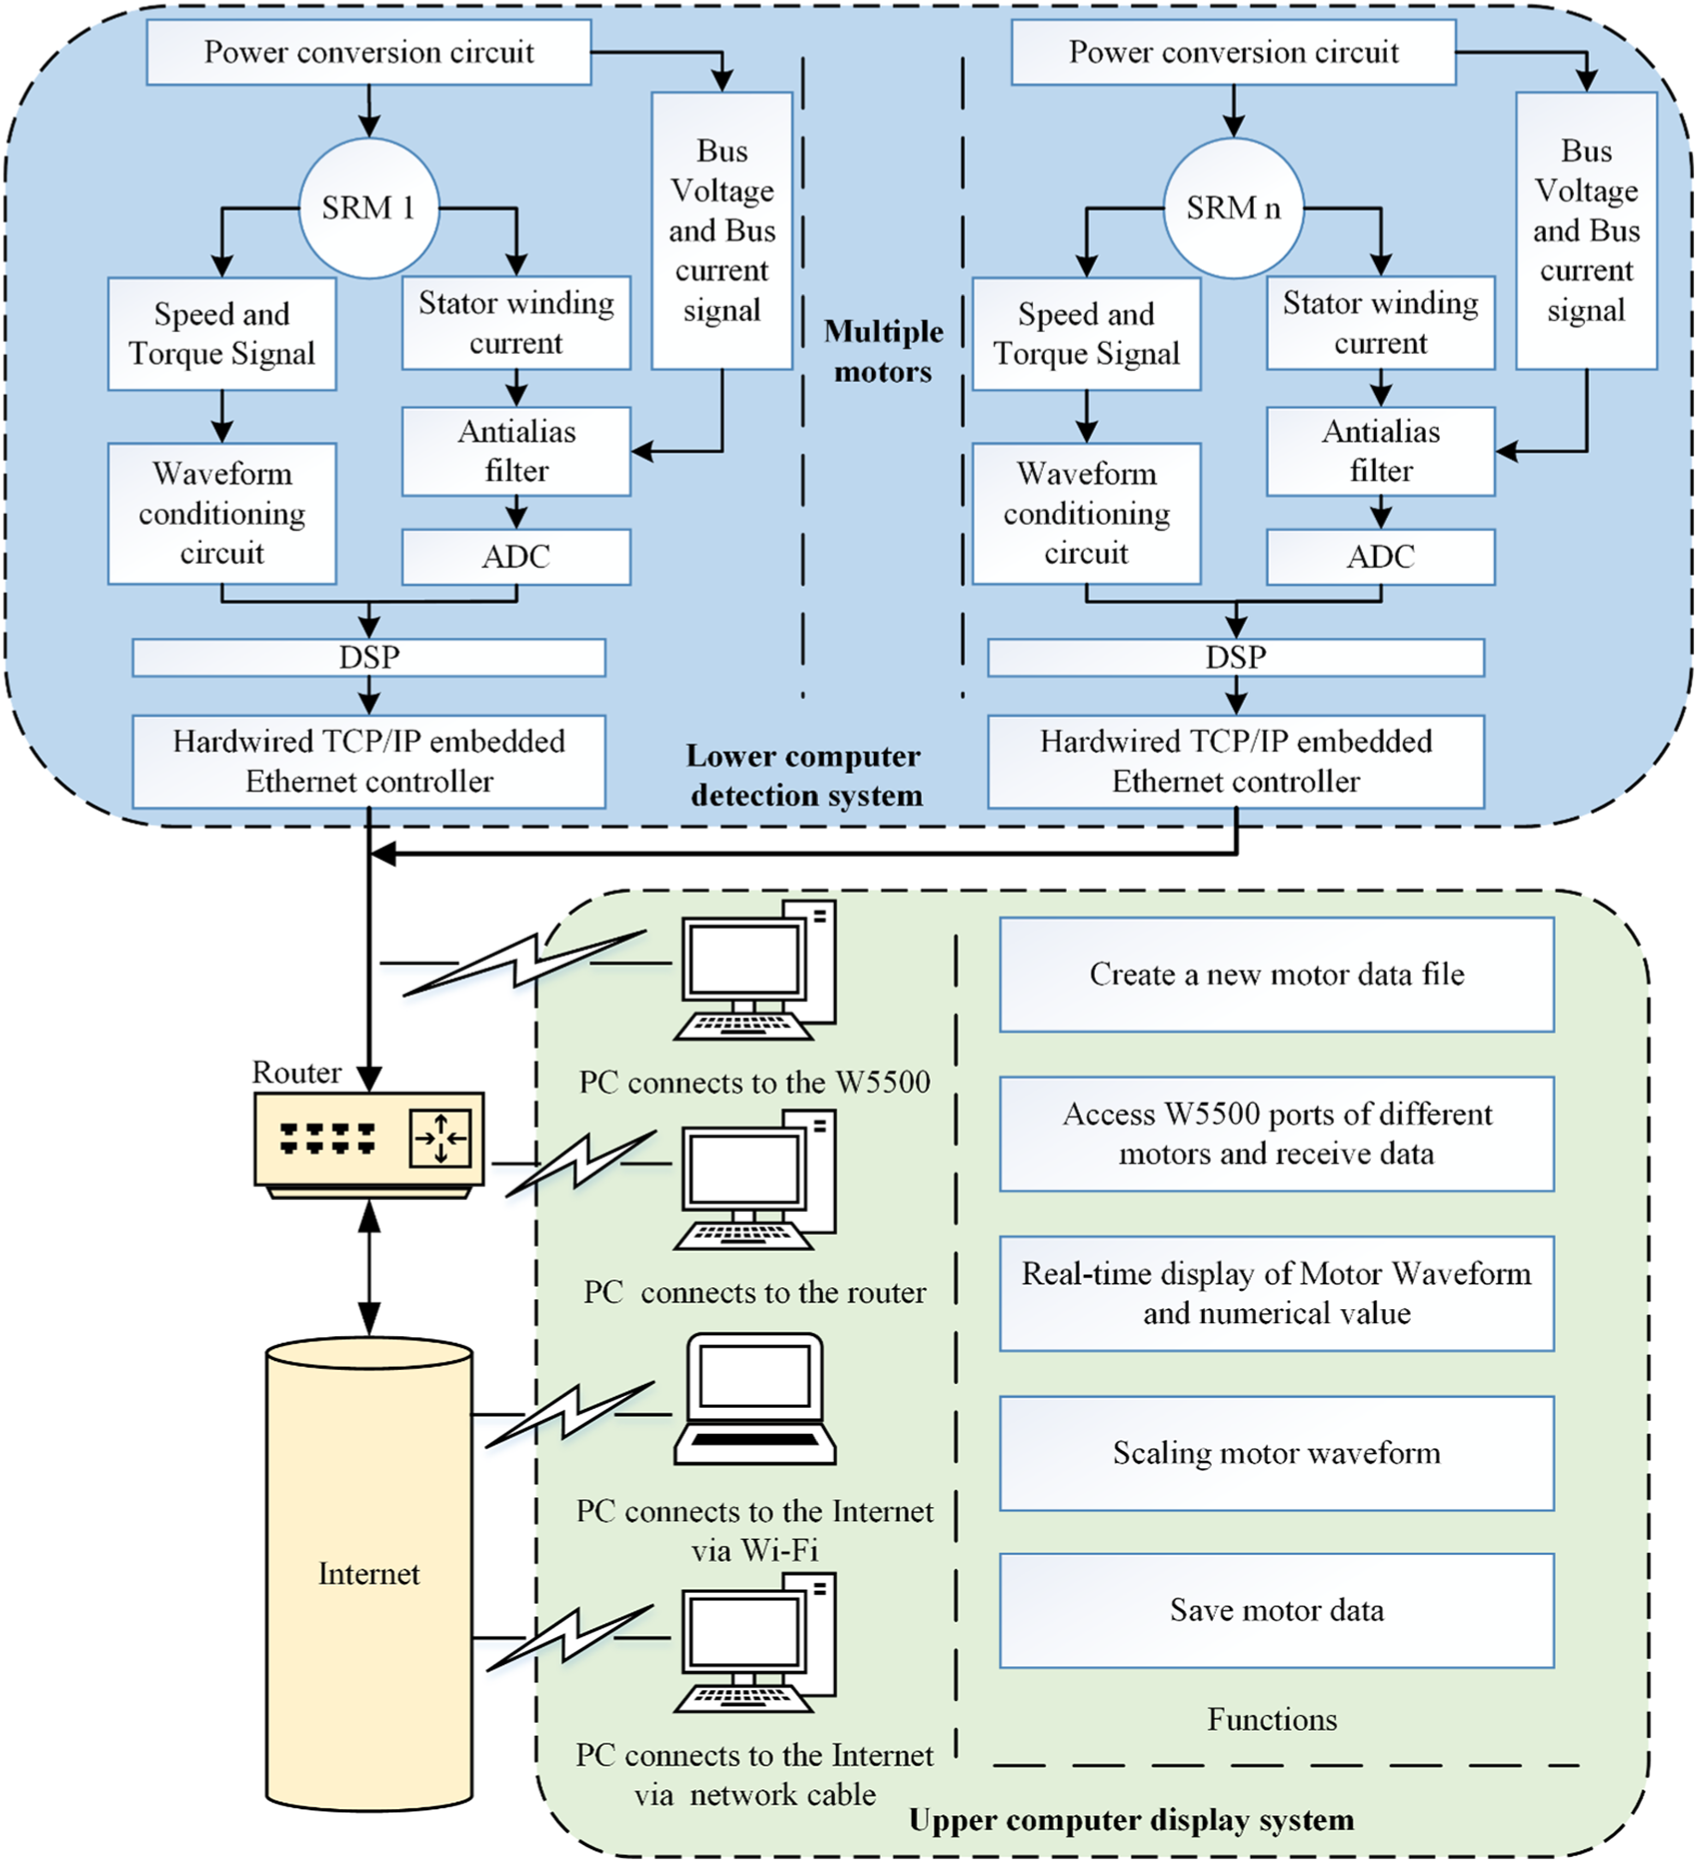
Diagram of the system.
As shown in Figure 1, in the lower computer detection system, voltage transformer and current transformer are adopted to collect voltage and current of the motor, respectively. After that, the collected analog signals are converted into digital signals by the analog-to-digital converter (ADC) after the anti-alias filter, and are captured by the DSP. The torque signal is generated by a torque sensor. The signal of rotational speed and rotor position is generated by an absolute photoelectric encoder. The output signals of torque sensor and photoelectric encoder are digital pulse signals. The digital signal conditioning circuit is designed to shape the signal and complete signal-level conversion, which plays an important role in avoiding the DSP misjudgment.
In addition to filtering through hardware, the system designs different FIR filters for voltage and current signals. The DSP selects the corresponding filter for different signals to ensure the detection accuracy.
To improve the real-time performance of the system, the DMA function of the DSP is used to transfer data. The DMA module can transfer data between the DSP external device and the DSP on-chip memory without CPU intervention.
The lower computer detection system communicates with the upper computer through W5500 which integrates the TCP/IP stack by hardware. The chip can implement TCP/IP without DSP assistance. Because the hardware circuit will not be subject to network attacks, the security of the entire detection system is enhanced.
Using the W5500, the system can realize the following three data transmission methods:
The W5500 connects the upper computer directly through the network cable to transfer data.
The multiple lower computer detection systems are connected to the router through their W5500 to form a LAN. And the upper computer can access the router through Wi-Fi or network cable to receive data.
By connecting the W5500 to a router which is already connected to the Internet, the upper computer can realize remote monitoring through the Internet.
Because the W5500 can implement multiple data transmission modes, the monitoring system can flexibly change the transmission mode to ensure the stability of data transmission in a complex environment. Compared to using Wi-Fi or ZigBee to access Internet, the employment of W5500 has a shorter development cycle, lower development cost and wider application scope of the monitoring system.
The upper computer software is developed by Borland Delphi 7 studio. Delphi 7 has a visual integrated development environment that uses an object-oriented programming language and a component-based development framework to quickly develop Windows applications.
The monitoring system allows multiple lower computer detection systems to access the LAN and allows multiple upper computers to receive data of different motors. Before receiving the data, the upper computer will establish separate data files for different motors to distinguish them.
The software can display the received motor waveforms and values in real time, calculate the efficiency and power of the motor and allow the user to zoom and save the waveform.
Implementation of RDMS of SRM
As shown in Figure 1, the whole system consists of two parts: the lower computer detection system and the upper computer display system. The implementation methods are, respectively, explained in this paper.
Implementation of the lower computer detection system
The amplitude–frequency characteristics of the signals detected by the system are not the same. Therefore, it is essential to design different acquisition schemes for different signals. On this basis, the device can be reasonably selected and the corresponding hardware circuits and digital filters can be designed. In this paper, the phase current signal is taken as an example to briefly describe the amplitude–frequency characteristic analysis method of the variables to be measured.
The SRM has three basic control modes. That is, chopped current control (CCC), pulse width modulation (PWM) and angular position control (APC). The phase current waveform diagrams are shown in Figure 2(a), (c) and (e) when SRM is, respectively, controlled by CCC, PWM and APC. Figure 2(b), (d) and (f) show their corresponding diagrams of amplitude–frequency characteristics.
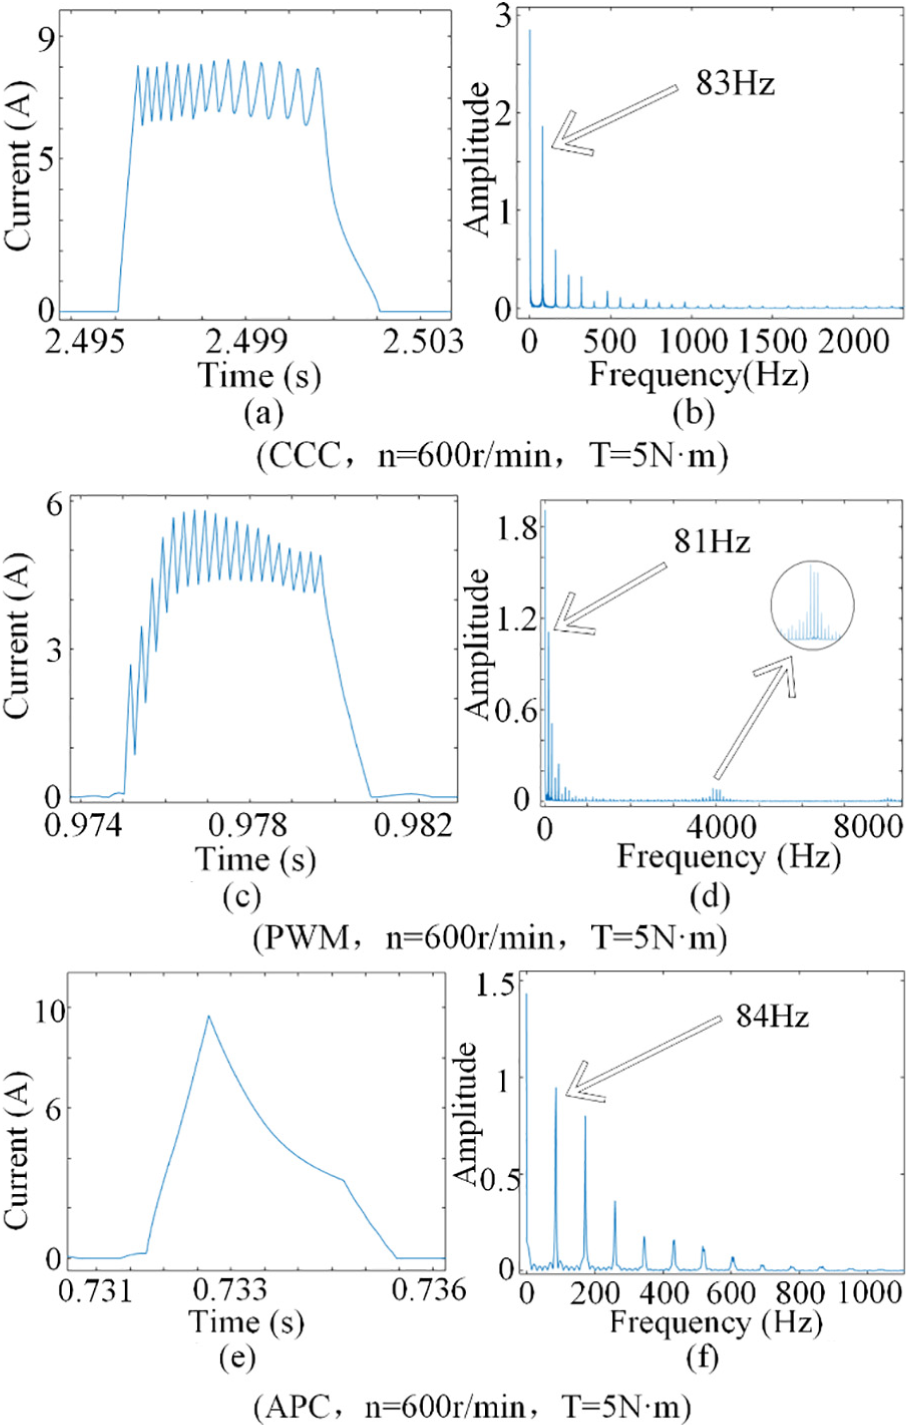
Diagram of simulated phase current waveform and its amplitude–frequency characteristic: (a, c, e) phase current and (b, d, f) frequency spectrogram.
From Figure 2, the following conclusion can be drawn. That is, under different control modes, the phase current waveform and its amplitude–frequency characteristic are different. For example, in the CCC mode, as shown in Figure 2(a), the phase current chopping frequency is not fixed. In the PWM mode, the phase current contains a component near the switching frequency, as shown in Figure 2(d). In the APC mode, the phase current contains only the fundamental frequency component and its even components except for the DC component, as shown in Figure 2(f). In addition, the fundamental frequency of the phase current is determined by the motor speed and the structure of the motor itself.
When the SRM is running stably, the phase current fundamental frequency fra has the following relationship with the motor speed n
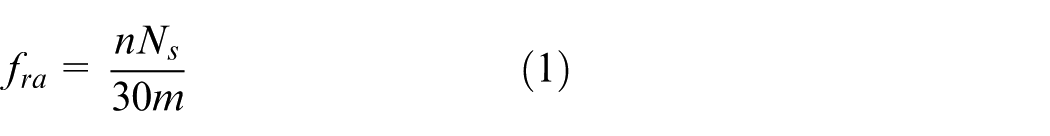
where NS is the number of poles of the stator and m is the number of motor phases. When the motor runs stably at 600 r/min, fra can be determined by equation (1) as 80 Hz, as shown in Figure 2(b), (d) and (f).
Table 1 lists the main ranges of amplitude and frequency of phase current, torque, bus voltage and bus current when the prototype is controlled by the PWM method with a switching frequency of 8 kHz.
Amplitude–frequency characteristics of SRM1 partial variables.
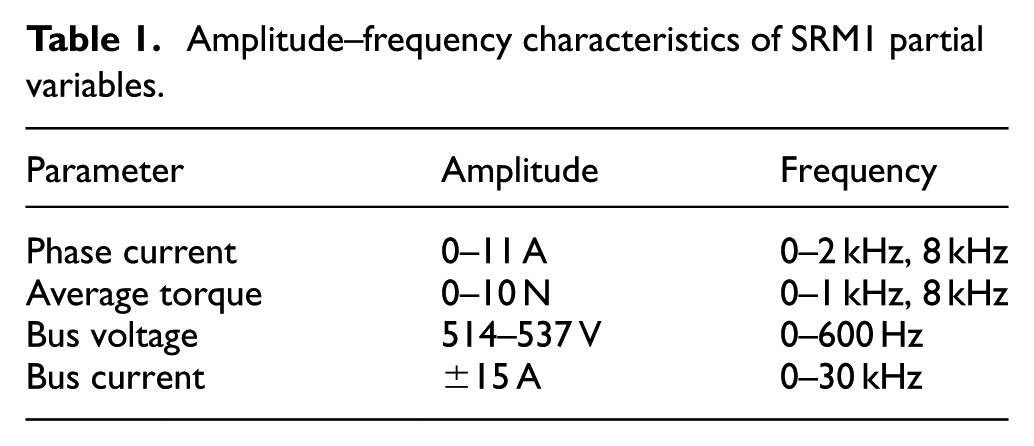
From the table, it can be found that the amplitude–frequency characteristics of different SRM variables are not the same. Moreover, the amplitude–frequency characteristics of the same variable under different control modes are also different. As a result, these differences will inevitably affect the selection of the sampling frequency and sensor, the parameter setting during the filter design and other aspects. Therefore, the actual amplitude–frequency characteristics of the motor should be fully considered in the implementation of the detection system.
The signals detected by the system can be divided into two types, including the analog signals generated by voltage and current sensors, and the digital signals generated by torque sensors and photoelectric encoders. Therefore, the phase current signal and the torque signal are chosen as the representatives of the analog signal and the digital signal, respectively, in this paper to briefly describe the implementation method of the lower computer detection system.
Main device selection of the lower computer detection system
In the monitoring system, the accuracy and reliability of sensors directly affect the operation of the entire monitoring system. Therefore, it is necessary to select a suitable sensor according to the characteristics of the SRD system parameters.
Through the comprehensive considerations of the amplitude–frequency characteristics of phase current and the response time, accuracy and stability of the current sensor, LEM’s LA25P is selected to collect the phase current. The transducer is a closed-loop multirange current transducer using the Hall effect, and its main characteristics are listed as follows: supply voltage: ±15 V; typical accuracy: ±0.5%; response time: <1 μs.
A torque sensor is generally used to detect the motor torque signal. The accuracy of the torque detection mainly depends on the measurement accuracy and the response time of the torque sensor. This system selects a KR-803 dynamic torque sensor. It has a response time of only 100 μs, a measurement range of ±20 N m and a measurement accuracy of ±0.1% F S. It can be seen from Table 1 that this torque sensor can fully reflect the change of the prototype torque. The remaining characteristics of this torque sensor are listed as follows: zero temperature drift: 0.2% F S/10 °C; supply voltage: ±15 V; output square wave signal: 5–15 kHz/0–10 V. The input torque and the frequency of output signal of the sensor have the following relationship

where T is the motor torque and f is the frequency of the sensor output square wave.
In the lower computer detection system, the DSP needs to process a lot of convolution operations during filtering, which requires the DSP to have a separate Multiply and Accumulate (MAC) unit and a fast processing speed. At the same time, in order to ensure that the data transmission process does not occupy a large amount of resources of the DSP, the DSP is required to have the DMA function. Therefore, the TMS320F28335 manufactured by TI is chosen as the processor. It has a high-speed processing capability of 150 MHz and includes a 32-bit single-precision floating-point processing unit for 32-bit MAC operations, two multichannel buffered serial ports (McBSPs) and six DMA channels. These abundant resources facilitate the implementation of software filtering and data transmission.
In the analog-to-digital conversion, the accuracy and sampling rate of the ADC affect the accuracy and real-time performance of data acquisition. The system uses TI’s ADS8668 as the ADC. The ADS8668 is a 12-bit 8-channel low-power A/D converter, operating at a throughput of 500 ksps. The device has serial peripheral interface (SPI) and outputs a 3.3 V voltage signal.
Design of the detection circuit
In the detection system, the detection circuit needs to complete the signal acquisition, transformation, isolation, shaping and so on. The quality of the circuit affects the accuracy of the collected data. The schematic diagram of the lower computer detection system is shown in Figure 3.
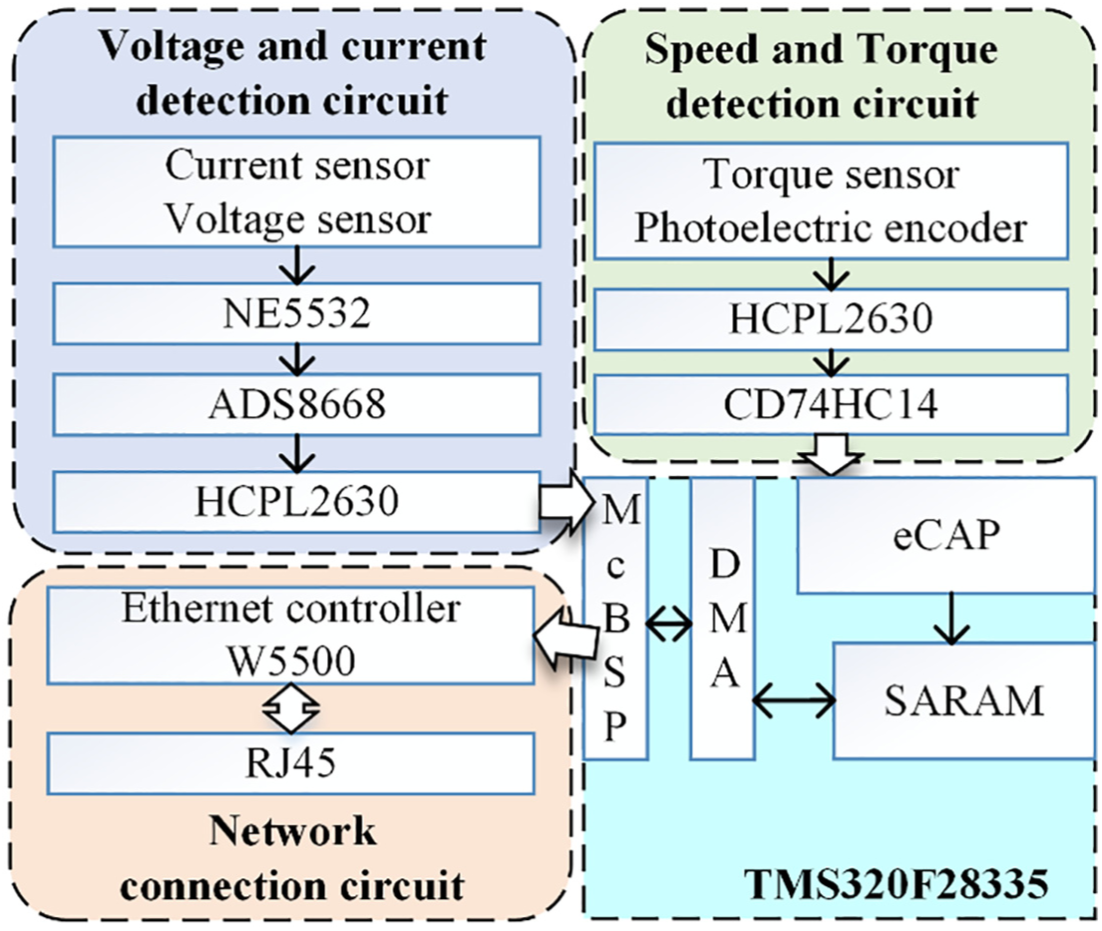
Diagram of the lower computer detection system.
To avoid aliasing after sampling and filter out high-frequency noise in the signal, an anti-alias filter is needed between the current sensor and the ADC. The system uses an internally compensated low-noise operational amplifier NE5532 to form a second-order low-pass filter, which acts as an anti-alias filter with a cutoff frequency of 15 kHz. Since the output signal of ADC is 3.3 V, the ADC can be connected to the DSP using the HCPL-2630 optocoupler chip for electrical isolation.
The square wave signals need to be shaped and reduce its voltage before being captured by the DSP. This process is implemented to avoid DSP misjudgment. The conditioning circuit has the following functions:
It uses the high-speed integrated logic gate optocouplers of type HCPL-2630 to achieve electrical isolation between the input and output signals. Since then, it converts the 10 V pulse signal into a 3.3 V pulse signal for the DSP to capture.
The high-speed CMOS logic hex inverting Schmitt trigger CD74HC14 is used to build a Schmitt shaping circuit to shape the distorted signal into a regular square wave signal. The schematic diagram of the speed and torque detection circuit is shown in Figure 4.
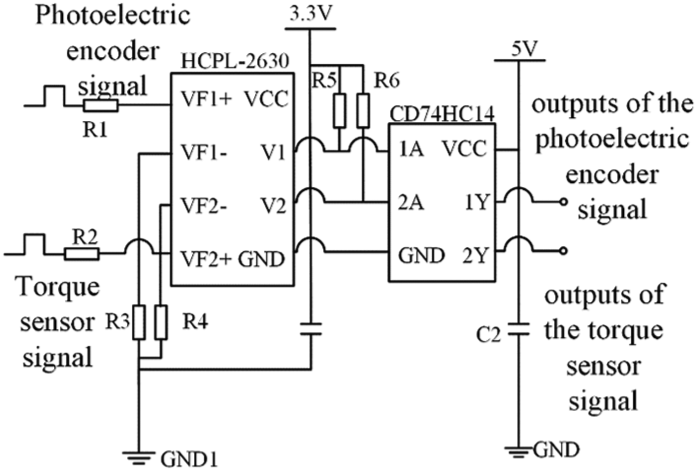
Diagram of the torque and speed detection circuit.
Design of the digital filter
The signals generated by the sensors have noises that do not characterize the operating state of the motor due to internal or external interference. In the data acquisition process, in addition to eliminating or suppressing noise through hardware, software digital filtering is needed to minimize noise interference for the system. The FIR digital filter is widely used in the case of strict phase requirements, owing to its advantages of no feedback loop, simple structure, strict linear phase and stability. The transfer function equation of the FIR digital filter is
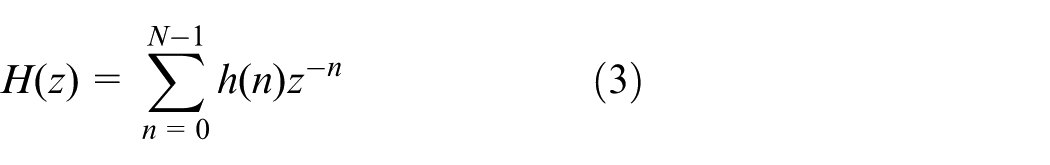
From equation (3), the characteristics of the FIR digital filter can be changed by changing the value of h(n). Therefore, the DSP can achieve the targeted filtering by replacing the filter array.
Since a lot of MAC operations need to be processed by DSP during filtering, it is necessary to limit the order of the FIR filter to ensure the real-time performance of the detection system. In other words, the DSP filtering time Tf should be smaller than the data acquisition time TS. Since the DSP is mainly used for MAC operation during the filtering, the filter time Tf is defined as
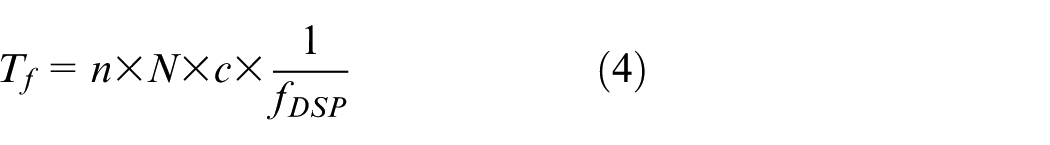
In equation (4), n represents the length of the input signal, c denotes the number of clock cycles required to complete a MAC operation, fDSP represents the DSP operating frequency and N represents the filter order. The data acquisition time is defined as
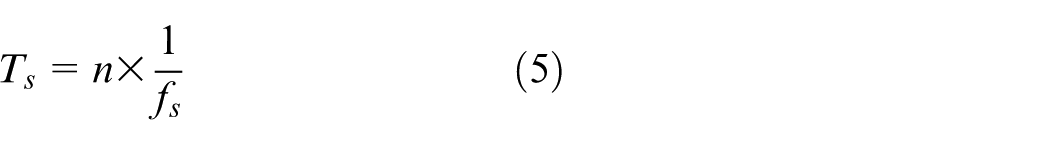
In equation (5), fS represents the sampling frequency. As for phase current, it is 30 kHz. Take fDSP = 150 MHz and fS = 30 kHz. If

Therefore, to ensure the real-time performance of the system, the product of N and c cannot exceed 5000. Table 2 shows the number of instruction cycles required to implement the MAC operation by different methods in the CCSV5 environment when TMS320F28335 is adopted as DSP.
The instruction cycle required to implement the MAC operation by different methods.
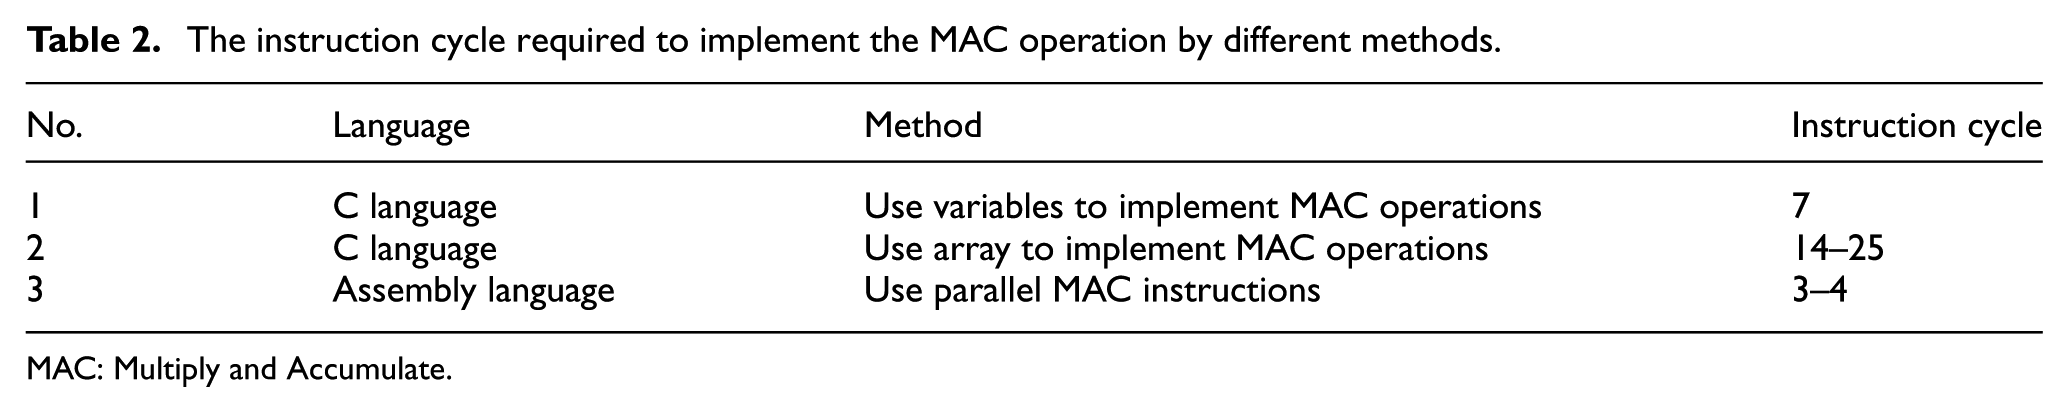
MAC: Multiply and Accumulate.
It can be found that method 1 is easy to implement and the operational speed is high. However, when the filter order is high, different names need to be set for all variables. It makes the DSP program particularly lengthy, takes up a lot of memory and is difficult to use for the convolution operation. Method 2 is also easy to implement, but the operation speed is the slowest among all the three methods. Moreover, using this method will occupy a lot of DSP resources. Method 3 is the fastest, but it is more difficult to write DSP programs completely in assembly language. Therefore, this design uses the hybrid programming method to achieve DSP data acquisition and signal filtering function. More specifically, the filtering operation is written in assembly language, but the rest are written in C language. When clock cycles are kept below 5, N can be set as large as 1000. Thereby, with the hybrid programming method, not only the real-time performance of the system is improved, but also the design of the FIR filter is more flexible.
This paper uses the FDATool in MATLAB to design the FIR filter. After setting the parameters of the FIR designer according to the data in Table 1, the characteristic diagrams of the FIR filter designed for the stator winding current can be obtained and are shown in Figure 5.
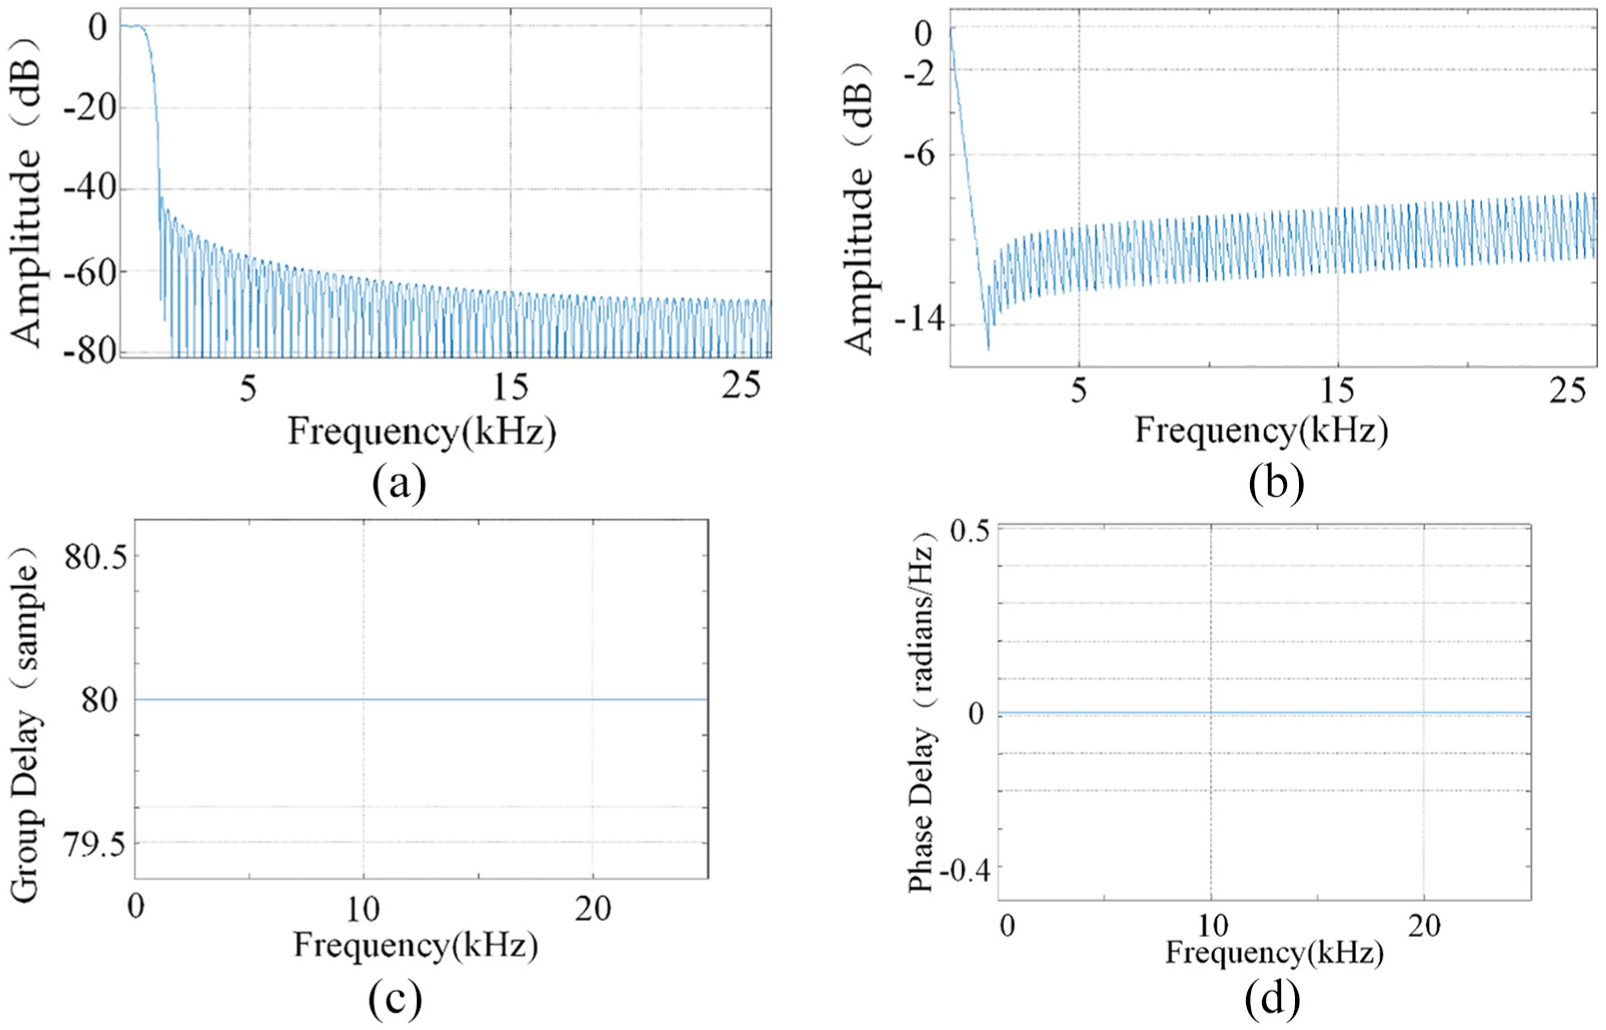
Diagram of filter characteristics: (a) amplitude response of filter, (b) phase response of filter, (c) group delay of filter and (d) phase delay of filter.
Figure 5(a) shows the filter amplitude response. The system increases the response of the filter in the passband by adding a Kaiser window when designing the FIR filter. Figure 5(b) shows the phase response of the filter. It indicates that the phase response of the filter is linear in the passband. Figure 5(c) and (d) shows the group delay and phase delay of filter banks. It can be clearly seen that the designed FIR filter has the same delay for all the frequency components, which ensures that the filtered signal waveform will not distorted. Since the FDATool gives the group delay value, the signal waveform can be adjusted by the DSP program to eliminate the group delay effect.
The above-mentioned filter is used to filter the stator winding current of the SRM controlled by the PWM method (switching frequency is 8 kHz). After eliminating the group delay, the original waveform and the filtered waveform are shown in Figure 6. It can be seen that the filtered waveform reflects the characteristics of the original waveform and eliminates the interference of noise on the signal.
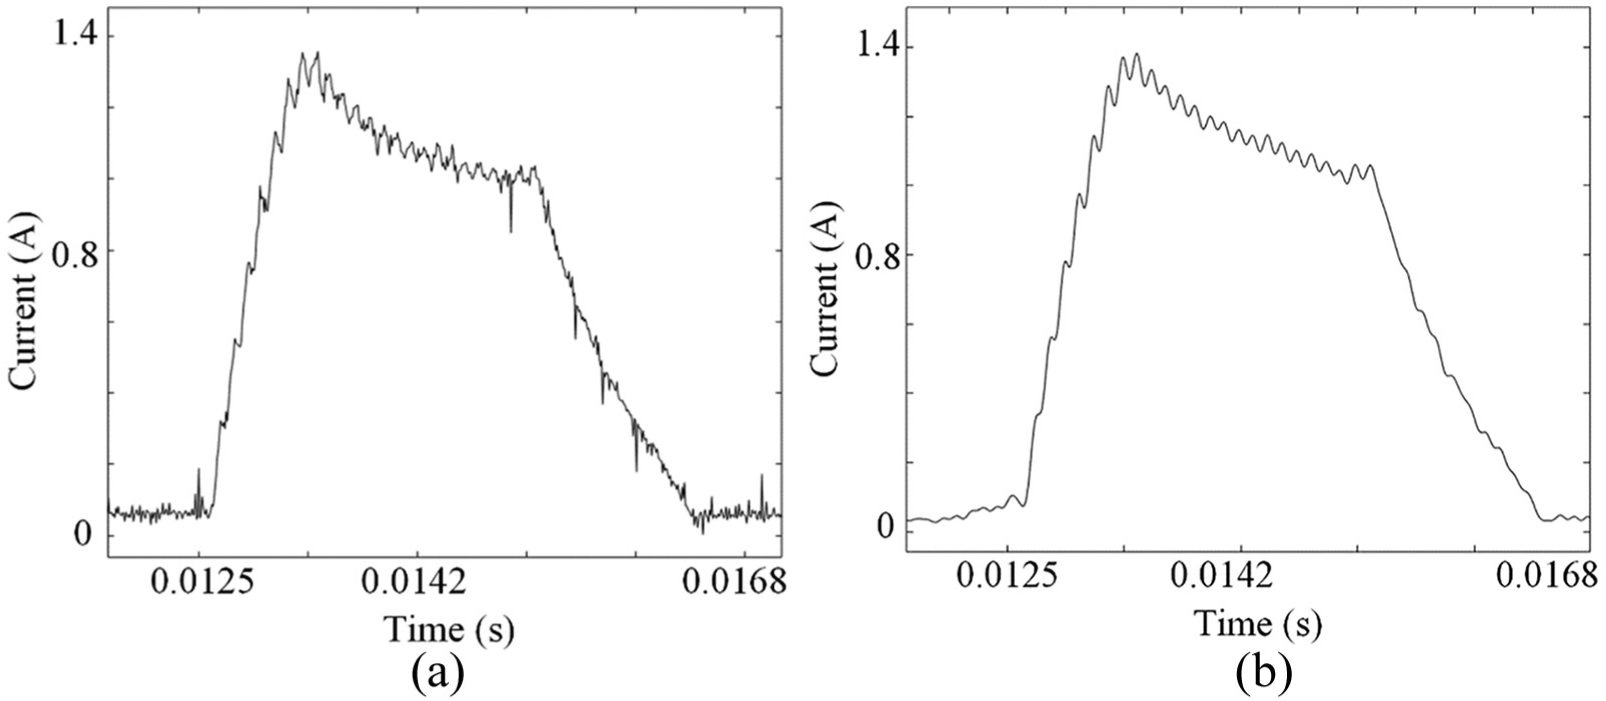
Diagram of phase current waveform (a) before and (b) after filtering.
Implementation of network connection circuit of the lower computer detection system
The lower computer detection system needs to transmit the collected signals to the upper computer safely, stably and quickly. Therefore, the choice of data transmission mode is very important for the real-time performance and accuracy of the whole system. This system uses WIZnet’s hardwired TCP/IP embedded Ethernet controller W5500 to access the Internet. W5500 is the single chip with TCP/IP stack, 10/100 Ethernet MAC and PHY embedded. The basic features of the W5500 are as follows: 3.3 V operation with 5 V I/O signal tolerance; internal 16 kb reception memory and 16 kb transmission memory; embedded 10BaseT/100BaseTX Ethernet physical layer, supports for asymmetric digital subscriber line (ADSL) connection. W5500 implements the TCP/IP stack only by hardware logic gates. The TCP/IP stack is a collective term for a series of network protocols, including TCP, IP and Internet Control Message Protocol (ICMP) at the network layer, the User Datagram protocol (UDP) at the transport layer and the HyperText Transfer Protocol (HTTP) at the application layer. The W5500 can independently complete the network connection and data transmission by simply configuring its internal registers by the DSP. It does not require the DSP to consider the Internet control.
In this system, the W5500 will communicate with the upper computer through the TCP as a server. The TCP has a mechanism to ensure accurate transmission, namely, the “three-way handshake” mechanism: when the receiver receives the data, it will send an acknowledgment message to the sender, and the sender will not send the data until the confirmation message is received. This mechanism makes the TCP have strong reliability. The flowchart of the W5500 as a server is shown in Figure 7.
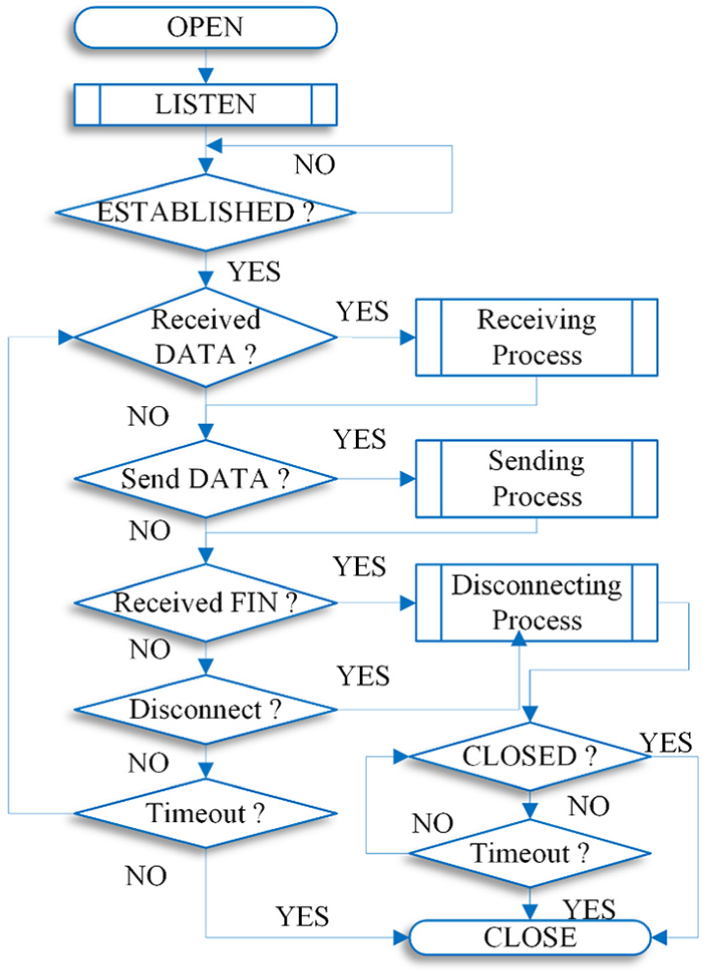
Flow diagram of the TCP server.
The W5500 communicates with the DSP via the SPI bus. The W5500’s SPI data frame consists of a 16-bit address segment, an 8-bit control segment and an N-byte data segment. The W5500 has two SPI data transmission modes, namely, variable data length mode (VDM) and fixed data length mode (FDM). The connection diagram between DSP and W5500 in different modes is shown in Figure 8.
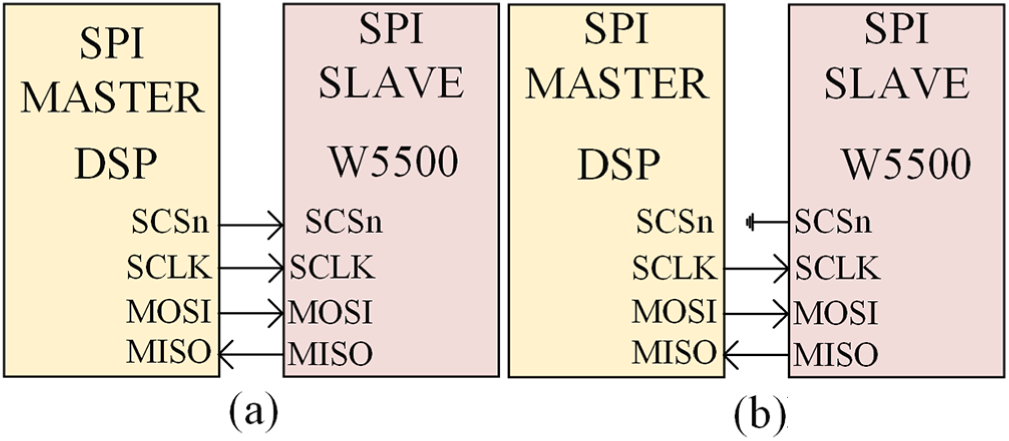
W5500 data transmission mode: (a) VDM and (b) FDM.
In the VDM, as shown in Figure 8(a), the data segment can be set at any length, which is controlled by the DSP through the pull-down or pull-up of the level of the SCSn pin. When the SCSn signal is pulled low (high to low), the W5500 SPI frame starts. However, when the SCSn signal is pulled high (low to high), the corresponding W5500 SPI frame ends. In contrast to the VDM, as shown in Figure 8(b), the data segment is fixed at 1, 2 or 4 bytes through the configuration register in the FDM.
Due to the large amount of data collected by the detection system, the FDM will cause DSP to send 16-bit address segments and 8-bit control segments frequently, which wastes a lot of time. To ensure the real-time performance of data transmission, the W5500 in this system will be configured in the VDM.
The working process of the lower computer detection system
The working process of the lower computer detection system is as follows:
The DSP will first configure the working state of ADS8668, W5500, McBSP and DMA.
The McBSPs are configured as the SPI bus. They will generate interrupts after receiving the data, and the DMA responds to the interrupts to transfer the data from ADC to SARAM.
The DSP uses the eCAP function to capture speed signal and torque signal, and calculate their values.
When the system collects a certain number of data, the DSP reads the data and selects a specific filter array for different signals to filtering. After that, the data are sent to the W5500 through the DMA function. The W5500 will transfer the data to the upper computers in the methods mentioned previously.
The flow diagram of the lower computer detection system is shown in Figure 9.
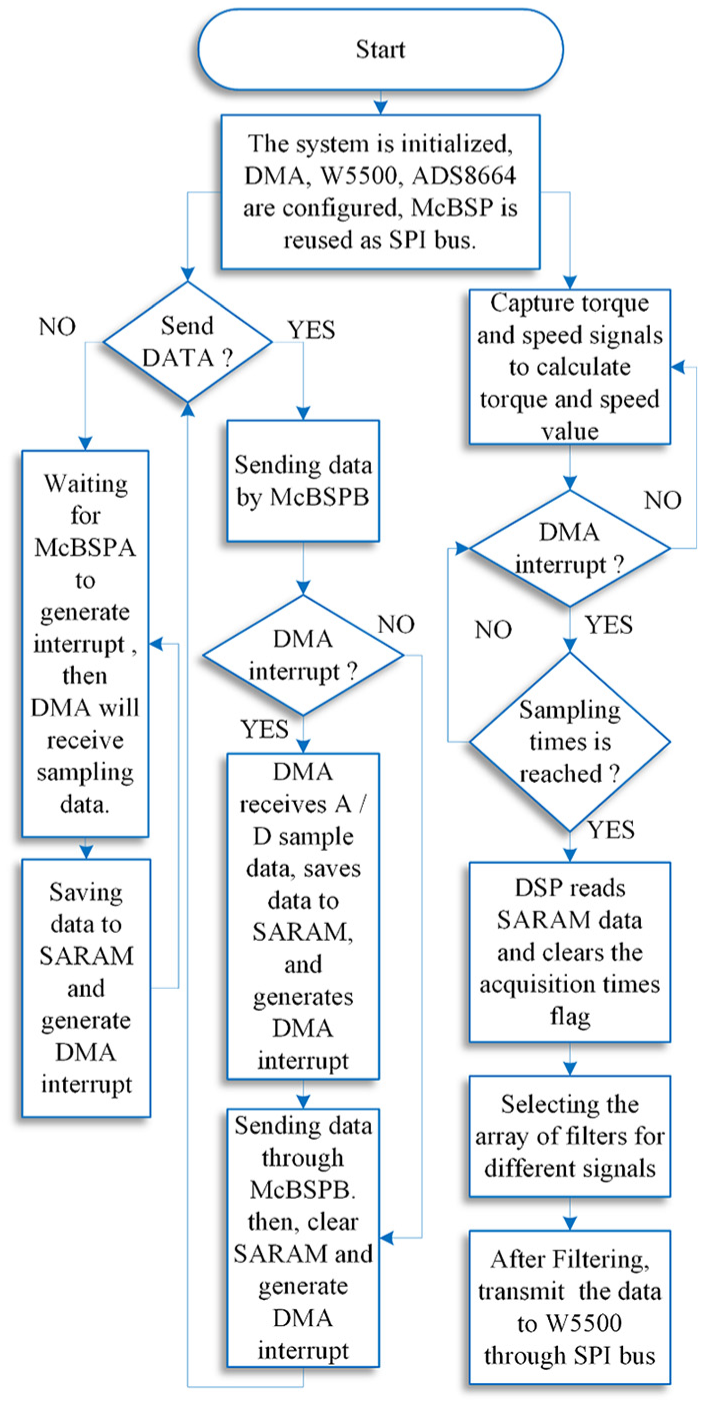
Flow diagram of the lower computer detection system.
Implementation of the upper computer display system
The upper computer software mainly implements the following functions:
Create data files for different motors;
Connect to different W5500 ports and receive data;
Real-time display of the waveforms and values of the bus voltage, bus current, stator winding three-phase current, speed and torque, and calculate the efficiency and power over a period;
Scaling, suspending and saving the motor waveforms and data.
In the monitoring system, there will be multiple upper computers connected to the LAN, requesting the W5500 to establish a connection to receive data. Therefore, before sending the data, DSP will add 1 byte before them as the number of times the data are sent. Then the upper computer judges after receiving the first byte. If the data have not been received, the upper computer continues to receive. Otherwise, it will not connect to the W5500 for a while to ensure that all the upper computers could receive the data. At the same time, the W5500 chips of different lower computer detection systems in the LAN are ready to send the data to the upper computer. Therefore, the upper computer software should select the receiving port and configure parameter names at first. The flowchart of the upper computer software is shown in Figure 10. The software system setting interface is depicted in Figure 11.
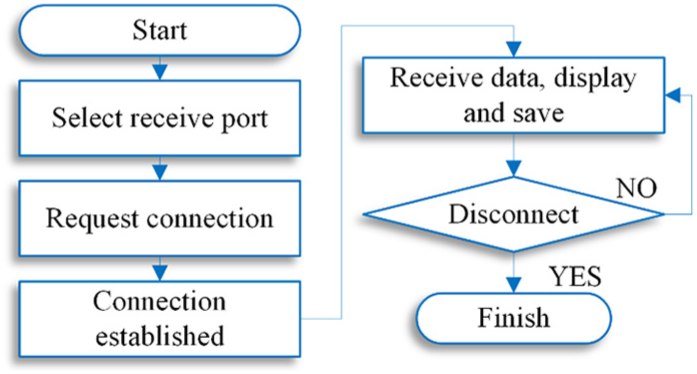
Flow diagram of upper computer software.
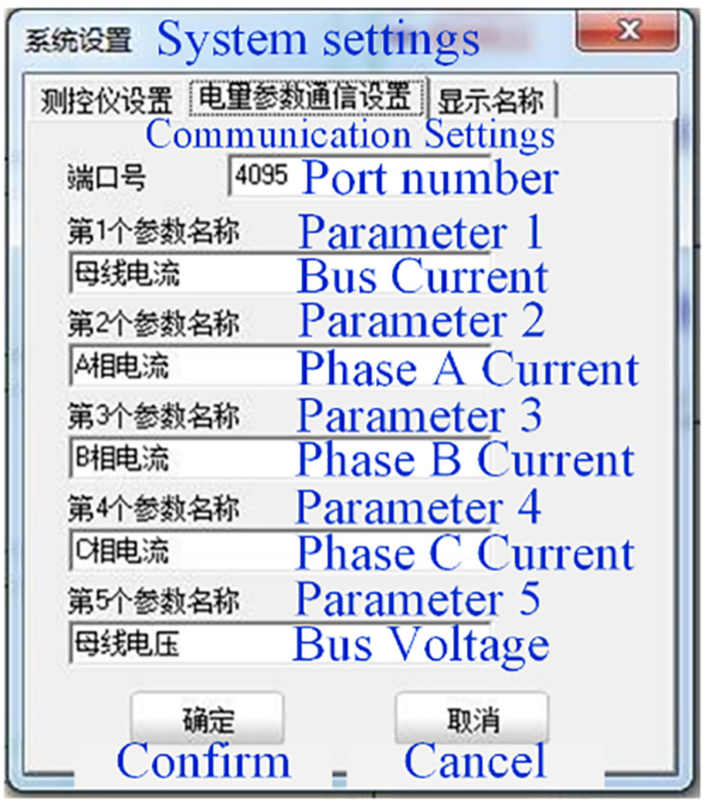
Software system setting interface.
After the communication parameters are selected, a new data file can be created to save the motor data. In the interface of new data file, the parameters of motor and controller, such as type, rated power and control method, can be filled in to distinguish different motors, so as to avoid confusing the data of different motors. It improves the reliability of the recorded data and guarantees the accuracy of motor modeling and data analysis in the future. The interface when creating a new data file is depicted in Figure 12.
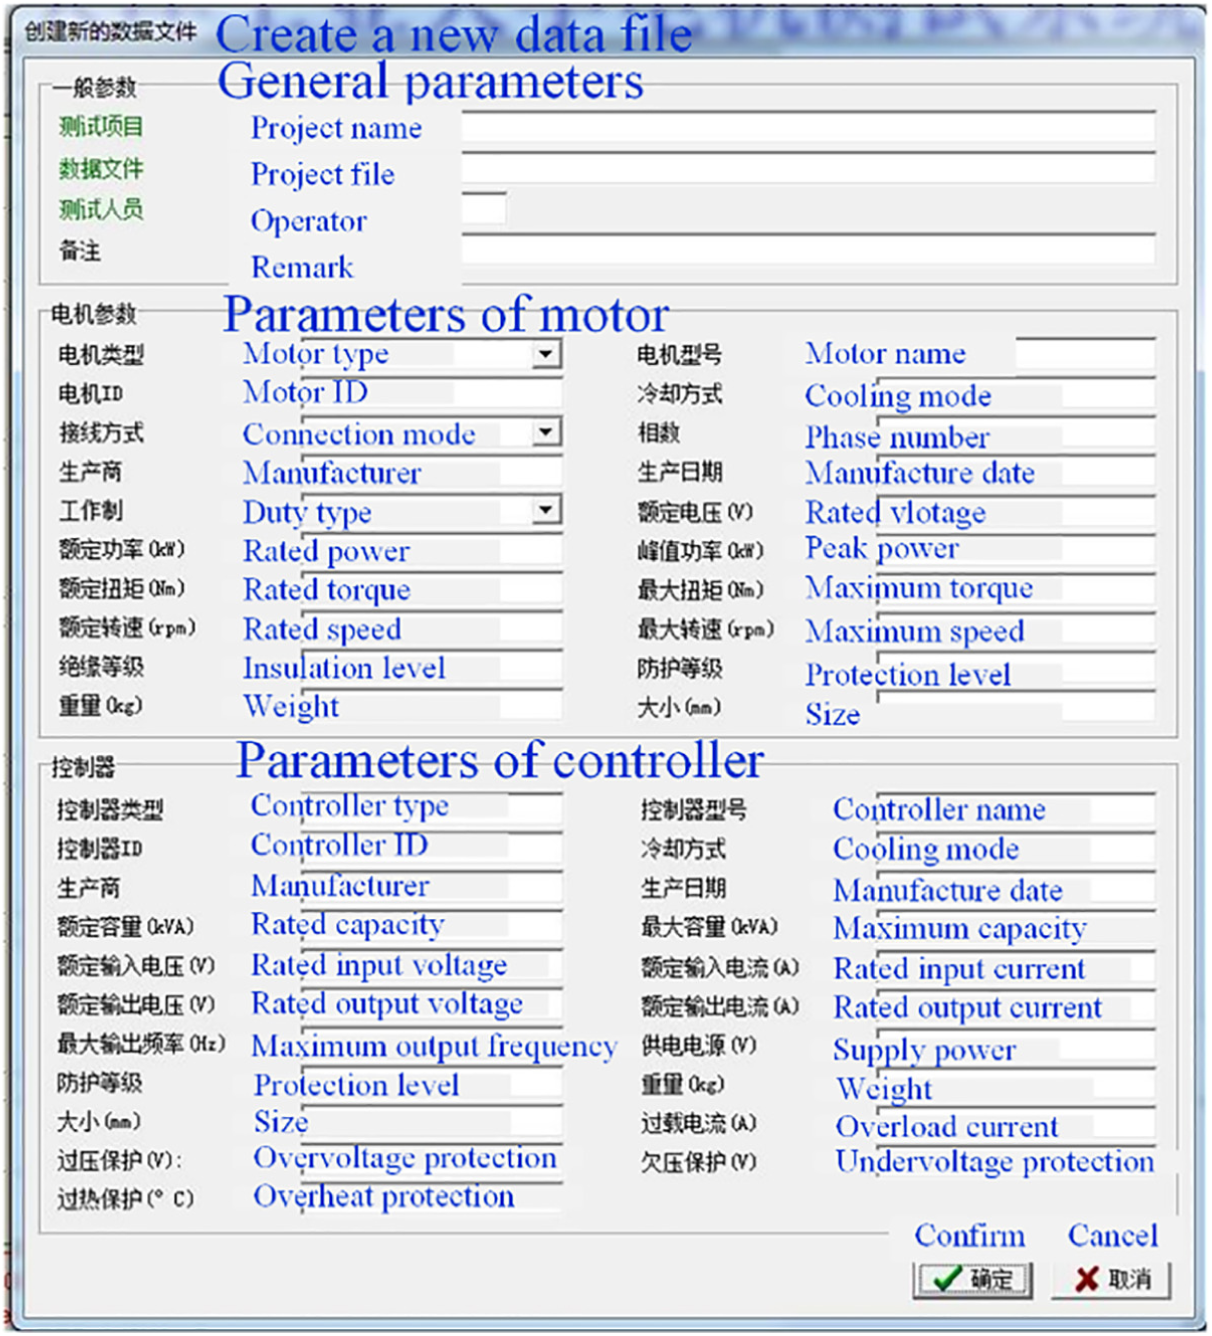
Creating a new data file.
The upper computer display interface is shown in Figure 13. The left side of the interface shows the waveforms of motor speed, torque, bus current, phase current and bus voltage. The user can zoom in, zoom out, pause and so on to observe the subtle changes in the waveform.
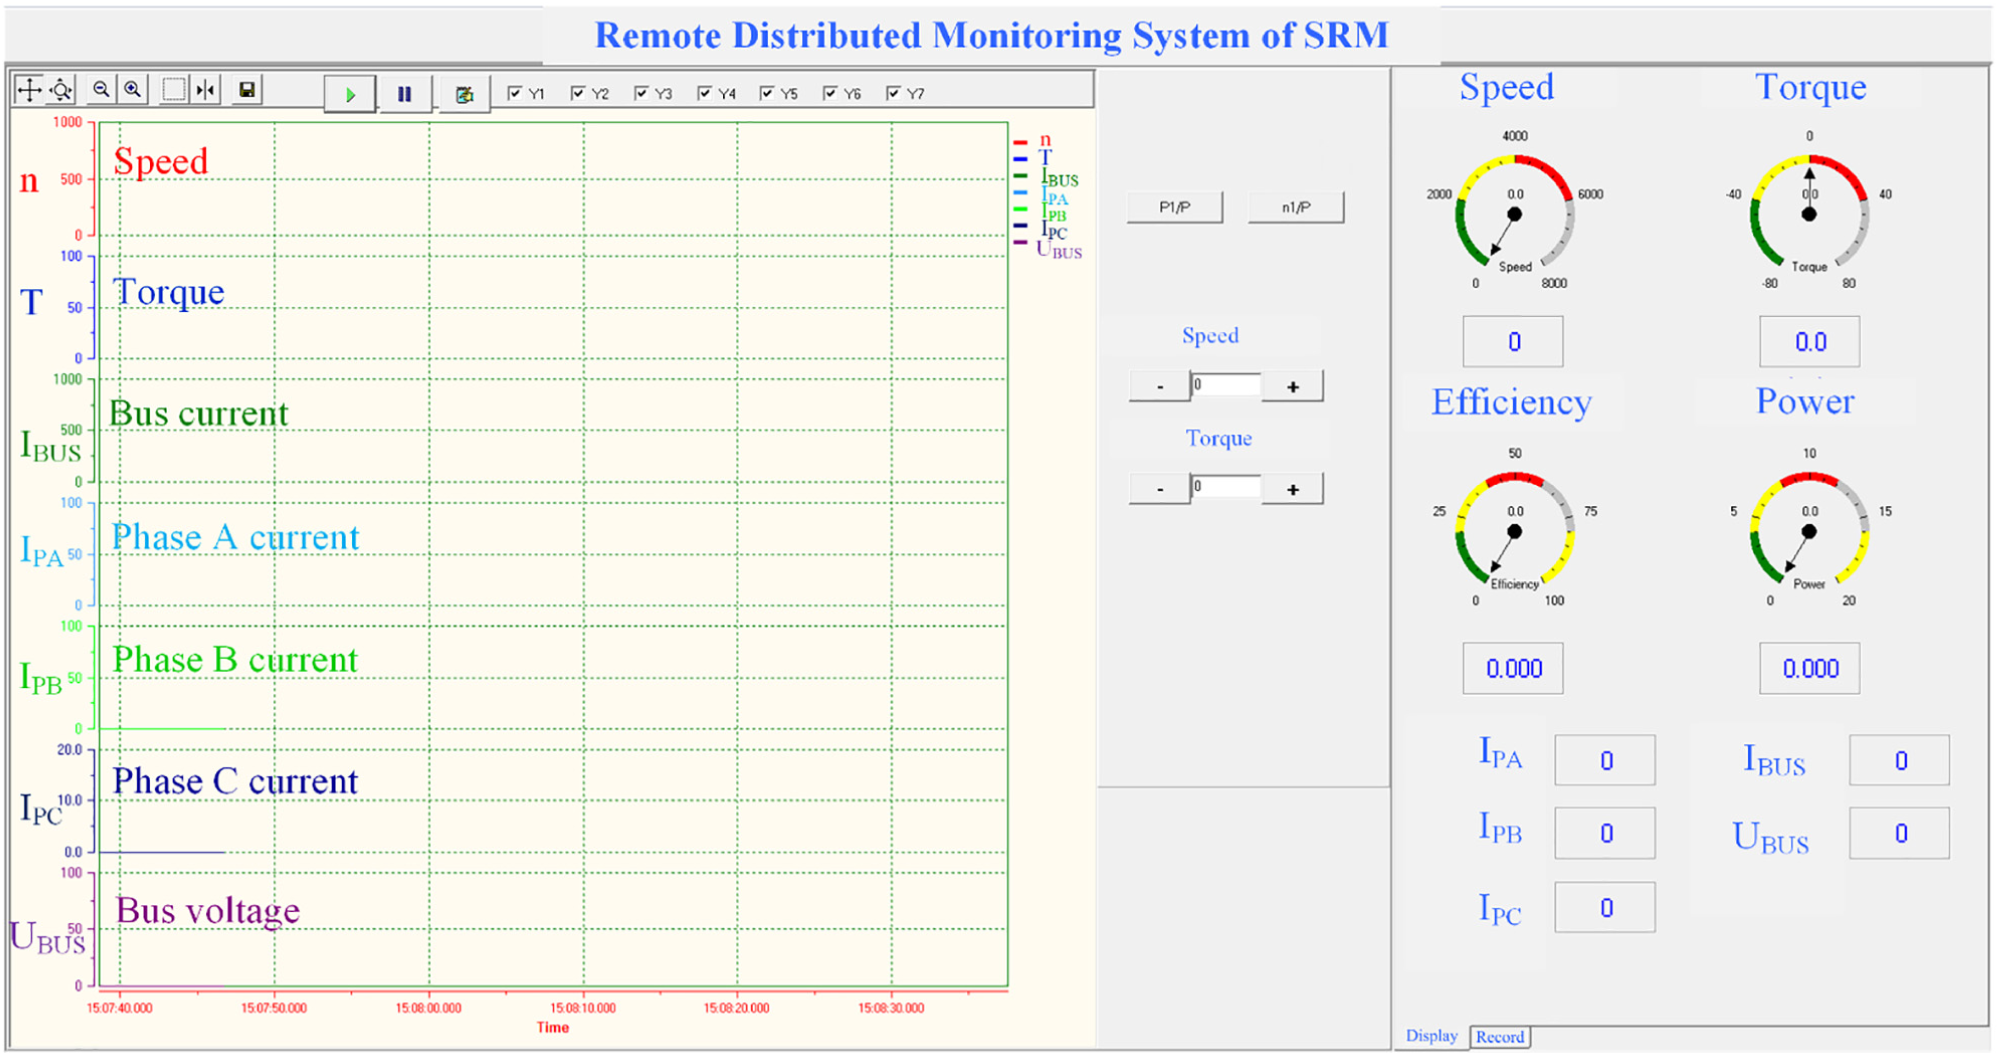
Upper computer display interface.
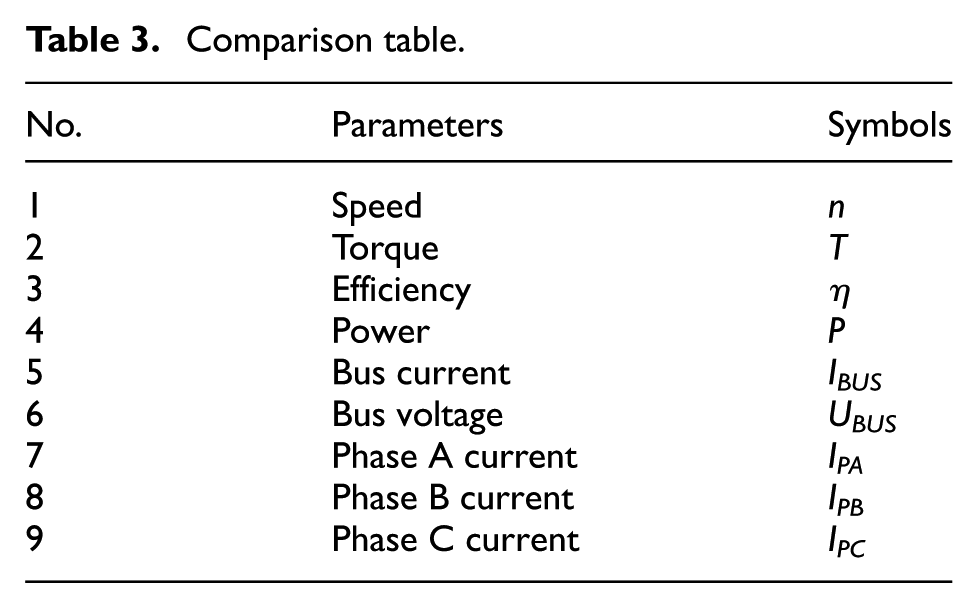
The right side of the interface displays the speed, torque, efficiency and power of the motor over a period of time in the form of a dial, as well as the present values of voltage and current. The system displays the situation of motor in various forms. It is convenient for the user to observe the state of the motor more intuitively. Moreover, it improves the ease of use and practicability of the monitoring system. For the convenience of reading, the parameters in the software interface are symbolized in the rest of the paper. The comparison table is shown in Table 3.
Comparison table.
Experiment of RDMS of SRM
This system is tested with a 1.5 kW three-phase 12/8 SRM (SRM1) and a 1.1 kW three-phase 12/8 SRM (SRM2). The lower computer detection systems of the two monitoring systems are connected to the router through the network cable. Upper computers 1 and 2, respectively, connect the router through cable and Wi-Fi to receive data. The motors and their monitoring systems are shown in Figure 14.
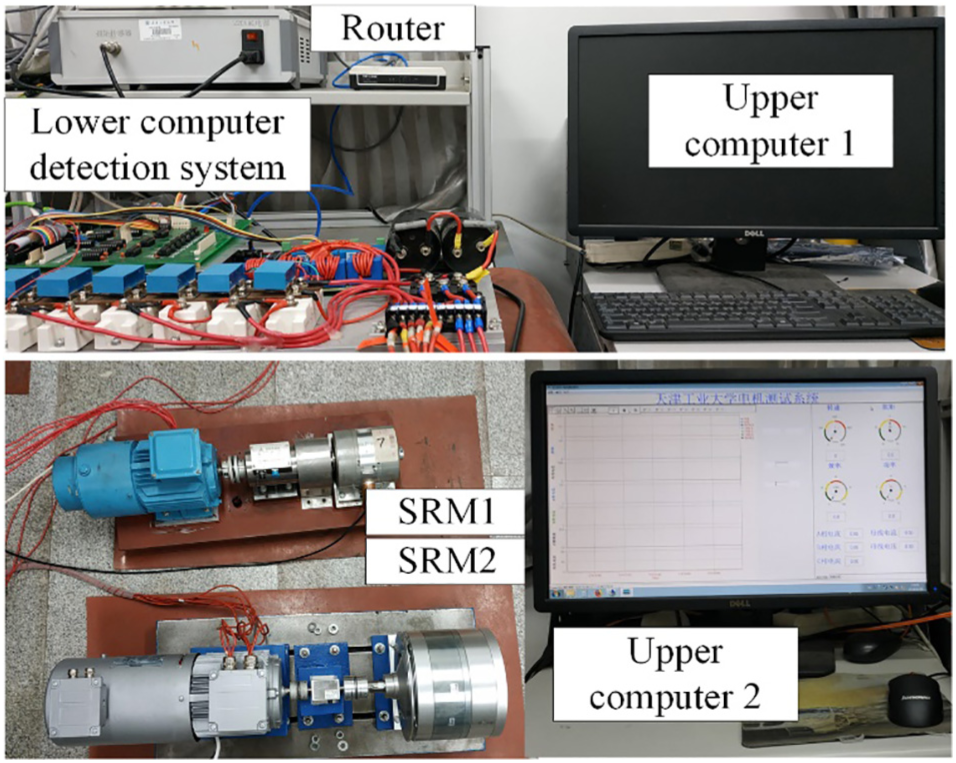
RDMS of SRM.
The experiment plans are as follows:
One upper computer monitors different motors. That is, upper computer 1 is used to monitor the operating state of SRM1 and SRM2 in sequence, thereby verifying that the system can realize the distributed monitoring of different motors by changing software settings only.
Different upper computers monitor the same motor. That is, upper computer 1 connects the router through the network cable, and upper computer 2, in another room, connects the router through the Internet. These two upper computers can simultaneously monitor the operating state of SRM1. This plan verifies that the system can remotely receive data from the same motor via different transmission methods.
When implementing test plan 1, the software parameters are set at first and then the data of SRM1 are received. The display interface is shown in Figure 15(a). Figure 15(b) shows the waveforms of the motor signals; the other parameters are shown in Figure 15(c). The interface illustrates the current condition of the motor accurately.
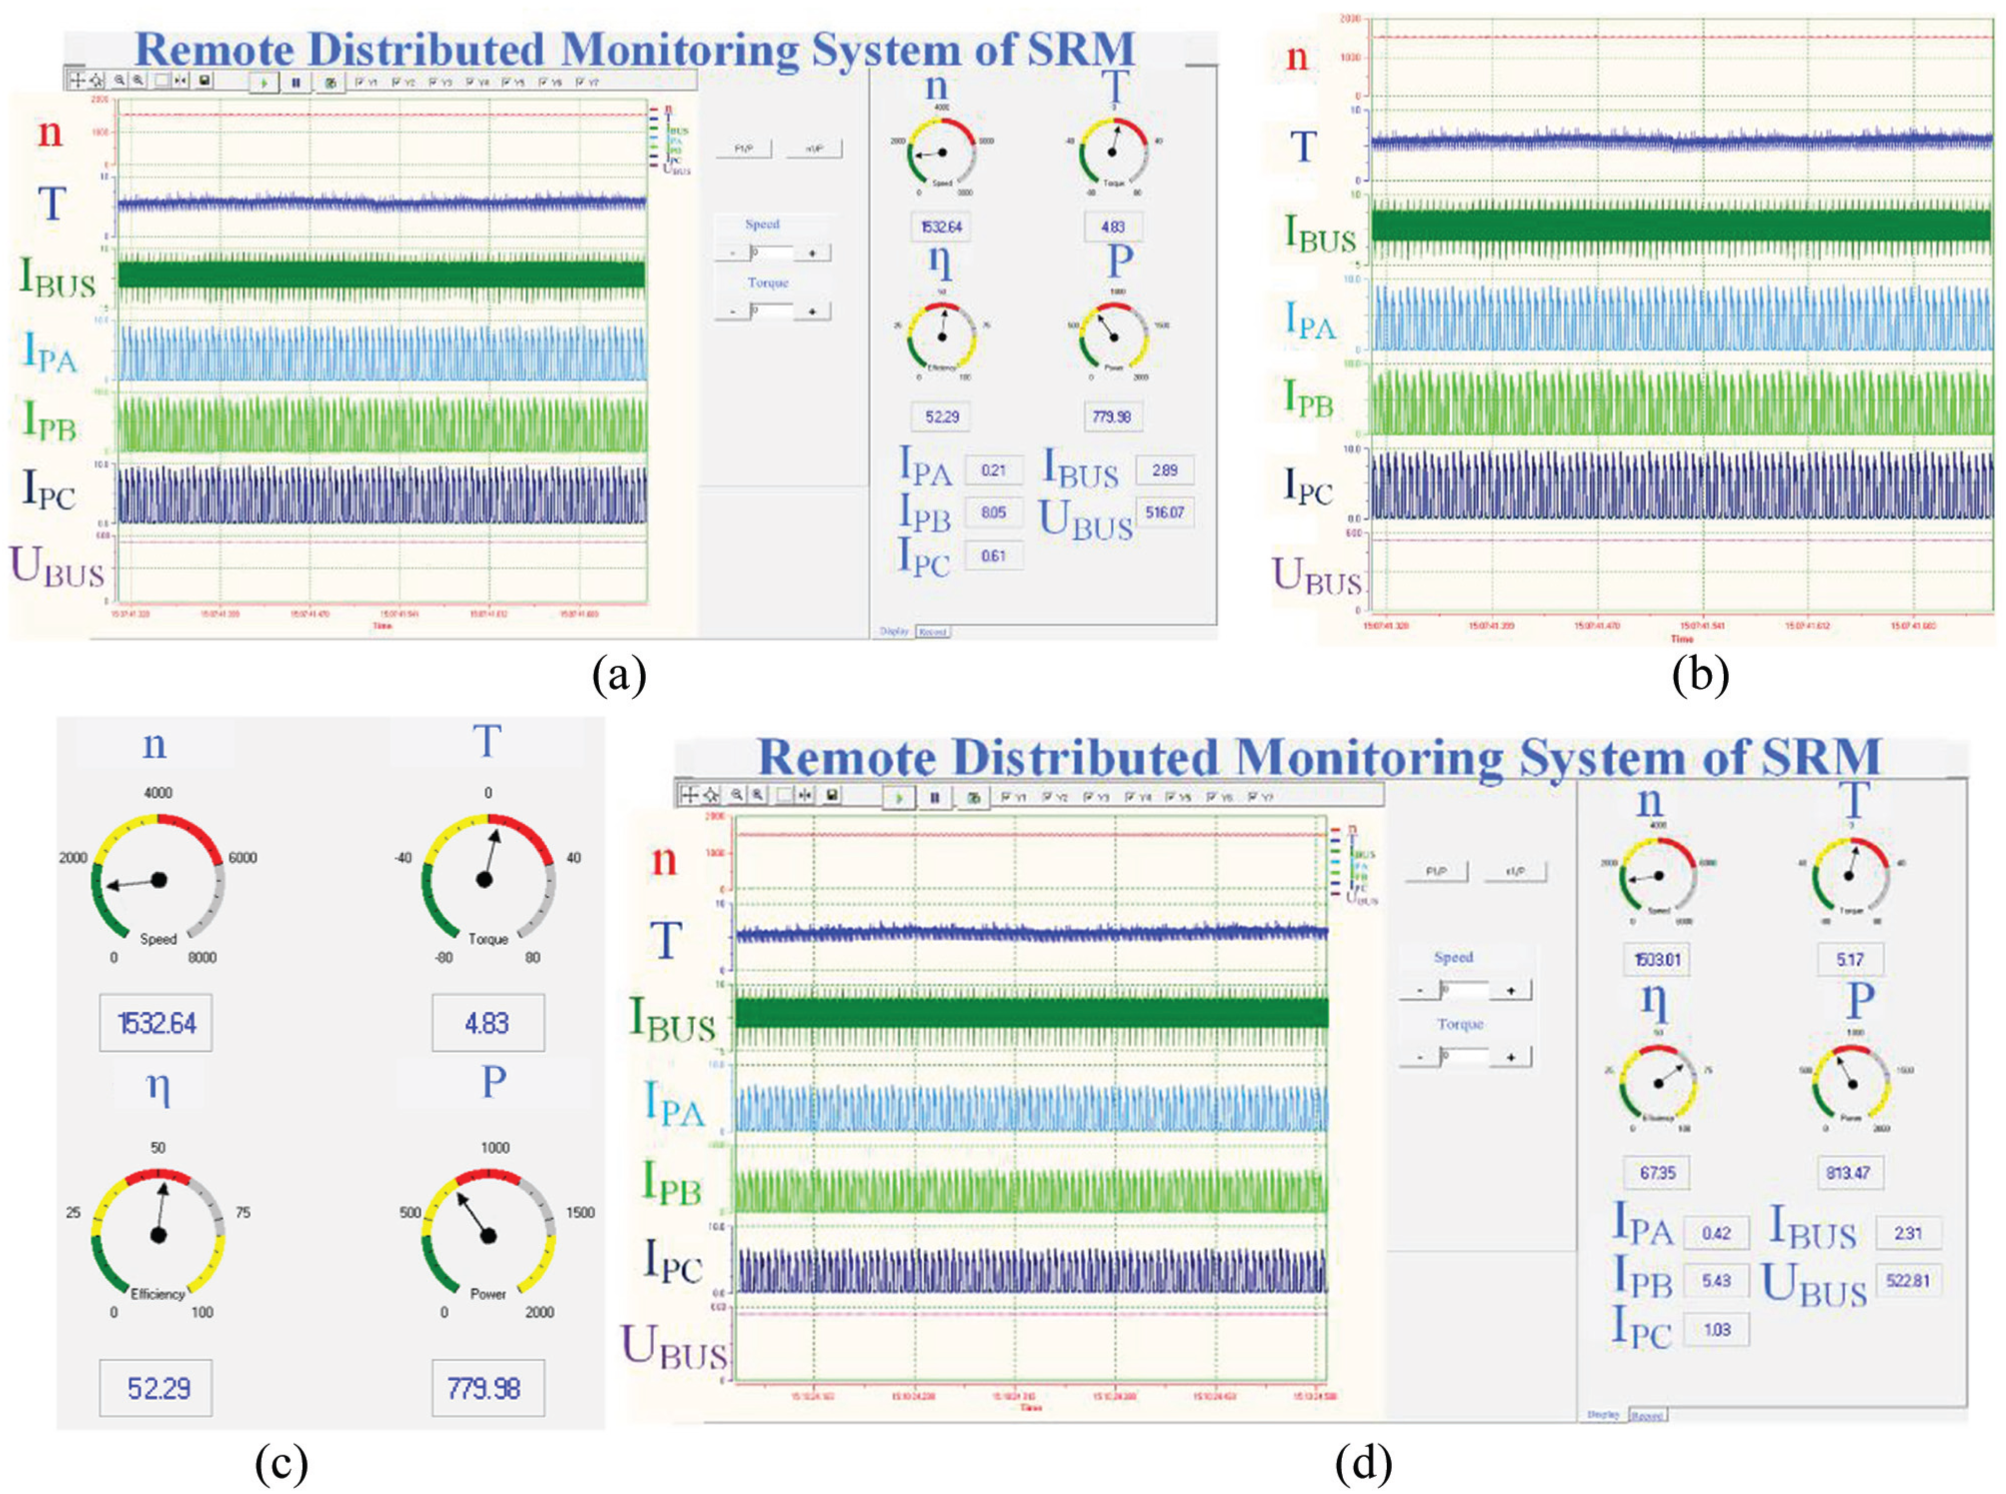
Motor monitoring interface (Scheme 1): (a) the display interface of SRM1; (b) waveform of signals; (c) speed, torque, efficiency and power of SRM1 and (d) the display interface of SRM2.
Then, the software parameters are reset. After that, the W5500 port of the SRM2 detection system is selected and the data of SRM2 are received. The display interface is depicted in Figure 15(d). It can be seen that the monitoring system can achieve the distributed monitoring of SRM.
When implementing test plan 2, upper computers 1 and 2 can set the software parameters at any time. After the configuration is completed, the port of SRM1 can be selected to receive the motor data, as shown in Figure 16(a) and (b). Taking an amplified current waveform as an example, as shown in Figure 16s(c), the motor waveforms have basically no delay, while the network is in good condition.
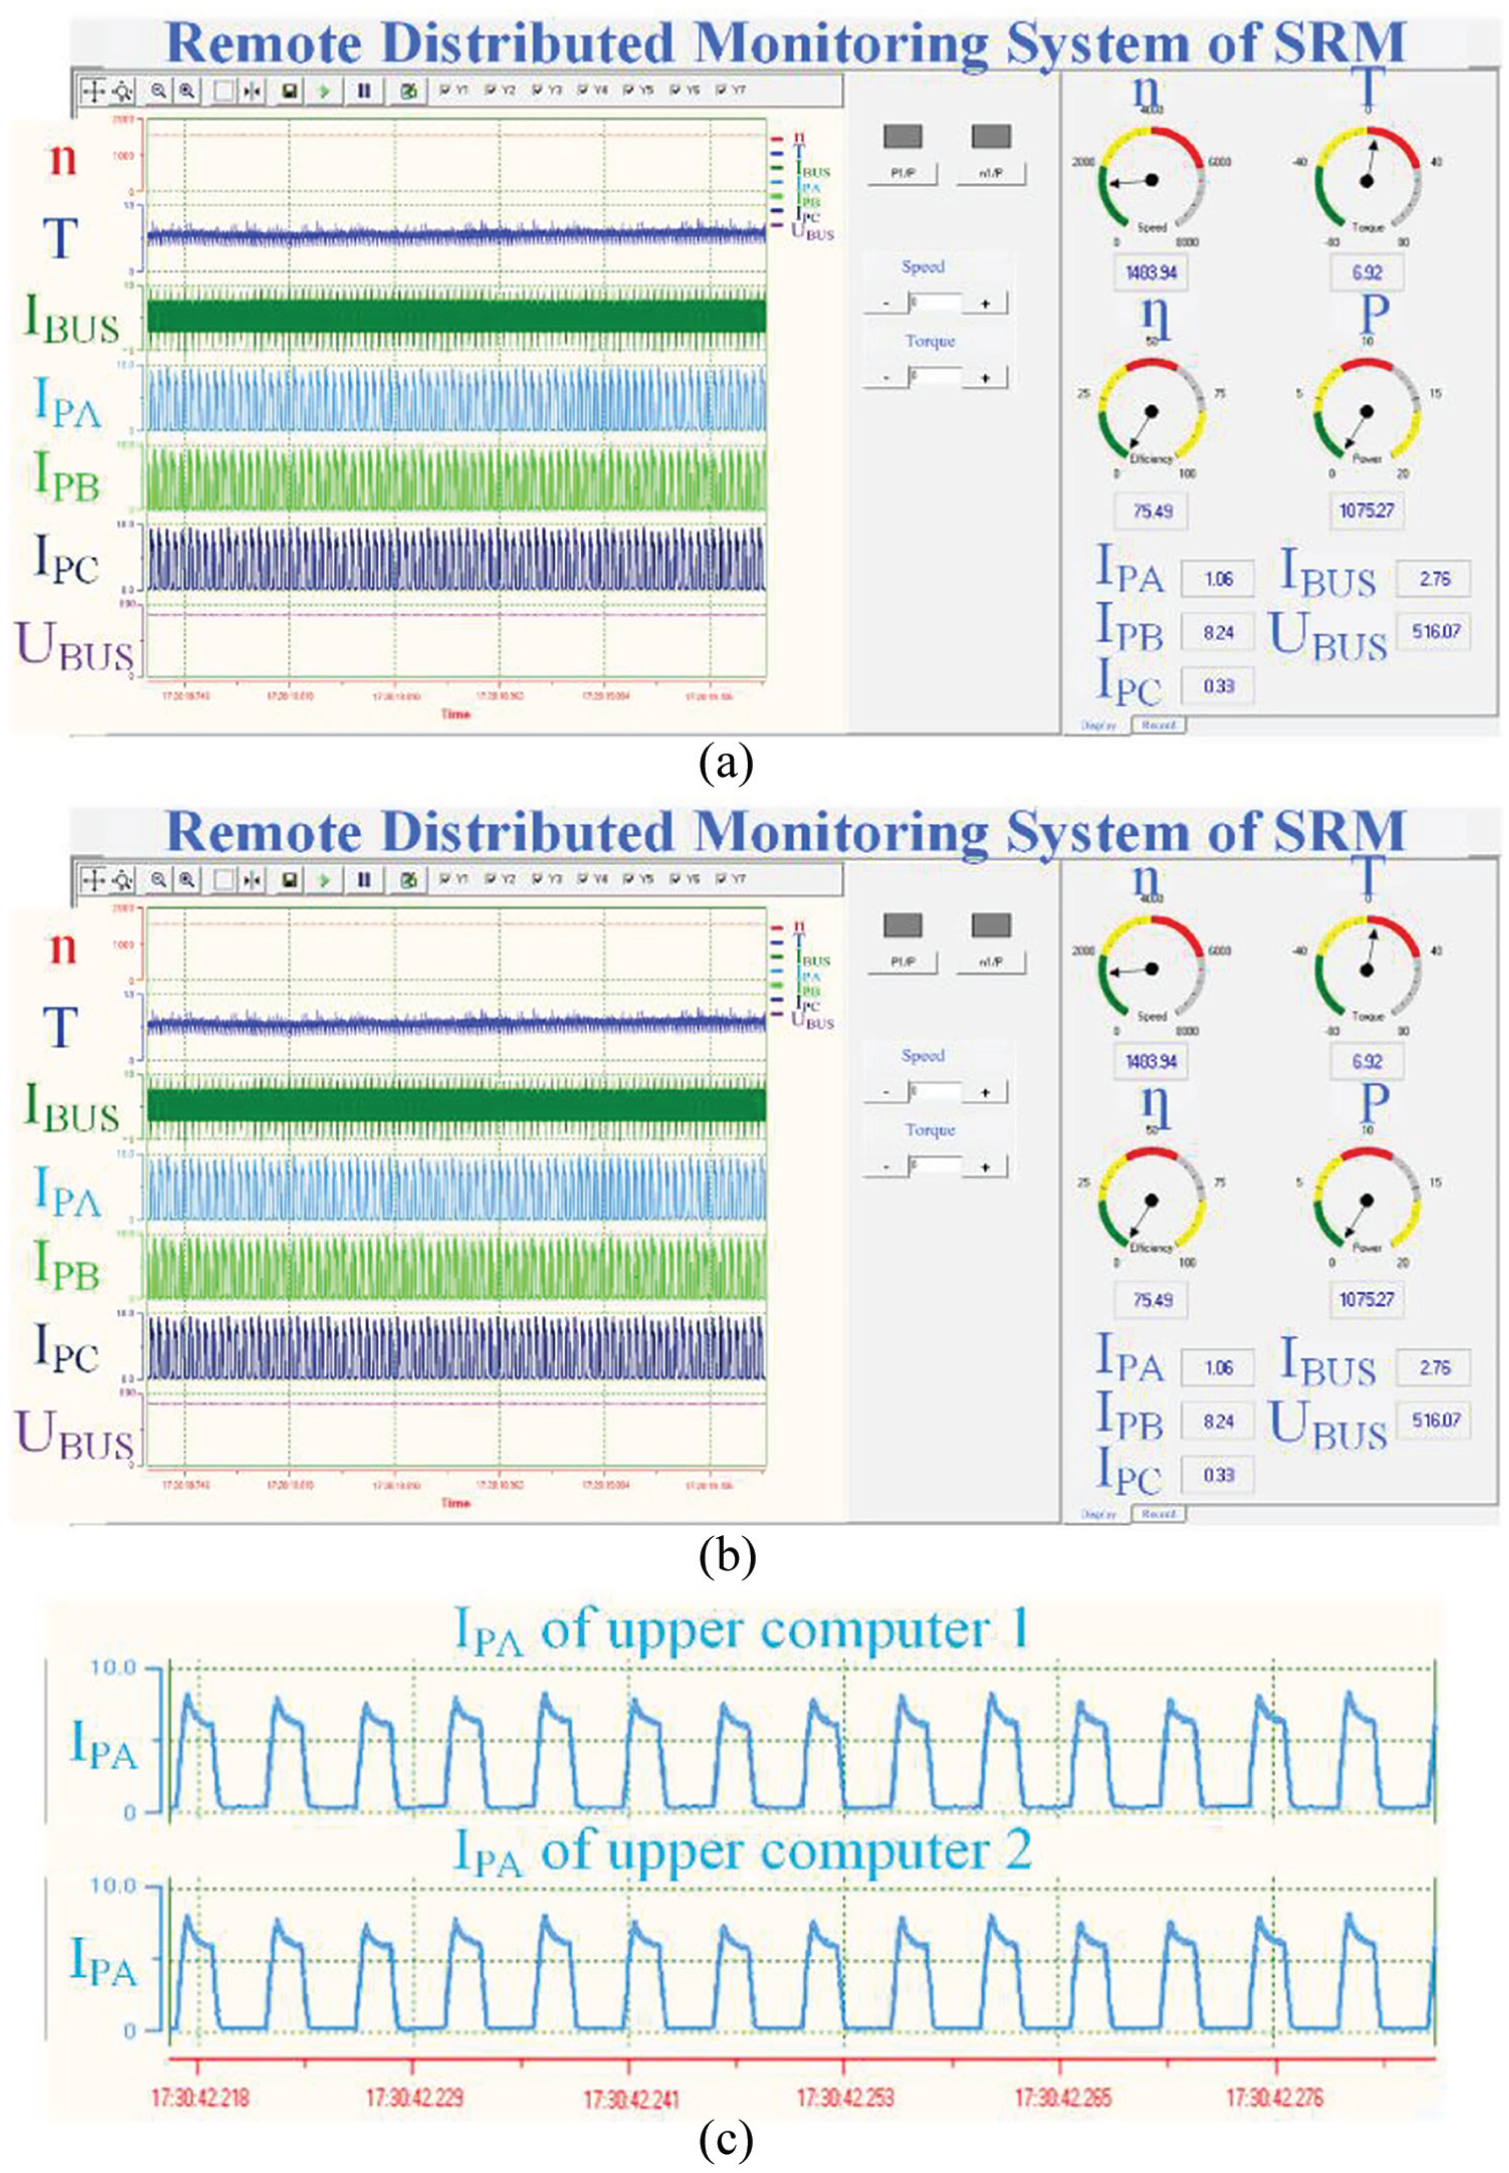
Motor monitoring interface (Scheme 2): (a) the interface of upper computer 1; (b) the interface of upper computer 2 and (c) comparison of monitoring effects of different upper computers.
Conclusion
This paper presents an RDMS of SRM that can flexibly change the data transmission mode. Based on the hardware filtering, the proposed system uses the FIR filter to filter the current and voltage signals under different control modes which improves the accuracy of the entire SRM monitoring system. The use of DMA to transfer data and hybrid programming method to achieve DSP program reduces the DSP’s workload and improves the real-time performance of the monitoring system. For the first time, a hardwired TCP/IP embedded Ethernet controller W5500 is used in the SRM monitoring system to achieve secure and stable Internet access without operating system. Using Delphi 7, the upper computer display interface has been developed, which can display, save and scale the waveforms.
The system not only simplifies the development and maintenance of the monitoring system, but also solves the issues faced by the conventional SRM monitoring system, including many variables to be measured, high sampling frequency requirements, poor working environment and small scope of application. It provides an accurate, stable and safe monitoring platform for SRM data acquisition, performance analysis and control method development. In general, the monitoring system proposed in this paper exhibits great guiding significance for the development of SRM.
Footnotes
Declaration of conflicting interests
The author(s) declared no potential conflicts of interest with respect to the research, authorship and/or publication of this article.
Funding
This work was sponsored by the National Natural Science Foundation of China under Grant No. 51777137 and Tianjin Science and Technology Plan Projects under Grant No. 16PTSYJC00080.