
Abstract
In order to achieve high-precision and robust measurement for a single-track absolute encoder, an improved subdivision algorithm based on machine vision technology is proposed. First, the composite subdivision algorithm combining RANdom SAmple Consensus and least square estimation is introduced. Second, the proposed algorithm is proved to be high-precision and effective to remove fault error from signal noise and spot by simulation. Finally, real test results show that the algorithm output angle stably achieves precision within 2.5 arc-seconds and accuracy up to 1.6 arc-seconds. Research results provide a high-precision and robust subdivision algorithm that is improved by modern machine vision technology of RANdom SAmple Consensus and it can be applied in the field of absolute angle sensor in the future.
Introduction
The photoelectric rotary encoder, also named photoelectric angular displacement sensor, is widely applied in radar, theodolite, and numerical control machine tools.1–3 Photoelectric encoders are useful for measuring angular displacement. Both absolute and incremental encoders can do it, but they work in different ways. When powered up, absolute encoders do not need to count from zero in comparison with incremental encoders, so they have the advantage of non-volatile memory.4,5 With the development of encoder technologies, researchers all over the world have made remarkable progresses in this field. In the United States, an ultra high-resolution absolute photoelectric encoder was first invented by NASA in 2000 with resolution up to 0.01″. 6 In Serbia, The Faculty of Science and Technology at Novi Sad designed a device for angular displacement based on color identification with resolution 0.1°. 7 In Spain, CMOS sensor and optical mouse were applied by Lleida University to create a very low cost solution of high-resolution angle measurement. 8 In Japan, Hamamatsu Company declared that its absolute shaft encoder based on an area-array image sensor can reach 14-bit resolution. 9 In South Korea, Korean Standards and Science Institution created an absolute angular measurement method with a maximum error of 4″ and response frequency of 500 Hz. 10 In Changchun Institution of Optics Fine Mechanics and Physics, Chinese Academy of Sciences designed a small-size absolute photoelectrical encoder with a diameter of 50 mm and it achieved a resolution of 1.24″. 11
According to related literatures of the past 20 years, the image-type encoder technology has been more popular. However, it is still a great challenge to implement an encoder of high precision now. The main reason is that measurement based on an image system is always accompanied by noises that may have negative effects on precision.
Generally, noise can be classified as either internal or external in an encoder’s image system. Internal noise is inherent to the process of measured samples, affects all of them, and is assumed to be distributed normally. External noise results from sources exterior to the system and is usually caused by a measurement fault error or an extreme behavior that does not match the overall behavior of the majority of samples. 12 For instance, a grating image signal observed by a linear CCD in a photoelectrical encoder could be affected by code disk spot or strong electromagnetic interference from free space or extreme circuit noise. Distortions of an image signal can be considered as a typical external noise or an error because they are inconsistent with other samples obviously. Compared with internal noise, external noise has a greater effect on measurement precision if it is not processed properly.
Machine vision is the use of image-based applications of automatic inspection and analysis. It is a very powerful tool for automated measurement and control. It can save time and costs and help eliminate the risk of human errors. Machine vision relies on image processing techniques of the input image data and is applied in many areas including image segmentation, pattern recognition, object detection, and so on. In practice, the process of machine vision starts with imaging, followed by automated analysis of the input image and extraction of the required information. However, there are few reported studies of applying machine vision technology in the field of image-type encoder, especially in subdivision methods. In this article, a high-precision subdivision algorithm of applying machine vision technology is proposed to eliminate fault error of angle measurement.
Principle
Figure 1 illustrates a general principle of angular displacement measurement based on a single-track absolute encoder. The encoder includes an LED light source, a code disk, and a linear CCD sensor as well as a signal processing circuit. The code disk is rotating with a shaft as a center, light emits from LED goes through the disk gratings, and grating patterns are projected onto the light-sensing surface of the linear CCD. Then, the grating image pattern is recognized by software running on the circuit to output an absolute angle.
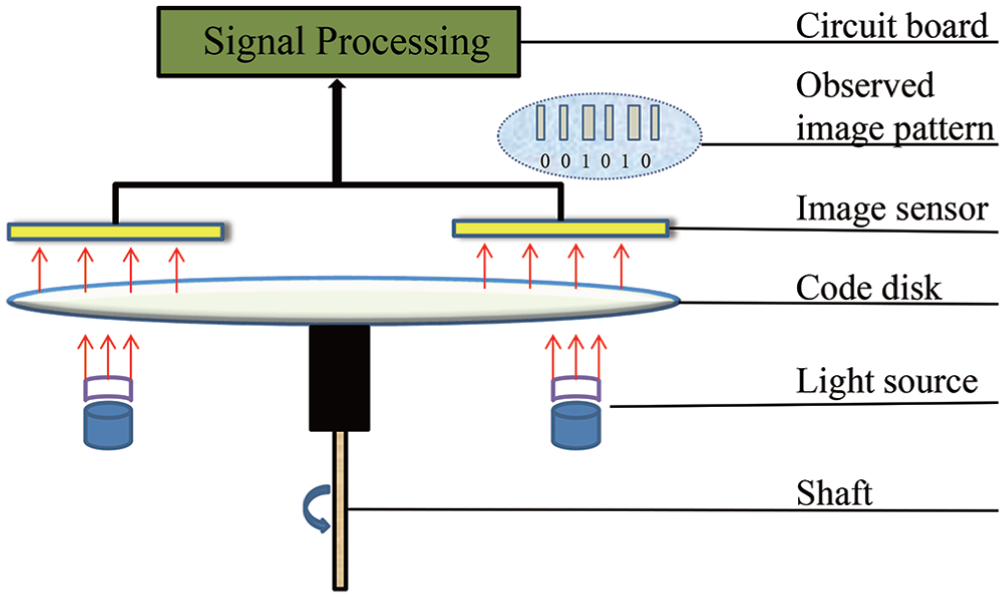
Principle of single-track absolute encoder.
In order to implement high-precision angle measurement, a new subdivision algorithm is designed by processing the image of multiple coded grating lines which was developed from traditional “centroid” algorithm. According to the principle of angle subdivision illustrated in Figure 2, a rectangular coordinate system is established using a physical center point
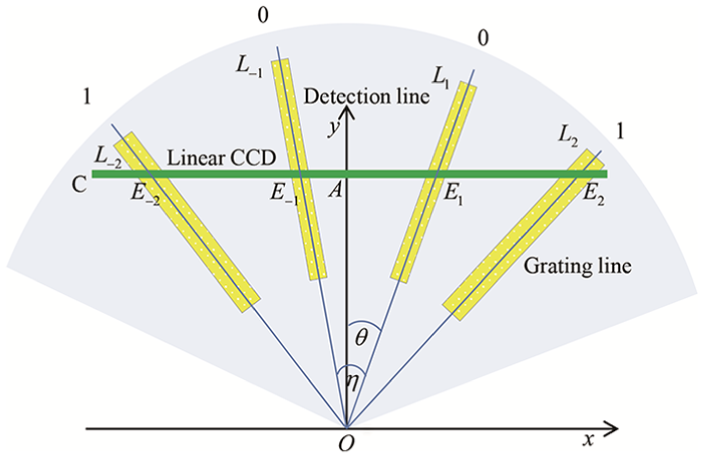
Principle of angle subdivision.
By calculating “centroid” of grating grid line image, position of the intersection points
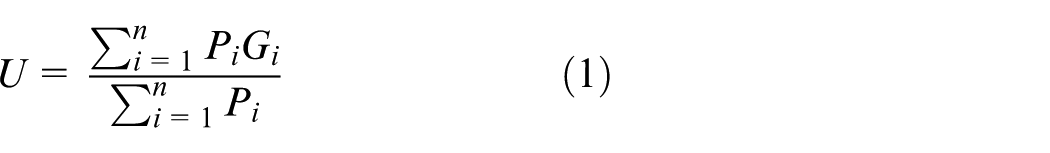
where
Obviously and easily, angle

Formula (2) is simple to use, however it is difficult to calculate
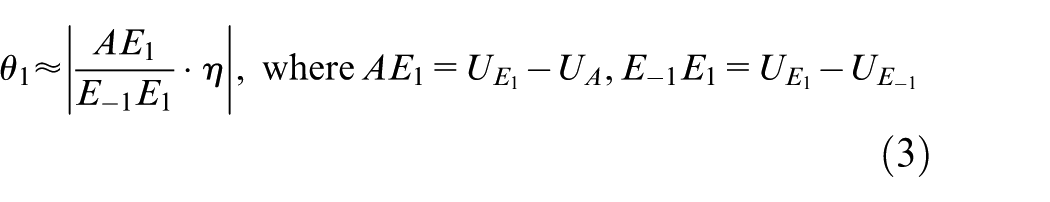
In formula (3),
In formulas (2) and (3), only one or two grid lines are used to calculate subdivision angle and therefore they could be affected by signal noise or distortion easily. Although image noise can be filtered by normal digital filter technology, some useful angle information could also be lost.13,14 For this reason, we aim to develop an improved subdivision algorithm with robustness to noise and spots from multiple grating lines.
Algorithms
Subdivision algorithm improved by least square estimation
By means of calculating “centroid” of pulses, grating grid line centers

where
Principle diagram of subdivision with LSE.
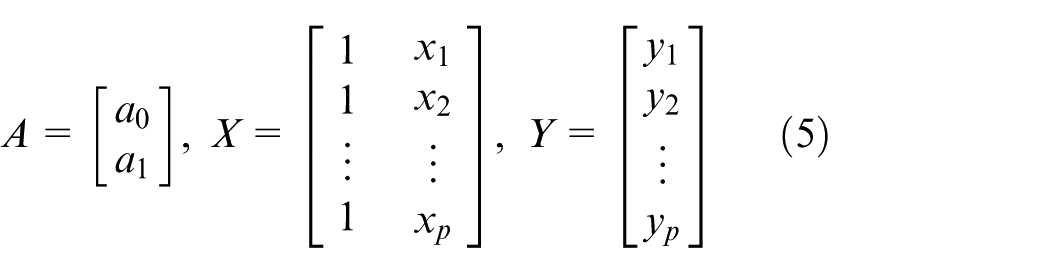
Then, we have a fitting line parameter vector

Obviously, parameter
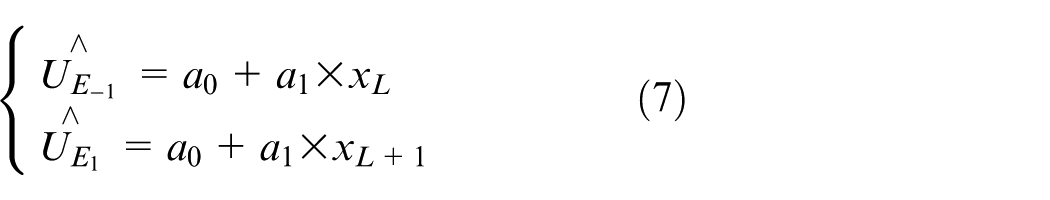
Consequently, improved prediction of
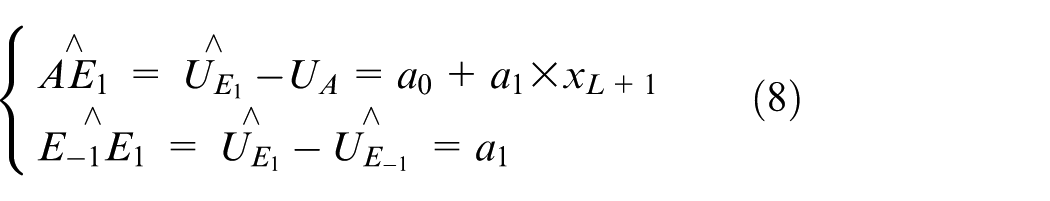
In formula (8), the estimated variable of
According to formula (3), a subdivision angle based on LSE can be given in formula (9) which is derived from traditional algorithm
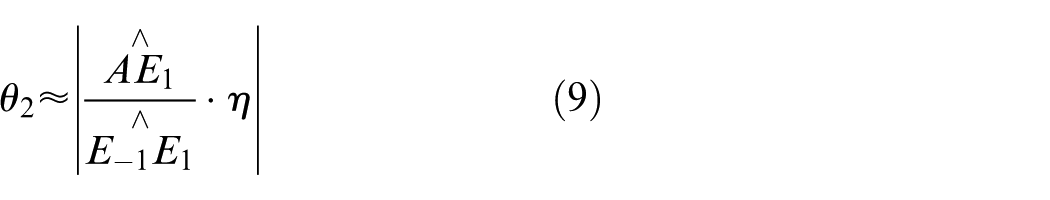
The subdivision algorithm improved by LSE uses centers of a group of observed grating grid lines to predict position of
Proposed subdivision algorithm improved by RANdom SAmple Consensus
LSE algorithm uses parameter estimation method for subdivision from multiple grid lines and it is robust theoretically because it can suppress image noise in some sense; however, previous algorithm uses all observed grid lines’ image even if it is affected by external noise. In other words, the model constructed from grid image data that may include external noise with LSE is not the best model.
RANdom SAmple Consensus (RANSAC) is a machine vision technique to find the best model, it is also an iterative method to estimate parameters from a set of observed samples, so as to process all input data that may include noise samples (both internal and external noise).15–17 The basic assumption of RANSAC is that the measured value

where
where
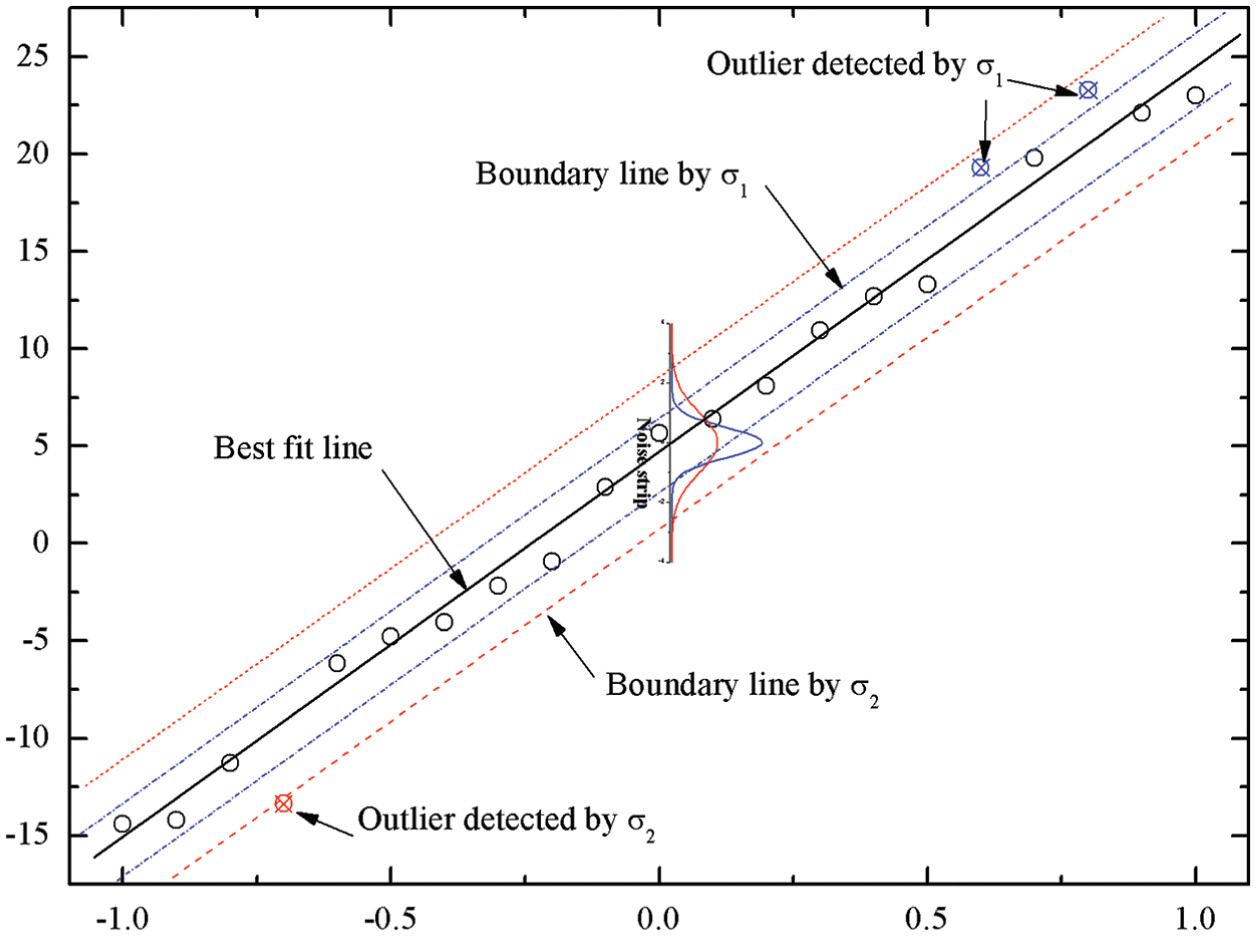
Principle diagram of RANSAC outlier detection. Grating line center samples within noise strip are defined as model-compatible ones while samples outside the strip are model-incompatible ones.
Importantly, RANSAC can be used as an outlier detection method which helps to remove fault error so as to improve measurement precision by dividing input dataset
Constructing a linear model from random subset of input data set. Drawing a subset
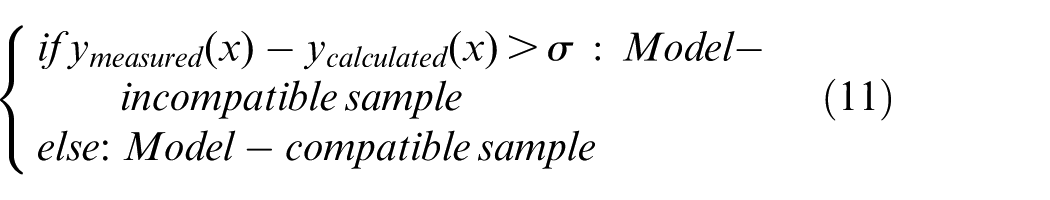
Model scoring: classifying all samples into model-compatible samples and model-incompatible samples (based on the priori value
Iterative phase: repeating steps (1) and (2) to build multiple models each based on randomly selected subsamples. For each model, the number of model-compatible and that of model-incompatible samples are counted. The higher ranked model with more model-compatible samples will be recorded in the end of each iteration. RANSAC is an iterative algorithm that requires many repetitions of model construction from subsamples to obtain the best model. Therefore, a maximum iteration times
Model selection: selecting the model with the largest number of model-compatible samples (inlier) as the best model, discarding model-incompatible samples (outlier) and obtaining the best sample set (ex,
Grid line center prediction: bringing the index of grating lines besides detection line
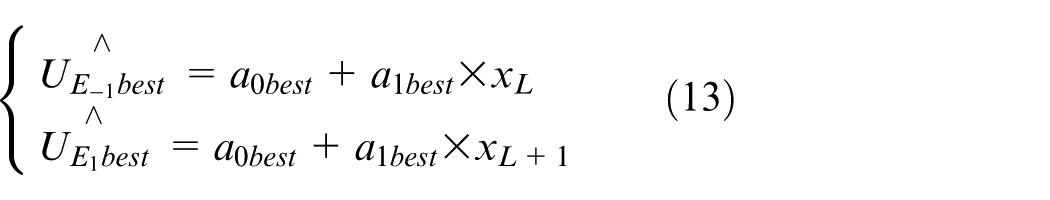
Similar to the subdivision principle of formula (9), the proposed subdivision angle
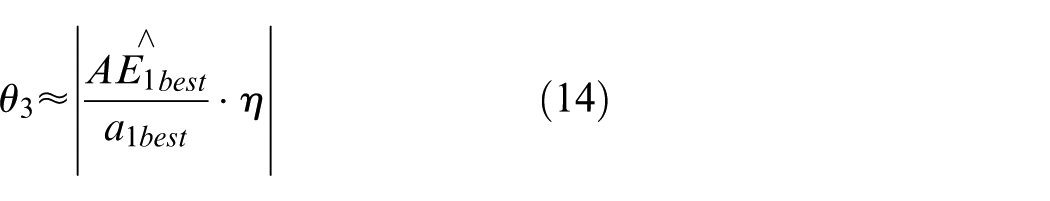
where
Extreme measurement noise brings fault error and affects precision of an image-type encoder subdivision much greater than the internal one. Fortunately, the extreme measurement error can be detected and removed effectively after applying machine vision technique of RANSAC. As a result, the proposed composite RANSAC-LSE subdivision algorithm makes it robust to noise and errors resulting from the decline of grating image quality such as code disk spots or image circuit noise and therefore ensures the accuracy and precision of a photoelectric rotary encoder.
Analysis of anti-noise and anti-spot performance
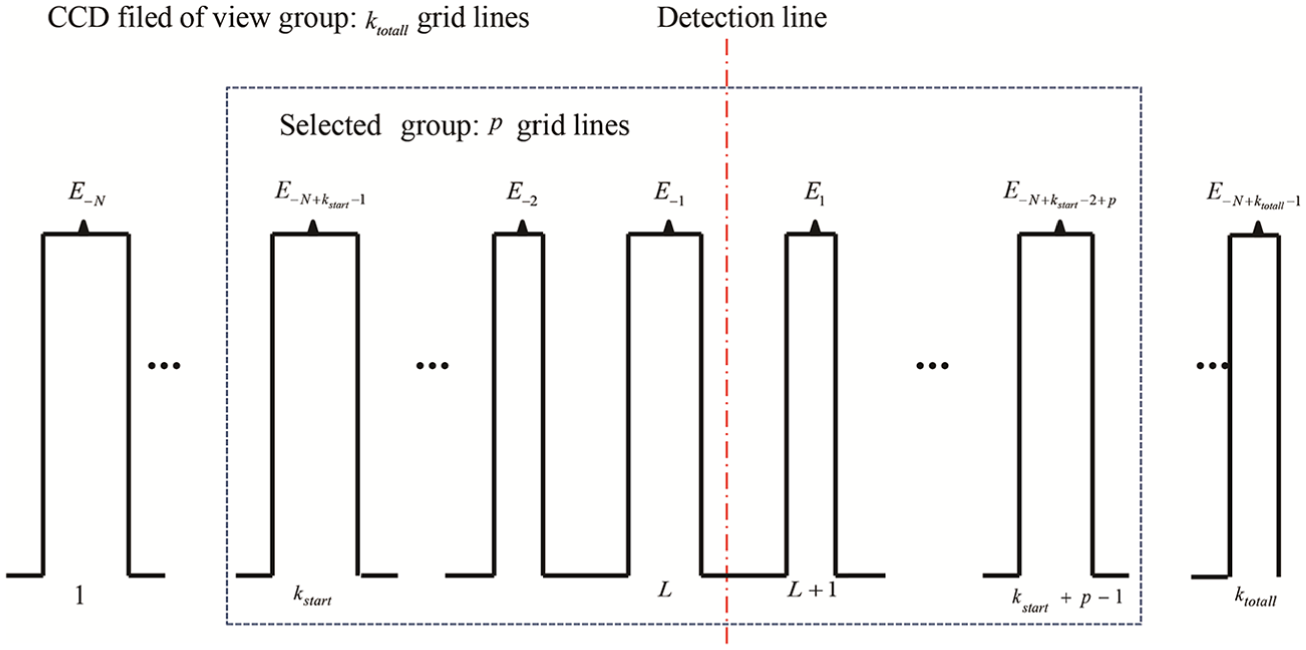
In order to simulate the ideal grating grid line image data, we used the periodic binary PWM pulse function because the code disk had two kinds of grid lines with different pulse duty cycles. For instance, the narrow pulse with duty cycle of 40% representing bit-0 while the wide pulse with duty cycle of 80% representing bit-1. Both bit-1 and bit-0 pulses shared the same pulse width (Let’s set pixels in this case). Assuming the valid pixel range and therefore there were 20 pulses in the image range, detection line was supposed to be the center of image area. Then we set high value to pixel value and low value to. Ideally, grating grid line pulse centers were listed from left to right as:
In order to simulate the real case, we added white Gaussian noise (20 dBW) with a mean of zero to mimic internal image noise and also added a spot to
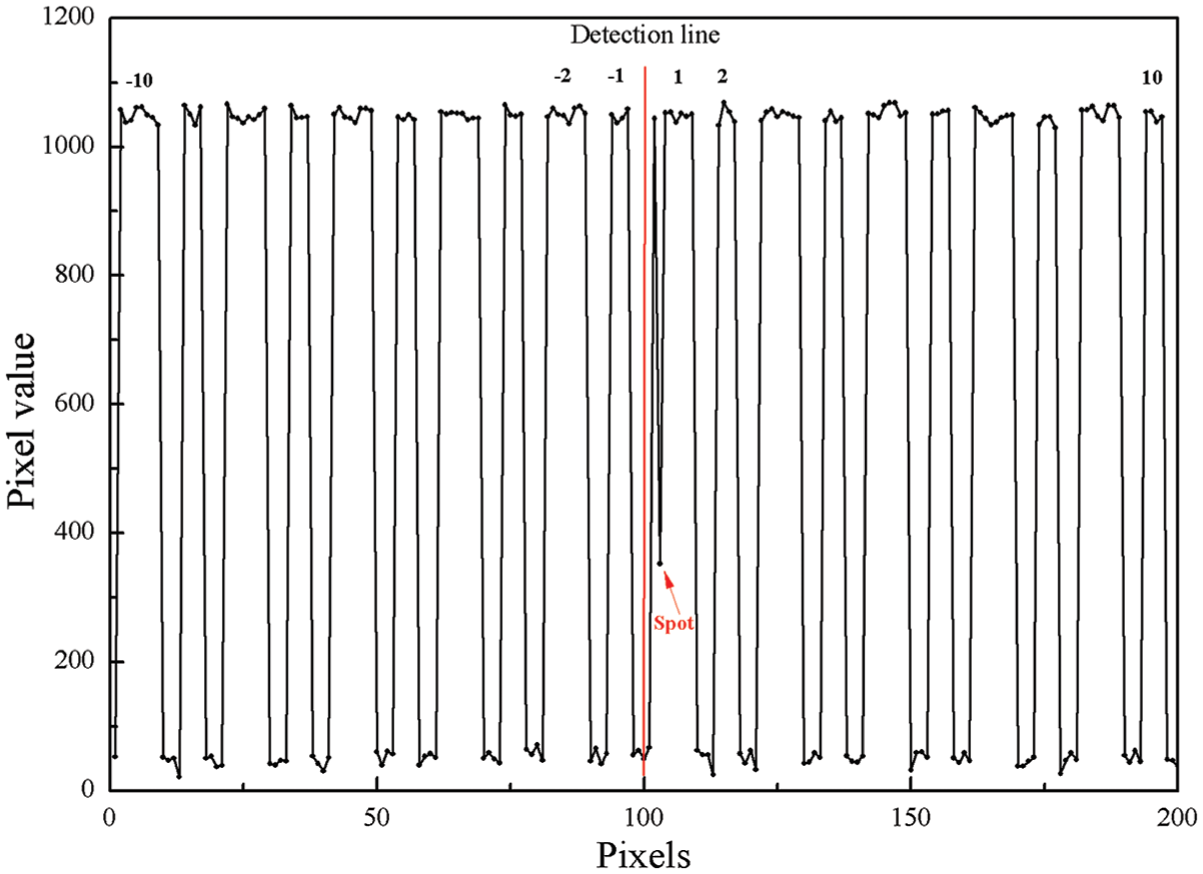
Noised and stained code disk grating signal simulation.
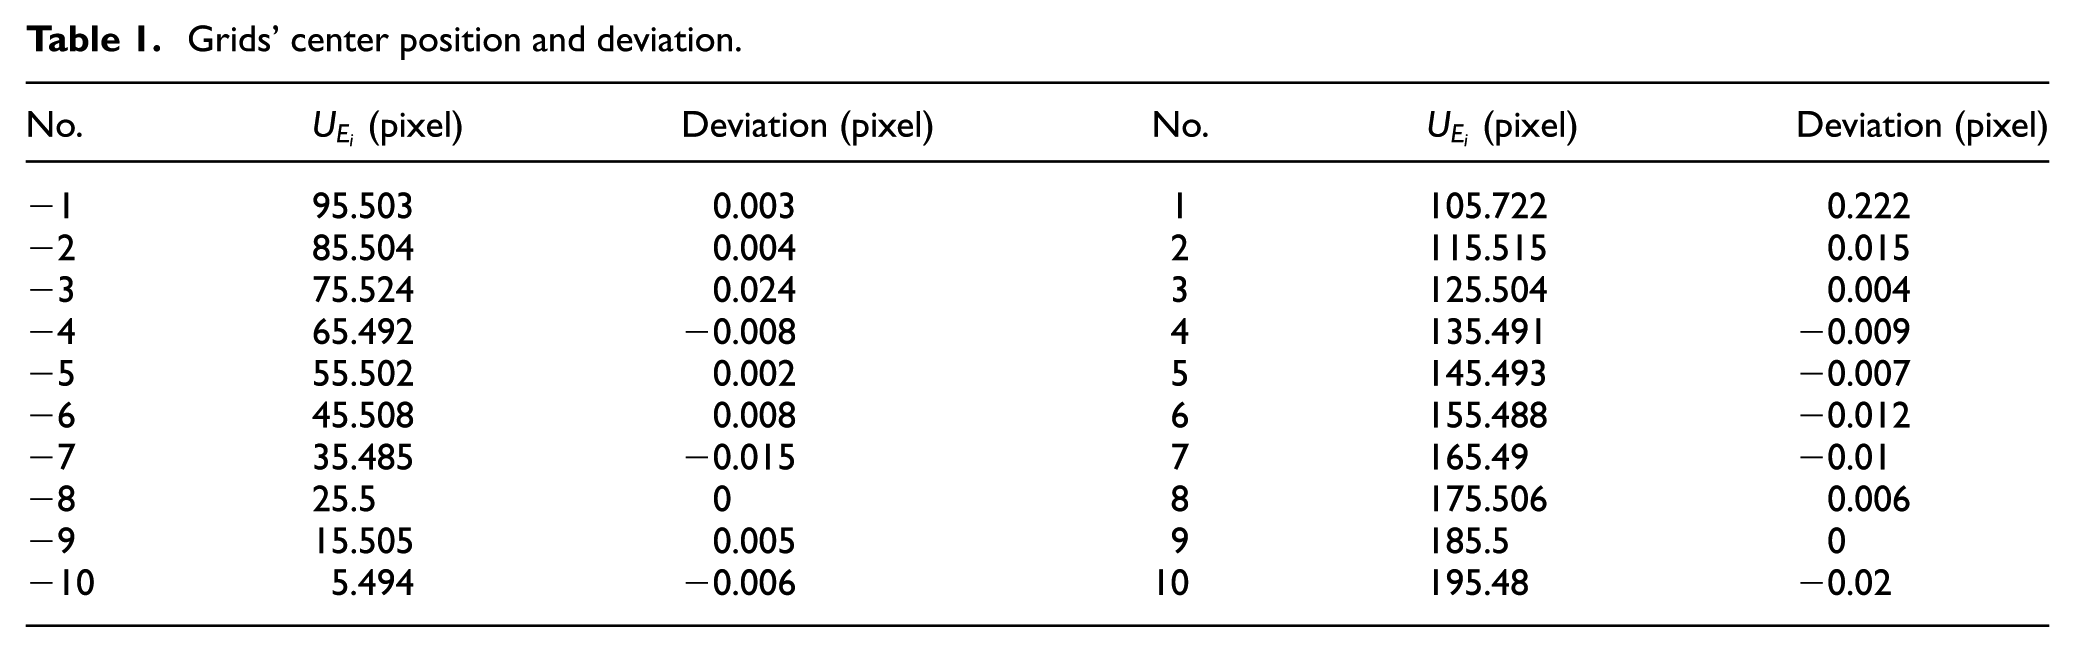
In Table 1, corresponding grating grid line center position and deviation are listed by calculating “centroid” of pulses. All of the grid line centers seemed to swing close to the ideal centers because of the added white noise. Especially the spot grid line (No. 1) had a largest deviation because its pulse image was stained (see Figure 5).
Grids’ center position and deviation.
We calculated subdivision angle
We repeated the process above by adding white Gaussian noise and random spots for 1000 times and calculated final subdivision angle results shown in Figure 6. (For better illustration,
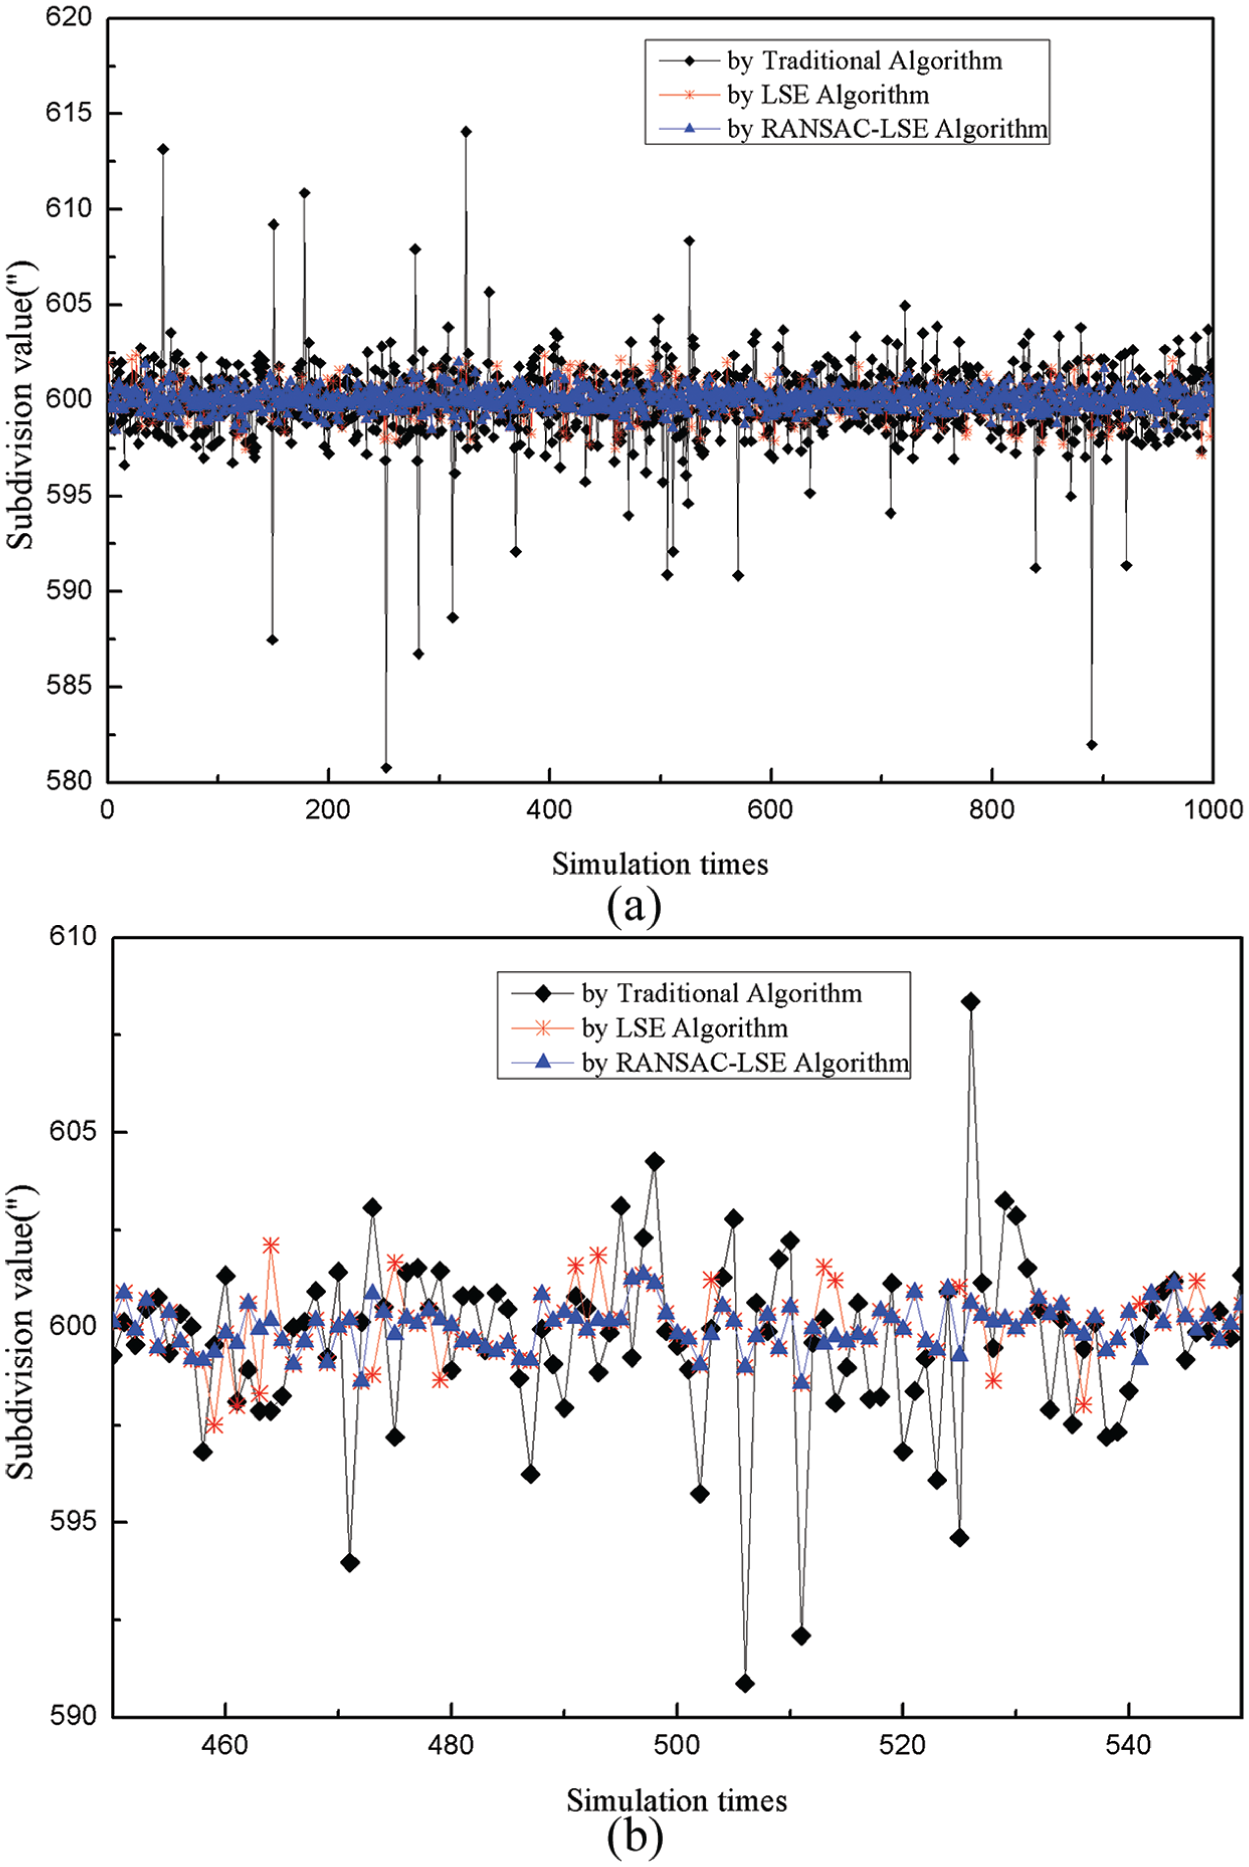
Subdivision simulation with noise and spot signal for 1000 times: (a) subdivision simulation for 1000 times and (b) partial enlarged detail of simulation.
Experiment and results
In order to test proposed algorithm easily, in this paper, a photoelectrical theodolite composed of both horizontal and vertical single-track absolute encoders was selected as a test device. And a certificated test environment shown in Figure 7 was set up to verify precision and accuracy performance of proposed algorithm. It consists of a collimator, multi-teeth rotation tables, communication cable, and other components. The collimator is of 550 mm focal length and 1:10 aperture. The horizontal multi-teeth table had an angle calibration error less than
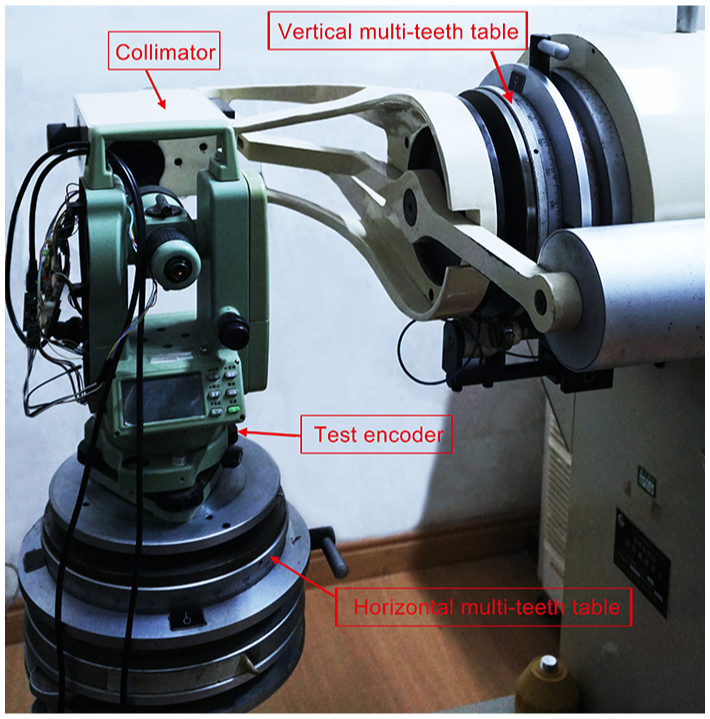
Calibration test environment setup for evaluating performances of proposed algorithm.
Components of a single-track absolute encoder inside theodolite are shown in Figure 8. A signal processing circuit board was designed to drive linear CCD of test encoder and to implement subdivision algorithms. The circuit could also collect observed code disk image and sent it to PC by communication port for further analyzing in MATLAB. The test encoder’s code disk had 1080 grid lines uniformly distributed in one circle and therefore
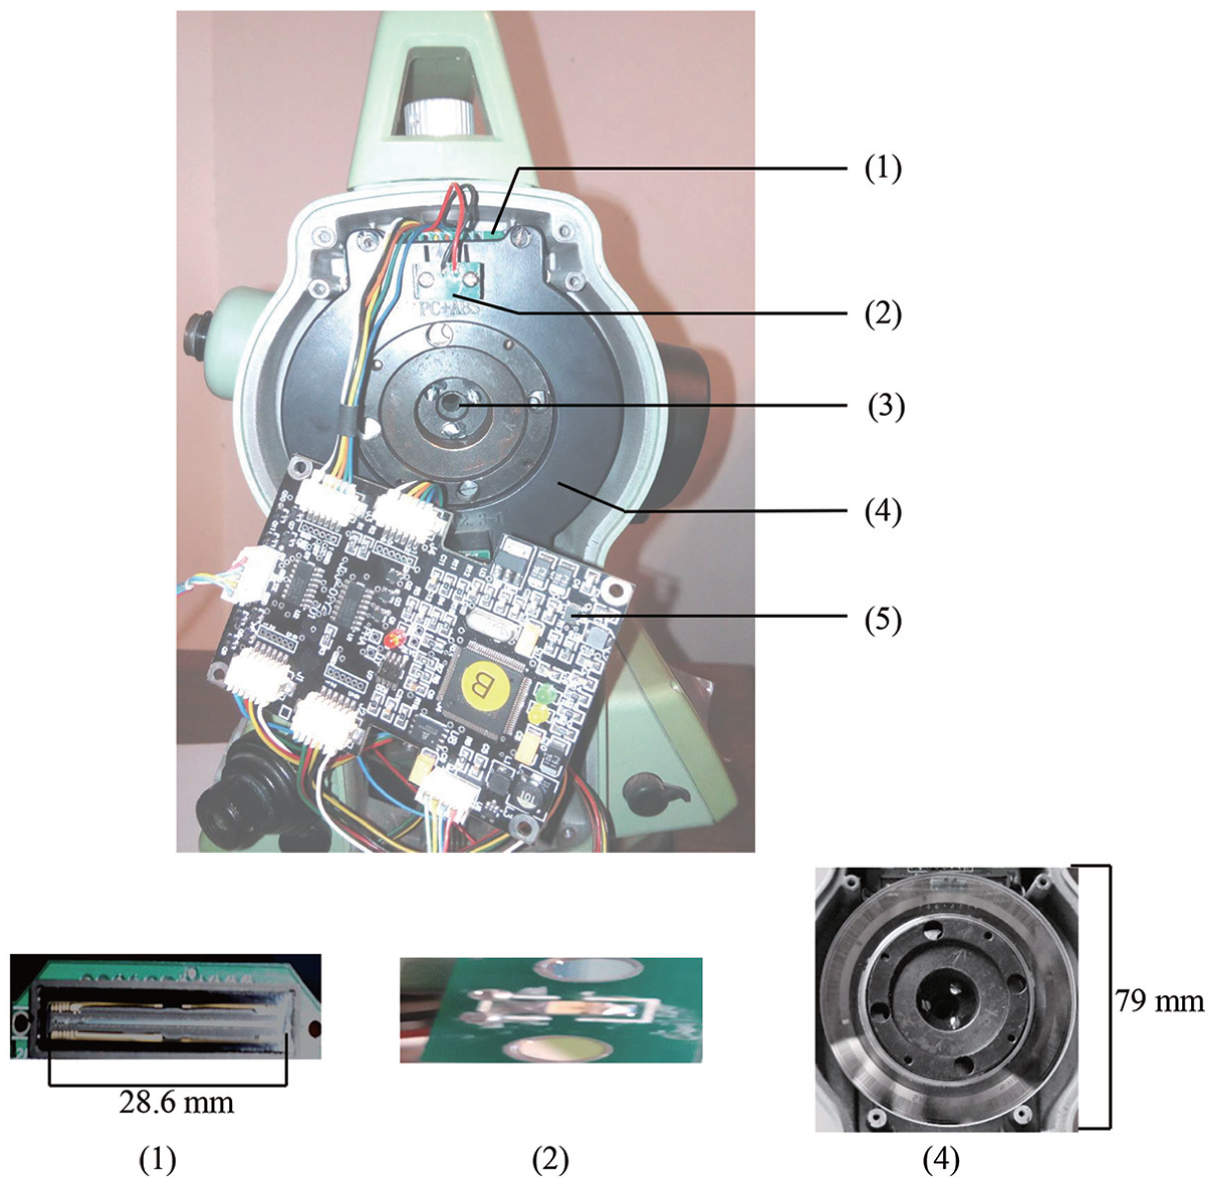
Components of single-track absolute encoder inside a photoelectrical theodolite: (1) linear CCD: 2088 pixel elements, each of the pixel element size is
Code disk image collection test
The test encoder’s code disk image data were collected by the circuit board and some typical abnormal code disk images were recorded and shown in Figure 9. The boarder of a grid line pulse image always contained three parts: top, edge, and bottom. The top and the edge of a pulse image had major information of angle and inevitably they could be affected by noises and spots.
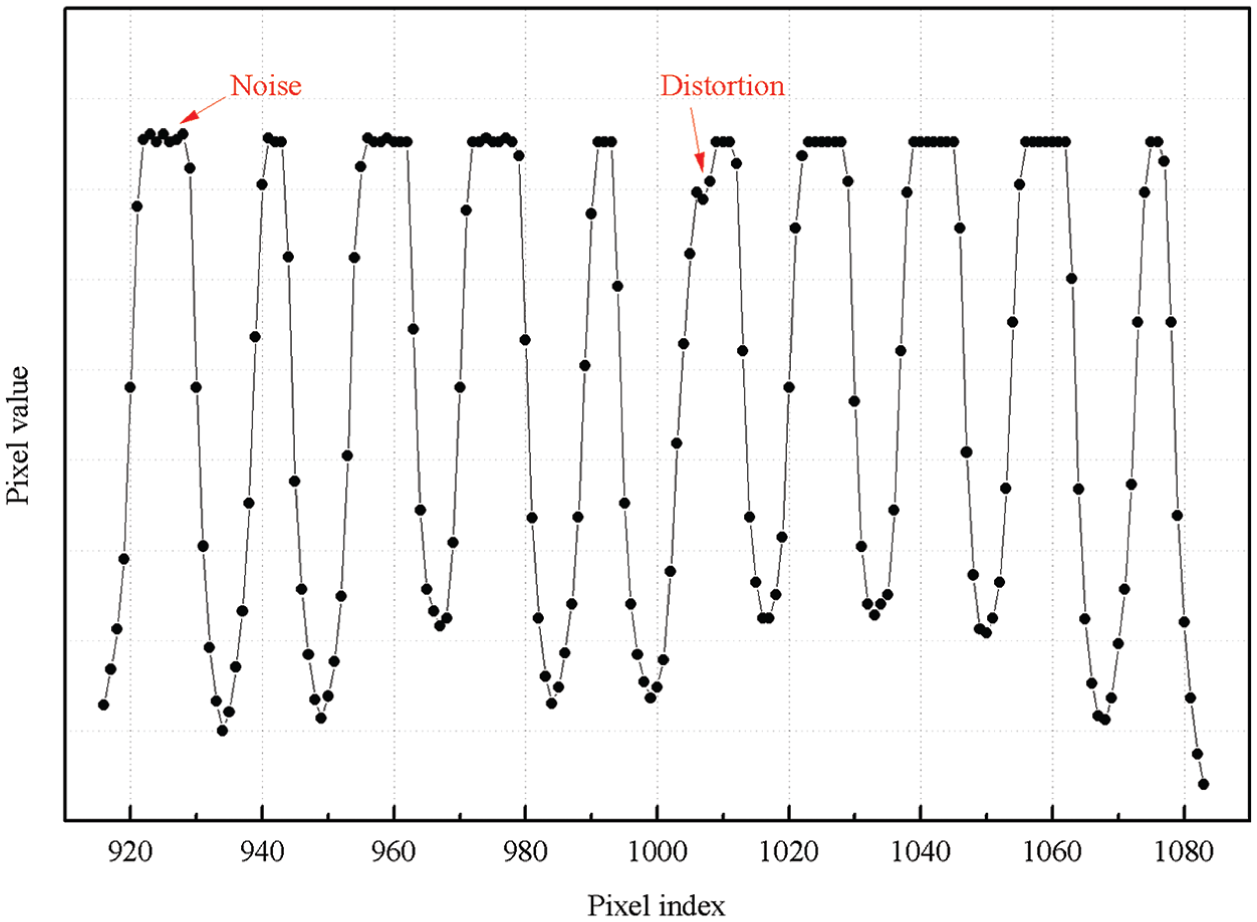
Typical distortion and noise of code disk image data from experiment device.
In Figure 9, the top of the first grid pulse was polluted by random noise and signal collapsed at the left edge of the sixth pulse. Both noise and distortion of a grating image affected the estimation of a corresponding pulse center when “centroid” is calculated. Consequently, measurement error would be introduced if the problem grating image was used for subdivision with the traditional way. Fortunately, these distorted grating pulses could be detected automatically and fault errors of measurement could be corrected effectively after the proposed RANSAC-LSE algorithm is applied to keep measurement precision and accuracy.
Repeatability test
Repeatability performance in this paper was analyzed as twice of the standard deviation (2 STDEV) of measurements according to British standards institution. As a result, measurement could be determined to be repeatable when variation of measured results was smaller than 2 STDEV with a probability of 95% statistically.
In this experiment, we turned the test encoder to a random angle and locked its shaft, and put it on the steady basement of calibration platform and recorded its subdivision output for 100 times by the same person and under the same condition in a short period of time. As subdivision value was sensitive to image noises, angle output deviation always fluctuated. According to Figure 10, the standard deviation of proposed algorithm’s 100 outputs was only

Repeatability test result of proposed subdivision algorithm: (a) scatter gram of 100 output deviations, the dot lines represent the standard deviation and the dashed lines represent twice of standard deviation (2 STDEV) according to British standard institution. (b) Histogram of 100 measured outputs, 95% of test results located within 2 STDEV boundary and the histogram had a normal distribution curve shape.
For comparison, repeatability results of three different subdivision algorithms are illustrated in Table 2. Obviously, proposed RANSAC-LSE algorithm with 2 STDEV performance of
Comparison of repeatability test results by different algorithms.
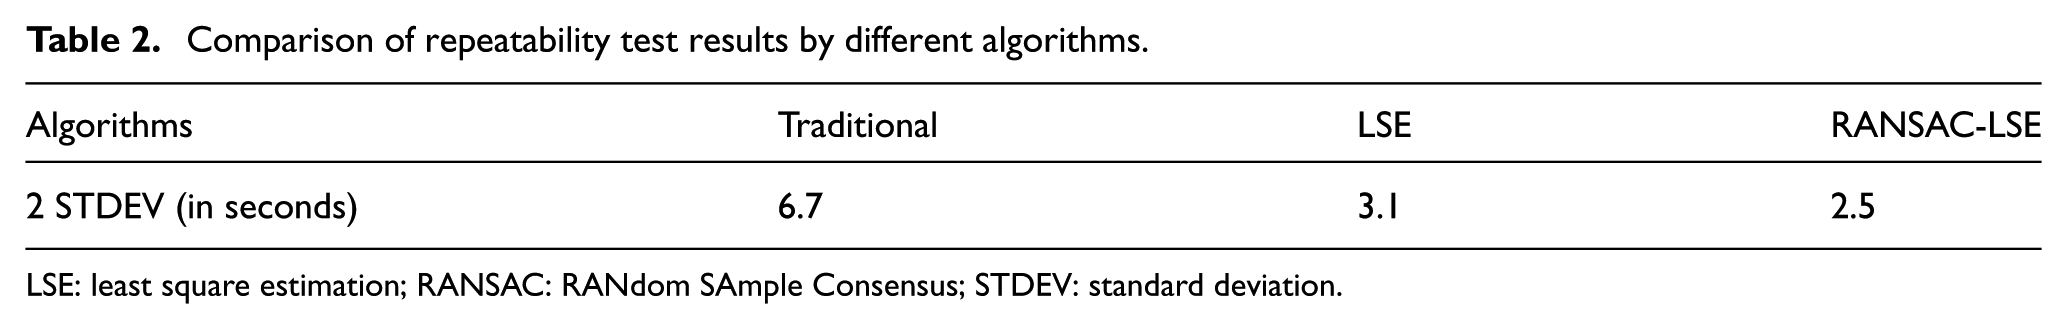
LSE: least square estimation; RANSAC: RANdom SAmple Consensus; STDEV: standard deviation.
Accuracy test
We tested accuracy performance using the standard calibration platform shown in Figure 7. In a horizontal turning range of 0° to 360°, 23 test points uniformly distributed of one circle were selected. And at each test point, measurement error was recorded by comparing encoder output with multi-teeth rotation table output. Absolute error of 23 test points by different algorithms is illustrated in Table 3 for comparison, and the standard deviation of error was reduced from
Absolute error of 23 test points uniformly distributed in one circle.
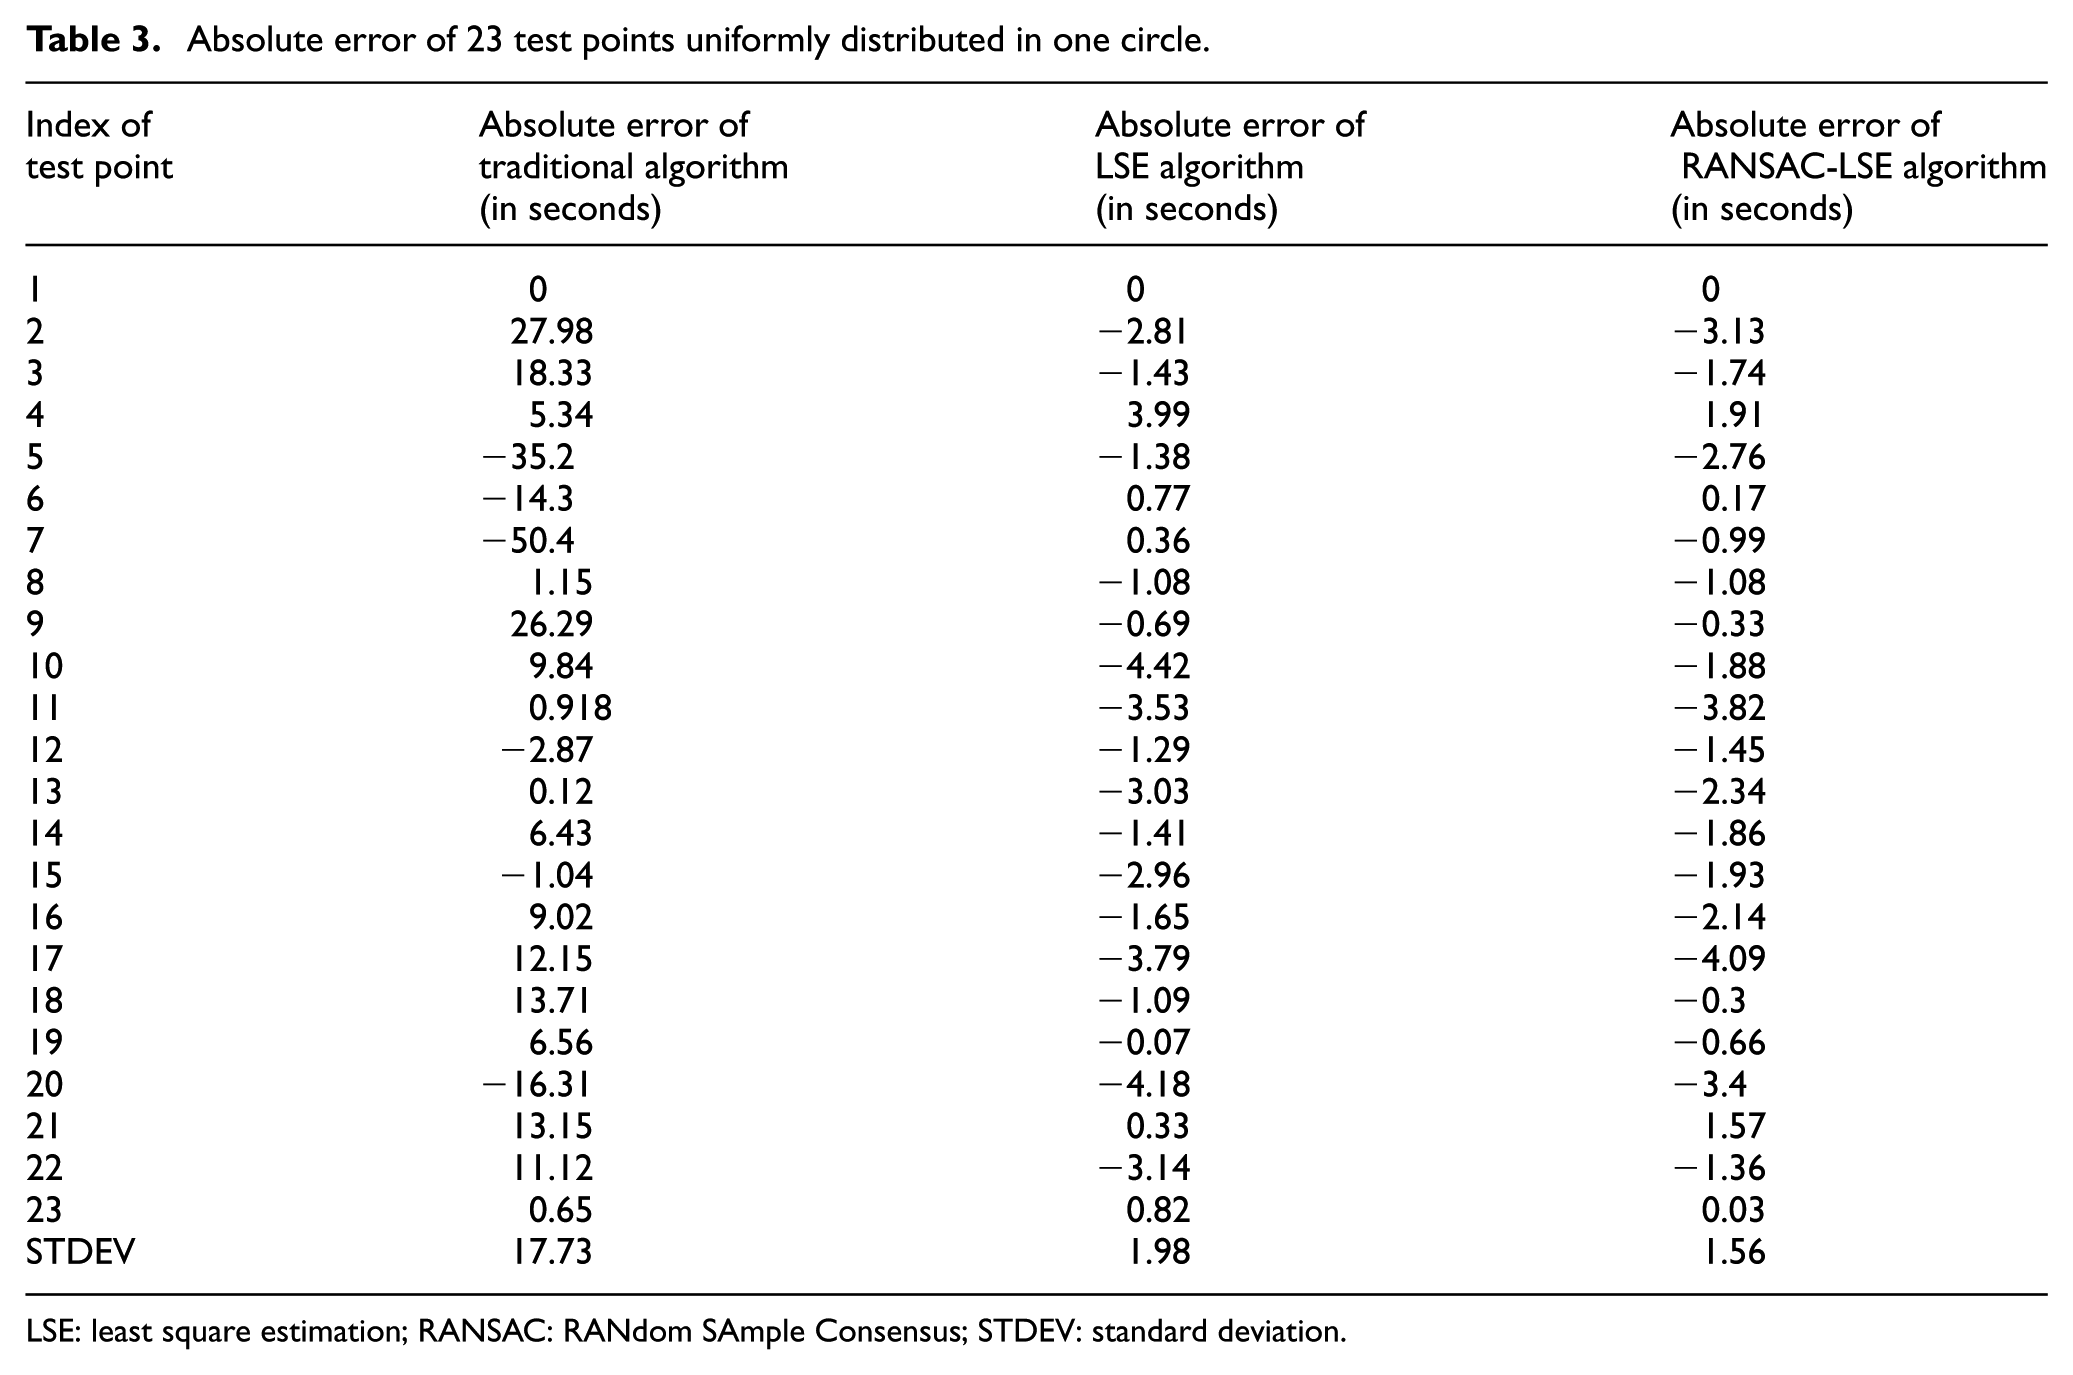
LSE: least square estimation; RANSAC: RANdom SAmple Consensus; STDEV: standard deviation.
According to Table 3, the RANSAC-LSE composite algorithm did not seem to show obvious accuracy performance when comparing with the LSE algorithm due to the following reasons: (1) by detecting and removing outliers automatically, RANSAC was effective in eliminating the fault error of measurement when there was a distorted grating grid line image, and the LSE algorithm was also robust because of its capability of finding a fitting line according to all input images for subdivision. It should be noted that LSE used the distorted grid image (if existed) together with other normal images and therefore it cannot find the best model. (2) For most of real test cases, fault errors were not normally seen, and therefore, the RANSAC-LSE algorithm had slightly better performance than the LSE algorithm when input grating image was provided without any distortion. (3) RANSAC found the best model with probability and it output uncertain results while the traditional and LSE algorithms had certain outputs.
Despite that, RANSAC-LSE still exhibited better error immunities than LSE and traditional algorithms, and especially had a capability of dealing with fault errors which usually had catastrophic effects on precision and accuracy.
Calculation speed test
We collected the code disk image and processed it with three different algorithms by repeating for 1000 times in MATLAB, which was installed in Windows 8.1 with an Intel I5-4200 core CPU (1.6 GHz and 2.29 GHz) and a RAM of 4 GB. Then the “tic” and “toc” commands were used to analyze the algorithm’s elapsed running time. The results are listed in Table 4 for comparison.
Comparison of calculation speed from different algorithms when repeating the process 1000 times.
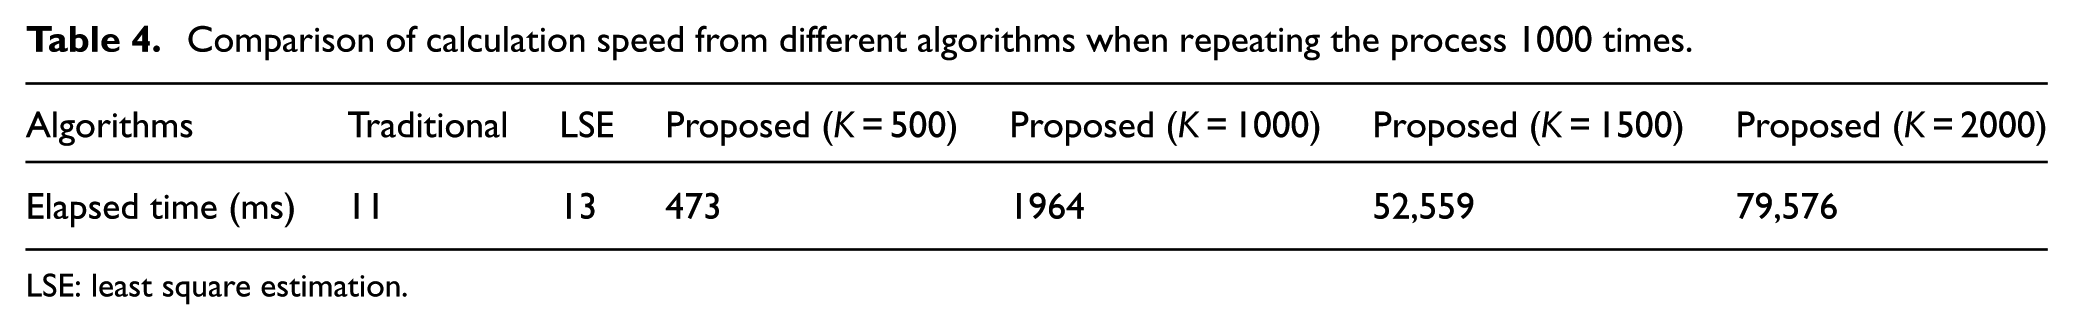
LSE: least square estimation.
Like all other machine vision technologies, the proposed RANSAC-LSE algorithm also demanded more calculations than the other two. And the calculation elapsed time increased when an iteration number K was increased from 500 to 2000. That may have two different means: (1) the iteration time needed to be limited to avoid long-term calculation and (2) the averaged calculation time was no more than 79.6 ms even when K was set as 2000, indicating that it could still satisfy most scenarios of measurement in the view of calculation speed.
Discussion and conclusion
Precision and accuracy are the key performance indicators (KPI) of a photoelectric encoder and there are several ways to improve it. Normally, a high-resolution linear CCD with a smaller pixel element size can be used to observe more and better image data of a code disk to improve the KPI, but it also increases the costs and the amount of input data to be processed. In this article, we focus on the subdivision algorithm’s contribution to the KPI without any increase of costs and input data amount.
Fault errors caused by code disk spots or extreme image noise always brought catastrophic effects to the KPI which had been proved by simulation section. By analyzing the character of fault errors, they can be recognized as outliers according to the general principle illustrated in Figure 4. Based on this, this article proposes an improved subdivision algorithm using a machine vision technique to reduce fault errors effectively and automatically.
Like other machine vision techniques, it should be noted that RANSAC is an iterative algorithm which demands extra computational resources. RANSAC helps to find the best model with lots of calculations which are proportional to the iteration number K. In this case, K should be increased to improve the accuracy of measurement if the calculation capacity is strong enough. In practice, researchers need to find the right balance between accuracy and the calculation speed, and we recommend K is set to no less than 1000 to keep accuracy performance if a computational resource is strong enough.
In this paper, an improved subdivision formula which combined RANSAC and LSE for single-track absolute encoder was given. By removing outliers of observed sample pulses with RANSAC and predicting pulse position for subdivision with LSE, this composite RANSAC-LSE subdivision algorithm features stronger anti-noise and anti-spot capability than traditional one improves accuracy up to
Footnotes
Acknowledgements
The authors thank the anonymous reviewers who helped to improve the quality of this paper.
Declaration of conflicting interests
The author(s) declared no potential conflicts of interest with respect to the research, authorship, and/or publication of this article.
Funding
This work was supported by National Natural Science Foundation of China (NSFC), Grant No. 61601222.