
Abstract
According to the demand of vehicle lithium-ion battery pack, the splice equivalent circuit model is constructed. First, a joint experiment of intermittent discharge and hybrid power pulse characterization, basis of the requirements of parameter identification for the model, is designed to identify the parameters. Study shows that it can identify the parameters. Second, the splice equivalent circuit model of vehicle lithium-ion battery pack is simulated by MATLAB/Simulink, which shows the model is feasible to describe the vehicle lithium-ion battery pack. The simulation error of ohmic internal resistance R0 should be less than 0.05 mΩ. Study suggests that the vehicle lithium-ion battery pack has a stable discharge period within the state-of-charge range of [20%, 80%]. However, when stage of charge is below 20%, vehicle lithium-ion battery pack is no longer stable and the parameters of the splice equivalent circuit model change dramatically.
Keywords
Introduction
Pure electric vehicles as clean vehicles have been paid enough attention because of the pressure of conventional power vehicles on fossil energy consumption. 1 Lithium-ion battery pack is the energy source for pure electric vehicle. Its equivalent circuit modeling methods have attracted attention very much. 2 The equivalent circuit modeling of pure electric vehicle lithium-ion battery pack is based on experimental data without considering the internal chemical reactions. The equivalent circuit model is used to describe the dynamic characteristics of lithium-ion battery pack. It has strong applicability.
In the past researches, the modeling of lithium-ion battery pack has been studied continuously and deeply. Shepherd proposed a Shepherd model to describe the electrochemical characteristics of batteries directly by voltage and current for the first time.3,4 Then the researchers built the Unnewehr model by analyzing the reaction process. After that, Nernst proposed the Nernst model,5,6 which improved the description of non-linearity. While considering the working characteristics of the battery packs, the internal resistance model is constructed, and the structure of the model is relatively simple. Based on the internal resistance model, the Thevenin model6–11 is constructed by introducing the resistor and capacitor parallel circuits to describe the polarization effect inside the battery packs. The dynamic characteristics of the battery packs are simulated to some extent. Comparing the Thevenin model, the PNGV model12,13 considers the cumulative effect of load current on lithium-ion battery packs. At the same time, in order to reflect accurately the changing rule of battery, researchers have successively developed various resistance-capacitance (RC) equivalent circuit models.14–24 More recent study in Wu et al. 25 fully considers the difference of internal resistance between charging/discharging and then improves the Thevenin model. An nRC equivalent circuit model is proposed in Lai et al. 26 The high-order RC model is robust to the variations of model parameters and sensor errors. Wang et al. 27 proposed a splice equivalent circuit model (S-ECM) for the aerial lithium-ion battery pack, which can be used for the accurate estimation of state of charge (SoC).
However, the difference between the monomers of lithium-ion battery pack was not considered during the equivalent circuit modeling process in most of the above-mentioned researches. Disadvantages still exist in some of the simulated description of lithium-ion battery packs. In order to solve these issues, this paper study the equivalent circuit model based on the first-order RC model. First, the time-varying voltage source and the time-varying resistance are connected in series. They are used to describe the effects of the equilibrium state between monomers on open-circuit voltage (OCV) and ohmic internal resistance, respectively. Then, the ohmic internal resistance is divided into benchmark ohmic internal resistance and charge/discharge differential ohmic internal resistance to simulate the change characteristics of ohmic internal resistance of charging/discharging. Meanwhile, the self-discharge internal resistance is used to simulate the self-discharge effect of vehicle battery packs. After that, this paper discusses one method to identify these parameters. Finally, this model is applied to vehicle lithium-ion battery packs.
The rest of the paper is organized as follows. In section “Theoretical analysis,” the construction method of equivalent circuit model and parameter identification method are discussed. In section “Experimental analysis,” the proposed model is verified experimentally.
Theoretical analysis
Construction of equivalent circuit model
According to the research needs of the pure electric vehicle power battery packs, with existing research, considering ohmic effect, polarization effect, and self-discharge effect of the battery packs, the models-ECM is constructed.
Figure 1 is the S-ECM model of vehicle lithium-ion battery pack. Uoc is the OCV of the battery pack, which represents the change of the terminal voltage OCV of the vehicle lithium-ion battery pack, and a large resistance Rs is connected in parallel to characterize the self-discharge effect of the lithium-ion battery pack. Ro is the benchmark ohmic internal resistance of the battery pack, which is used to describe the ohmic effect of the lithium-ion battery pack. Rd is a small variable of ohmic internal resistance caused by discharging. Rc is a small variable of ohmic internal resistance caused by charging. They can reflect the dynamic characteristics of lithium-ion battery pack during discharging/charging. Rp is used to characterize the polarization resistance of lithium-ion battery pack, and Cp is the polarization capacitance of lithium-ion battery pack. Rp and Cp constitute a first-order RC parallel circuit to represent the polarization effect of lithium-ion battery pack and simulate the relaxation effect of lithium-ion battery pack, thus realizing the transient response description of lithium-ion battery pack. Uδ and Rδ are used to describe the equilibrium state between internal interconnect monomers. They reflect the effects of the equilibrium state between monomers on OCV and ohmic internal resistance, respectively. UL is the terminal voltage of lithium-ion battery pack for pure electric vehicle, and I(t) are the current value at both ends.
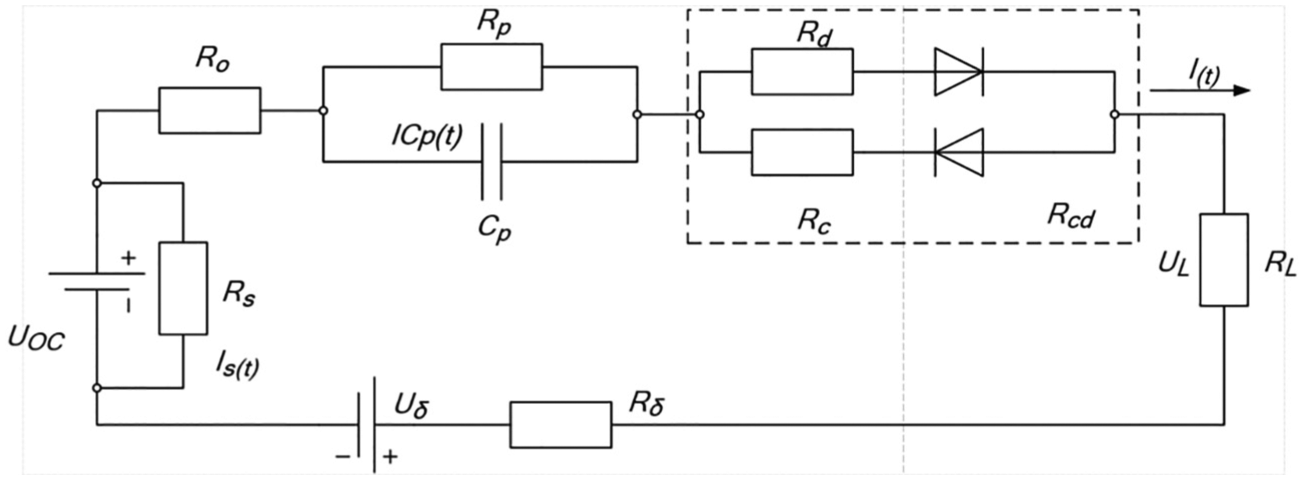
S-ECM model for vehicle lithium-ion pack.
Parameter identification
In order to obtain model parameters, the intermittent discharge and hybrid power pulse characterization (HPPC) joint experiments of vehicle lithium-ion battery pace are designed. The process of designing HPPC is shown in Figure 2.
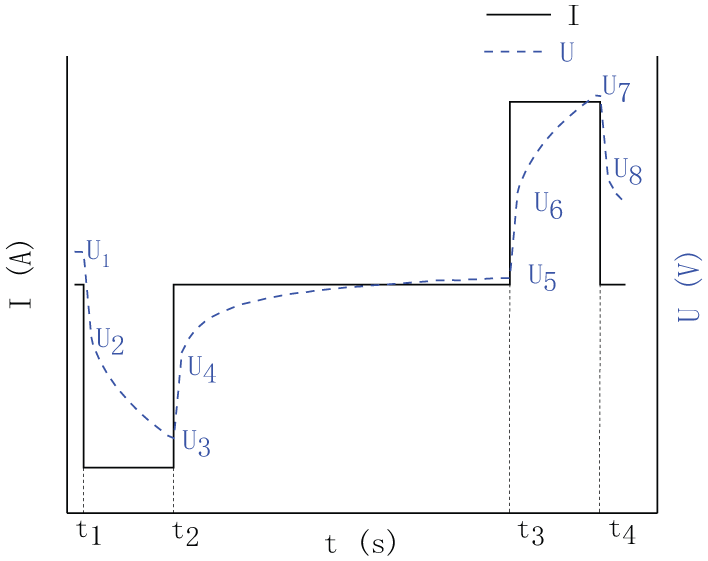
HPPC testing process.
According to Figure 2, the parameters of lithium-ion battery pack for pure electric vehicle can be obtained. The counting method is as follows:
The calculation of Uoc: When the lithium-ion battery pack is fully shelved, the internal electrochemical reaction is stable, which is considered Uoc = UL at this time. Therefore, in Figure 2, Uoc = U1.
Calculate Ro: Ro describes the instantaneous voltage drop from U1 to U2 in Figure 2. Therefore
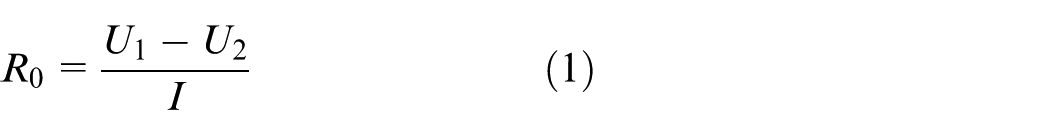
In formula (1), I is the current value of 1C5A pulse discharge.
3.The calculation of Rd and Rc: The ohmic internal resistance of vehicle lithium-ion batteries will cause the terminal voltage to rise and fall instantaneously during pulse charging and discharging. However, there are differences in ohmic resistance to charging and discharging. The difference is expressed by Rd and Rc. Their formulas are as follows
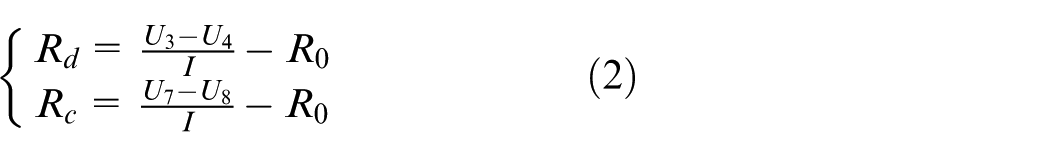
where U3, U4, U7, and U8 in formula (2) are shown in Figure 2, and I is described in formula (1).
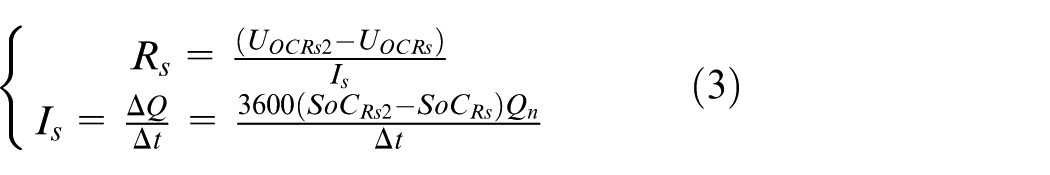
4.The extraction of Rs: For the sake of obtaining Rs, CC-CV is used to charge the pure vehicle lithium-ion battery packs to make SoC = 1. Then the battery is kept on hold for 1 h and the OCV of the battery pack UOCRs is measured. The SoC value is SoCRs at this moment. Shelving for 30 days, the OCV of battery pack UOCRs2 is measured. The SoC value is SoCRs2 at this moment. It is considered that the whole self-discharge process is constant current discharge and the current is Is. Assume that the nominal capacity of the battery pack is Qn. Accordingly, the calculation method of Rs can be obtained from formula (3)
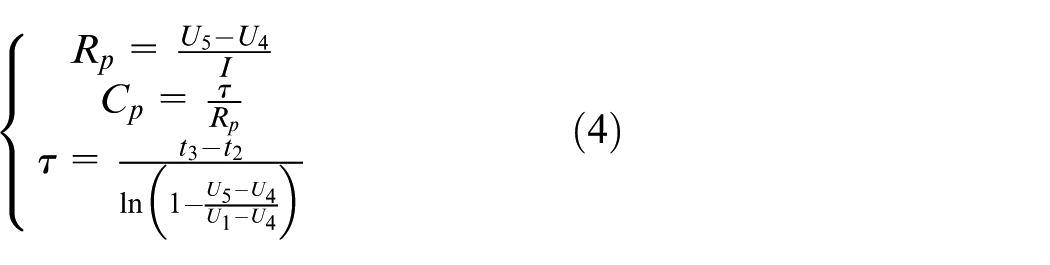
5.Calculation of Rp and Cp: As shown in the HPPC test shown in Figure 2, the formula for calculating the RC response parameter is as follows
6.The calculation of Uδ and Rδ: Uδ and Rδ are used to describe the equilibrium state between the monomer of pure vehicle lithium-ion battery pack. Their calculation methods are described in formula (5)
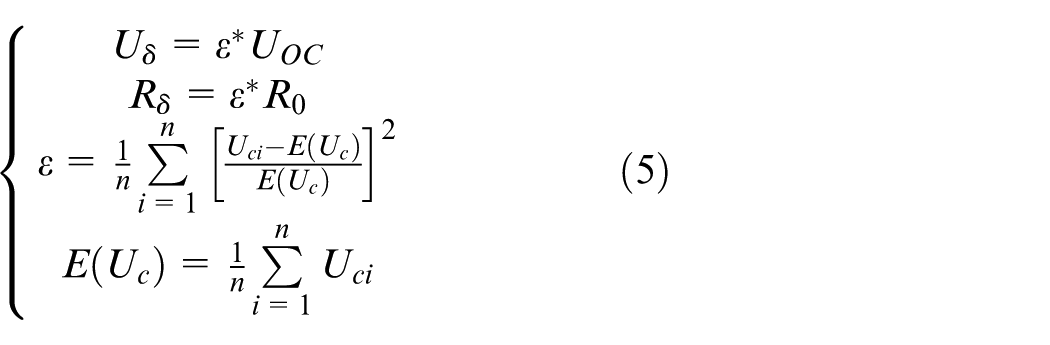
In formula (5), n denotes the number of lithium-ion battery single monomer in the pure vehicle lithium-ion battery pack and Uci denotes the voltage value of ith lithium-ion battery pack single monomer only. ε is the equilibrium state between the monomers, which is used to describe the degree of voltage discrepancy between monomers.
Experimental analysis
Experimental requirements
There are nine parameters of the S-ECM model which need to be identified. The identification requirements of these parameters are not identical exactly. The experimental requirements for identification are displayed in Table 1.
Experimental requirements
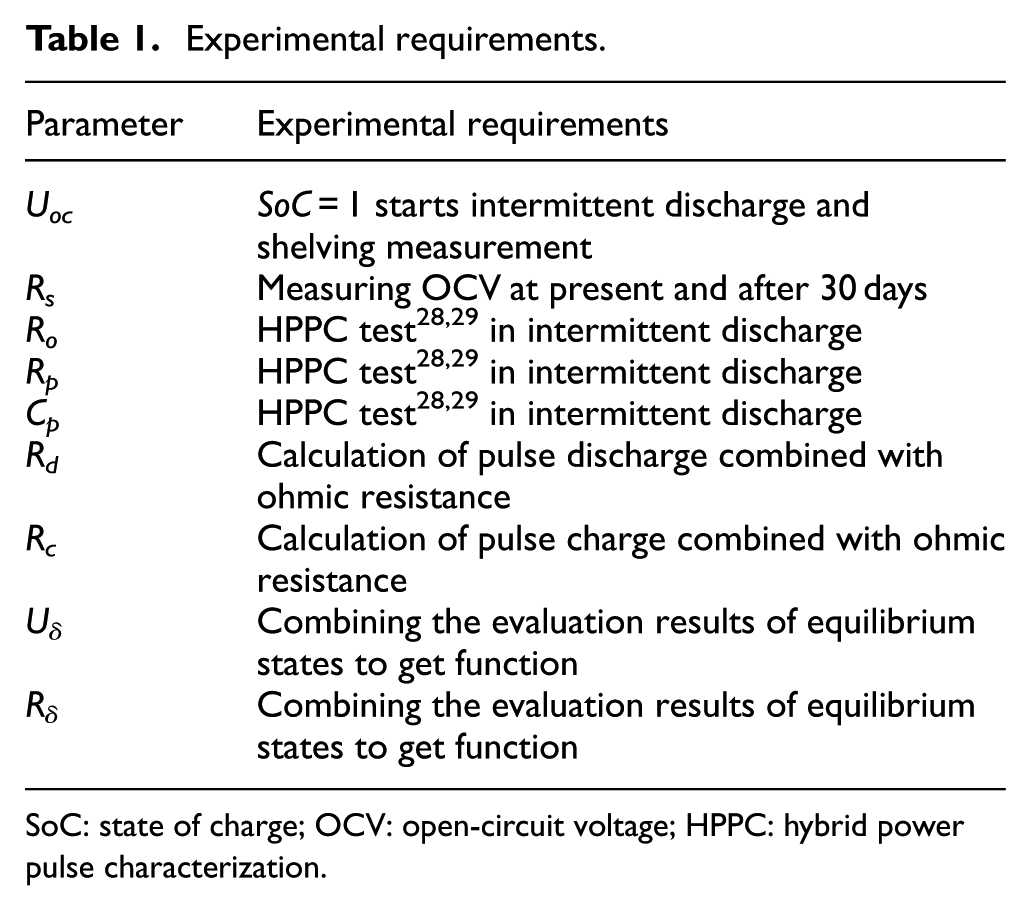
SoC: state of charge; OCV: open-circuit voltage; HPPC: hybrid power pulse characterization.
Experimental design
To verify the correctness of the model and the accuracy of parameter identification, the parameters of lithium cobalt oxide battery commonly used in pure electric vehicles is identified by the power battery test system (company: MACCOR; model: S4000; voltage accuracy: 0.02%; current accuracy: 0.02%). The parameters of lithium-ion battery in this paper are shown in Table 2.
Battery parameters.
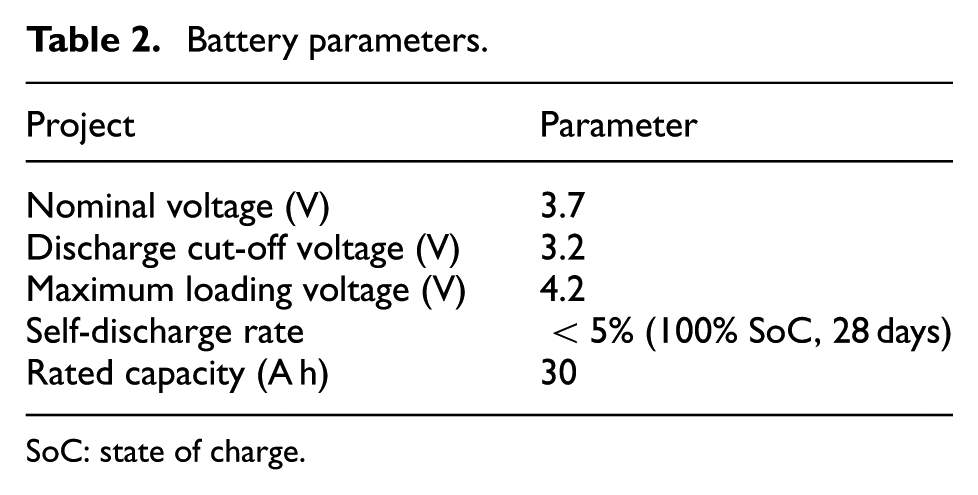
SoC: state of charge.
According to the requirements of Table 1, the intermittent discharge and HPPC joint experiments of vehicle lithium-ion battery pack are designed. First, CC-CV 30 charging of vehicle lithium-ion battery pack will enable SoC = 1. Then the battery is shelved for 40 minutes to stabilize the electrochemical reaction inside the lithium cobalt oxide battery. Then, starting from SoC = 1, 1C5A intermittent discharge is carried out, and after each 5% SoC discharging, it was kept stable for 40 minutes until SoC = 0. The intermittent discharge process is shown in Figure 3.
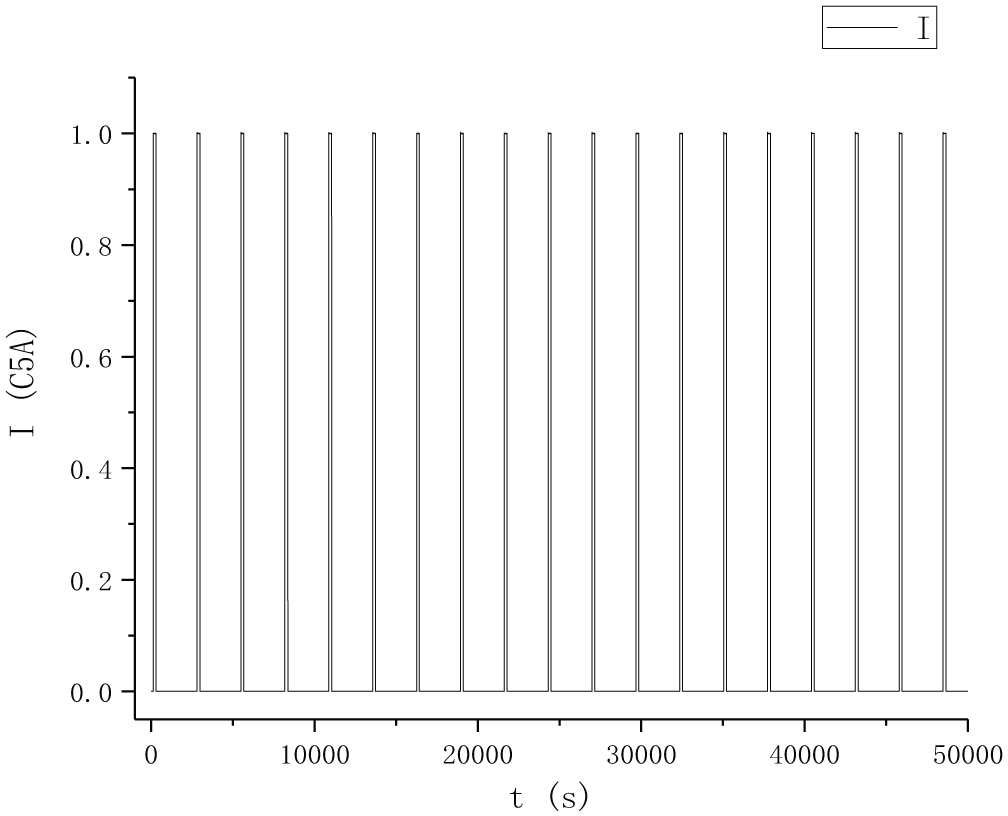
Experimental current diagram.
In Figure 3, a 3-min discharge 1C5A to discharge 5% SoC on time is performed at an interval of 40 minutes, and an HPPC test is performed at the end of the 40-min shelf. Aiming at the parameter identification of S-ECM model of pure vehicle battery pack, the constant current pulse charging and discharge experiments of 1C5A was carried out at 25 °C.
In Figure 2, according to classical HPPC steps, the single HPPC experiment 29 steps are as follows. The first step is to carry out the 1C5A rate constant current pulse discharge 10 s, as shown in the t1 to t2 time section. The second step is to shelve for 40 s, as shown in the t2 to t3 section of the diagram. The third step is to charge for 10 s with 1C5A constant current pulse, as shown in the t3 to t4 time section. The fourth step is to shelve for 40 s. Starting from SoC = 1, HPPC test is conducted every 5% SoC.
Experimental result
Experiments were carried out as in section “Experimental requirements”. The relationship between S-ECM parameters and SoC of lithium-ion battery pack can be obtained by calculating the parameters using the formulas provided in section “Parameter identification.”
The relation curve between UOC and SoC of vehicle lithium-ion battery pack is shown in Figure 4.
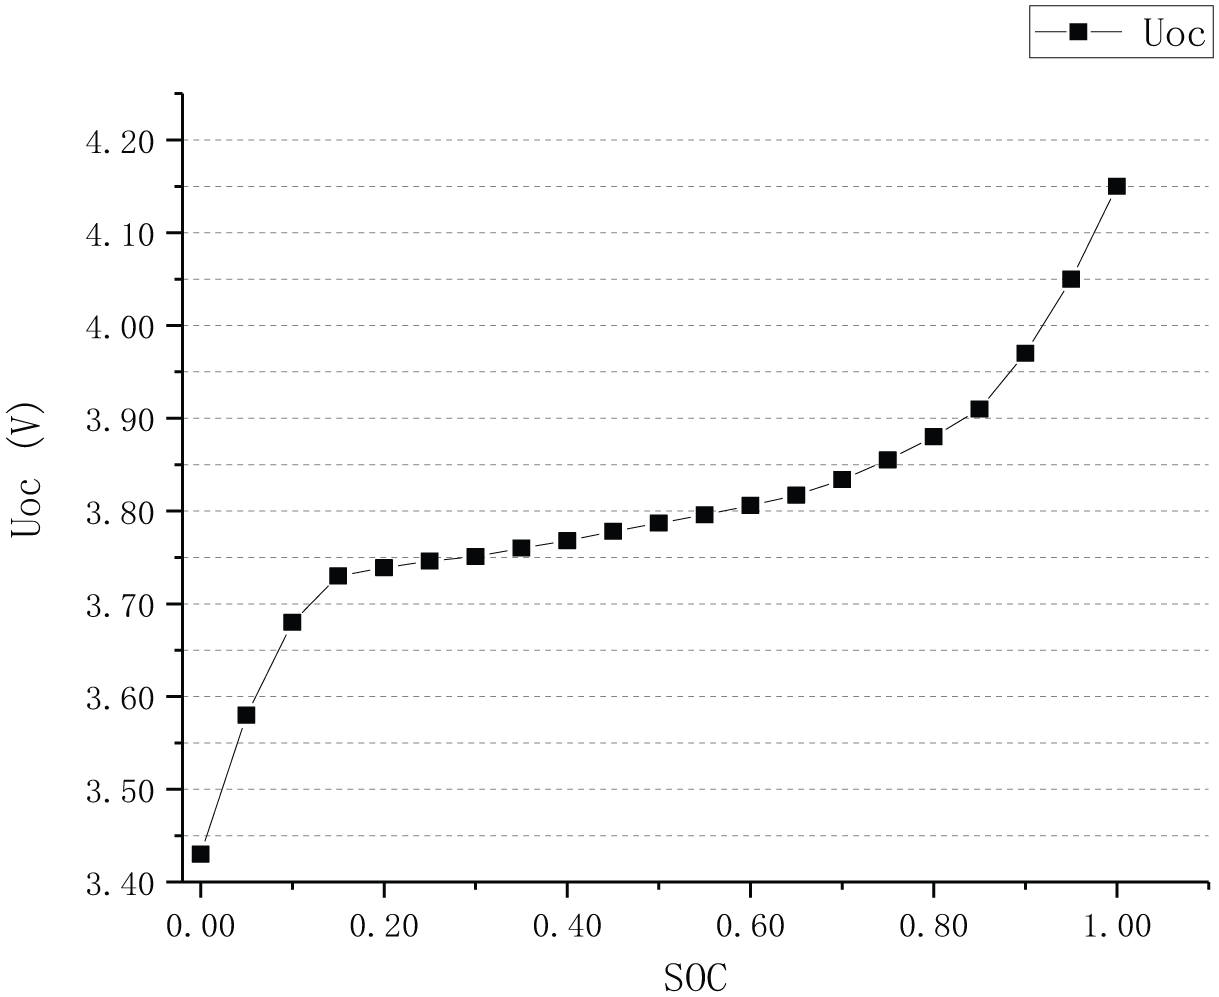
Graph of relation between UOC and SOC.
It is found that UOC and SoC have nonlinear positive correlations. When the SoC is above 80%, the UOC of the lithium-ion battery pack decreases rapidly with the discharge of the battery pack. Then it entered a stable period. When SoC ranged from 80% to 20%, the UOC decreased slowly with the battery discharged. When the SoC is below 20%, the electrochemical reaction inside the battery pack is intense, and the UOC of the battery pack drops rapidly during the withdrawal period.
Graph of relation between ohmic resistance R0 and SoC is shown in Figure 5.
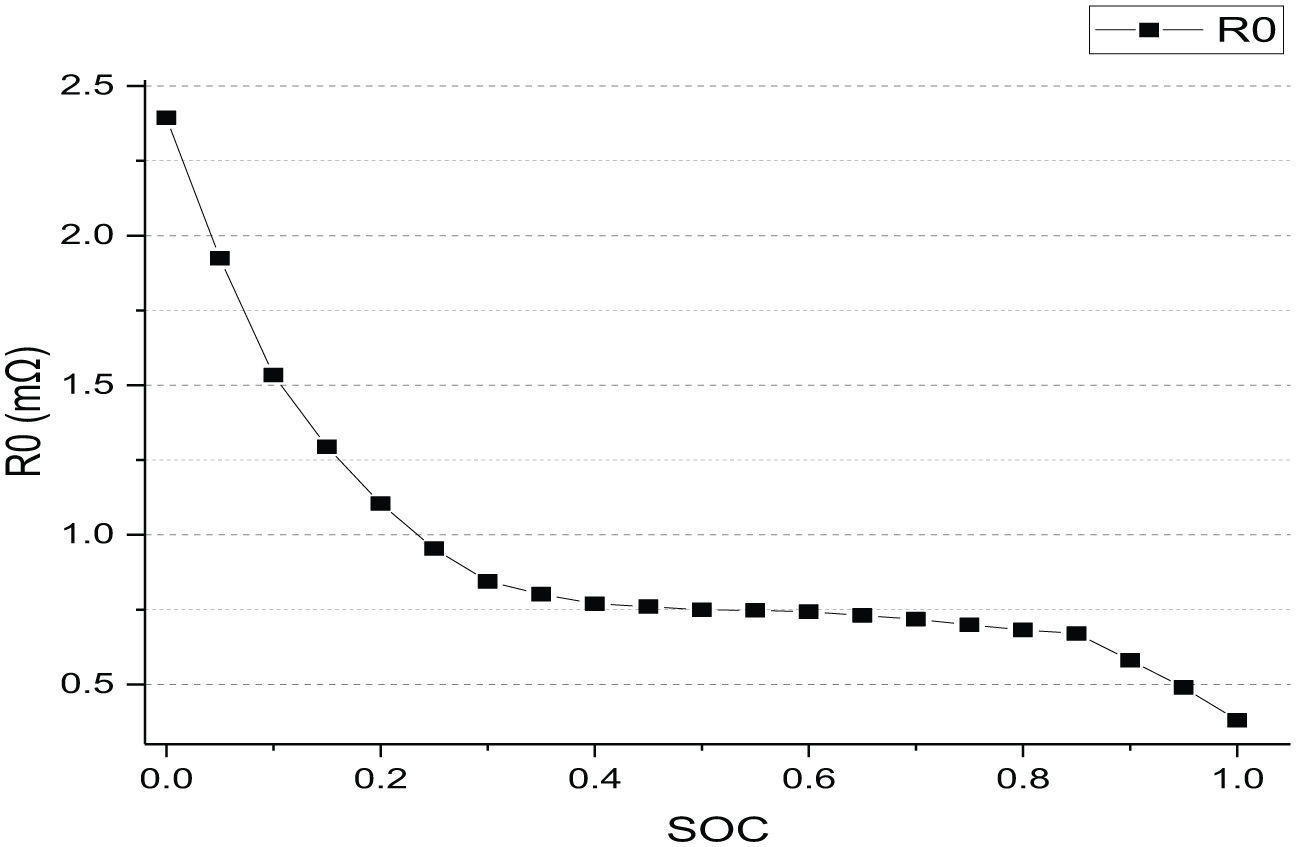
Graph of relation between R0 and SoC.
R0 has a nonlinear negative correlation with SoC. With the discharging of the battery pack, the concentration of charged ions in the battery pack decreases, and the ohmic resistance R0 increases. Ohmic resistance increases sharply when the battery is discharged at a depth of SoC less than 20%.
In Figure 6, the black curve is the graph of relation between discharge resistance Rd and SoC, and the red curve is the graph of relation between charge resistance Rc and SoC. When SoC is higher than 20%, Rd and Rc fluctuate in a small range, and S-ECM introduces these two parameters to compensate for the inaccurate characterization of ohmic internal resistance on the internal resistance of lithium-ion battery pack during charging and discharging. By comparing the two curves, it is found that the values of Rd and Rc are identical basically at the same SoC value. When SoC is below 20%, both Rd and Rc increase rapidly.
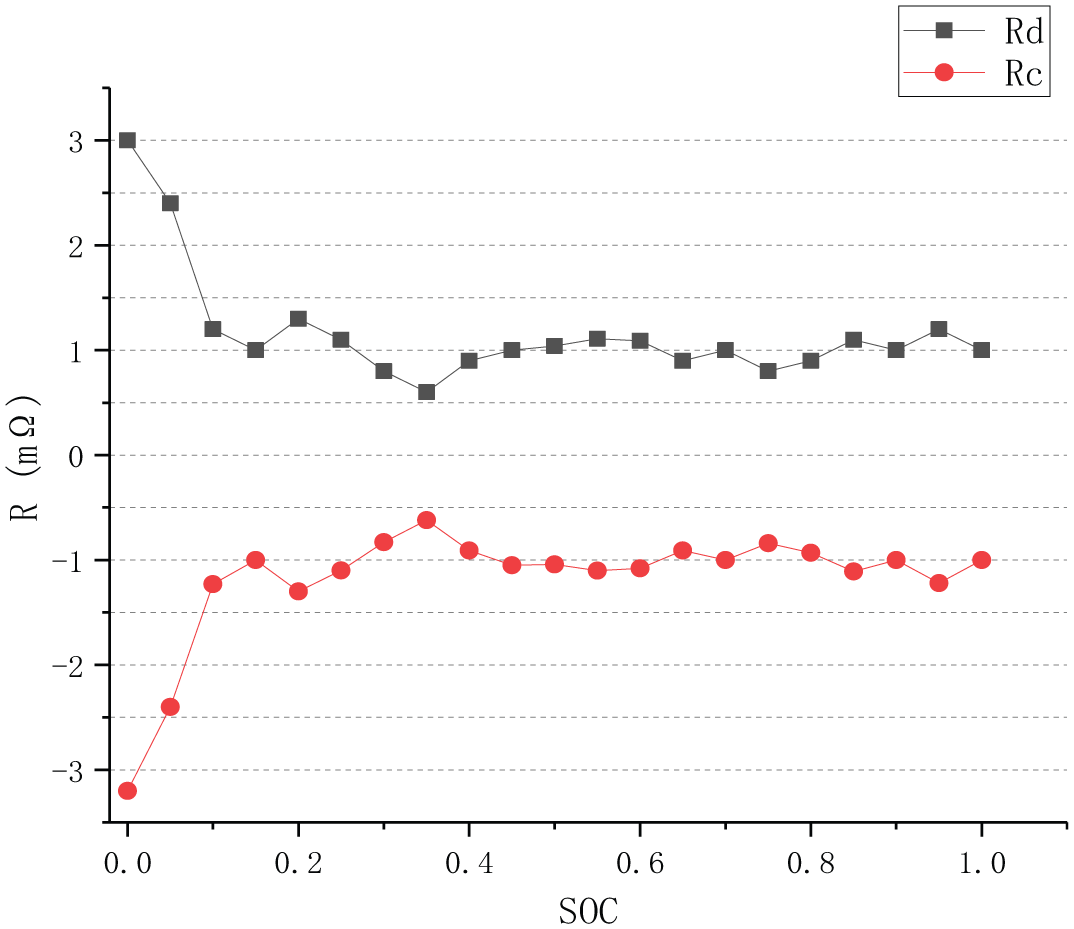
Graph of relation between Rc, Rd, and SoC.
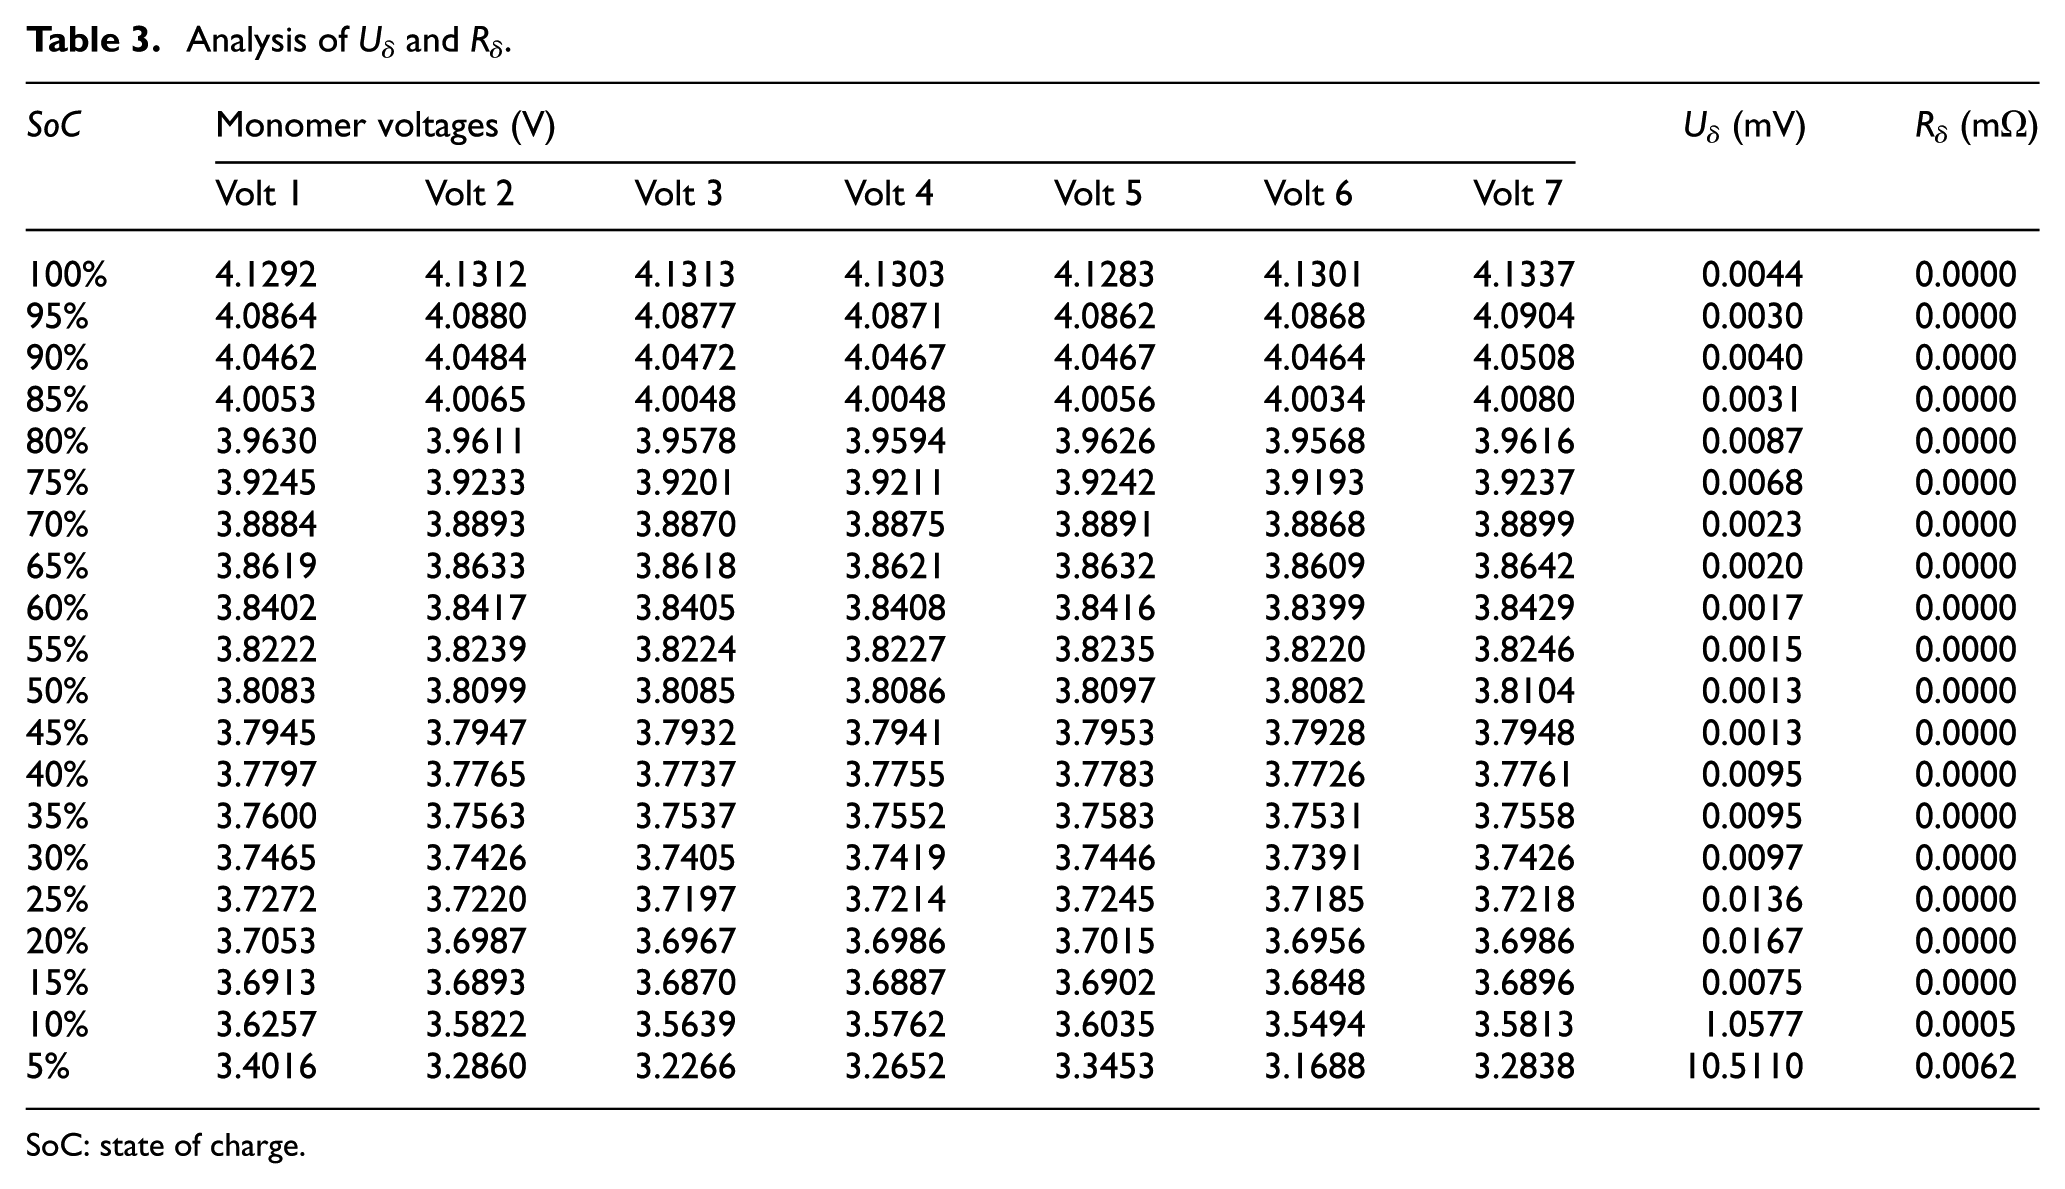
Figure 7 shows that Rc and SoC are not significantly correlated; for obtaining the relationship between Rp and SoC, we can continue the least square fitting. When the SoC is above 20%, the polarization capacitance Cp stays between 2000 and 3000 F, and the fluctuation is small. When SoC is below 20%, Cp increases rapidly, far beyond 3000 F. After that, Uδ and Rδ are analyzed in Table 3.
Analysis of Uδ and Rδ
SoC: state of charge.
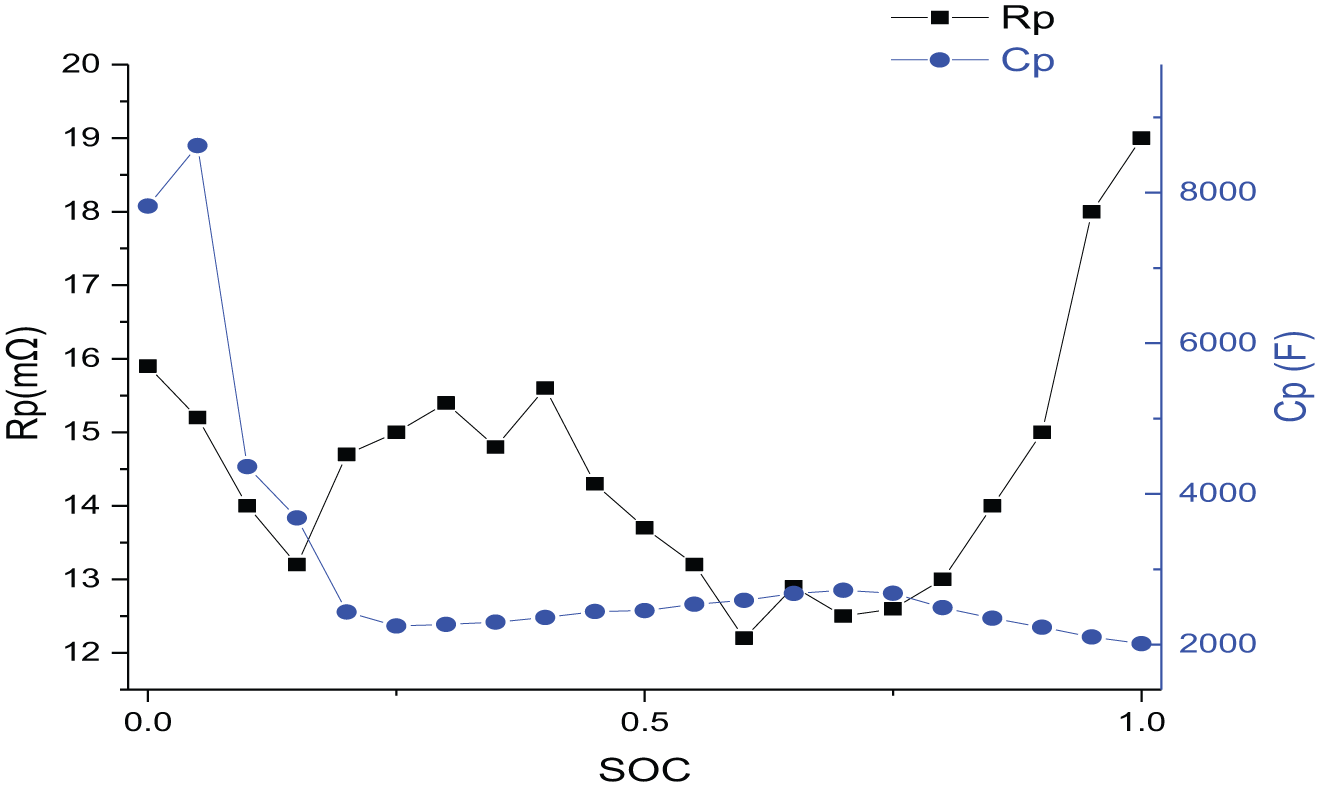
Graph of relation between Rp and Cp
From Table 3, it can be found that the seven batteries used in this paper have good consistency at the beginning of discharge. As deep discharge proceeds, the battery pack becomes inconsistent slowly. When SoC is less than 15%, the inconsistency increases rapidly, Uδ and Rδ increase accordingly. Therefore, Uδ and Rδ can describe the inconsistency between monomers. It also could quantitatively analyze their effects on OCV and ohmic internal resistance.
Simulation and error analysis
The S-ECM shown in Figure 1 is simulated in MATLAB/Simulink to verify whether it can be used to describe vehicle lithium-ion battery pack. The experimental data onto section “Experimental result” is imported into the simulation circuit and the ohmic internal resistance R0 is taken as the observation. The simulation results are shown in Figure 8.
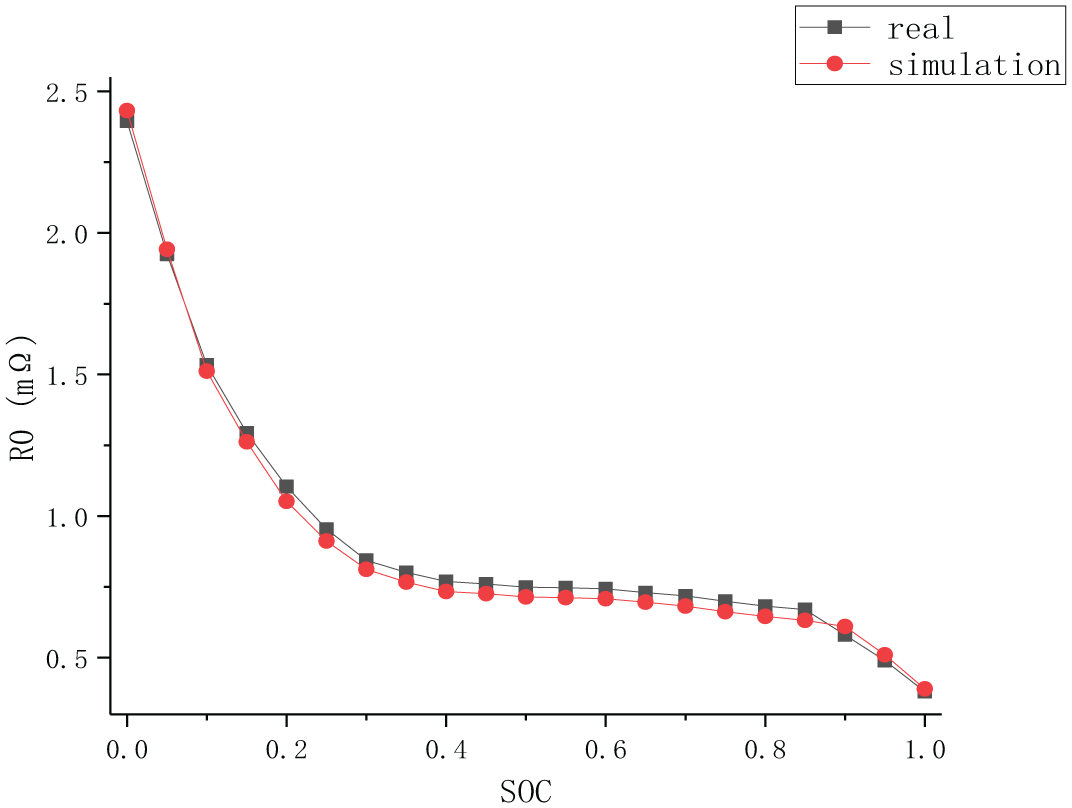
R0 simulation curve.
It can be seen from Figure 8 that the simulation curve is highly consistent with the real value curve. For the sake of quantitatively analyzing the simulation results, the estimated error is calculated, as shown in Figure 9.
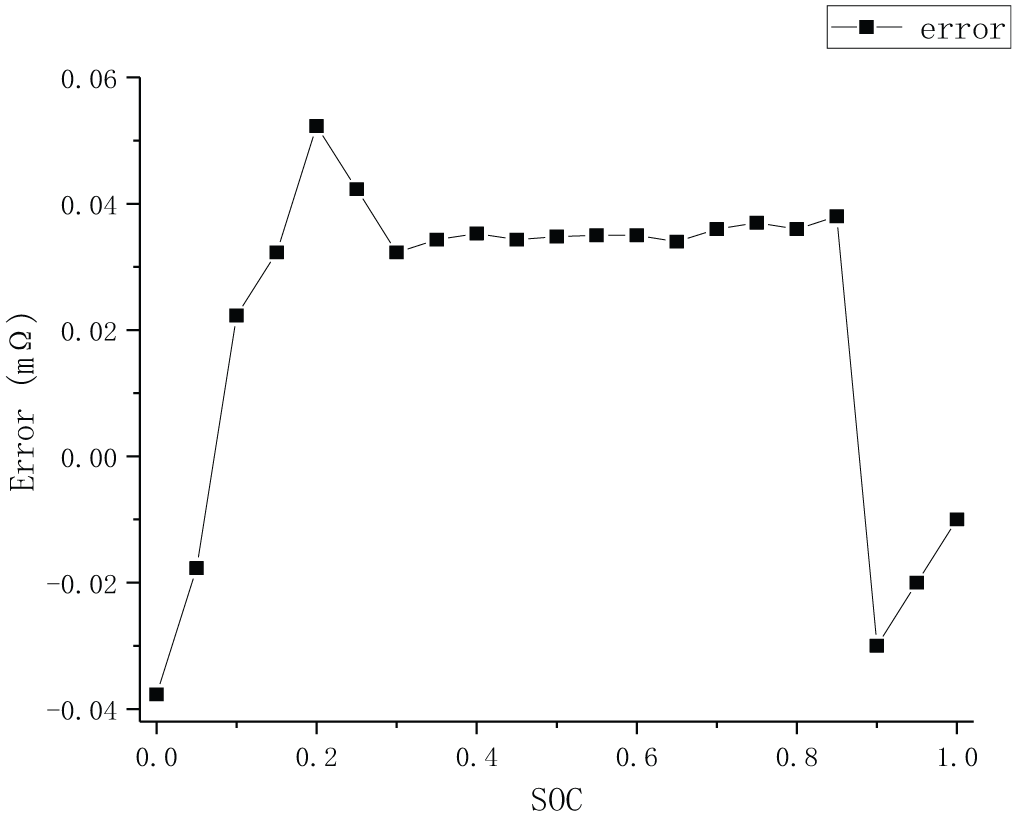
R0 simulation error diagram.
Figure 9 is the R0 simulation error curve obtained from Figure 8, the simulation error = experimental value − simulation value. Figure 9 shows that the error of S-ECM of vehicle lithium-ion battery packs is less than 0.05 mΩ, which meets the description requirement of vehicle lithium-ion battery pack.
Conclusion
The S-ECM is feasible to describe pure electric vehicle lithium-ion battery pack. The S-ECM model of pure electric vehicle lithium-ion battery is simulated in MATLAB/Simulink. The simulation error of ohmic internal resistance R0 is less than 0.05 mΩ.
It is feasible to identify the parameters of S-ECM model of pure electric vehicle lithium-ion battery pack by the joint experiment of intermittent discharge of lithium-ion battery pack and HPPC. This joint experiment can identify the parameters of the S-ECM model.
The pure electric vehicle lithium-ion battery pack has a stable discharge period within the SoC range of [20%, 80%]. The parameters of S-ECM model are stable and have little fluctuation. When SoC is lower than 20%, the concentration of charged ions in lithium-ion battery pack decreases, the electrochemical reaction remains unstable, and the parameters of S-ECM model change sharply.
Footnotes
Declaration of conflicting interests
The author(s) declared no potential conflicts of interest with respect to the research, authorship, and/or publication of this article.
Funding
This research was supported by National Natural Science Foundation of China (No. 61801407), National Key Specialty Construction Project of Clinical Pharmacy (30305030698), National Training Program of Innovation and Entrepreneurship for Undergraduates (No. 201810619018, No.201806190-27, No.201810619067), Southwest University of Science and Technology student innovation fund precise funding project (No. jz18-013).Sichuan Province Science and Technology Support Program (No. 19ZDYF1098, 2018GZ0390, 2017FZ0013), Scientific Research Fund of Sichuan (No. 17ZB0453), Teaching Research Project (18lzx665, 18gjzx11, 18xnsu12), Sichuan Science and Technology Innovation Cultivation Project (No. 201810619078, 201810619096), RGU. Thanks to the sponsors.