
Abstract
A solar simulator suitable for universities’ lab was designed and developed using a quartz tungsten halogen lamp as its light source, an alternating current phase-cut dimmer, a light intensity meter, and an ATMega328p microcontroller with a computer and a liquid crystal display. Noting that the quartz tungsten halogen lamp suffers bulb overheating and long-term degradation that leads to the decrease in its light intensity, a control mechanism was applied. The control mechanism employed a proportional–integral–differential action with Some-Overshoot Ziegler–Nichols tuning rule. It was shown that the control mechanism works well in stabilizing the quartz tungsten halogen lamp irradiance between 273 and 1182 W/m2. The developed solar simulator was then tested to obtain I-V (current–voltage) characteristics of 3 W peak and 5 W peak commercial solar panels (GH Solar, GH5P-9). Based on the gained I-V characteristics, it was shown that the obtained characteristics of the commercial solar panels are in the range of the characteristics provided by the manufacturer’s data sheets. The developed quartz tungsten halogen lamp-based solar cell simulator can therefore be used to characterize solar cells.
Introduction
Solar simulators, which are important tools in solar energy research, fall into two major categories: non-concentrating uniformly distributed lights and high-flux concentrators. 1 A group of solar simulators with non-concentrating uniformly distributed lights are applied in the examination of solar cells and solar thermal collectors.2–5 Another group of solar simulators with high-flux concentrators are operated in producing high temperatures for research in materials processing, thermo-chemical reactions, solar fuels production, and simulated solar thermal power generation.6–10 Solar cells along with batteries and power managements were used to supply electrical power for various monitoring systems, such as natural disaster monitoring systems,11–15 structure health monitoring, 16 aquaculture monitoring, 17 and underground mining area monitoring, 18 which is placed in remote or inaccessible areas. Tests of solar cells along with their batteries and power managements using a non-concentrating uniformly distributed solar simulator are therefore very important to make sure the continuous power supply to the monitoring systems. Moreover, other applications of a non-concentrating uniformly distributed solar simulator can be found in various fields, such as disinfection on wastewater treatments, 19 phototherapy, 20 photo-degradation process, 21 photo-catalysis, 22 and Stirling engine investigation.23,24
There are plenty of solar simulators that have been developed for solar cells testing.25–29 Light sources utilized by the solar simulators are (a) carbon arc, high-pressure sodium vapor and argon arc lamp, (b) quartz tungsten halogen (QTH) lamp, (c) mercury xenon lamp, (d) xenon arc and flash lamp, (e) metal halide lamp, (f) light emitting diode (LED), (g) super continuum laser, and (h) multi-light source. In order to get full spectra of natural sunlight with low power consumption, QTH-based solar simulators were usually used at present.26,30,31 However, QTH lamps suffer bulb overheating and long-term degradation of the bulb and filter. 32 These disadvantages then cause QTH lamp intensity instable and even reduce their intensity over time. 33
To overcome the disadvantages, a control mechanism needs to be applied to the solar simulator system. Sarwar et al. 6 have implemented the control mechanism to their high flux solar simulator. However, they did not mention clearly the adjustment of the flux emitted on their solar simulator. Instead of controlling the light intensity, the control mechanism was used to control the temperature and the motion of Lambertian target that will be tested. A control mechanism was also implemented to control current that fed to the LED-based solar simulator developed by Bazzi et al. 34 They control every LED color using a controlled boost converter that provides a sufficient input voltage for each LEDs and a Hall-effect sensor to measure the current fed to the LED. A similar control was also applied by Stuckelberger et al. 28 to control their solar simulator. The difference is that they control their LED-based solar simulator using any cheap component to drive the LEDs and a series of analog-to-digital converter (ADC) and digital-to-analog converter (DAC) to control the current fed to the LED automatically from the computer. However, a manual control is still employed for the QTH-based solar simulator.4,26,31,35,36 Noting that the light intensity of QTH lamp has a tendency to decrease over the time and also instable, an automatic control is therefore important to be applied to QTH-based solar simulators to keep a certain and stable light intensity.
This paper reports developments of a solar simulator using a QTH lamp and its automatic control system to provide long-term illuminance stability. The plant of the control system was the QTH lamp and the light intensity was read by the calibrated sensor utilizing a light-dependent resistor (LDR). The control mechanism used a proportional–integral–differential (PID) action set by applying the Some-Overshoot (SO) Ziegler–Nichols (ZN) tuning rule, which is a better tuning rule. After all constants have been gained, the control mechanism was applied, and the stability of the control system was achieved for various set points. All aspects of the developments will be discussed thoroughly in this paper.
Simulator design and development
This section describes design and development of the controlled solar simulator, which consists of two main parts: system hardware and its software.
System hardware
The QTH lamp–based solar simulator, which consists of a plant, an AC phase-cut dimmer, a light intensity meter, and an ATMega328p microcontroller with a computer and a liquid crystal display (LCD), was developed as shown by the block diagram in Figure 1(a). The plant is a QTH lamp with controlled intensity. Since the QTH lamp needs AC power, its light intensity is controlled by the phase-cut dimmer and measured by the light meter. All processes of the simulator are controlled by the microcontroller, which has an Advanced Versatile RISC (AVR) central processing unit (CPU), an ADC, a timer interrupt, a 32-kB flash memory, and 2 bytes RAM. The measurement results are then displayed on the LCD and computer in real time. All parts of the simulator except the computer and LCD along with the solar panel under test were arranged and placed in the box with a dimension of 40 × 40 × 40 cm 3 as shown in Figure 1(b) that can be used for characterizing a small solar panel.
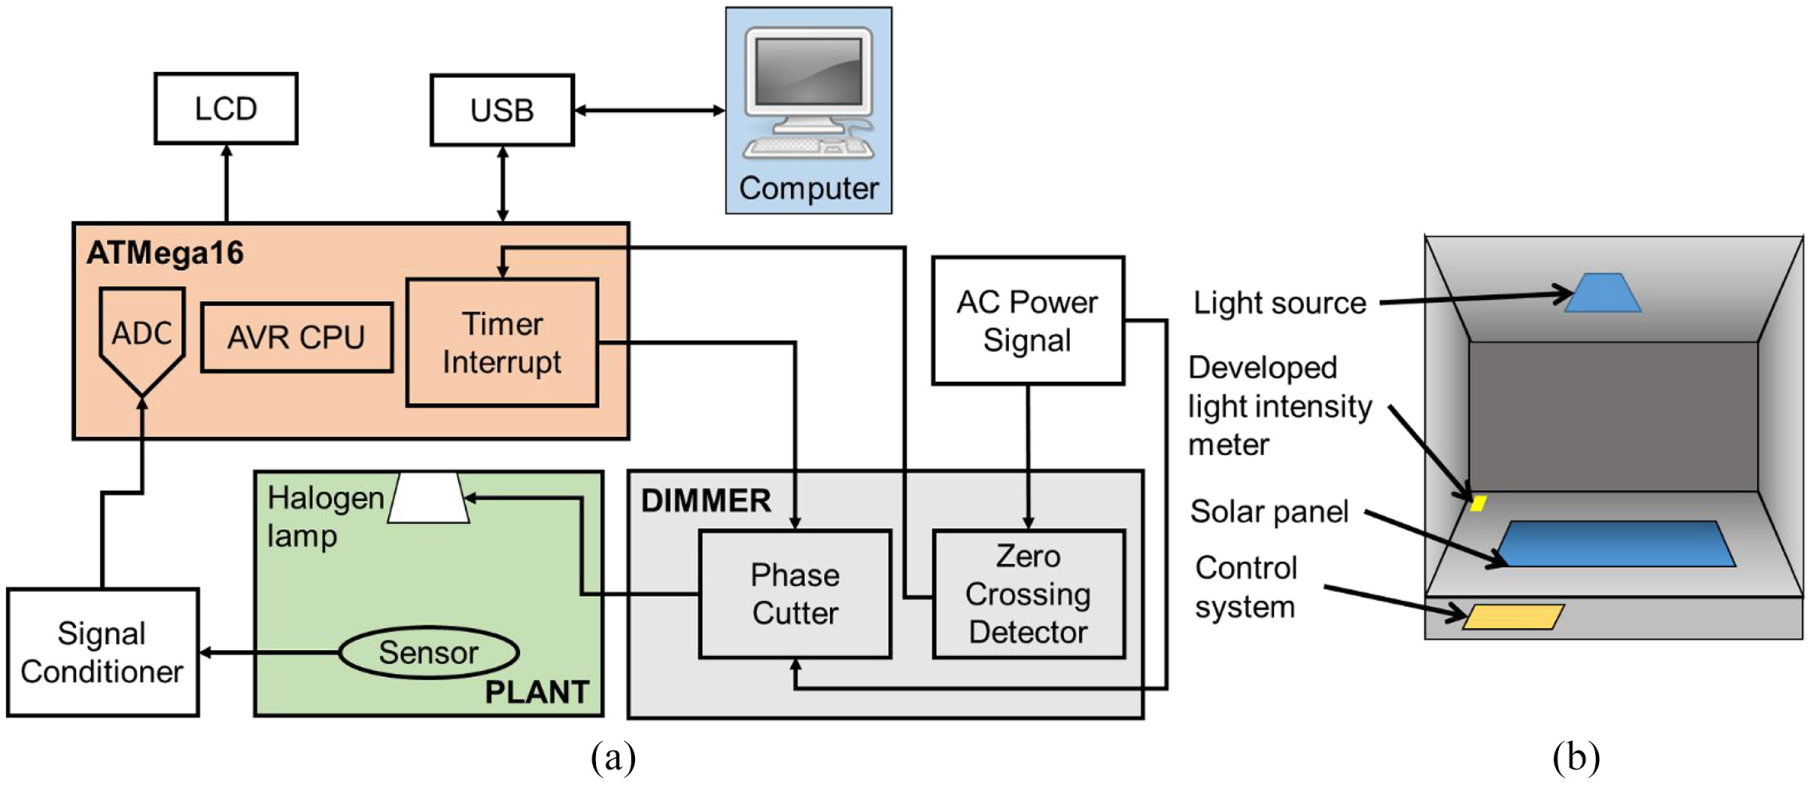
(a) Block diagram of developed solar simulator and (b) its layout in a box.
Figure 2 displays the AC phase-cut dimmer, which is a triac-based device that switches the dimmer to conduction mode when the triac receives the gating signal, which comprises two circuits used for zero-crossing detection and phase cut.37,38 To initiate the dimming process, the zero-crossing occurrence of AC power line input voltage is first detected using the zero-crossing detector, which is built by the MICW10N diode bridge and the 4N35 optocoupler. The phase cutter, which is assembled by the MOC3021 phototriac driver and the BT136 triac, immediately cuts the input voltage phase by giving a certain delay time. Therefore, the dimmer controls the output power by controlling the conduction time; a shorter conduction time, which is a longer delay time, will cause less power to be delivered to the output.37–41 The working principle of the phase-cut dimmer is as follows. The AC power line input voltage is fed to the diode bridge as a full-wave rectifier. When the rectified voltage is higher than 1.3 V, the optocoupler output is zero. Otherwise, the output is 5 V, which is as high as the voltage at the optocoupler collector. Therefore, the optocoupler output is a pulse train in which the pulse is sent to the microcontroller to make an interrupt as shown in Figure 1(a). The interrupt then activates a timer that delays the gating signal given to the gate of phototriac used to drive the triac. The AC power line output voltage across the terminals of triac, which is supplied to the QTH lamp as shown in Figure 1(a), is no longer sinusoid as its phase is cut and the QTH lamp dims so that its intensity decreases.
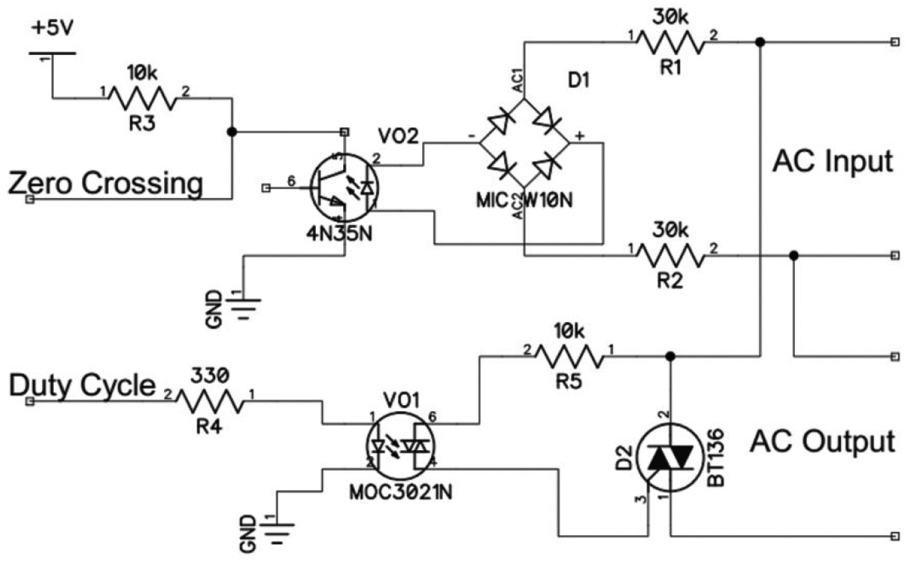
Phase-cut dimming circuit.
As presented in Figure 1, the light intensity is then sensed by the light intensity meter as shown in Figure 3. It consists of a Wheatstone bridge with the GL5516 LDR as the intensity sensor and a signal conditioning circuit based on a differential amplifier using the LM358 op-amp. The LDR has resistances of 4.52 MΩ at the dark condition and 296.3 Ω when the LDR is highly illuminated by the QTH lamp. The Wheatstone bridge’s potentiometer R1 functions to make the bridge output voltage (the voltage between points A and B) null when the light intensity meter measures a maximum intensity of the QTH lamp. Since the Wheatstone bridge’s output voltage is low, the LM358 op-amp-based differential amplifier is used to fulfill the measurement range of the microcontroller’s ADC. Noting that the differential amplifier output voltage is given as Vout = (R6/R5)(VA − VB), where (R6/R5) is its voltage gain, 42 the signal conditioning circuit gives a gain of 2.2. The resistance R8 and the capacitance C1 at the differential amplifier output form a low-pass filter to remove unwanted high-frequency signals. Hence, the light intensity meter reads the QTH lamp intensity and converts it into an analog voltage fed to the microcontroller’s ADC as shown in Figure 1(a).
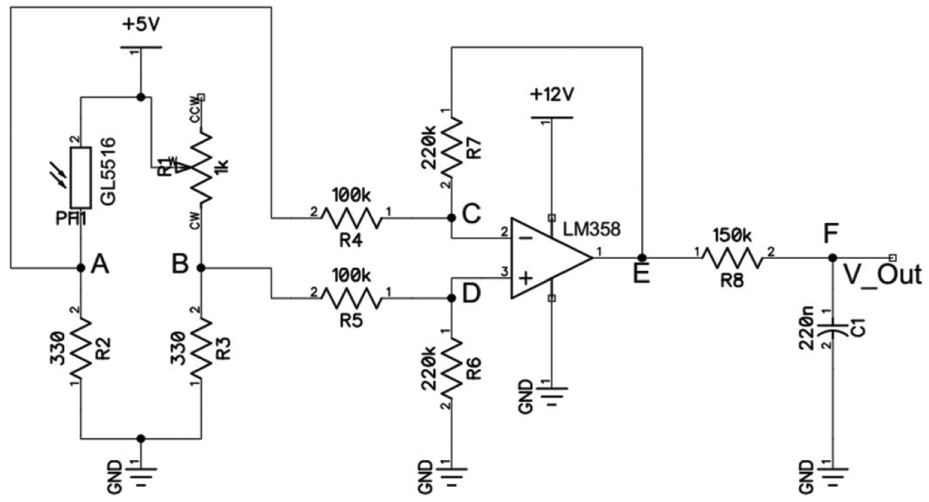
Light intensity meter circuit.
System software
In order to make the intensity of the solar simulator continually constant, a closed-loop control mechanism is then applied to the system. Although an open-loop control system is easy to build and very stable, a closed-loop control system is insensitive toward external instabilities.43,44 The closed-loop control system shown in Figure 4 corresponds to the constant-intensity solar simulator given in Figure 1(a). The plant is a QTH lamp in the box. Since the plant requires variable AC power, the AC phase-cut dimmer is employed as an actuator to supply the variable AC power under a control action carried out by the controller. The light intensity meter along with ADC and translator that employed as the feedback element of the closed-loop control system convert the analog input to the light intensity. To carry out the control action, the controller receives an input, which is the error e(t) or a difference between the desired light intensity Iref and the real light intensity I(t) measured by the feedback element. The controller and the translator are an algorithm embedded in the microcontroller, while the desired light intensity is an input to the program. The PID control action operated by the controller to make a constant-intensity solar simulator has the control signal u(t) as given in Equation (1) 44
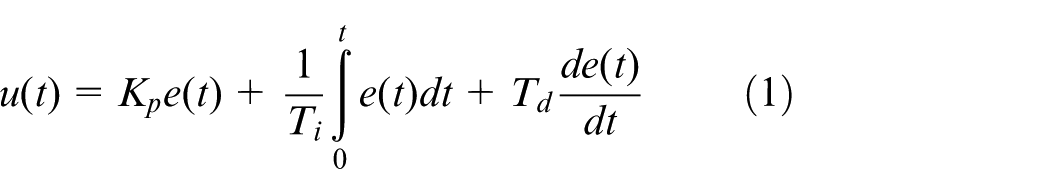
where e(t) = Iref − I(t), Kp is the proportional constant, and Ti and Td are known as the integral and derivative action times, respectively. This control signal adjusts the delay time given to the AC phase-cut dimmer so that the light intensity can be controlled.
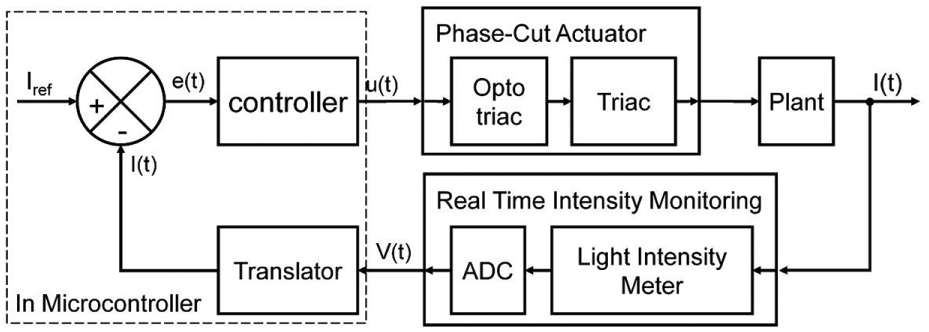
The closed-loop control representation of the constant-intensity solar simulator.
A program for controlling the constant-intensity solar simulator was built from the flowchart presented in Figure 5. In the beginning, the program requests the computer to initialize the hardware including the microcontroller and the communication protocols. The error e(t), the voltage V(t), and the light intensity I(t) are also initialized. The program then asks for the desired light intensity Iref and then initialized the PID parameters Kp, Ti, and Td regarding the desired light intensity. Next, the program reads the actual light intensity I(t) obtained by the plant/process output and calculates the error e(t) and the control signal u(t). The control signal u(t) successively alters the delay time given to the phase-cut dimmer/actuator to vary the AC voltage V(t) supplied to the plant. Finally, the plant gives an output I(t). If the actual light intensity meets the desired light intensity, then the control action stops. Otherwise, the control action is repeated.
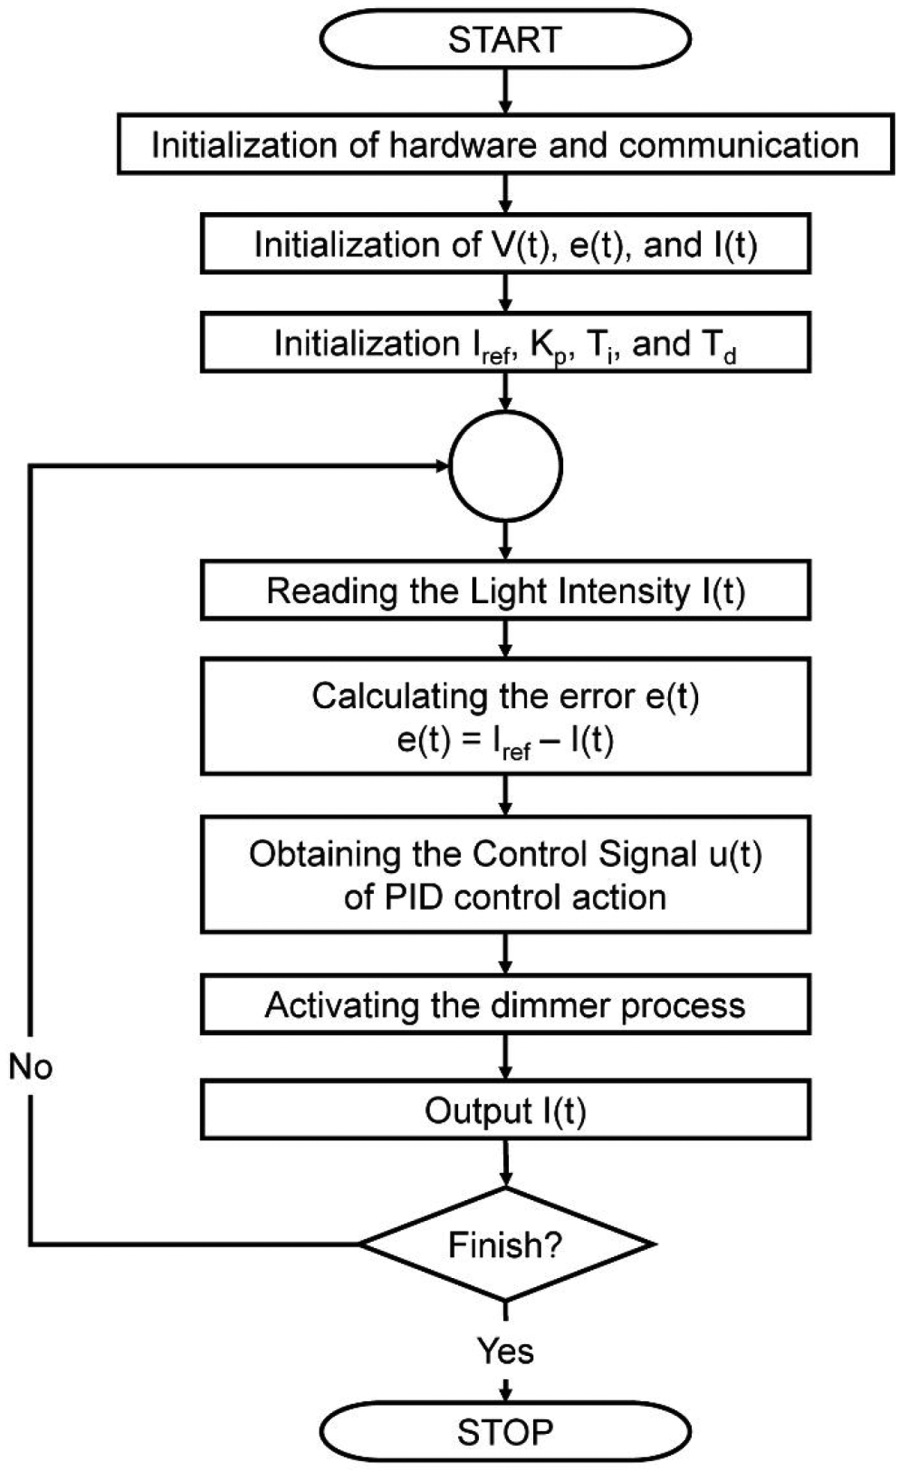
Flowchart used to control solar simulator using PID control action.
Testing results and discussion
The developed light intensity meter
Since the developed light intensity meter output is analog voltage, the commercial luxmeter (Lutron, LX-101A) with light intensity output was used as a benchmark. Noting that the output of the luxmeter is in lux, the value is then converted to the W/m2 by discretizing the spectral radiant distribution curve of the lamp and implementing the mathematical manipulation as presented by Grandi et al. 26 The relationship between the light intensities measured by the commercial luxmeter and those done by the developed light intensity meter at any position of the bottom of the box is depicted in Figure 6. The higher the light intensity S given in the box, the higher the analog output voltage V of the developed light intensity meter as represented by the fitting curve V = 0.896 × ln(G + 14.135) + 2.351 V and shown in Figure 6(a). This finding is due to the fact that the resistance R of LDR decays with the intensity S as given by the fitting curve R = 26.643×G−0.876 Ω and demonstrated in Figure 6(b).
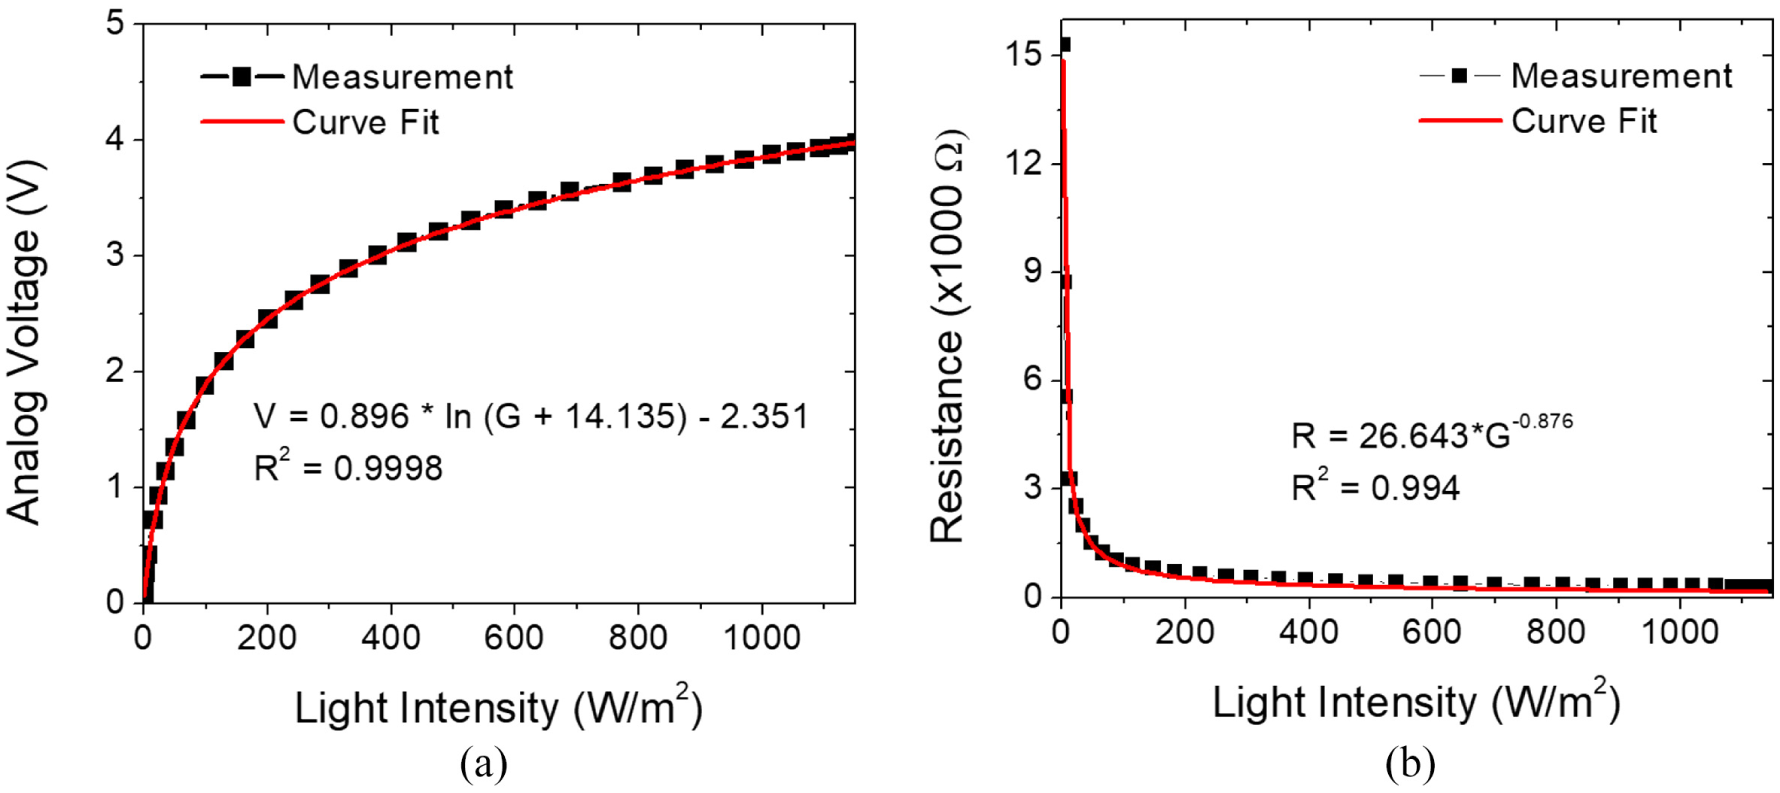
Relationships between light intensities and (a) the output voltages given by the developed light intensity meter and (b) the resistances of the LDR.
The developed AC phase-cut dimmer
As described in the previous section, the AC phase-cut dimmer is used to control the light intensity. In order to test the AC phase-cut dimmer, the AC power source with the root-mean square (RMS) voltage of 18 V and 50 Hz was used. The AC and the zero-crossing detector waveforms are demonstrated in Figure 7. It was found that the output waveform of the zero-crossing detector is a pulse train with the height of 5 V and the frequency of 100 Hz (twice the AC power source frequency). However, the pulse shape was not a square wave due to the 4N35 optocoupler response time.
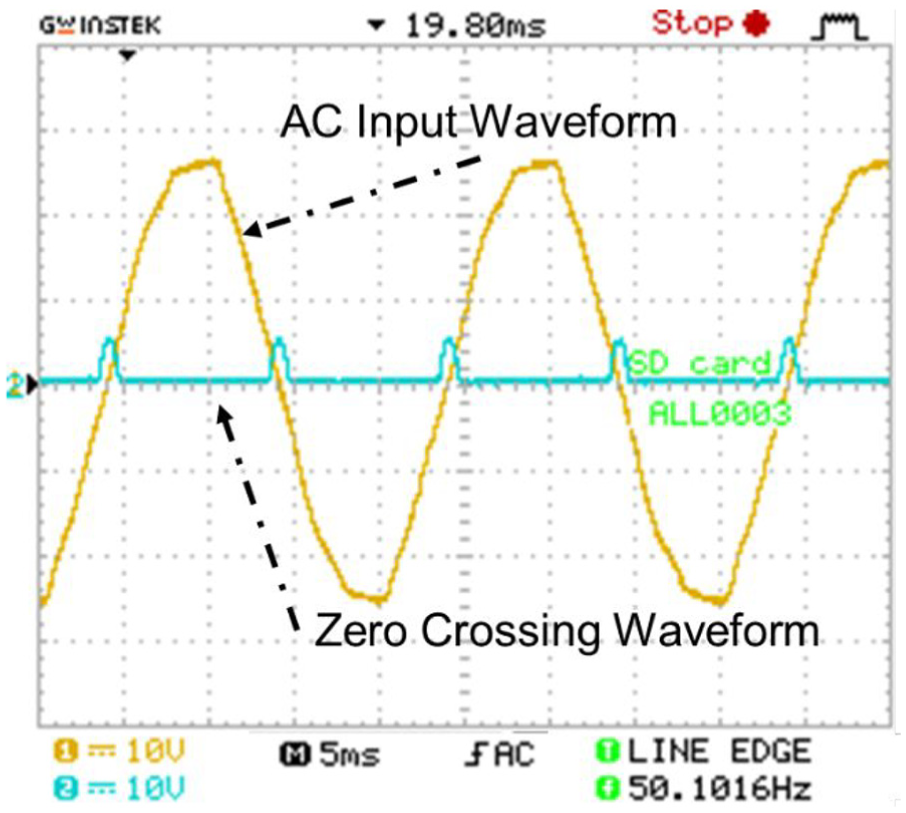
AC and zero-crossing detector waveforms.
Figure 8 shows various delay times of the gating signal given to the phase cutter in Figure 2 and their output waveforms. As given in Figure 8(a), there is no phase cut occurs for the delay time Toff of 0 ms (the gating signal is continuously high at 5 V or the duty cycle D of the gating signal of 100%), and the AC power is fully fed to the QTH lamp to obtain a maximum intensity. By increasing the delay time, which implies that the duty cycle of the gating signal reduces, the phase cut increases and the AC power that is supplied to the QTH lamp becomes lesser and its intensity therefore lowers as depicted in Figure 8(b) and (c). At the delay time Toff of 10 ms, which is the same as the period of the pulse train (the gating signal is continuously low at 0 V or the duty cycle D of the gating signal of 0%), there is no AC power provided as shown in Figure 8(d); the QTH lamp therefore delivers no intensity. These findings agree well with the theory. 45 Note that the filament of QTH lamp is a partially inductive load to the AC power. It therefore stores the electrical energy derived from the change in current. 46 The higher the current flows, the greater the electrical energy is stored in it. As a result, it has been observed that the delay time up to 1.75 ms (or the duty cycle higher than 82.5%) will not cut the phase of the AC power so that the maximum AC power is fed to the QTH lamp. In addition, the delay time down to 8.25 ms (or the duty cycle less than 17.5%) will cut the phase of the AC power so that no AC power is provided to the QTH lamp.
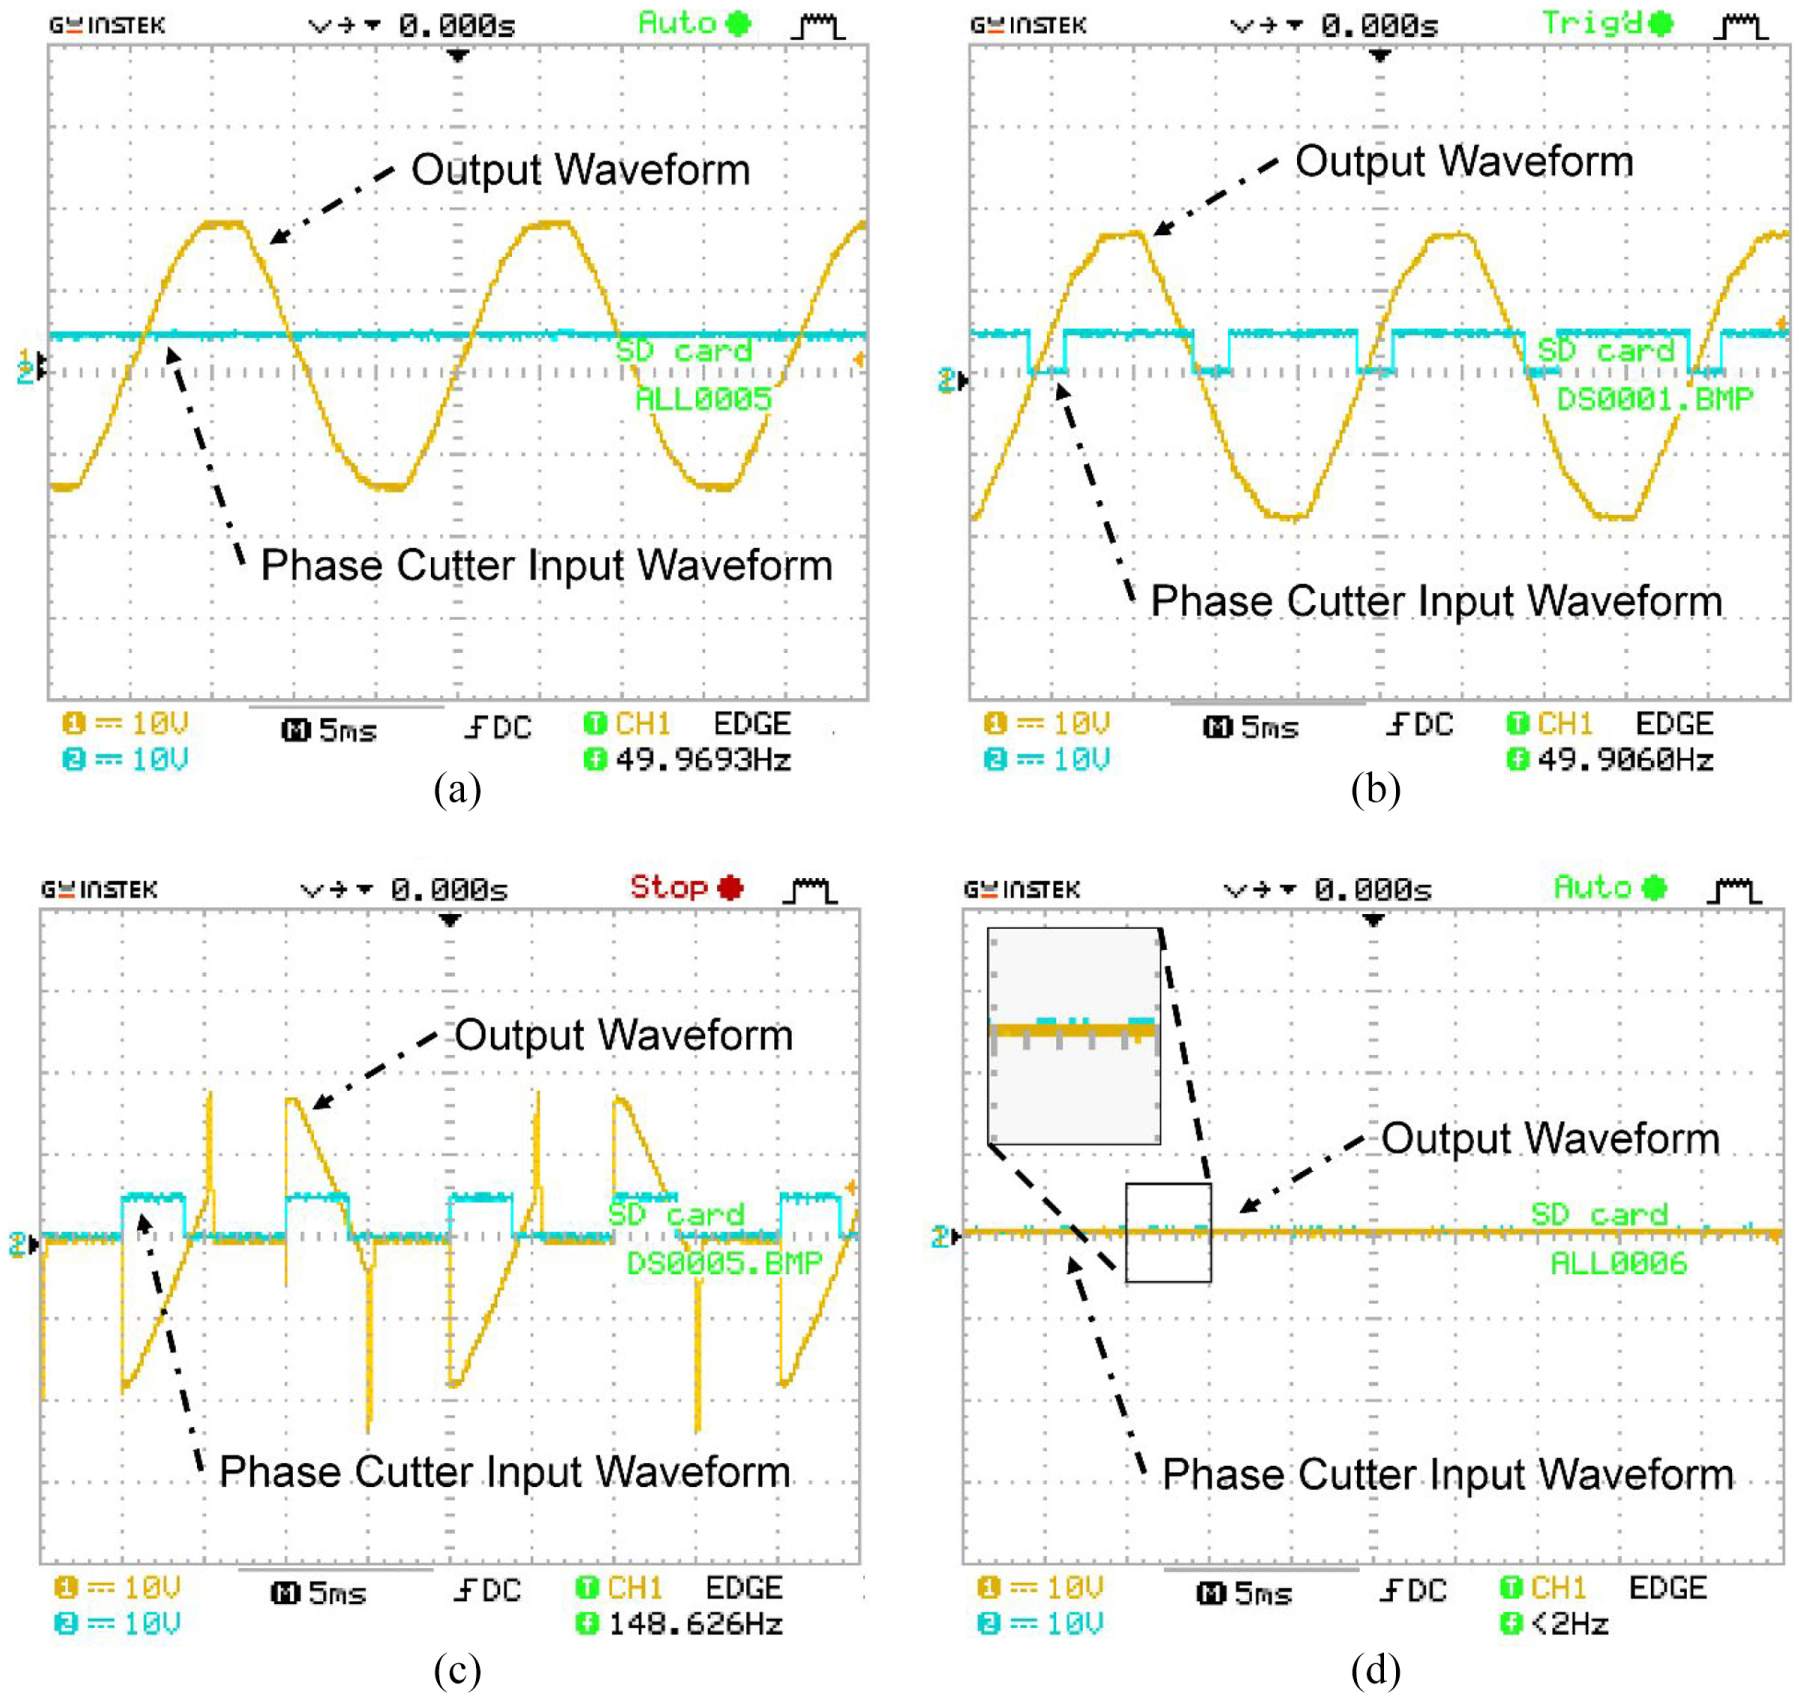
Gating signals of the phase cutter for various delay times: (a) Toff of 0 ms (D of 100%), (b) Toff of 2 ms (D of 80%),(c) Toff of 6 ms (D of 40%), and (d) Toff of 10 ms (D of 0%) and its output waveforms.
The light irradiance as a function of the delay time is depicted in Figure 9. The theoretically calculated light irradiance, which is given by the red line, was obtained by applying Equation (A.11) of the Supplemental Appendix. However, the black square symbol represents the light irradiance that was experimentally measured by using the luxmeter (Lutron, LX-101A). It is clearly seen that the theoretically calculated light irradiance does not fit the experimentally measured one. This is because the theoretical formulation of light intensity in Equation (A.11) of the Supplemental Appendix does not take into account the QTH lamp as a partially inductive filament and the commutating dV/dt characteristic of the assembly of the MOC3021 phototriac driver and the BT136 triac. The effect of the delay time on the light intensity of the partially inductive QTH lamp is given when discussing Figure 8. The delay time of 2 ms that will not cut the phase of the AC power must be used as a correction when fitting the theoretically calculated light intensity to the experimentally measured one. Therefore, the corrected theoretical delay time Toff, corr is given by Toff, corr = A × Toff − B, where Toff is the uncorrected delay time given in Equation (A.11) of the Supplemental Appendix, B is the constant of 2 ms due to the delay time that will not cut the phase of the AC power, and A is the constant to change the slope of the curve in Figure 9 due to the commutating dV/dt characteristic which is shown by the blue line.
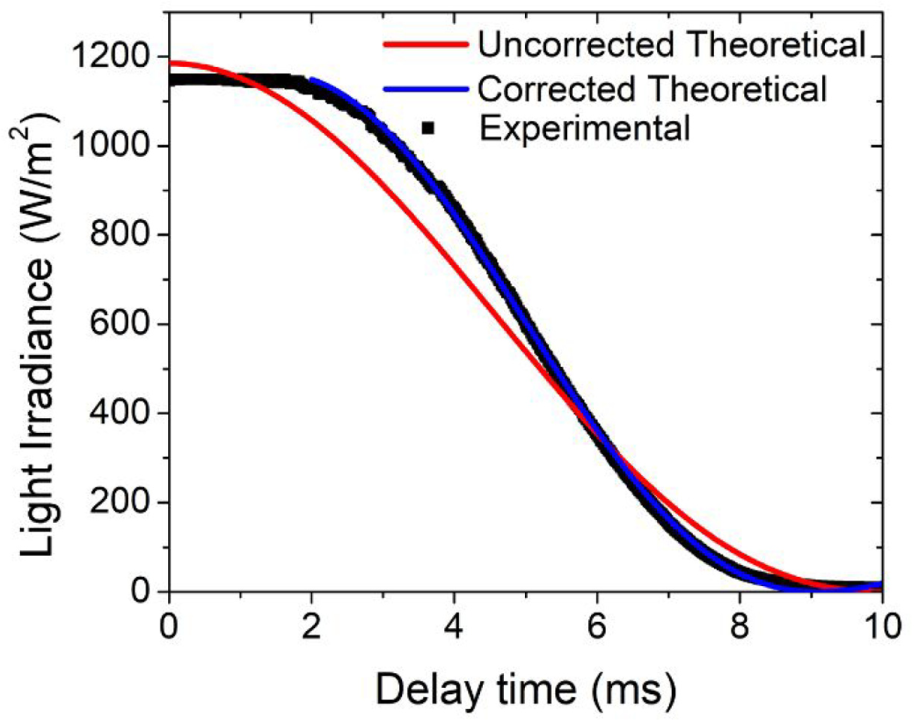
Comparison of the light irradiances, which were theoretically calculated and experimentally measured, as a function of the delay time.
The developed control system
The tuning rules of PID controller usually used are the classic ZN tuning rule and its modifications. Generally, these tuning rules get the control parameters (Kp, Ti, and Td) based on experimental results. The common method in performing the ZN tuning is the marginal stability of Kp response that requires the knowledge of ultimate/critical gain, Ku, and also the ultimate period, Tu.44,47 Since the step response may have an unacceptable huge maximum overshoot, 44 modifications of the ZN tuning rule have widely been proposed including the SO- and No-Overshoot (NO)-ZN rules. The SO-ZN is a simple ZN tuning rule modification that reduces the overshoot, 47 and it is the better tuning type due to its quick response and minimum overshoot. 48
Figure 10 illustrates transient responses under the applications of the ZN tuning rule and its modifications. It is shown that the SO-ZN tuning rule gave better responses for all tested set points. The differences are clearly shown for the set point irradiance (Gsp) of 636 W/m2. The SO-ZN rule gave the lower overshoot compared to that of the ZN, while the set point was achieved faster than those of the other tuning rules. Moreover, although the Gsp of 273 W/m2 was reached as fast as the ZN tuning rule, the transient response obtained by the SO-ZN tuning rule was smoother than that of the ZN as like as that resulted from the NO-ZN rule. Therefore, the PID control mechanism used in the developed system was tuned by using the SO-ZN tuning rule. To implement the control mechanism, the control parameters were obtained first. The PID control parameters under the SO-ZN tuning rule were Kp = 0.33 Ku, Ti = 0.5 Tu, and Td = 0.33 Tu.44,47 The obtained control parameters are then presented in Table 1. By performing the control system on the solar simulator, the temporal stability of the solar simulator can absolutely be determined as an A class anytime is needed.
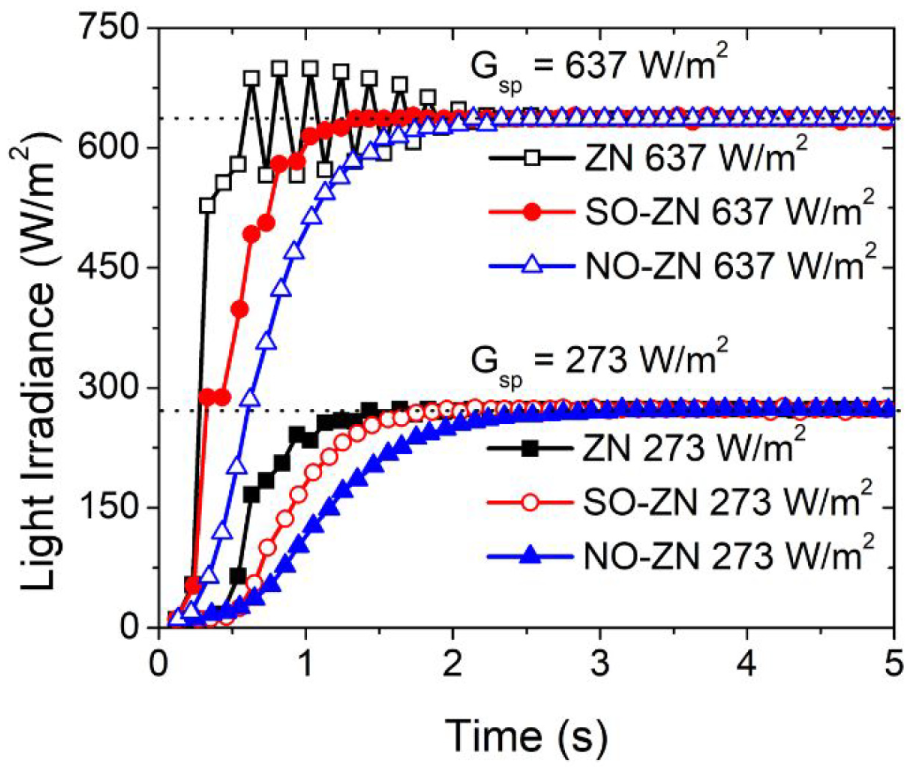
Transient responses of the system after employing the Ziegler–Nichols (ZN) tuning rule and its modifications for the set point irradiances (Gsps) of 273 and 636 W/m2.
Constants for the PID control.
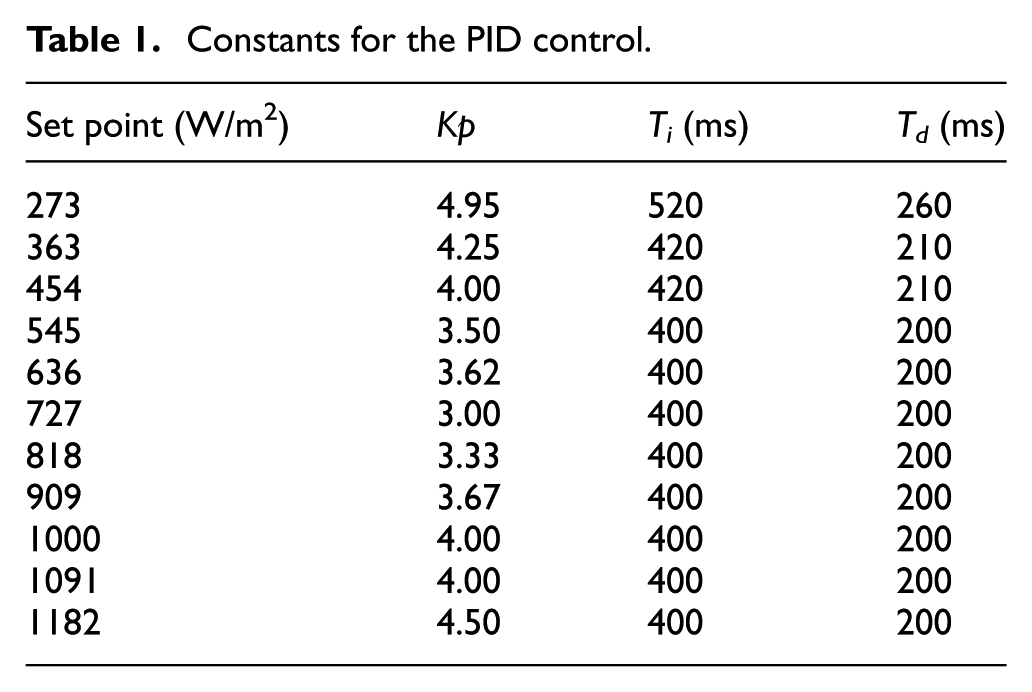
Figure 11 shows the time stability of lamp irradiance of 637 W/m2 with and without implementing control mechanism which are represented by blue and red lines, respectively. It is seen that without implementing the control mechanism, the lamp irradiance was unstable. The lamp irradiance tended to decrease down to 6.22% after running for 1 h. It is also shown that the decrement of the intensity occurred when the system was running for the first 15 min. This condition is detrimental to the testing process that requires a solar simulator with constant light irradiance. On the other side, the employment of control mechanism made the lamp irradiance constant during the simulation process. This stability also applied for the lamp intensity of 1000 W/m2.
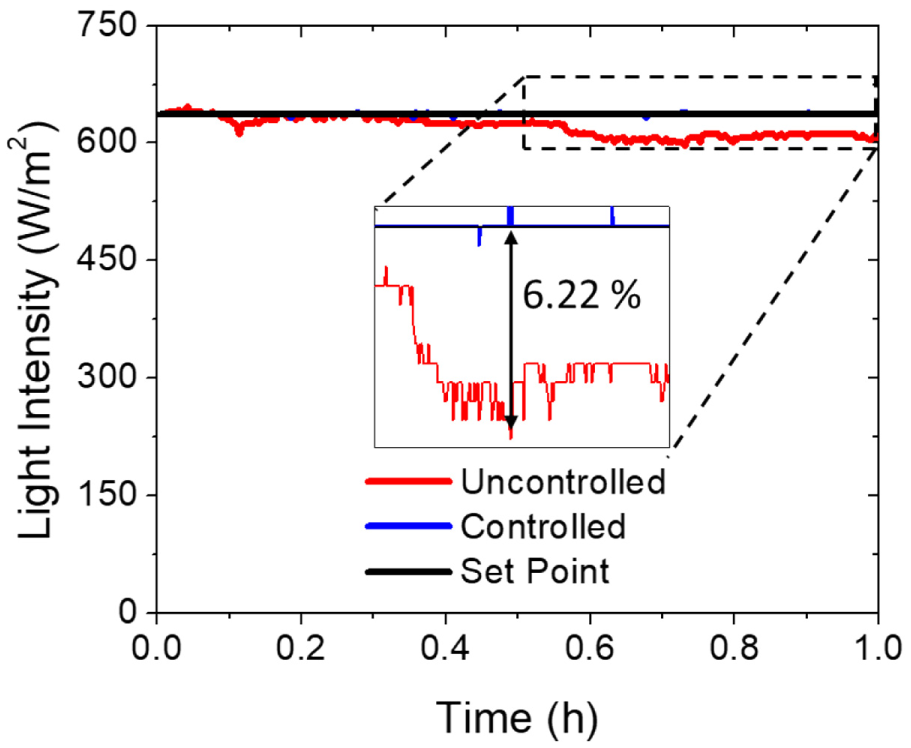
Transient responses of the system with and without control mechanism.
Testing the developed solar simulator
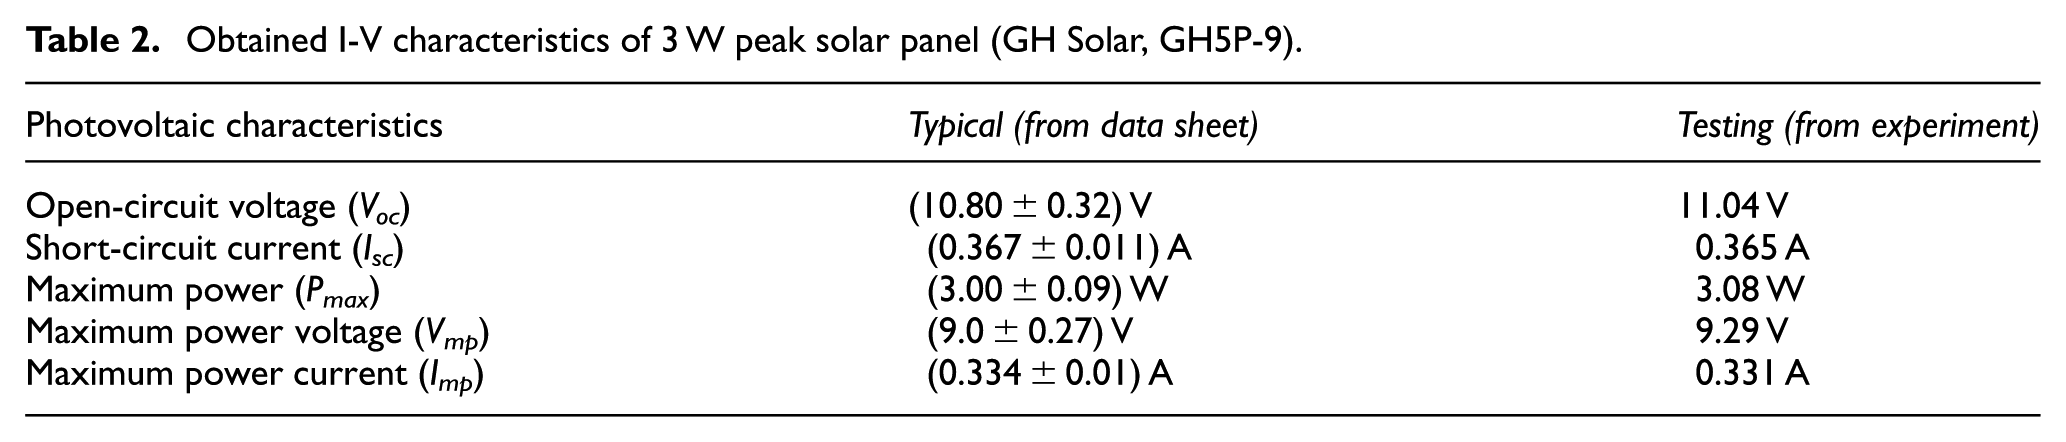
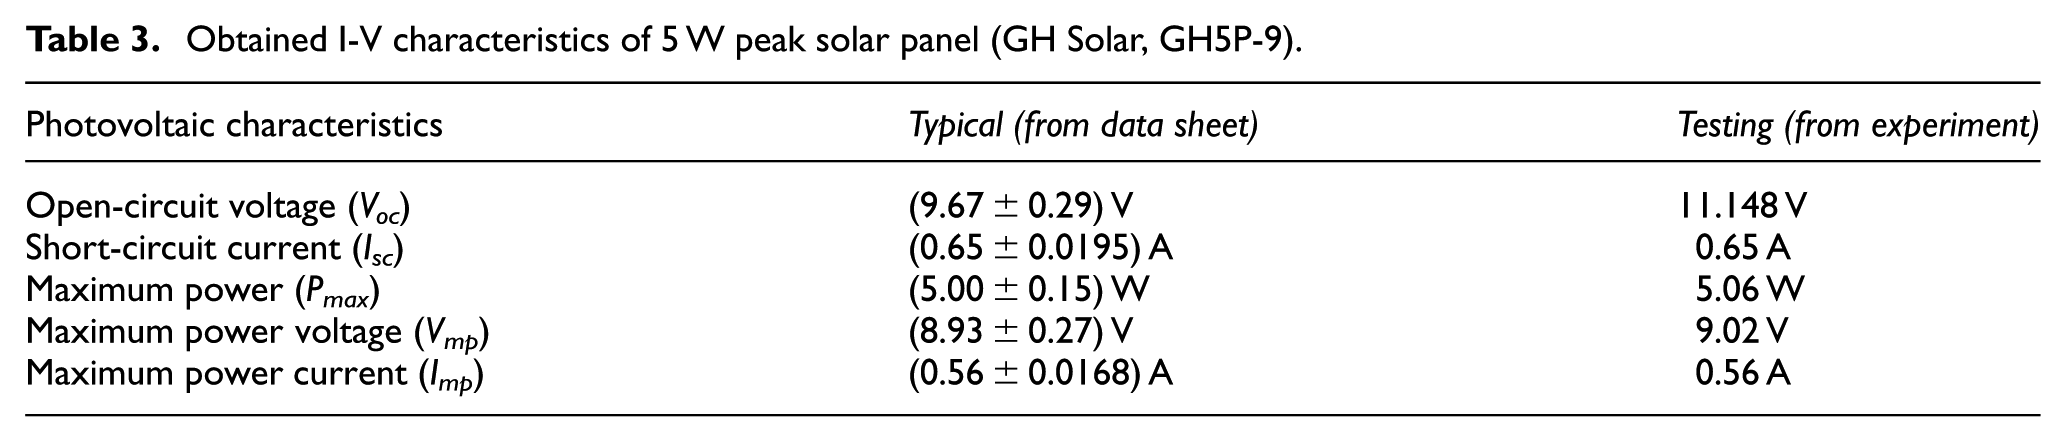
After having been developed, the solar simulator was then tested to obtain I-V characteristics of a 3 W peak (GH Solar, GH5P-9), and a 5 W peak (WP) commercial solar panel (GH Solar, GH5P-9). The photovoltaic characteristics extracted from the obtained I-V characteristics were then compared to those provided by the manufacturer’s data sheet. The measured I-V characteristics of the commercial solar panel at standard test condition are shown in Figure 12. By inspecting Figure 12, the parameters of the solar panel can be extracted such as the short-circuit current (Isc), open-circuit voltage (Voc), the maximum power (Pm), power maximum current (Imp), and power maximum voltage (Vmp). The extraction of the measured I-V characteristics and the typical factory characteristics of the solar panel are then summarized in Tables 2 and 3. As can be seen from the extracted data, the obtained characteristics using the developed solar simulator are similar to the factory characteristics. Although there are some differences between them, the differences are insignificant. It can be concluded that the light irradiance emitted by the solar simulator is comparable to the standard one.
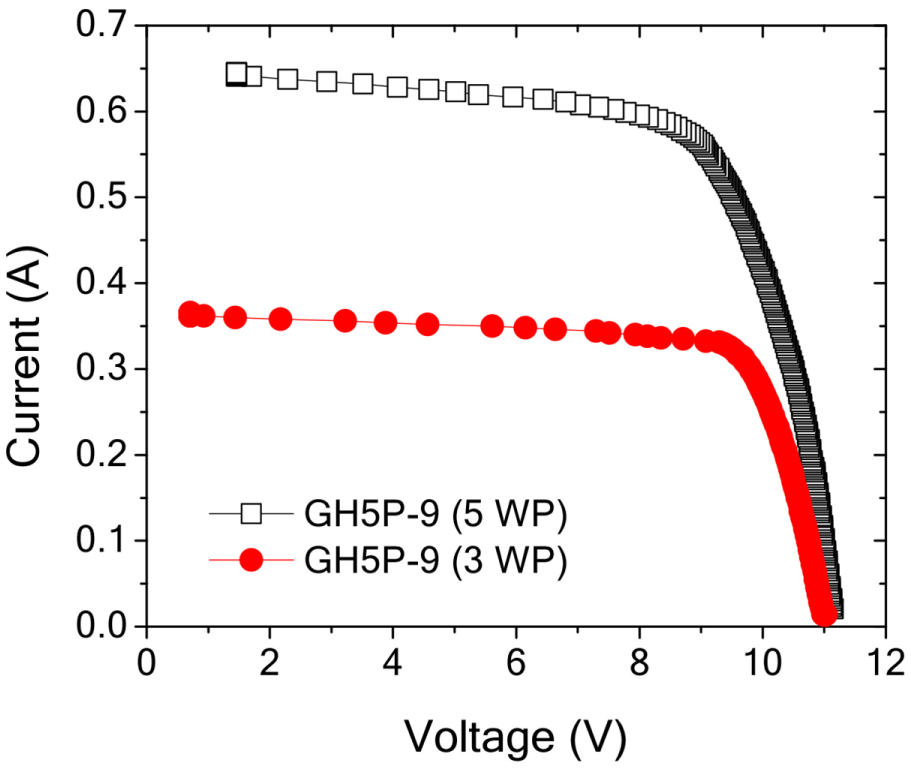
The measured I-V characteristics of the commercial solar panel.
Obtained I-V characteristics of 3 W peak solar panel (GH Solar, GH5P-9).
Obtained I-V characteristics of 5 W peak solar panel (GH Solar, GH5P-9).
Conclusion
A QTH lamp–based solar simulator has been successfully developed. A control mechanism was implemented in the solar simulator to overcome the decrease in the QTH lamp light intensity due to the bulb overheating and long-term degradation. The control mechanism functioned well in stabilizing the lamp irradiance between 273 and 1182 W/m2 under a PID action with SO ZN tuning rule. The developed solar simulator was then employed to obtain I-V (current–voltage) characteristics of two (3-WP and 5-WP) commercial solar panels. It was obtained that the photovoltaic characteristics of the commercial solar panels extracted from the I-V characteristics were closely similar to those provided by the manufacturer’s data sheets.
Supplemental Material
A_20Constant-Intensity_20Solar_20Simulator_Manuscript_line_7-18_edit_2607_all-final_appendix – Supplemental material for A simple solar simulator with highly stable controlled irradiance for solar panel characterization
Supplemental material, A_20Constant-Intensity_20Solar_20Simulator_Manuscript_line_7-18_edit_2607_all-final_appendix for A simple solar simulator with highly stable controlled irradiance for solar panel characterization by Rahmat Awaludin Salam, Muhammad Miftahul Munir, Thariq Warsahemas, Casmika Saputra, Hamzah Latief and Khairurrijal Khairurrijal in Measurement and Control
Footnotes
Acknowledgements
R.A.S. gratefully acknowledged the Ministry of Research, Technology and Higher Education of the Republic of Indonesia for the Dissertation Research Grant in the fiscal year 2017.
Declaration of conflicting interests
The author(s) declared no potential conflicts of interest with respect to the research, authorship, and/or publication of this article.
Funding
This work was financially supported by “Riset Unggulan ITB—PP” grant in the fiscal year 2018, the University’s Excellence Research (PUPT) grant in the fiscal year 2016, and the Dissertation Research Grant by Ministry of Research, Technology and Higher Education of the Republic of Indonesia in the fiscal year 2017.
Supplemental material
Supplemental material for this article is available online.
References
Supplementary Material
Please find the following supplemental material available below.
For Open Access articles published under a Creative Commons License, all supplemental material carries the same license as the article it is associated with.
For non-Open Access articles published, all supplemental material carries a non-exclusive license, and permission requests for re-use of supplemental material or any part of supplemental material shall be sent directly to the copyright owner as specified in the copyright notice associated with the article.