
Abstract
Background:
In this work, an accurate low-cost power microwatt-meter is designed, built, and tested. This microwatt-meter is found to be capable of measuring power consumption in a wide range of devices and sensors, such as nodes in wireless sensor networks, microcontrollers in Internet of Things devices, and Field Programmable Gate Arrays.
Methods:
The paper examines the usage of the microwatt-meter for the measurement of power consumption in digital devices as they execute program instructions, ranging from a low-level single step (instruction) in an assembly program to a high-level sophisticated program or system.
Results:
The results obtained showed that the microwatt-meter is highly accurate. It can measure the energy consumed by any of the devices/programs/instructions in a digital system with accuracy levels ranging between 0.5% and 2.5% (depending on the application).
Conclusion:
The accuracy of the microwatt-meter is validated using the fundamental conservation of energy law and a comparison with multimeter current measurements is presented.
Introduction
As the Internet of Things (IoT) 1 continues to grow exponentially, the need for improved designs of digital circuits increases.2,3 Battery-operated designs that consume minimal amount of energy become more important. Such designs include microcontroller units (MCUs), sensory units, Field Programmable Gate Arrays (FPGAs), and so on. Due to limitations of the energy stored in batteries, designers are usually interested in measuring the efficiency of power consumption in various designs and its effects on the operation of the systems. For example, wireless sensor nodes usually have scarce resources especially in terms of energy, and they are expected to operate autonomously in unattended areas for long periods of time. 4 The depletion of energy on one node may compromise the whole network operation and may degrade the quality of the monitoring process. 4 Therefore, energy consumption has long been one of the crucial characteristics of wireless sensors to predict the network lifetime and to evaluate the efficiency of different WSN protocols and layouts. For example, the researchers in Reverter 5 compared the power consumption of resistive and capacitive sensors.
In this work, a new design for a powerful and practical instrument is presented. A microwatt-meter is tailored to measure power consumption in battery-operated programmable devices with an accuracy of 0.5%–2.5% (depending on the application) within few seconds, without requiring significant preparation for the device under investigation. The built instrument is flexible and has a wide range of applications:
It is suitable for usage with any system. All that needs to be done is to power the system under consideration through the circuit. It does not require intervention or embedding the MCU/CPU/FPGA device in a special equipment/board for measurements as in Lee and colleagues,6,7 for example.
It can be used to evaluate hardware and software for both macro and micro optimizations. This is achieved by evaluating the effect of changes from a single program instruction to a major system component or the whole system.
The designed microwatt-meter relies on measuring the voltage change across a capacitor (as will be discussed in section “Circuit design”). It is more accurate than other instruments that rely on current measurements.6,8
It is cost efficient compared to other designs.6,9,10 The built system costs about US$100.
The rest of the paper is organized as follows: The motivation and related work is discussed in section “Related work.” In section “Circuit design,” the circuit design is described in full detail. The power microwatt-meter validation process is presented in section “Power microwatt-meter validation.” Section “Experimental tests” presents the results of the experimental tests. Section “Sources of error” discusses the sources of measurement errors in this design. Finally, section “Conclusion and future work” describes future work and concludes.
Related work
In this section, the methods used to evaluate power consumption in electronic circuits are reviewed. They can be categorized into two main methods: measurement-based or calculation/simulation-based methods.11–13
Measurement-based methods
In general, power can be measured using one of these two methods.
Using oscilloscopes and multimeters
One approach to measure power consumption is to monitor the current flow from a power source into the system in real time. This can be done using a high-speed multimeter or an oscilloscope, by letting the current pass through a known resistor and measuring the voltage drop across its terminals.
Chang et al. 10 used an oscilloscope, to stream digitized voltages into a PC to calculate the profile of energy consumption. The work presented in Landsiedel et al. 14 predicts the energy consumption of a whole sensor network based on the electric current measurement of a single sensor node. The authors in earlier works9,8,15,16 measured current using a multimeter to find the consumed power of a CPU. In Kulkarni and Udupi, 17 a method for energy estimation at the instruction level for ARM Cortex M4 processor was presented. The method relies on measuring the drawn current of a java script executed in a loop. Most of the previous work in this area, such as Jevtic and Carreras,18,19 tried to validate their work by comparing their results with other multimeter/oscilloscope-based methods, or tried to validate their work by checking the repeatability of the measurement, when they should have opted for more fundamental techniques to validate their work.
Measurements using a multimeter/oscilloscope are prone to error6,8,20 because the sampling rate of these devices is significantly lower than the clock speed of the MCU/CPU. Sampling a GHz CPU instruction current in a period of few milli-seconds can hardly be described as accurate.21,22 The readings of these devices are assumed to be averaged, but in reality they ignore any sudden spike in drawn current during the execution. Another problem with this approach is the millions of collected data points that need to be logged to be processed later. 10 This will complicate the system design and increase its cost as it will require extensive data storage components. Although high-speed oscilloscopes are available commercially, they cost tens of thousands of dollars and depend on a computer to analyze the logged data.
Using capacitors
To measure a household water consumption at the end of the day, it is easier and more accurate to observe the difference in the water level in the main tank, rather than meticulously measuring every single drop of water in real time. This analogy explains the biggest advantage of using capacitors over using multimeters/oscilloscopes.
Contrary to current/voltage monitoring techniques, this method does not require continuous high-speed sampling components. This is because all that need to be done is to record the voltage at the start and at the end of the measurement. The energy consumed can be calculated by measuring the capacitors voltage drop as will be explained in section “Circuit design.”
The authors in previous works6,23 developed a system that uses fast switching capacitors to measure the energy consumption of a CPU (an ARM7 CPU was used as a test case). In their test, the CPU under study is soldered to the printed circuit board (PCB) and coupled tightly with an on-board FPGA. This makes repeating the measurement for different CPU or MCU lengthy, costly, and inconvenient.
Calculation/simulation-based methods
These methods rely on models that describe the power consumption of CPUs/MCUs,17,24–27 sensors, and transceivers.28,29 For example, PowerTossim 30 provides a per node estimate of power consumption through estimating the number of CPU cycles executed by each node. Wang 24 developed an instruction-level model to estimate the energy consumed by a program. They grouped instructions into categories and calculated the percentage of the instructions in each category.
In practice, CPUs/MCUs are always attached to other components to perform their tasks. Including all possible components in these models is not feasible because of the infinite possibilities. In addition, old models cannot describe newly released hardware. Therefore, power estimation models will always lag state-of-the-art hardware. Models also assume that different CPU/MCU implementations/packages consume the same amount of power regardless of the manufacturer. As will be shown later, the power consumption of the same MCU architecture can differ significantly from one manufacturer to another, or from one implementation to another.
Contribution
In comparison with the previous work, the contribution of the paper is threefold and is summarized as follows:
The paper provides a design for a low cost, accurate, and versatilely applicable power micrometer. The designed microwatt-meter targets battery-powered devices, and it is based on voltage measurements across capacitors, which achieves higher accuracy when compared to typical current-based measurements. Current-based measurements6,8,9,16,20 rely on high-end multimeters that are capable of logging readings at a high sampling rate (higher rates give more accuracy). Even the fastest multimeter sampling rates are significantly slower than the commonly available CPUs/MCUs and their readings are considered to be averages that may ignore sudden current surges/drops.21,22 This kind of equipment is usually costly and requires data storage to save the logged readings. 10 The approach used in the microwatt-meter requires neither high sampling rates nor data storage; thus, it is more convenient and much cheaper. There is some similar previous work that used capacitors to measure power consumption,6,23 but the used approach was not convenient and required a lot of preparation for the device or component to be evaluated. On the contrary, the microwatt-meter can be used directly with the device to be evaluated. All that needs to be done is use the microwatt-meter as a power source for the device or component through any convenient plug or connection. Unlike previous work, there is no need to solder the device under test to a special PCB. 17 We believe the microwatt-meter is unique, and to the best of our knowledge, it is the first to provide such convenience and flexibility at such a low cost.
The microwatt-meter is implemented, and its accuracy is verified and compared to theoretical results. The microwatt-meter showed high accuracy, which validates the implementation.
The versatility of the microwatt-meter is practically demonstrated through a series of evaluation experiments targeting different abstraction levels from single instructions to system-level components.
Circuit design
The microwatt-meter is a controlled and monitored capacitor charge–discharge circuit. A schematic illustrating the functionality of the circuit is shown in Figure 1. As shown in this figure, a large capacitor is charged in a controlled manner using the switch formed by the n-MOSFETs Q1 + Q2. The device under test consumes the power it needs from capacitor C1. The discharge process is controlled using the switch formed by the n-MOSFETs Q3 + Q4. The charge/discharge processes are controlled using an MCU and a control logic that ensures proper operations as will be shown later. If the device under test requires a constant voltage, or an input voltage with a very narrow variation, then the charge stored in C1 is transferred to a smaller capacitor that is charged using the switch formed by the n-MOSFETs Q5 + Q6, and a feedback circuit that monitors C2 voltage. Q5 + Q6 will open when C2 voltage drops below a specific voltage
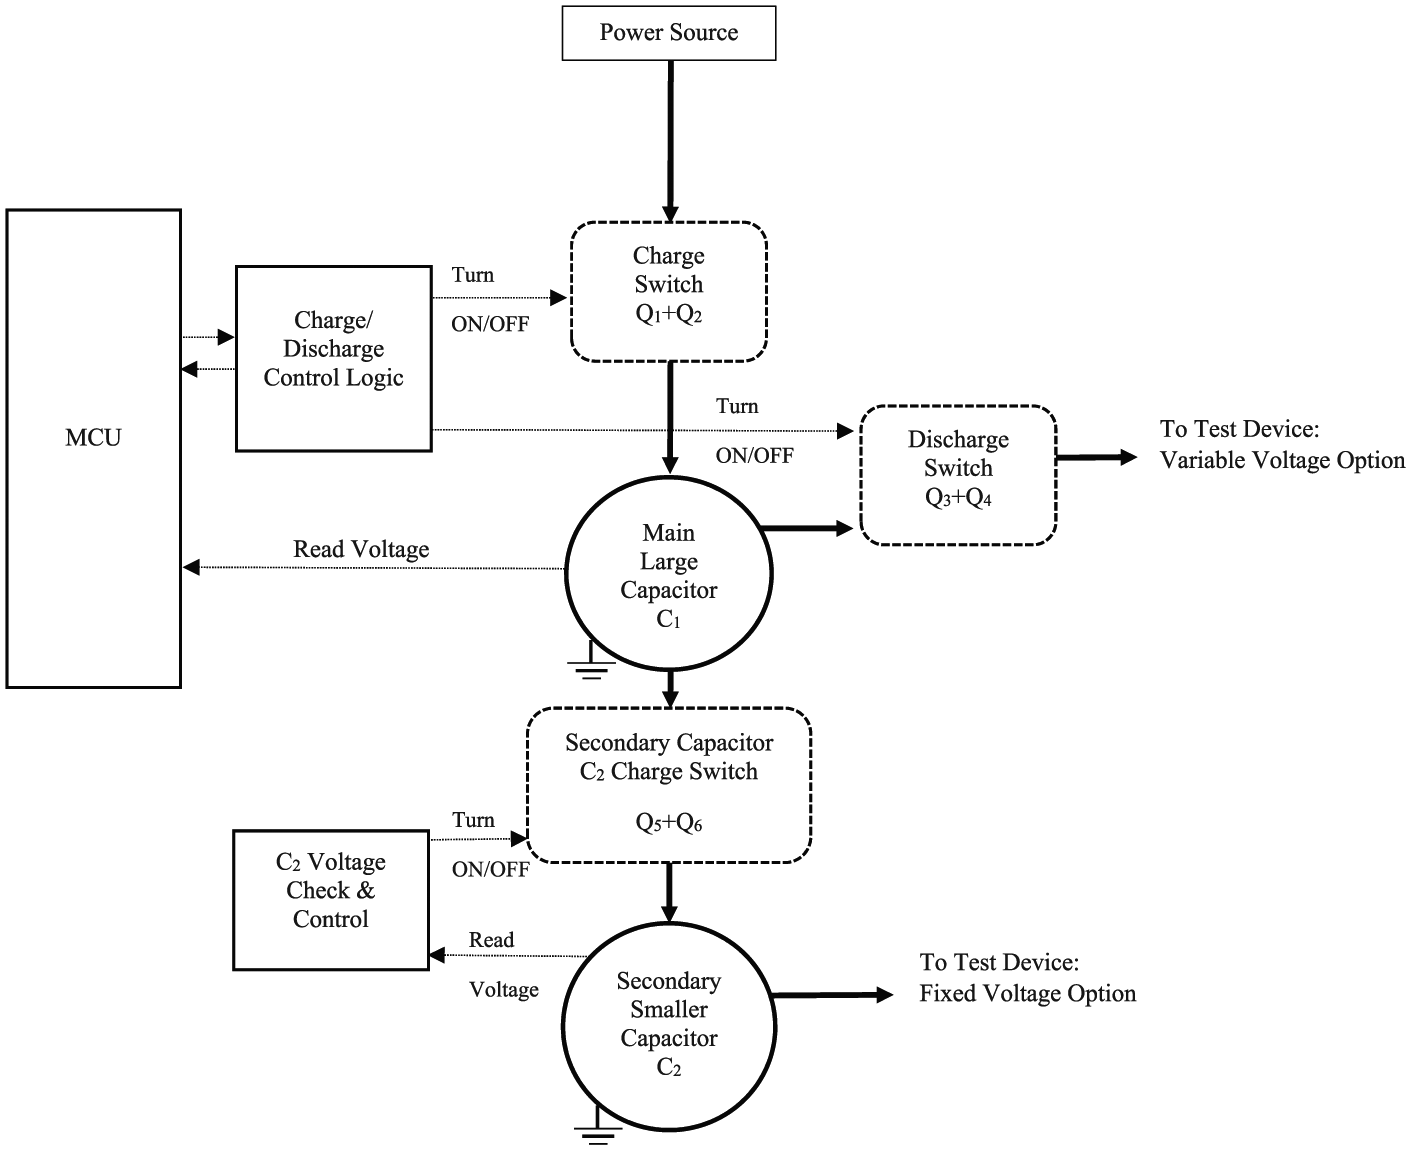
Power consumption meter schematic. The dark arrows represent the main current flow. The dotted arrows represent control signals that do not consume any energy from the main energy stored in
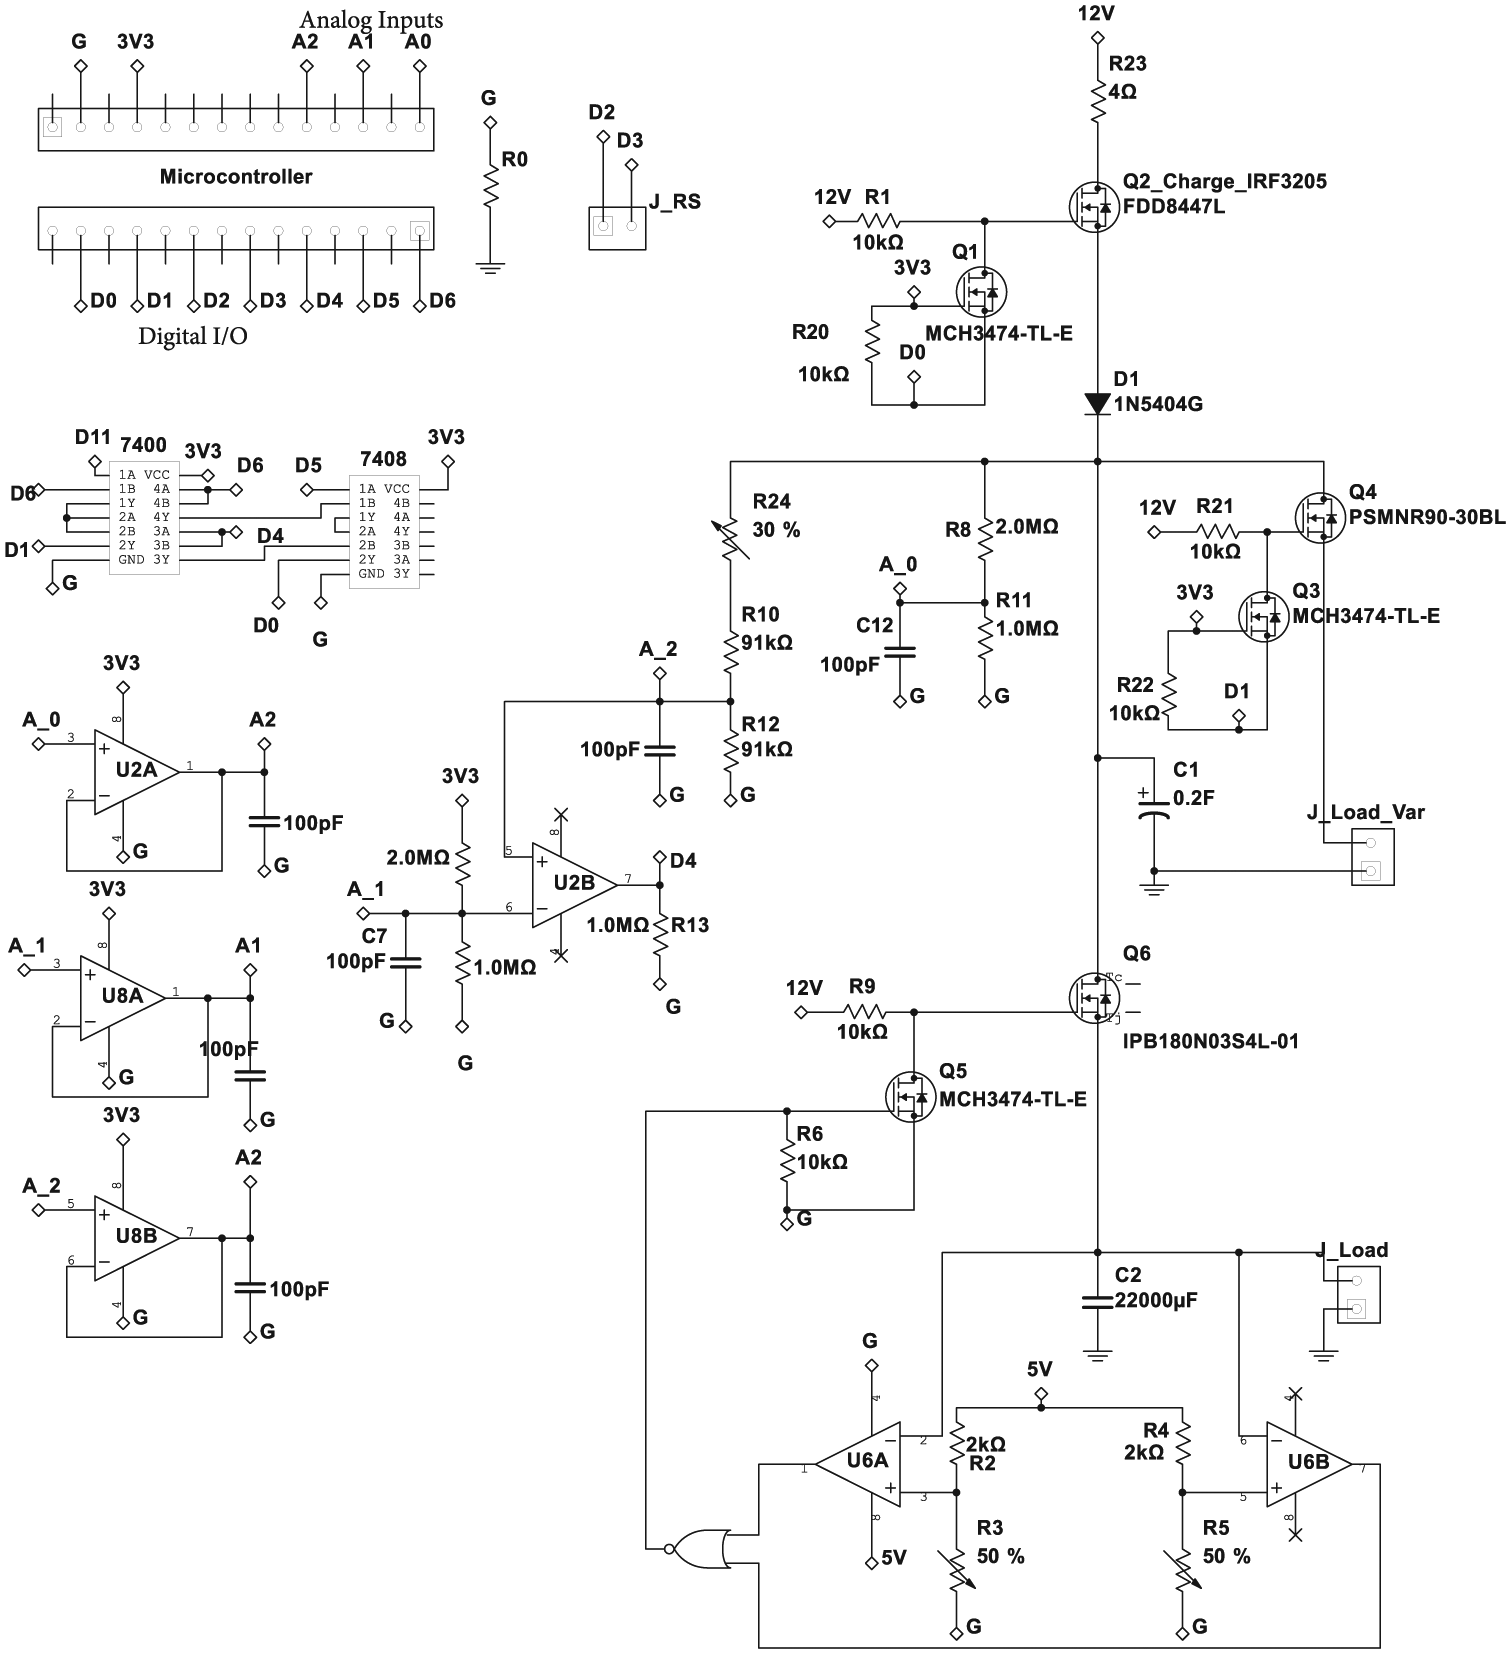
Power consumption meter circuit design.
A large capacitor array
Power consumption measurements are achieved by measuring the voltage across the array at the start and the end of the process. This array is shown as
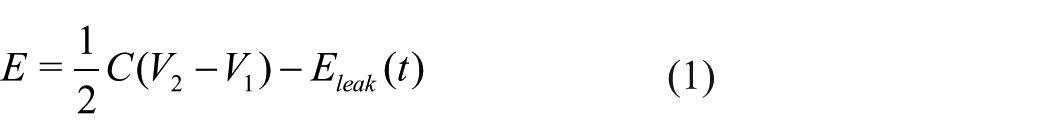
where
Supercapacitors
Several arrays of supercapacitors with capacities ranging from 1 to 80 F and a maximum voltage of 16 V were used. The error in the labeled value is generally very large. It can be as high as 40% in some cases. Therefore, an accurate measurement must be performed to get the actual capacitance. Supercapacitors generally have a significant charge leakage that must be considered after doing a power consumption measurement. The measured charge leakage for one of the used arrays is shown in Figure 3. To minimize the error due to charge leakage, one must use a capacitor array with the lowest possible capacity to minimize the measurement error. Leakage is estimated using predetermined lookup table saved into the microwatt-meter MCU.
2. Aluminum electrolytic arrays
This type of capacitors has a low self-discharge rate, but a significantly lower capacity.
A
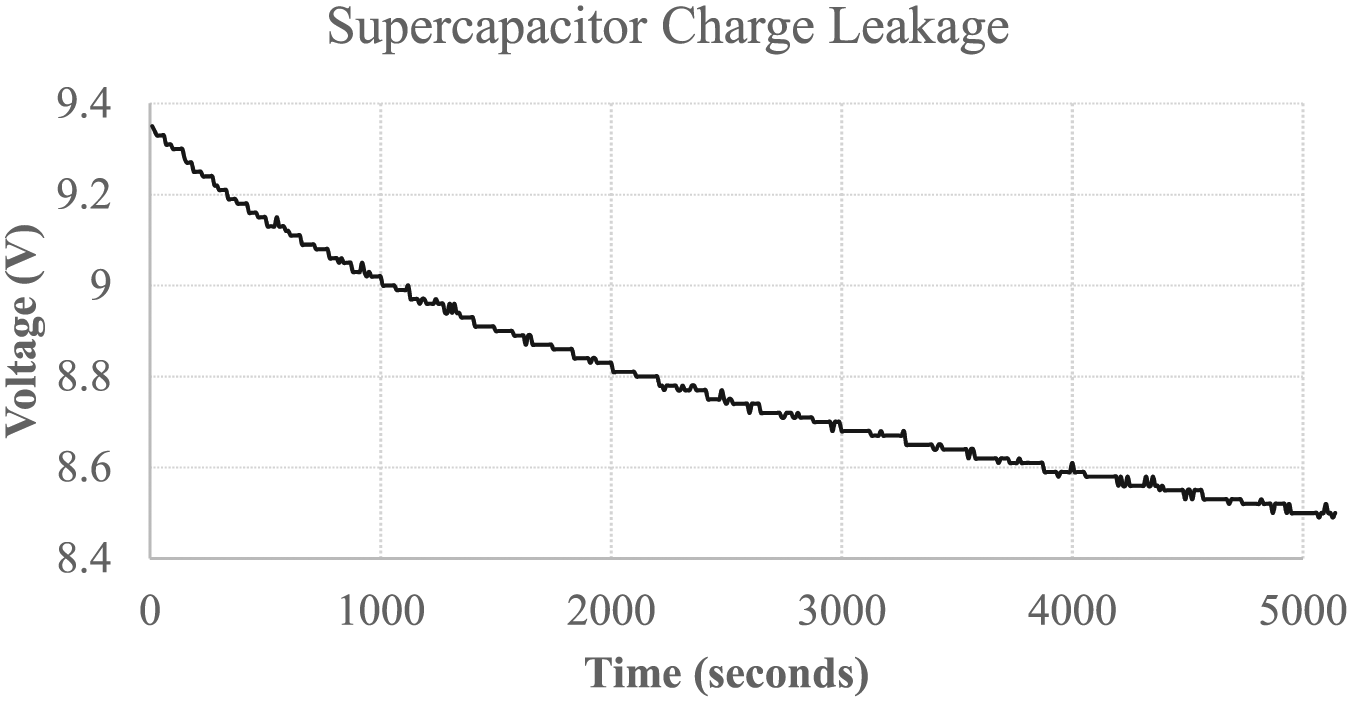
52.4 F 16 V supercapacitor charge leakage.
Charging sub-circuit
The switch that enables charging the capacitor is the n-MOSFET Q2 in Figure 2. A Fairchild FDD8447L was chosen for this task because of its 15 A maximum continuous current to enable charging supercapacitors quickly. This transistor has a 8.5 mΩ on-resistance
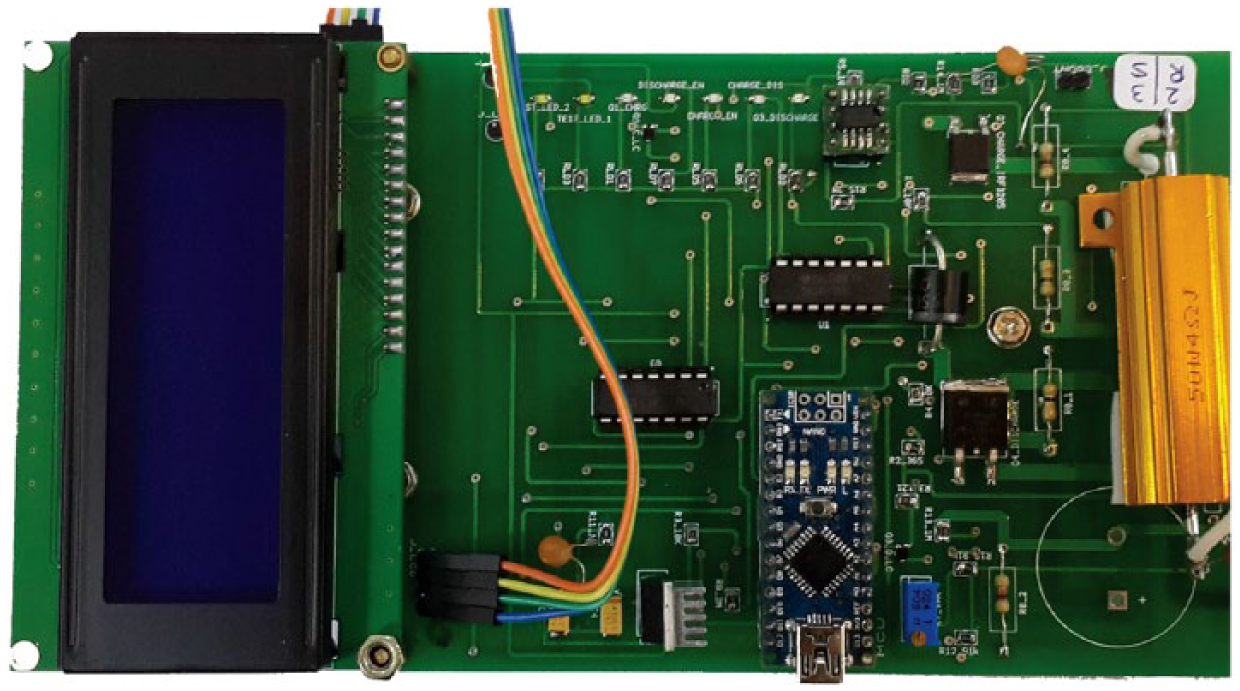
A prototype of the power consumption meter circuit in Figure 2.
Since the charge/discharge processes were driven using 5 V logic, the transistors Q2 was switched using another transistor Q1 to step-up its driving voltage in order to minimize Q2 resistance. The logic that drives Q1 will be discussed in section “Charge–discharge logic.”
Discharging sub-circuit
N-MOSFET PSMNR90 from Nexperia was used as a discharging switch, which is shown as transistor Q4 in Figure 2. This n-MOSFET has
Charge–discharge logic
The states of the charging transistor Q1 and the discharging transistor Q3 are determined using the logical sub-circuit formed by the integrated circuits: 74HC00 NAND gates, 74HC08 AND gates, and U2B AD8642 operational amplifier working as a comparator (see Figure 2). The used 74HCXX chips are TI parts SN74HC00N and SN74HC08N 14-DIP that have 2–6 V supply voltage range, the same LOW/HIGH logic-level voltage range, and the same 17 ns propagation delay. The function of the comparator U2B is to determine whether capacitor
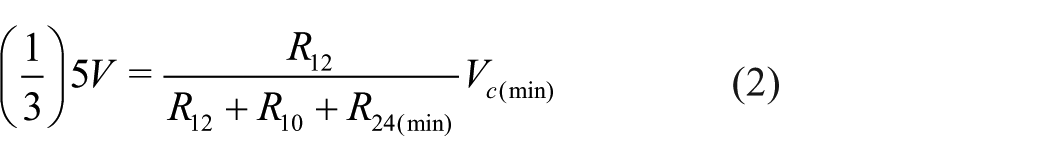
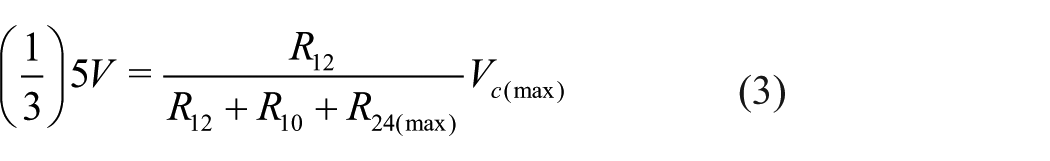
The values of all resistors must be as high as possible to minimize the leakage from
In order to be able to start the charging process, three conditions must be satisfied:
The comparator must signal that
Charging must be enabled by setting pin D5 on the MCU to HIGH.
Start the process by setting pin D11 on the MCU to LOW.
On the contrary, the discharging process can be enabled by setting pin D11 and D6 to HIGH. The status of all of these pins and transistors is monitored visually using LED indicators.
The logic network, formed by 74HC00, 74HC08, and U2B (AD8642), control the source pins of Q1 and Q3. Setting the source of Q1 to LOW will start the charging, while setting the source pin of Q3 to LOW will start the discharging process. The status of the source pins of Q1 and Q3 is monitored using the MCU digital pins D0 and D1, respectively. For the purpose of troubleshooting the circuit using the LED indicators, note that Q2 gate logic is the opposite of Q1 source logic (D0), and Q4 gate logic is the opposite of Q3 source logic (D1).
Using the comparator as a way to control
MCU
Two MCUs were tested: Arduino Nano 5 V with Atmega328P and NXP MK20DX256 Cortex-M3. The MCU monitors
An I2C LCD display is connected to the MCU using jumper
Optional constant voltage unit
Most devices have a linear voltage regulator that can handle the variable voltage of capacitor
Power microwatt-meter validation
Previous attempts to measure the power consumption of CPUs/MCUs have their own inaccuracies. In order to validate the microwatt-meter, the consumed energy by a known load is compared against what is expected by the fundamental conservation of energy law.
To validate the microwatt-meter design, a known resistor,
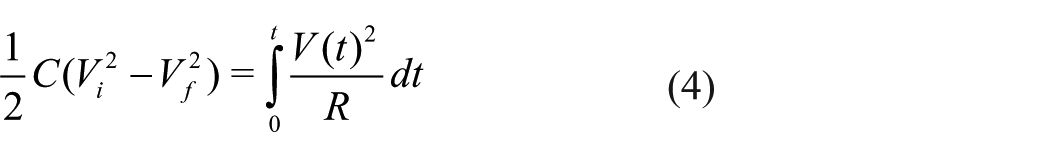
where
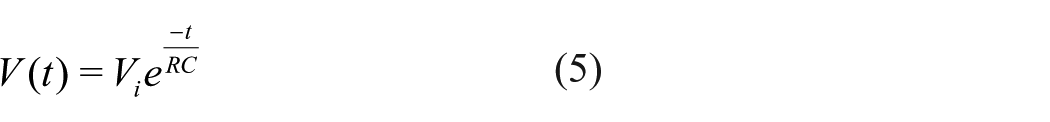
is the voltage of a resistor in an RC circuit. The leakage current for the used aluminum electrolytic capacitor array is ignored as the measurement time is typically less than few seconds. Figure 5 shows both the theoretically expected result (the solid line) and the experimental result with error bars (the dots). All experimental data points are within ±2.5% of the theoretically expected result. The average error is 1.2% for all data points.
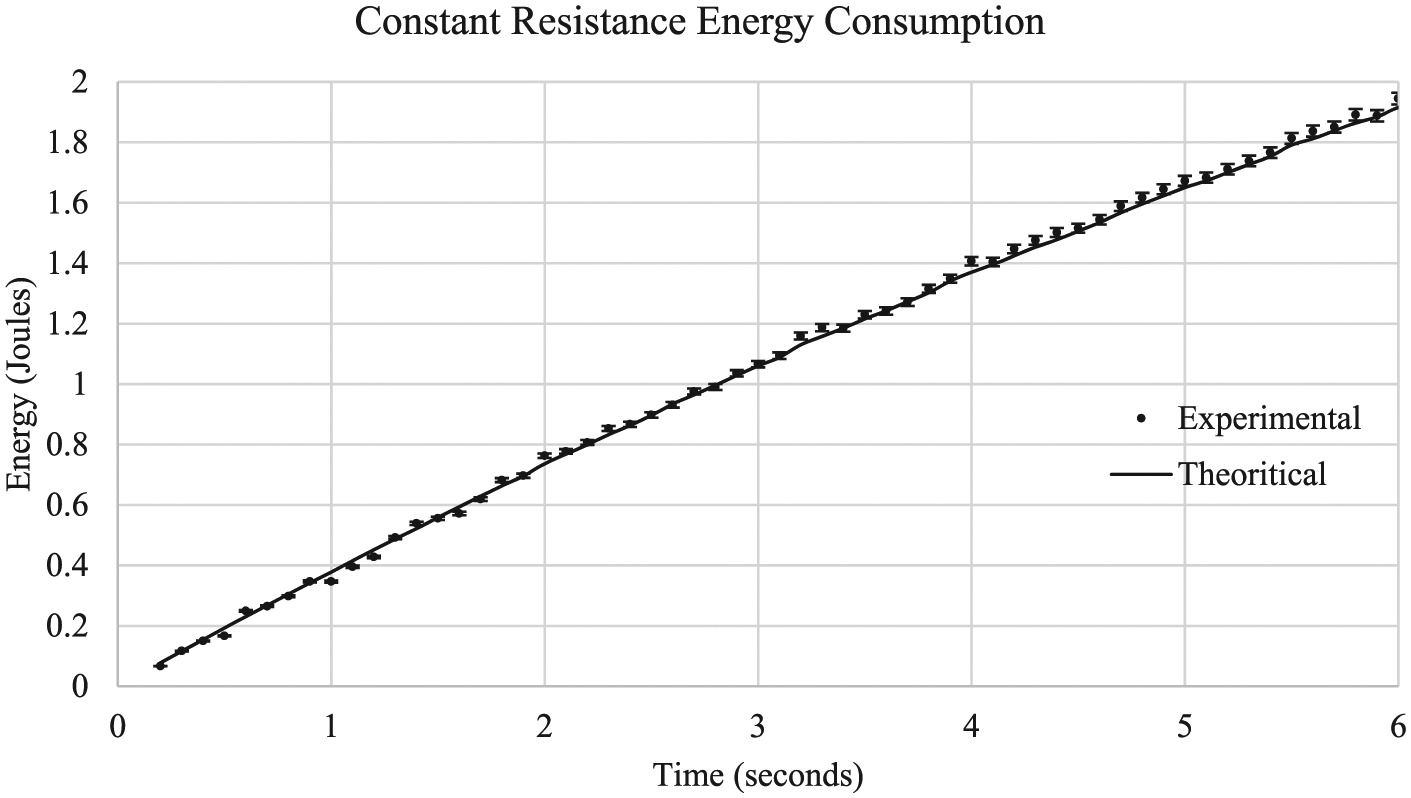
Comparison between the theoretically expected energy consumption of a 218 Ω resistor, and the experimentally measured consumed energy using the microwatt-meter.
Experimental tests
As mentioned earlier, the microwatt-meter can be used to measure power consumption at different levels of abstraction. Recall that the measurement relies on two control signals, the ready and measure signals as discussed in section “MCU.” Regardless of what is to be measured, the microwatt-meter should be used in the following manner:
Use the microwatt-meter to power the load system under consideration through a suitable connector.
The load system should wait for the ready signal from the microwatt-meter, which indicates that the capacitors are charged to the required voltage and ready to be used. Note that to get accurate measurements, it is important to wait until the capacitors are charged before starting.
The load system starts the measurement by setting the measure signal to HIGH.
Let the load system do the task that needs to be evaluated.
To end the measurement, the load system sets the measure signal to LOW.
It is worth mentioning that the control signals in steps 2, 3, and 5 can be maintained by the system under consideration itself or by an external controller.
In this section, the microwatt-meter ability is demonstrated at three different levels:
System level. As a case study, the energy consumption of an XBee S2B module on four different microcontroller platforms is measured in section “System level energy measurement.” The energy cost of preparing and transmitting a single byte is shown.
Component level. As a demonstration of this ability, the energy cost of only transmitting a single byte using XBee S2B transceiver is calculated in section “Component level energy measurement.” In addition, the energy wasted by the voltage regulator of Arduino UNO R3 board is shown.
Instruction level. The power consumption of adding two 32-bit integers, using C language, on ATSAM3X8E Cortex-M3 microcontroller is presented in section “Instruction level energy measurement.”
A comparison with multimeter current-based measurements is presented at the end of each subsection.
System level energy measurement
As a case study for a system-level measurement, an XBee S2B module is mounted on four different platforms. The platforms use AVR-based boards, three of which use the Atmega328P MCU and the fourth uses Atmega2560 MCU. The three Atmeag328P boards are an original Arduino Uno Rev 3, a generic Arduino compatible, and a Sparkfun RedBoard. The fourth board is an Arduino Mega. The XBee and the MCU board together comprise the load system for which the measurements were done. The task in step 4 is carried out by the MCU and the XBee module together, where the packet gets prepared by the MCU and transmitted by the XBee.
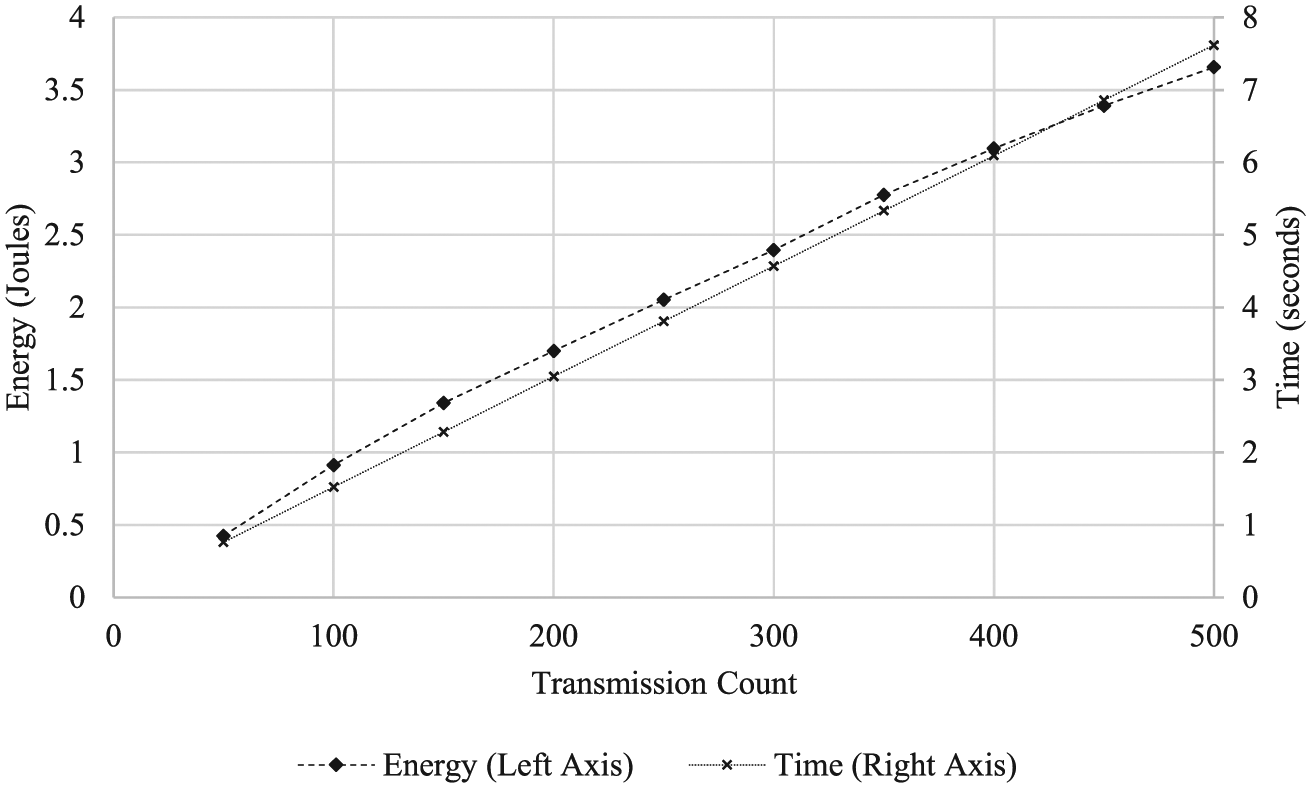
For each board, the XBee is used to transmit payloads of different lengths ranging from 10 to 200 bytes. For each payload length, the number of transmissions was varied from 10 to 500 in steps of 10. The results for the original Arduino Uno R3, the generic Arduino compatible, the Sparkfun RedBoard, and the Arduino Mega are shown in Figure 6. As expected, the consumed energy increases linearly with the number of transmissions. A better estimation of the cost per transmission can be calculated by taking the slope of each of the shown lines. Figure 7 aggregates all of these results together and enables the calculation of the energy cost per byte as shown in Table 1.
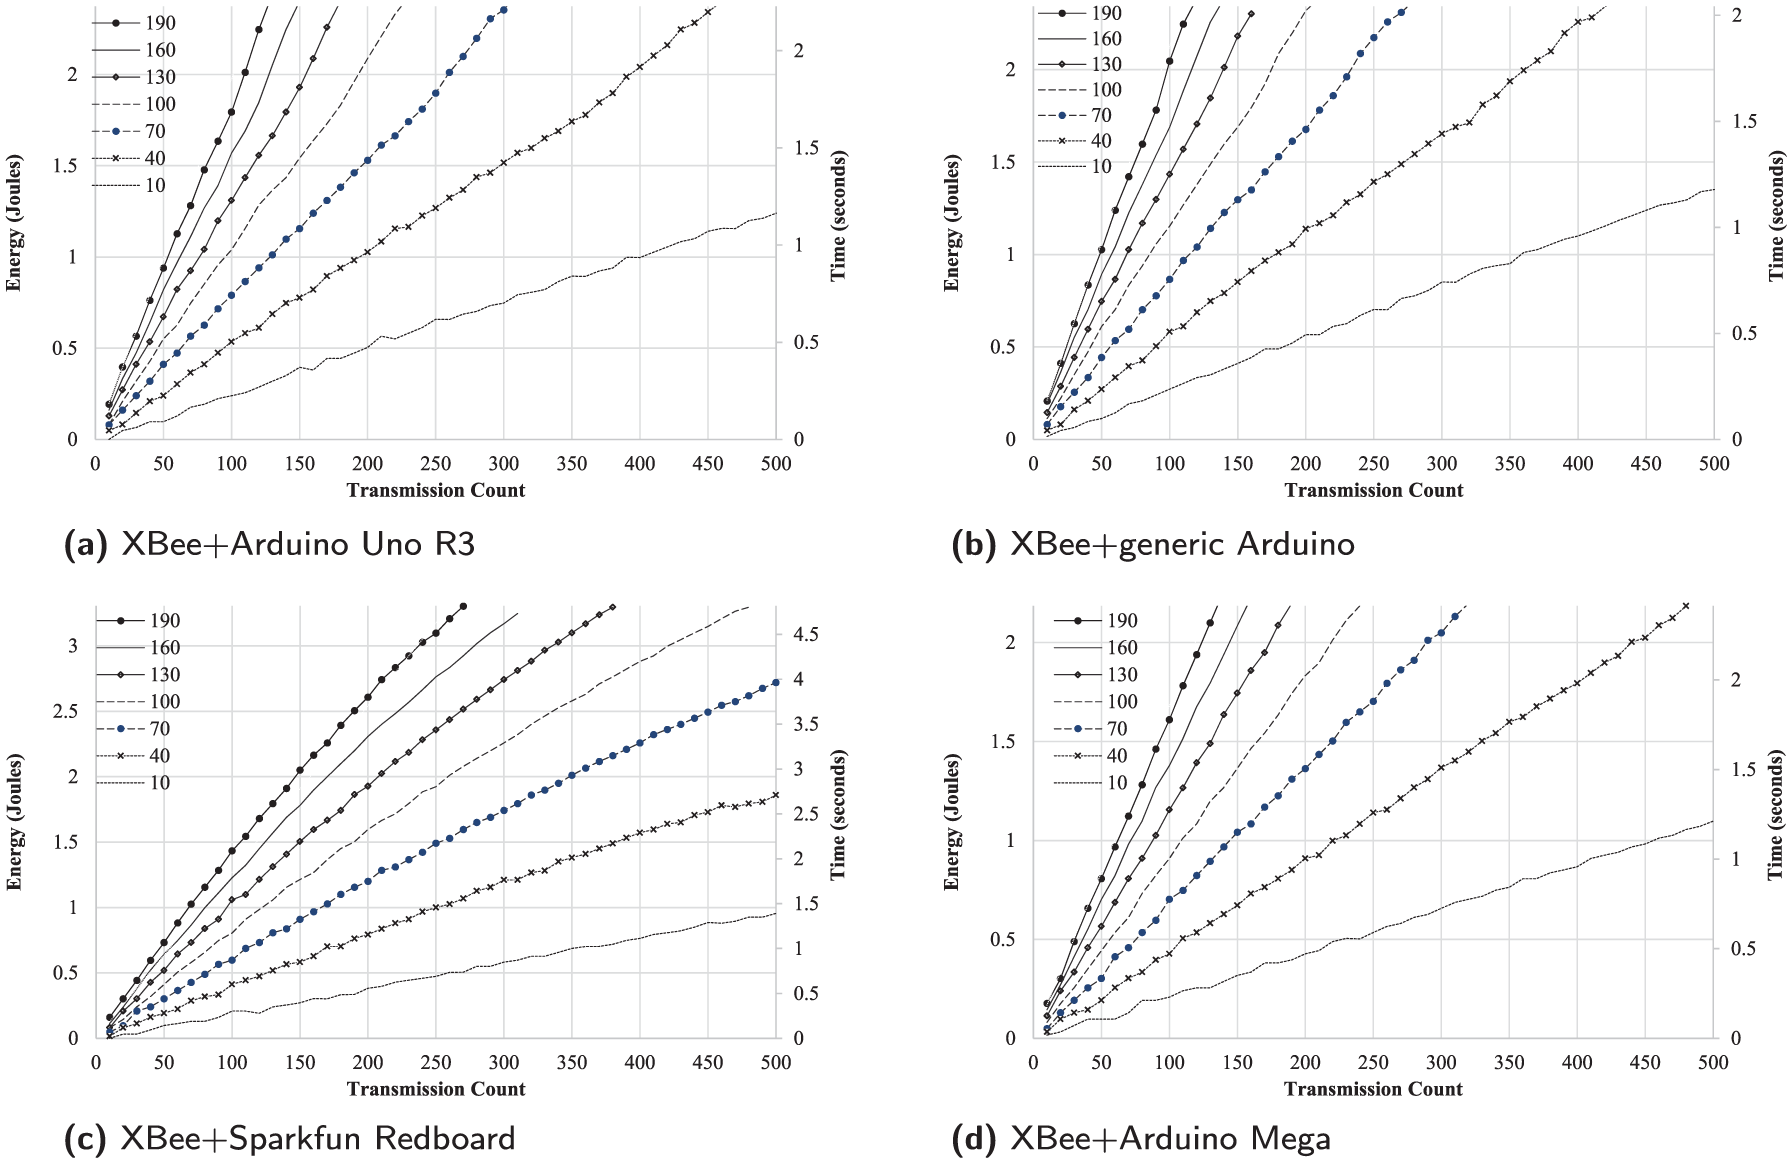
Energy consumed versus transmission repetition count of a ZigBee packet (payload: 10–200 Bytes) using XBee S2B module, mounted on four different MCU boards. XBee module settings: Router, API 2, 115,200 bps, Power Level 4; Arduino IDE 1.8.5 optimization setting: Os; primary left axis: energy (J); and secondary right axis: time (s).
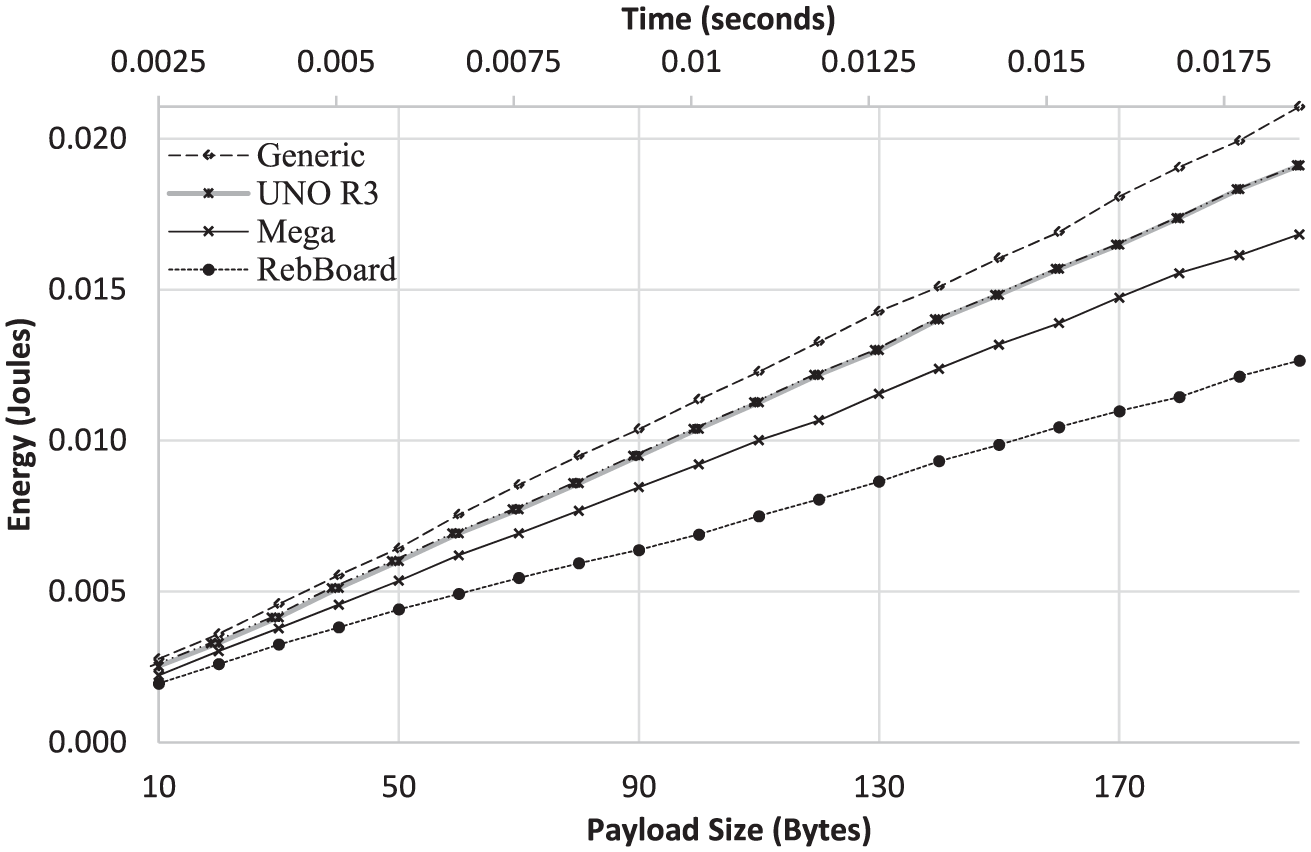
Energy consumed to prepare and send a single ZigBee packet using an XBee S2B module attached to different microcontroller boards. Each point is the result of fitting the corresponding data set in Figure 6. The error in each point ranges from 0.5% to 2.0% as calculated by Levenberg–Marquardt algorithm. XBee module settings: Router, API 2, 115,200 bps, Power Level 4.
Energy consumed during the transmission of a single byte using XBee S2B module mounted on four different MCU boards.
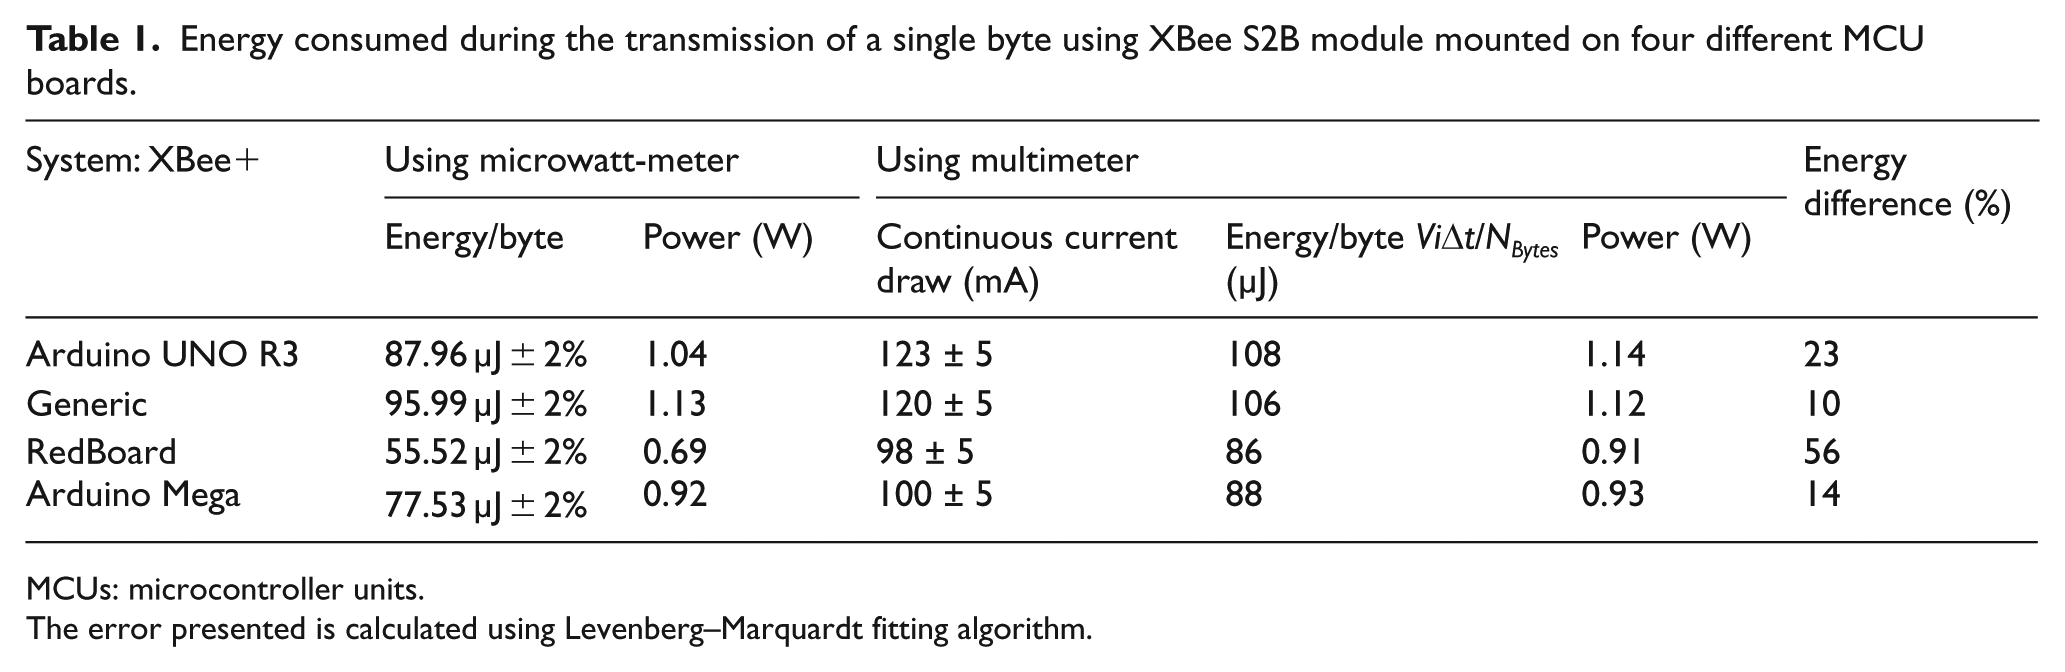
MCUs: microcontroller units.
The error presented is calculated using Levenberg–Marquardt fitting algorithm.
To calculate the consumed power for each system, the time to complete the transmissions stated previously is measured. The results are shown in Table 1. Note that the energy consumption of the three Atmega328P boards is different even though they are using the same MCU with the same claimed specifications. These measurements highlight the weaknesses of relying on simulation and estimation models as mentioned in section “Calculation/simulation-based methods.”
Although the fundamental conservation of energy law is the ultimate reference point in judging energy-metering techniques, a comparison with current-based measurements is presented. All currents throughout this study were performed using BK-388A Test Bench multimeter. Such measurements were done by putting an instruction (sending ZigBee packet n this case) in a loop and recording the drawn current. By measuring the source voltage
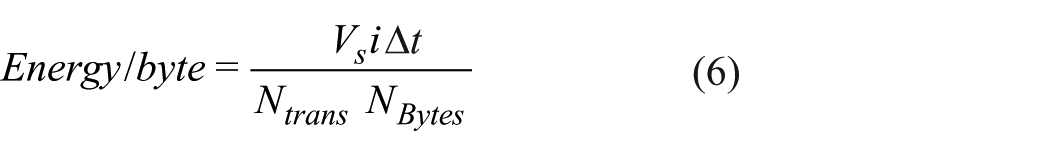
where
Component level energy measurement
To demonstrate the ability of using the microwatt-meter on a component level, the energy consumption of the XBee S2B module alone is measured. This is accomplished by powering the XBee alone through the microwatt-meter. The Arduino board was powered from a different power supply. In this case, the load system under consideration is the XBee only, and the measurement is controlled by an external controller which is the MCU board. Figure 8 shows the consumed energy for transmitting a 160-byte payload a number of transmissions varying from 50 to 500 using the maximum transmission power level. From the figure, one can calculate that the energy cost per transmission is
Energy consumed by XBee S2B module only; payload = 160 bytes; XBee settings: Router, API 2, 115,200 bps, power level 4; energy per packet
After putting the XBee module in a transmission loop, the measured current drawn from a 9.3-V voltage source was
Arduino UNO R3 board can be powered either via a 12-V external connector or via the on-board USB connector. Powering the board using the USB connector will bypass the on-board voltage regulator. The on-board voltage regulator will waste energy even if the Atmega328P MCU is powered down or even removed completely from the board.
Arduino UNO R3 board power consumption was examined further under three different scenarios:
The board was powered using the 12-V connector with the Atmega328P in “Power Down” power saving mode.
The board was powered via the on-board USB connector (bypassing the voltage regulator) with the Atmega328P in “Power Down” power saving mode.
The board was powered via the 12-V connector with the Atmega328P completely removed from its socket.
The results are shown in Figure 9. The fitted slopes of the data shown in Figure 9 give the average consumed power for the three different scenarios. The result is summarized in Table 2. It should be noted here that the power characteristics of Atmega328P stated in its data sheet are for the isolated chip only. The results presented here are for the whole board. A comparison between the microwatt-meter measurement and a multimeter measurement is shown in Table 2. Note that in this table, unlike the result in Table 1, the multimeter and the microwatt-meter results are very close. This is due to the fact that the load draws a constant current in this case.
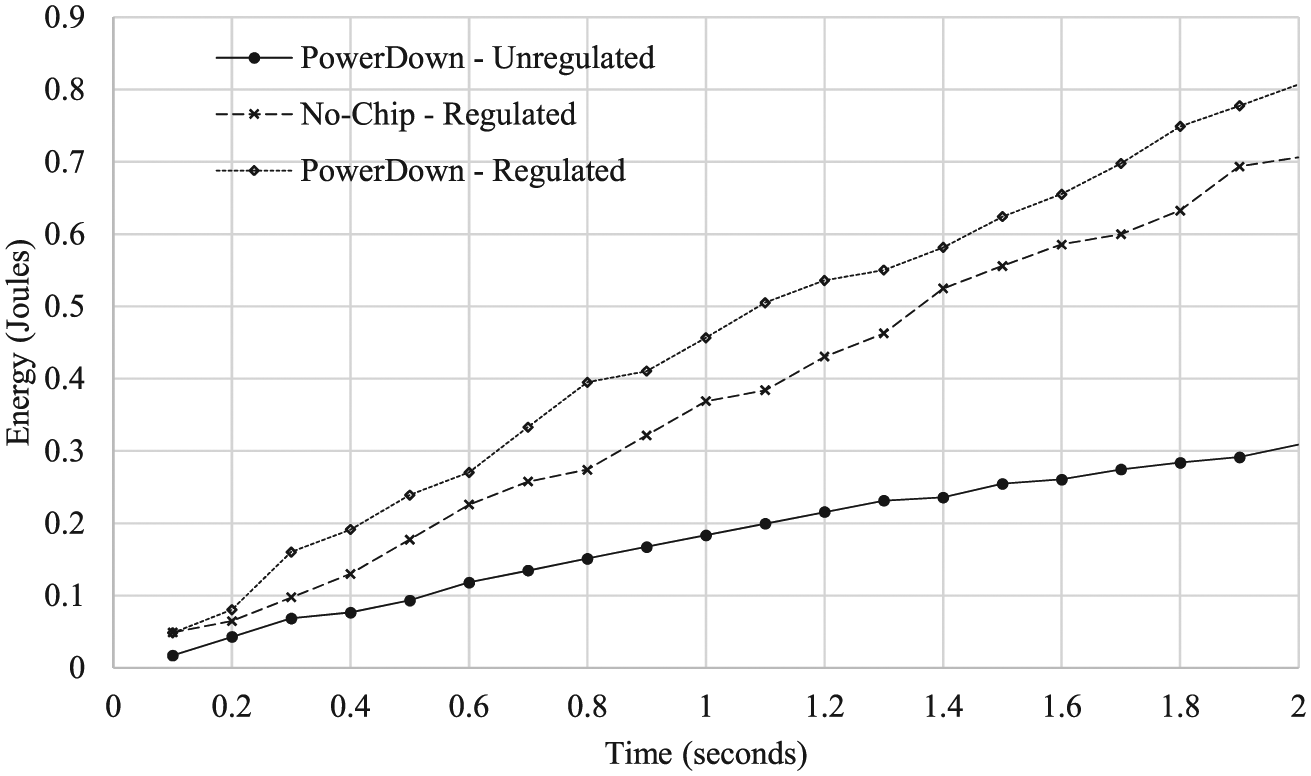
Energy consumption of Arduino Uno R3 board in three different scenarios. Atmega328P ADCs disabled when powered down. PRR register = 0xFF.
Measured power consumption of an Arduino UNO R3 board under different test conditions.
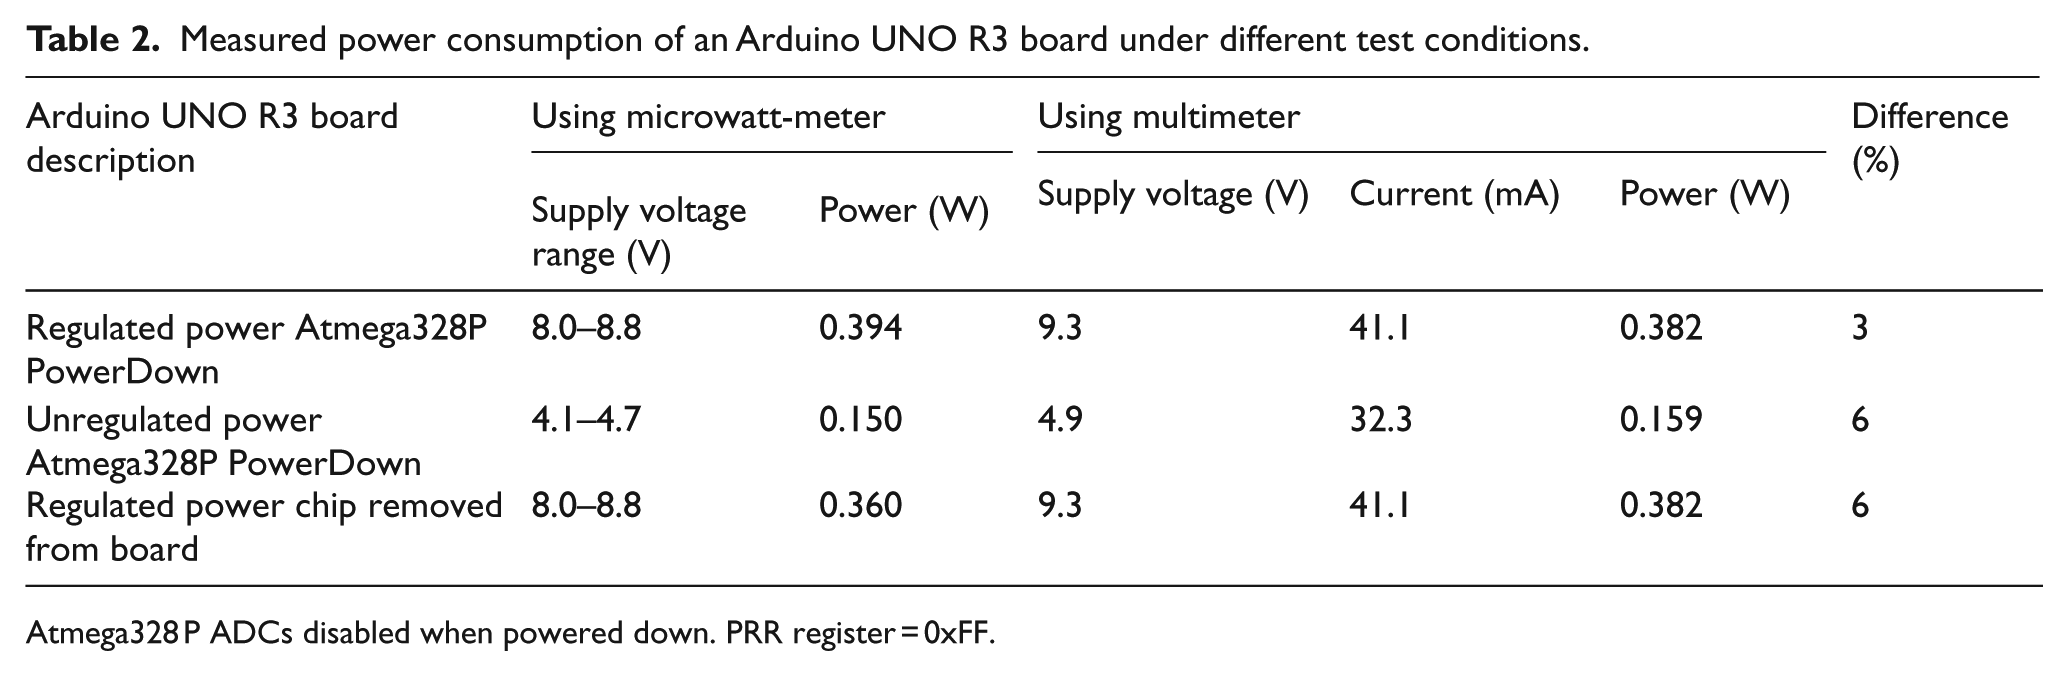
Atmega328 P ADCs disabled when powered down. PRR register = 0xFF.
Instruction level energy measurement
The addition of two 32-bit numbers is chosen to demonstrate the ability to calculate the energy of a single instruction. The increasing energy cost of repeating this instruction is shown in Figure 10. From this figure, it is found that the energy of a single 32-bit addition instruction is
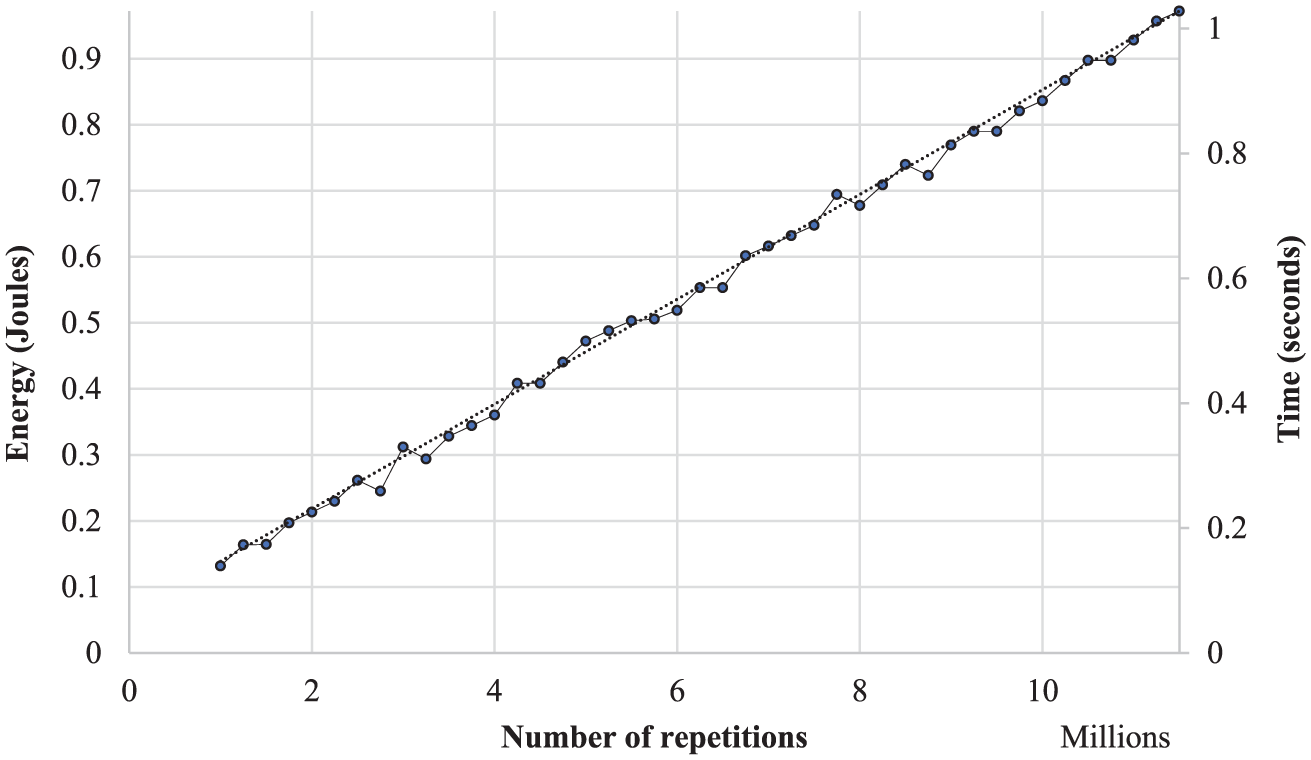
Energy consumption of adding two 32-bit integers on Arduino Due board using C code. Compiler optimizations are disabled. The slope gives the energy per instruction:
Sources of error
There are several sources of error in the data shown. Most of the error is due to the following factors:
Capacitors self-discharge and leakage through the surrounding components. This factor is important when using supercapacitors. However, it is ignorable when dealing with aluminum electrolytic capacitors. The error from this source was minimized by measuring the capacitor self-discharge rate, and then programming the microwatt-meter MCU to take this into account when calculating the consumed power.
Analog to digital conversion: Any voltage read by the MCU is reduced first by a voltage divider before sending it to the ADC. This is done to protect the MCU analog inputs from high voltages. The used MCU has a 12-bit resolution. This accuracy is dropped by a factor of three because of the used voltage divider. A separate external ADC with a higher resolution should enhance the results significantly.
Voltage regulators efficiency and (non)linearity. XBee modules, for example, have 3.3 V regulator that can handle up to 20 V power sources. The efficiency of this regulator drops with higher input voltages. This source of error depends on the load system design. This error can be minimized by working in the linear region of the load system voltage regulator.
The timing induced by the exchanged control and handshake signals may result in a negligible error. For example, the discharge transistor Q4 has a 200-ns transition time. The power dissipated during this time is negligible when compared to the few seconds of measurement period. However, it should be taken into account if the measurement time is less than 1 s.
Main capacitors
Conclusion and future work
In this paper, a simple, low cost, yet efficient, design of a power consumption meter for programmable and/or battery-operated devices and sensors is presented. The device ability to measure energy on system level, component level, and instruction level is demonstrated. The cost of sending a singly byte using XBee S2B transceivers is calculated. The device accuracy is demonstrated by calculating the cost of adding two 32-bit integers using Cortex-M3 microcontroller. The results obtained were consistent with the manufacturers specifications. But more importantly, the accuracy of the device was verified using the fundamental conservation of energy law. Its accuracy is found to be as high as 0.5%.
The initial results for the power consumption of assembly instructions and code written in higher level languages are very promising. Different instructions and architectures of various MCUs/CPUs/FPGAs and wireless sensors will be tested. The device design will be upgraded with a better ADC and MCU units.
Footnotes
Declaration of conflicting interests
The author(s) declared no potential conflicts of interest with respect to the research, authorship, and/or publication of this article.
Funding
The author(s) received no financial support for the research, authorship, and/or publication of this article.