
Abstract
Background
It is possible to see a number of spectrophotometers produced by commercial purposes developed in line with the technical advices identified by the International Commission on Illumination (CIE) in universities’ chemistry labs. These devices are employed in measuring and testing materials with unidentified characteristics as well as reporting the results. However, these systems are not modular in design and do not allow updates or modifications. Moreover, when the literature is reviewed, it can be seen that the researches on computer-controlled devices is limited. It is also reported that the devices with user interfaces bring advantages to researchers in terms of time efficiency and safety.
Methods
In this study, a computer-controlled, modular and low-cost spectrophotometer is designed to measure material densities contained within liquid samples. The proposed system is composed of a main unit, a data acquisition unit and a user interface. All tasks and relevant arrangements involved in a spectrophotometer application are controlled through an interface developed on LabVIEW graphical development platform; the results of the measurements can be monitored in real time, and it is also possible to store data. Thanks to the modular design, it became possible to change and update the relevant stage as needed. The waveform filter can be selected specifically as visible range, ultraviolet range or both depending on the application.
Results
The experiment was conducted in the visible range and a waveform filter between 400 and 700 nm was used. In the experiments, an easily accessible materials–methylene blue and copper sulfate solutions–were preferred as samples. For these solutions, the waveforms that give the best absorption values were identified and the density was measured at those values. Furthermore, the nonlinearity and repeatability characteristics of the proposed spectrophotometer were analyzed. For this purpose, measured values were compared with the acquired values from another commercial instrument that is already used in medical field. Measurements were repeated 50 times for copper sulfate and 43 times for methylene blue solutions.
Conclusions
After statistical analysis, it was observed that the reliability of the proposed system is high.
Introduction
Today, most of the measurement system designs rely on basic physics laws. One of these is the spectrophotometer method that allows measurements based on the principle of light beams passing through the material or its absorption. These devices using spectrophotometric method are employed in fields such as chromatics, material test and medical diagnosis. 1 Spectrophotometers, in addition to blood tests, also play a critical role in clinical studies, chemistry, biology and environmental science due to their ability to provide rapid and accurate results.2,3 Spectrophotometers, when compared to other methods used for similar purposes, provide faster results. 4 In addition, the spectrophotometer devices, with their rapid pace of development, are expected to be higher in quality and lower in costs.5,6
For traditional spectrophotometric measurement, single-light spectrophotometers are used. This technique is a good method for determination of absorption at a single point of the spectrum. These also require simple optical components and offer a low-cost option. However, it is difficult to adjust these to different waveforms. When a serial data acquisition method is employed, these are relatively slow. As an alternative to single-light spectrophotometers, diode array spectrophotometers are used. Here, the light source is multicolored. These are faster since they use parallel data acquisition method. However, since the intensity amplitude of the light source is low, the error rates increase when measuring samples exhibiting fluorescent characteristics. Dual-light spectrophotometers were developed to overcome the errors caused by amplitude fluctuations in the single-light spectrophotometers during long-term measurements. However, this type of spectrophotometer contains more optical components. This condition that has an attenuating effect on the light also causes loss of sensitivity. The spectrophotometers of split light design use a beam splitter, and these split beams are processed by two identical sensors. Although this type of spectrophotometers requires less optical components compared to dual lights, it also contains more source fluctuation errors. The noise performance of dual and split light spectrophotometers falls behind the single-light spectrophotometers. Today’s modern spectrophotometers are designed as computer-controlled and allow electronic storage of measurement results. 7
It is possible to see a number of spectrophotometers used for commercial purposes developed in line with the technical advices identified by the International Commission on Illumination (CIE). 8 These devices are employed in measuring and testing materials with unidentified characteristics as well as reporting the results. However, these systems are not modular in design and do not allow updates or modifications. Moreover, when the literature is reviewed, it can be seen that the research on computer control is limited. 6 But it is also reported that the devices with user interfaces bring advantages to researchers in terms of time efficiency and safety. 3
In this study, each stage of the setup is designed as computer controlled. In addition, thanks to the interface program, all tasks can be controlled by the user. Furthermore, the spectrophotometer device was designed in a modular architecture that allows modifications or improvements as required. One of the main contributions of the proposed design is its lower cost compared to the commercial devices in a similar category.
Methodology
In the basis of digital analyses used in all spectroscopic methods lies the Lambert–Beer law. The Lambert–Beer law correlates the lights entering and exiting the solution. According to this
The amount of absorption is directly proportional to the concentration of the material and the distance the light passing through the solution travels.
There is a linear relationship between the concentration of the measured material and the level of absorption. Absorption increases and transmittance decreases if the concentration increases.
The transmittance of the material for the solution is defined as in Equation (1)
here, T refers to the coefficient of transmittance, It is the light intensity leaving the solution and Io is the light intensity entering the solution.
The absorption coefficient that determines the amount of light retained by the material is given in Equation (2)

here, A refers to the absorption of the sample and T refers to the transmittance of the sample.
If the coefficient of transmittance is expressed as percentage, then the absorption coefficient can be found by using Equation (3)

Even though transmittance is a quantity that can be measured directly, absorption is a parameter that cannot be measured directly. Therefore, in this study, transmittance was first obtained and then absorbance was calculated by using Equation (3). For this purpose, in the first step, the amount of light was measured in terms of voltage by using a specially designed electronic circuit, and then, the transmittance percentage was obtained through Equation (4)
here, T refers to the transmittance of the sample and Vn refers to the voltage measured with the sample. Vs is the voltage measured by the sensor when light path is closed. And finally, Vy refers to the voltage measured with a standard sample.
The readings performed after obtaining the absorption value is called as final reading. Reading is performed after the reaction is complete and products are formed, in other words, after the color formation is finalized. For this purpose, three tubes should be prepared as blind, standard and sample. The device is reset with the blind, and then, the optic intensities of the standard and sample are read. The intensity of the sample is calculated by using Equation (5) 7
here, Ast denotes the absorption of the standard, Cst the concentration of the standard, An the absorption of the sample and Cn the concentration of the sample.
Experimental setup
The designed spectrophotometer device in a modular structure is composed of two components: the hardware and the software. The components of the hardware, as seen in Figure 1, consist of three subsections as main unit, controller unit and data acquisition unit with PC.
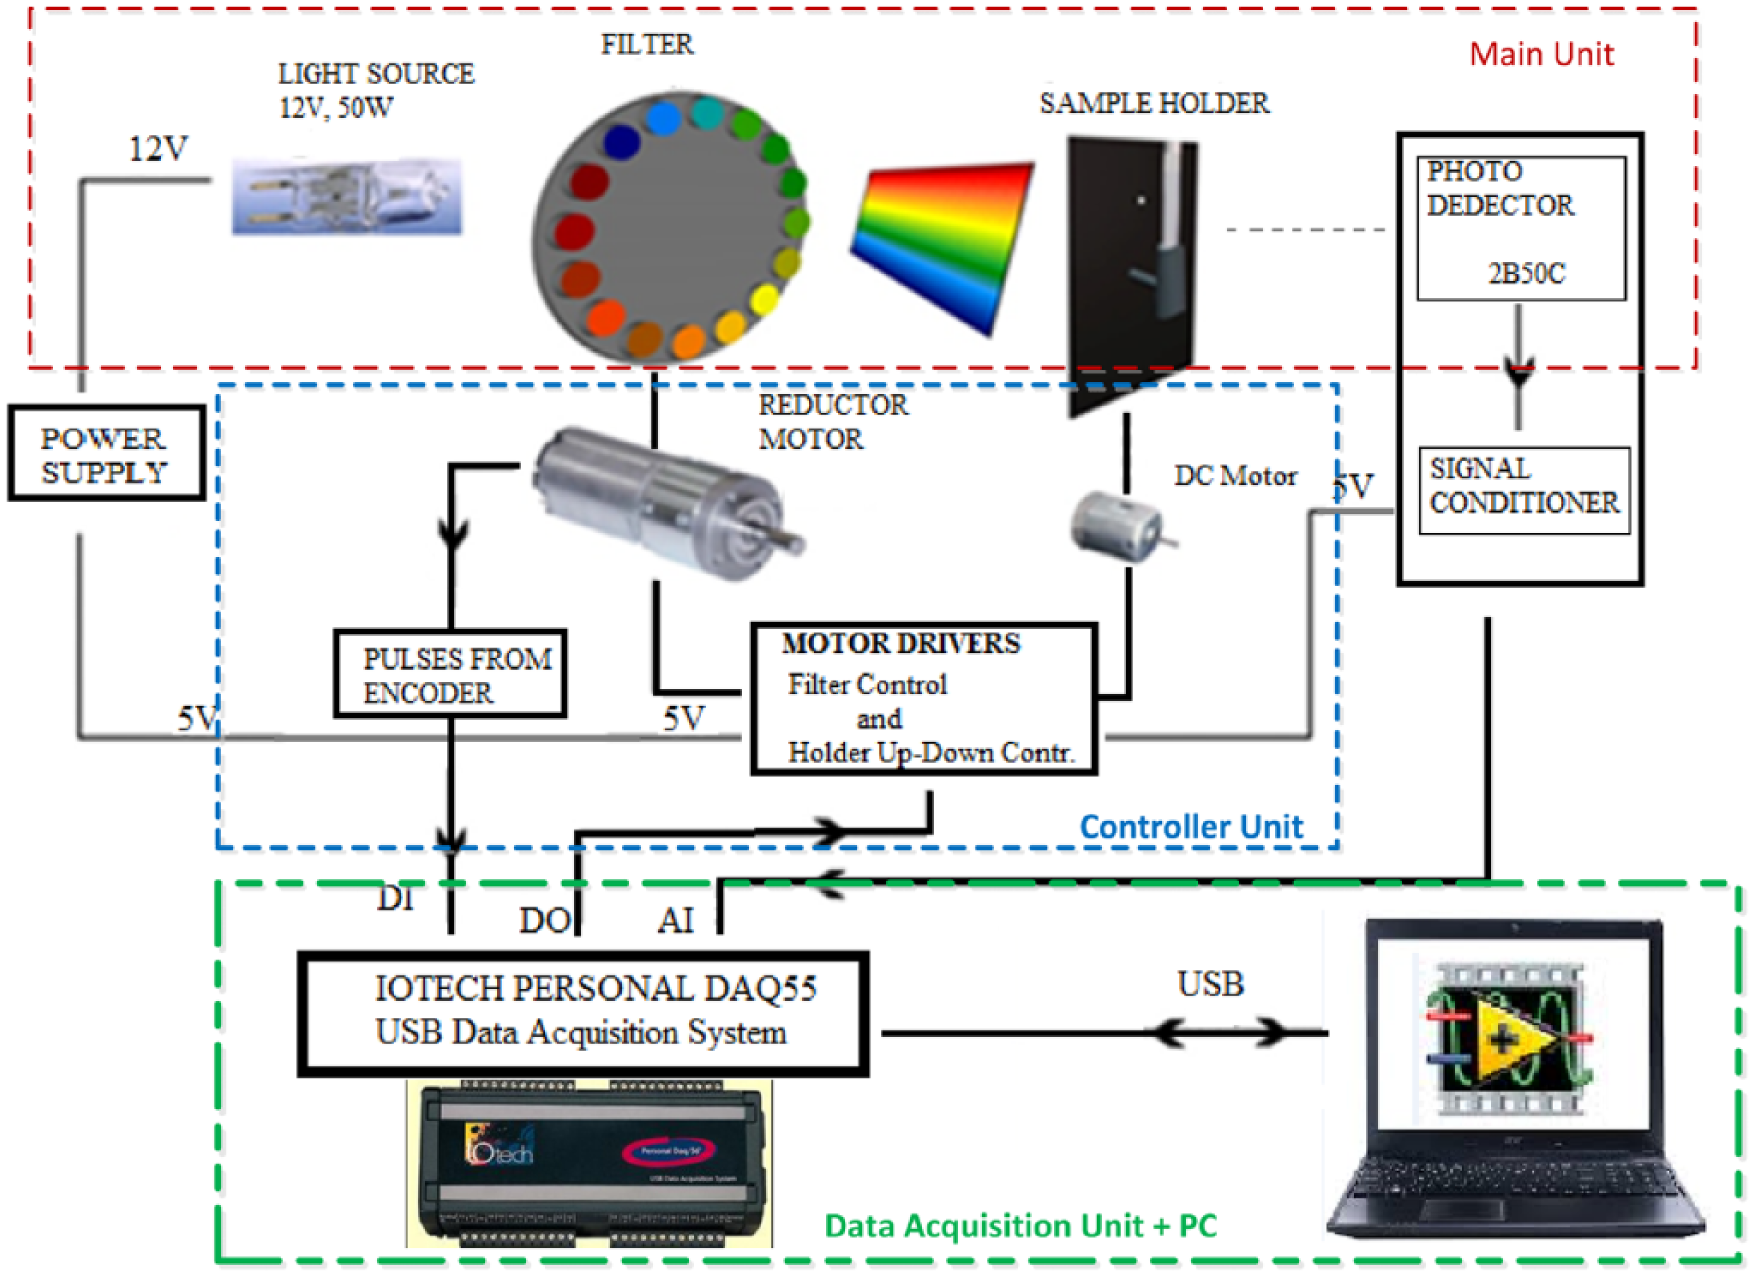
PC-based modular spectrophotometer setup block scheme.
Main unit includes light source, circular filter, sample holder (cuvette) and photodetector. In the controller unit, there is a single-driver circuit controlling both the up/down movement of the sample holder and the position of the circular filter. The last unit includes IOtech Personal DAQ55 Data Acquisition Module as well as a PC. This unit also handles user interface functions (Data Monitoring, Presentation, Data Logging, System Control Commands).
The main and the controller unit are placed in a black box, as seen in Figure 2, to shelter these from external influences including the light. The modularity is achieved by placing rails inside the box, and the connections between the layers are made by designing an appropriate connector architecture.
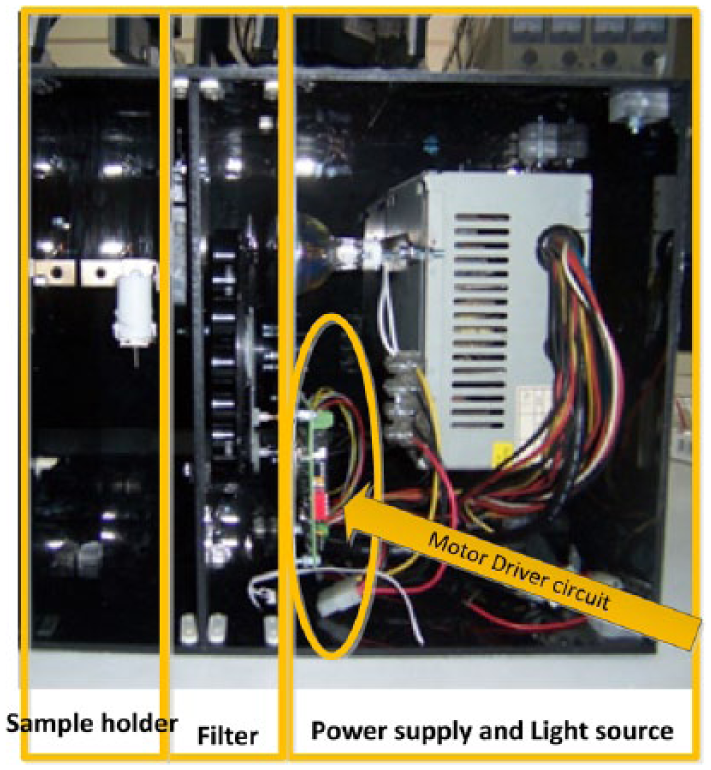
Housing of the hardware components.
The main unit of the measurement system is composed of a linear light meter circuit with a 2B50C photodetector, sample holder cuvette, filter and the light source. A wide spectrum Tungsten Halogen lamp is used as the light source with an output power of 12 V–50 W. In the experiment setup, instead of an optical mechanism composed of prisms and mirrors, a circular color filter mechanism was chosen offering easier calibration. In the study, a filter mechanism with 400–700 nm visible range spaced in 20 nm intervals was selected. In this case, it is impossible to examine waveform absorbing materials at intermediate values. However, since this study aims to create a low-cost mechanism that could be used in chemistry labs for training purposes, 20 nm resolution was considered sufficient. The main unit fulfills its function by sensing the amplitude of the beam that has a specific waveform passing through the solution in the photodetector stage.
Controller unit, however, brings the filter in front of the sample for the required waveform, selects the waveform, controls the position and places the sample holder into the main unit. Both motors can be controlled with a single-driver circuit. The first 4 bytes (D1,..., D4) of the 8-byte digital output port of the PDAQ 55 data acquisition module are allocated for these controls.
The encoder output of the reductor motor is connected to the Digital Input terminal of the PDAQ 55 unit over a Schmitt trigger circuit, the pulses are counted, and afterwards the position of the filter is determined (on which waveform it is located) based on the counter value in the program.
Last unit, the Data Acquisition Unit, includes IOTECH Personal DAQ55 Data Acquisition Module, 9 a conditioner circuit for photo-detector signal (Analog In) and a PC.
The cost of the main unit, which consists of motors and driver circuit, sensor and signal conditioning circuitry, wide-spectrum lamps, color filters and power stages, is around US$180. The cost of the USB module used in the setup is around US$1000. However, there is no technical necessity to use such module. The system can easily adapted to work with another data acquisition modules having LabVIEW support such as Raspberry Pi 2/3. The spectrophotometer that was used to test the reliability of PS, the Beckman DU 530, has a wider measurement range from 190 to 1100 nm. In addition, it can store up to 100 measurement results in the internal memory. It can be connected to the computer over RS 232 serial port. The cost of this system is US$1850. However, even if the range is limited, due to its PC connection capability and the software support, memory limitation problem has been removed. Currently used PC controllable spectrophotometers cost was higher than the system proposed here.
The software part of the study contains a user interface developed in LabVIEW to monitor, present and analyze the measurement results, and most importantly, to control the hardware located in the main unit. During the development of the program, LabVIEW was preferred for its capability in control functions and its characteristics as a graphical-based programming language. The front panel image of the interface program can be seen in Figure 3. All controls can be performed by pressing the relevant buttons on the interface. In this way, current position and waveform of the filter, raw voltage values acquired from the photodetector and the values obtained from conversion calculations can be monitored graphically.
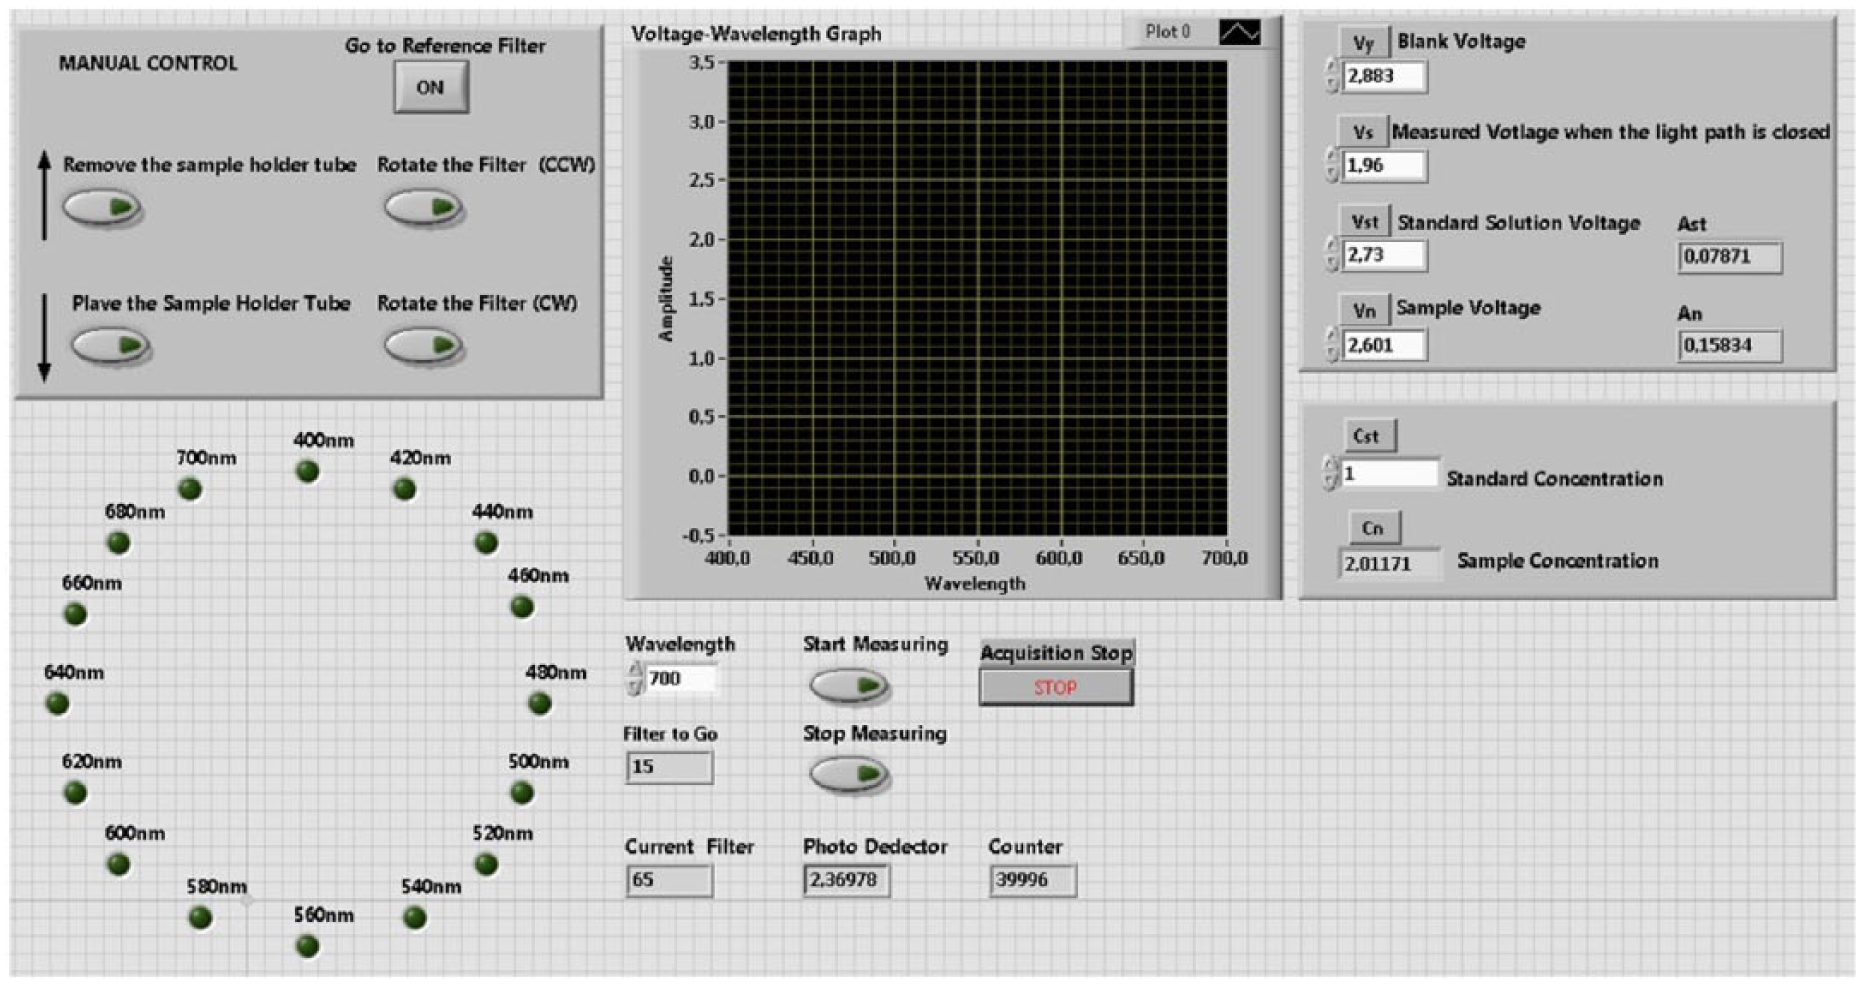
User interface.
The filter’s current position information is compared with the value entered through the interface to query whether the filter controller has reached the desired position. If it has reached the required position, the photodetector analog input information is acquired followed by necessary calculations to obtain the absorption value of the relevant waveform; this value is then stored in a file. At the same time, it is possible to monitor the waveform absorption graphic through the interface in real time. All programming operations were performed in LabVIEW graphical development platform with the support of subVIs called PDaqMain, PDaqIOWrite and PDaqIORead offered by the manufacturing company. All processes included in the program are shown in the flowchart given in Figure 4.
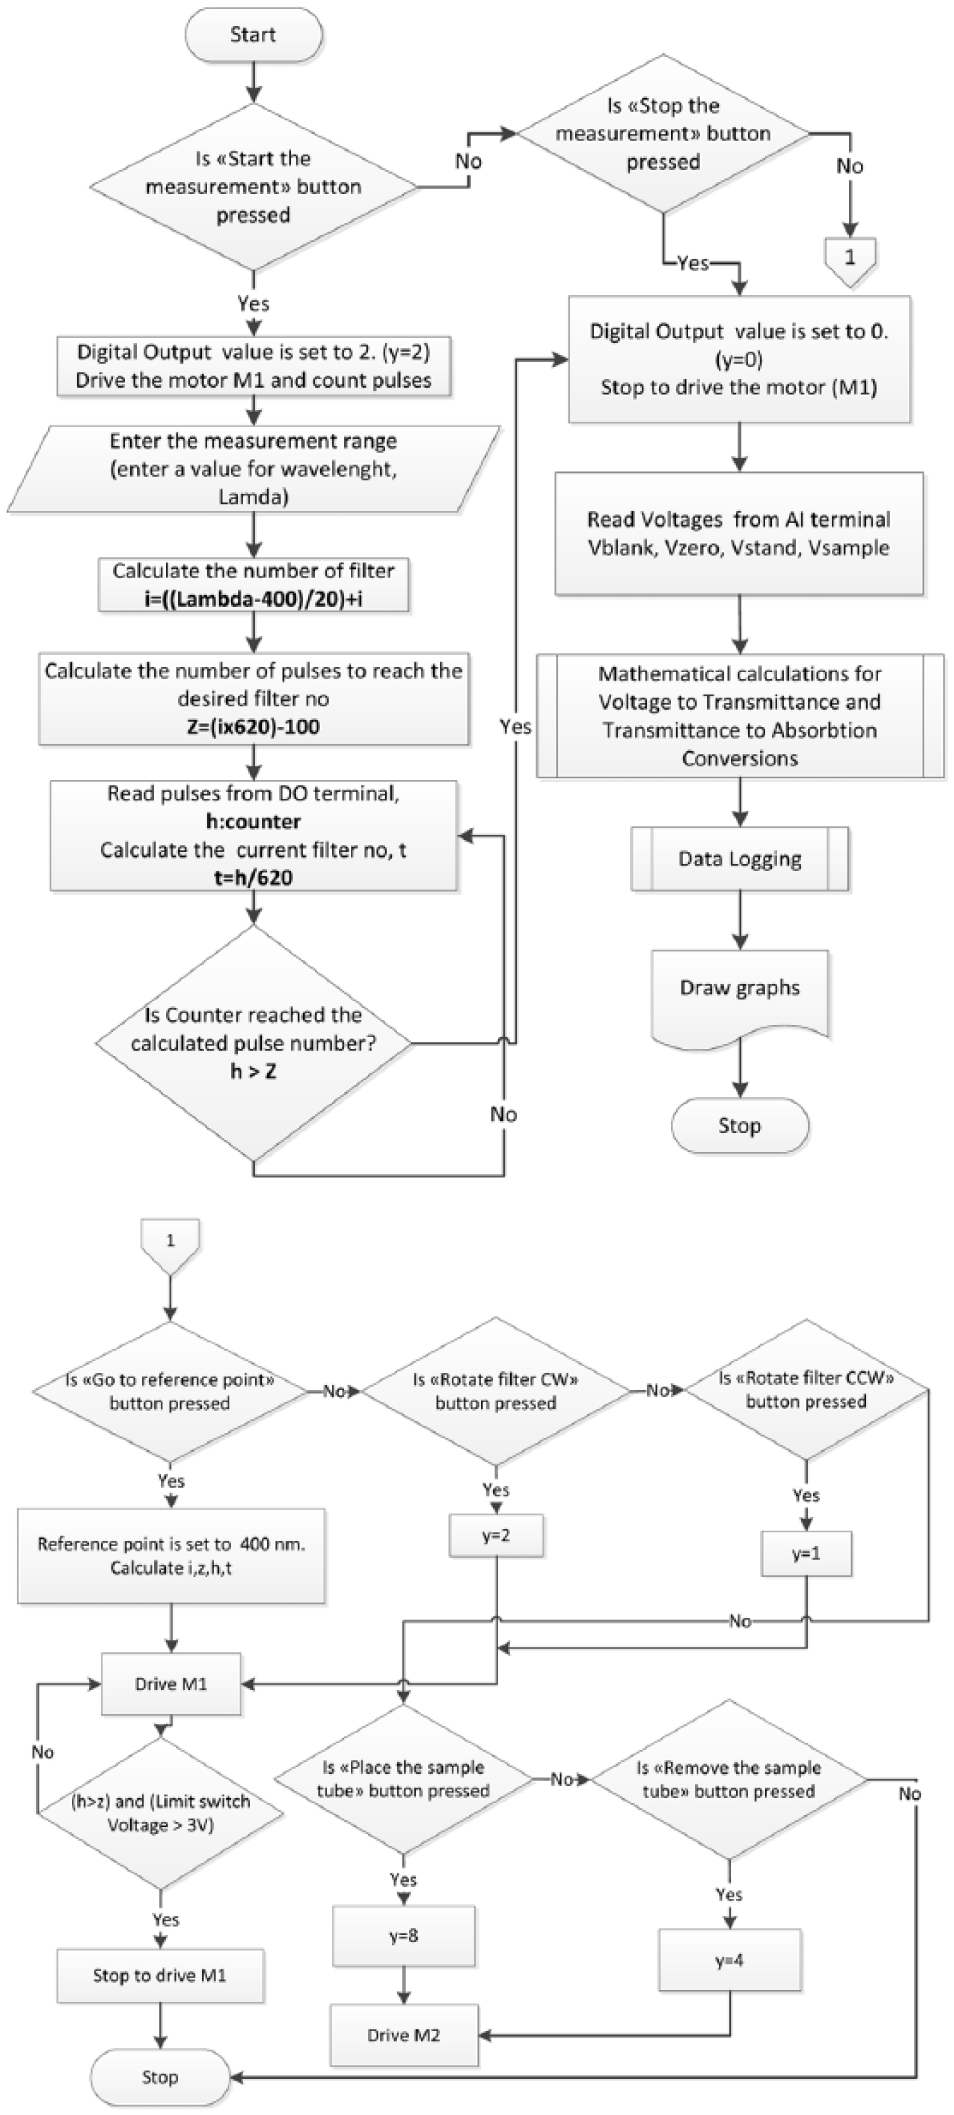
Flowchart of virtual instrumentation–based controls of spectrophotometer setup.
Experimental results
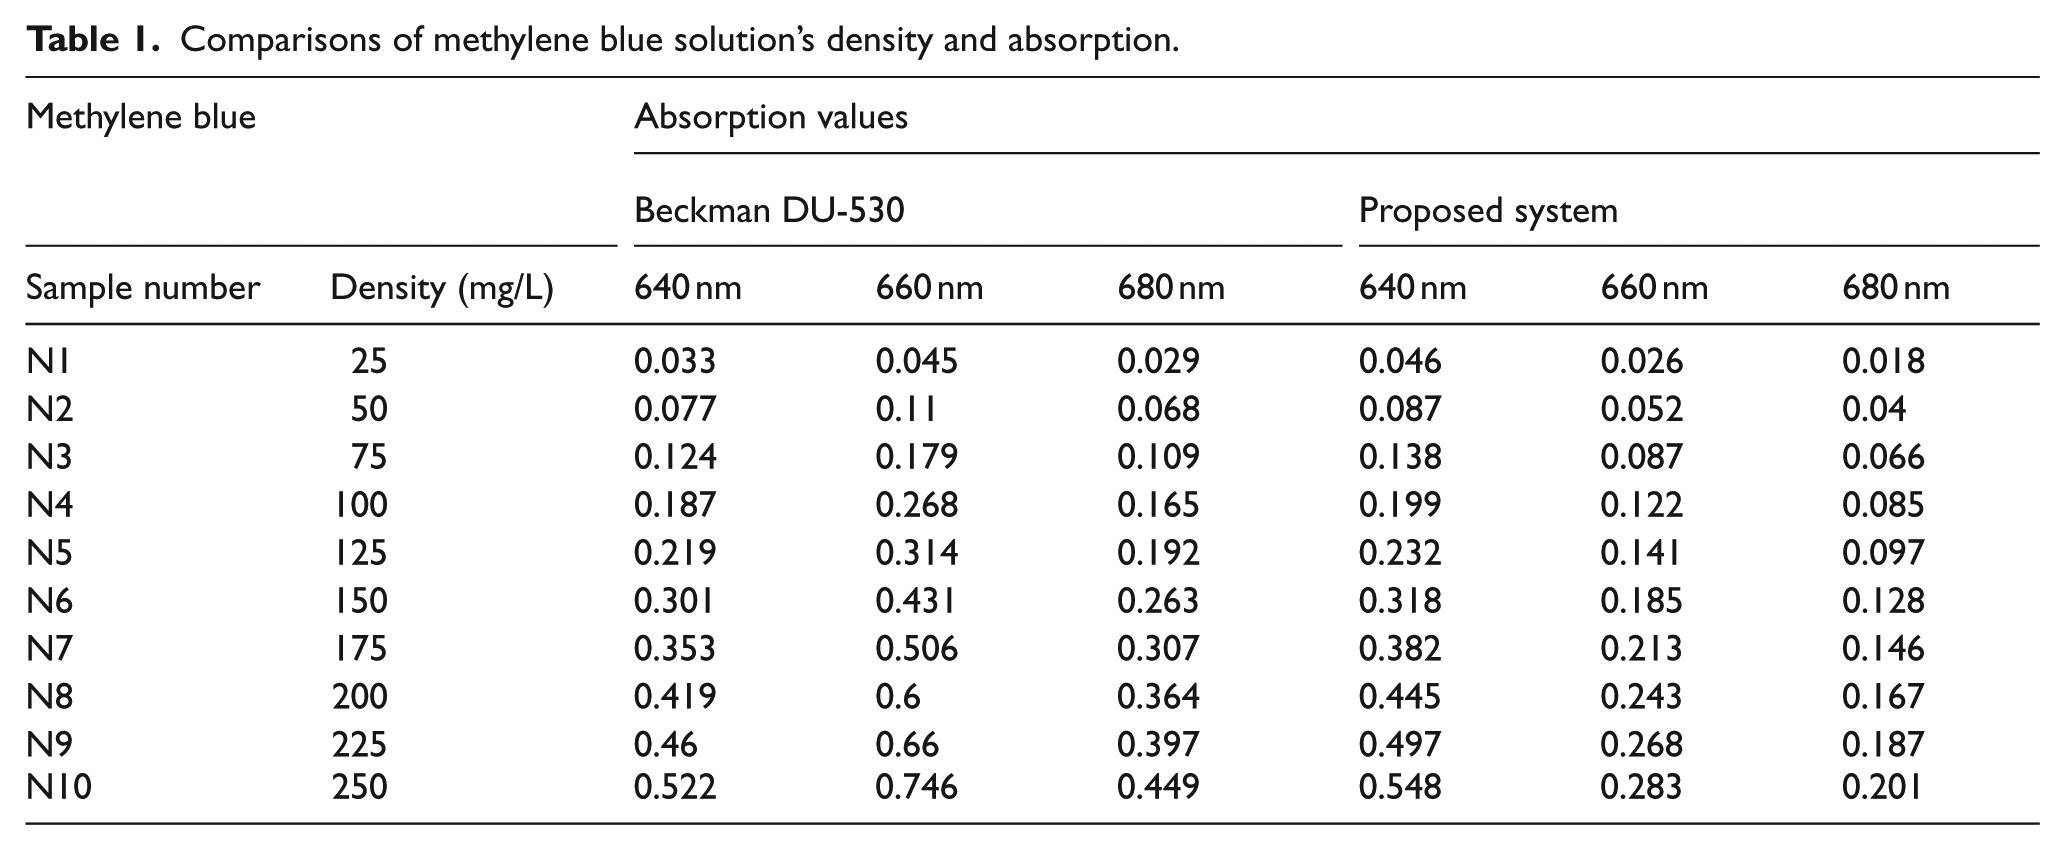
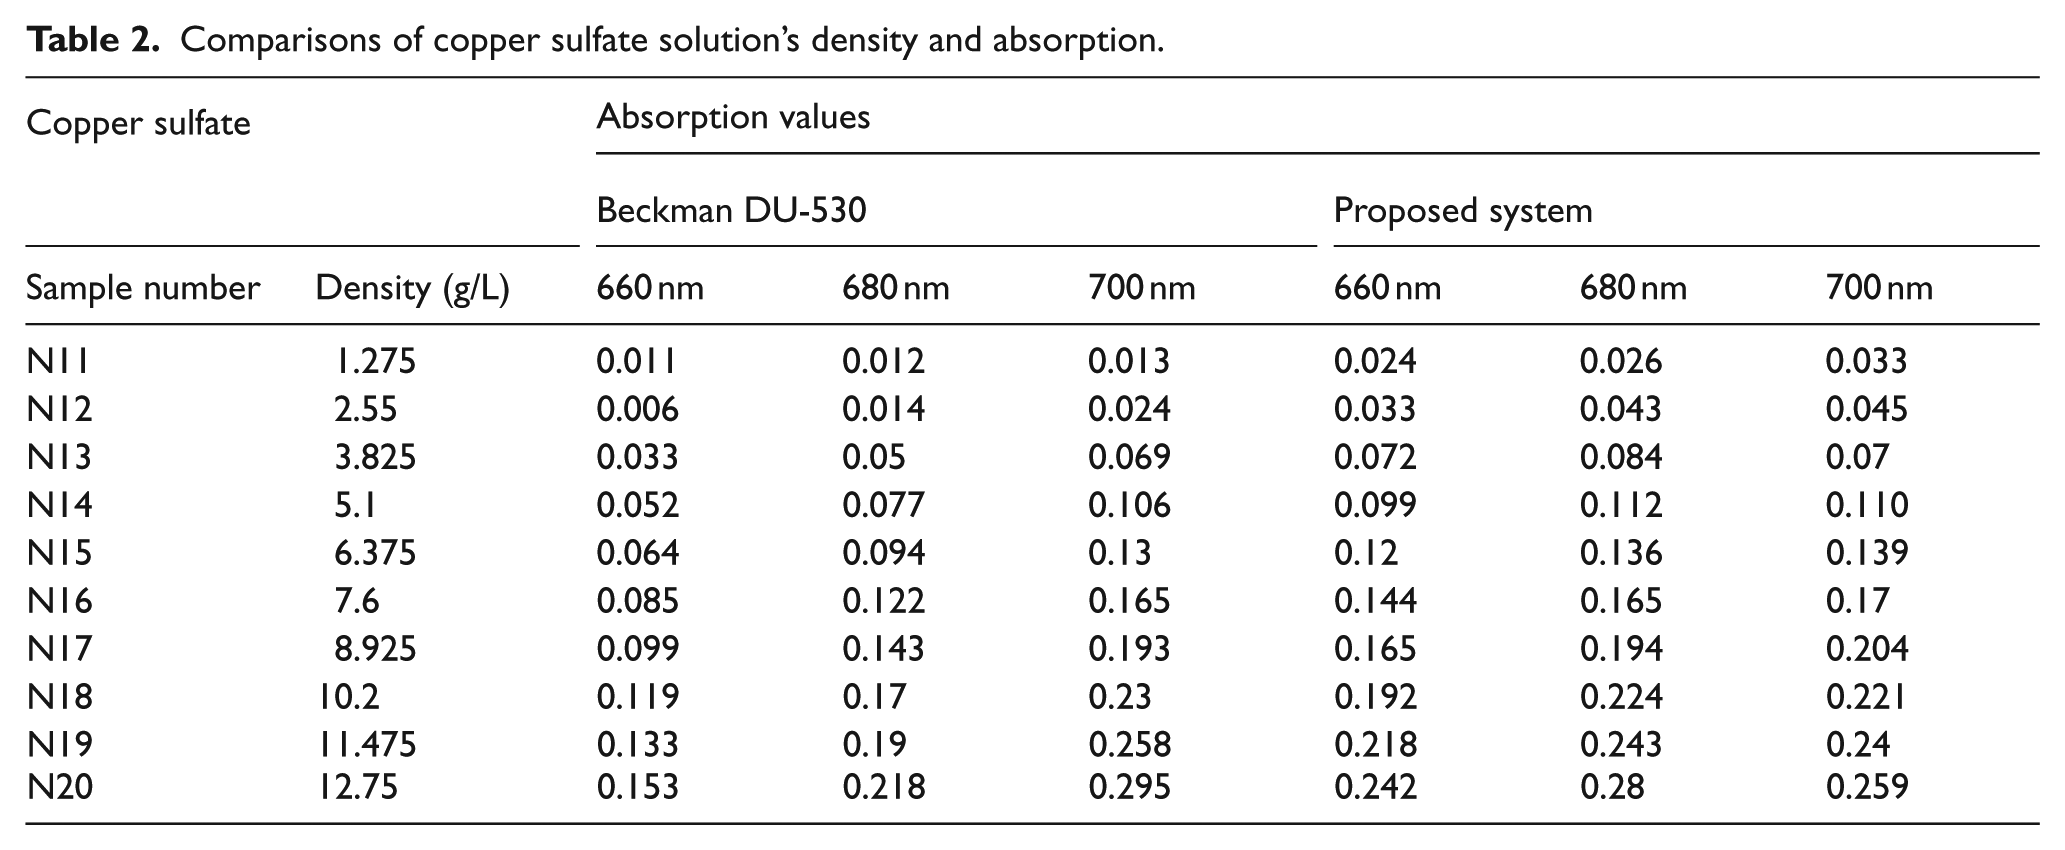
In this part, the measurement results obtained from a Beckman Coulter DU-530 device and the proposed system (PS) were compared for 10 different methylene blue and copper sulfate solutions. Although the designed device has the capability of measuring between 400 and 700 nm, it has been understood that the photodetector circuit has high sensitivity at 640–680 nm for methylene blue and 660–700 nm for copper sulfate in the preliminary tests. Outside of these range, the response of the samples is very low. That is why, the active range varies for different solutions. Determining the appropriate range for the solution used in the measurements, the accuracy and reliability of the system were increased. For measurements, the solutions were prepared with a 100–1000 μL automatic adjusted pipette with identical intervals. The tolerance of the automatic pipette was 0.2%. The densities of the prepared solution, their sample numbers and the absorption values measured for waveforms are given in Tables 1 and 2.
Comparisons of methylene blue solution’s density and absorption.
Comparisons of copper sulfate solution’s density and absorption.
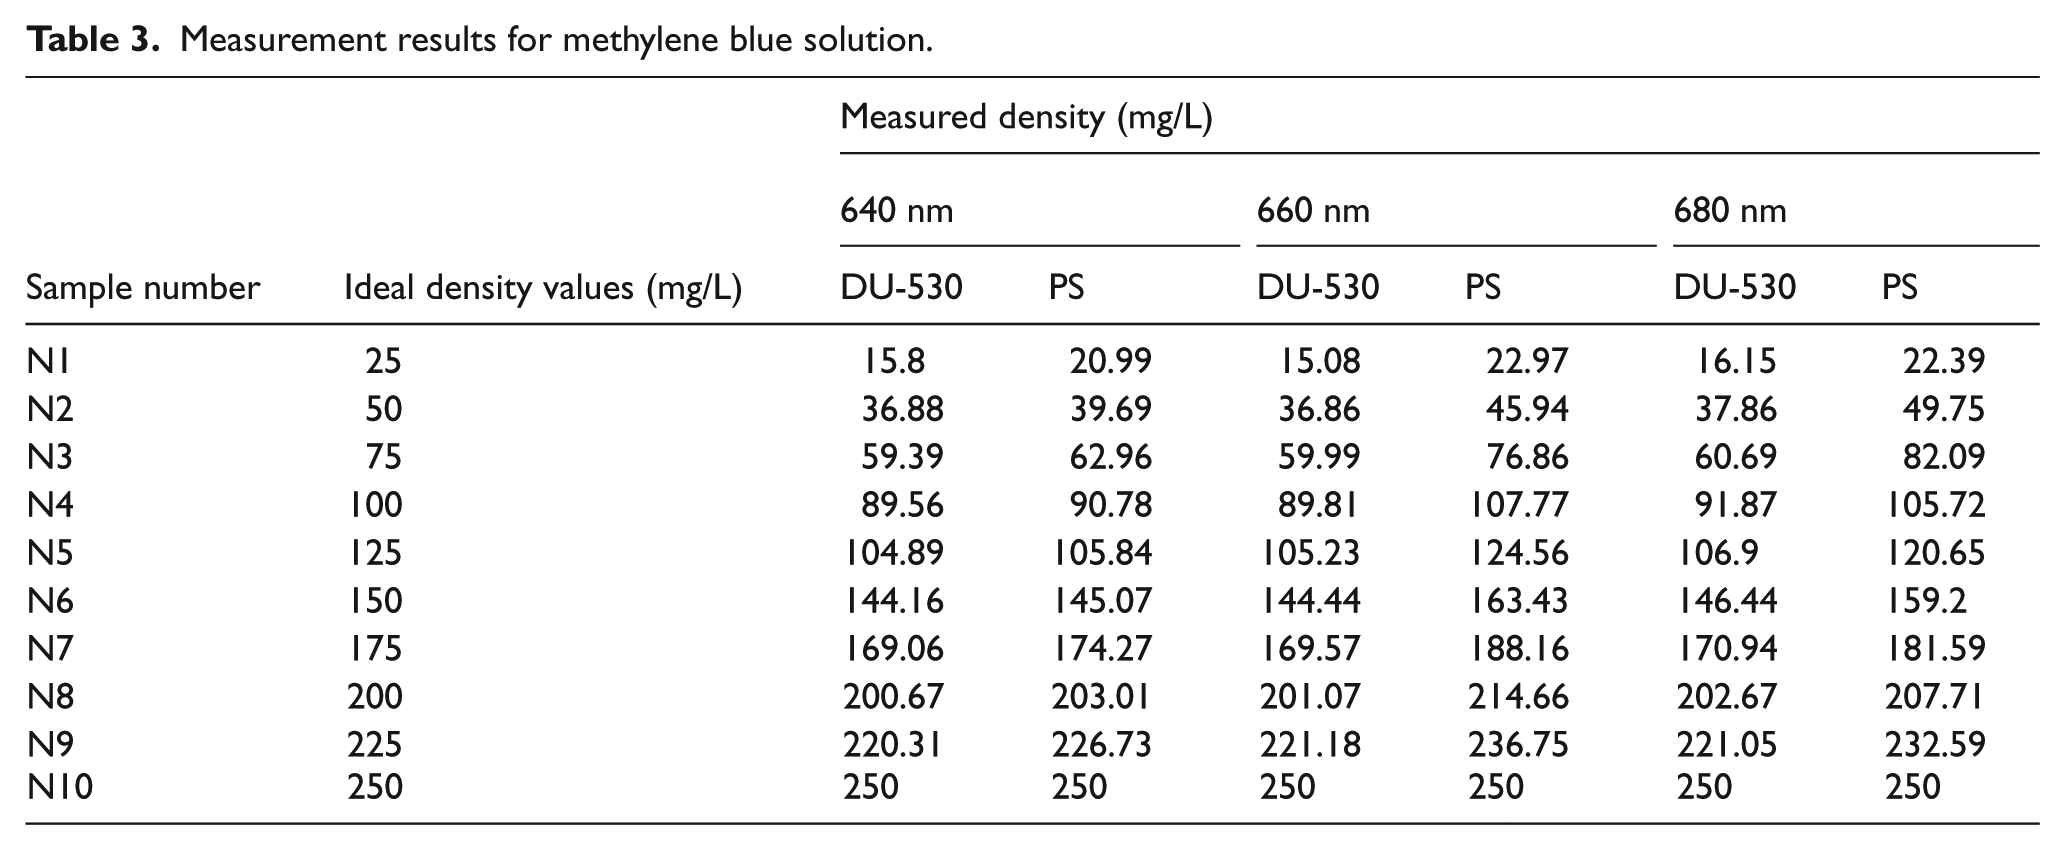
By using the data in Tables 1 and 2, density values of all samples are calculated. For these calculations, the densest solutions, N10 and N20, were used as standard. The calculated and ideal values were calculated based on waveforms and given in Tables 3 and 4.
Measurement results for methylene blue solution.
Measurement results for copper sulfate.
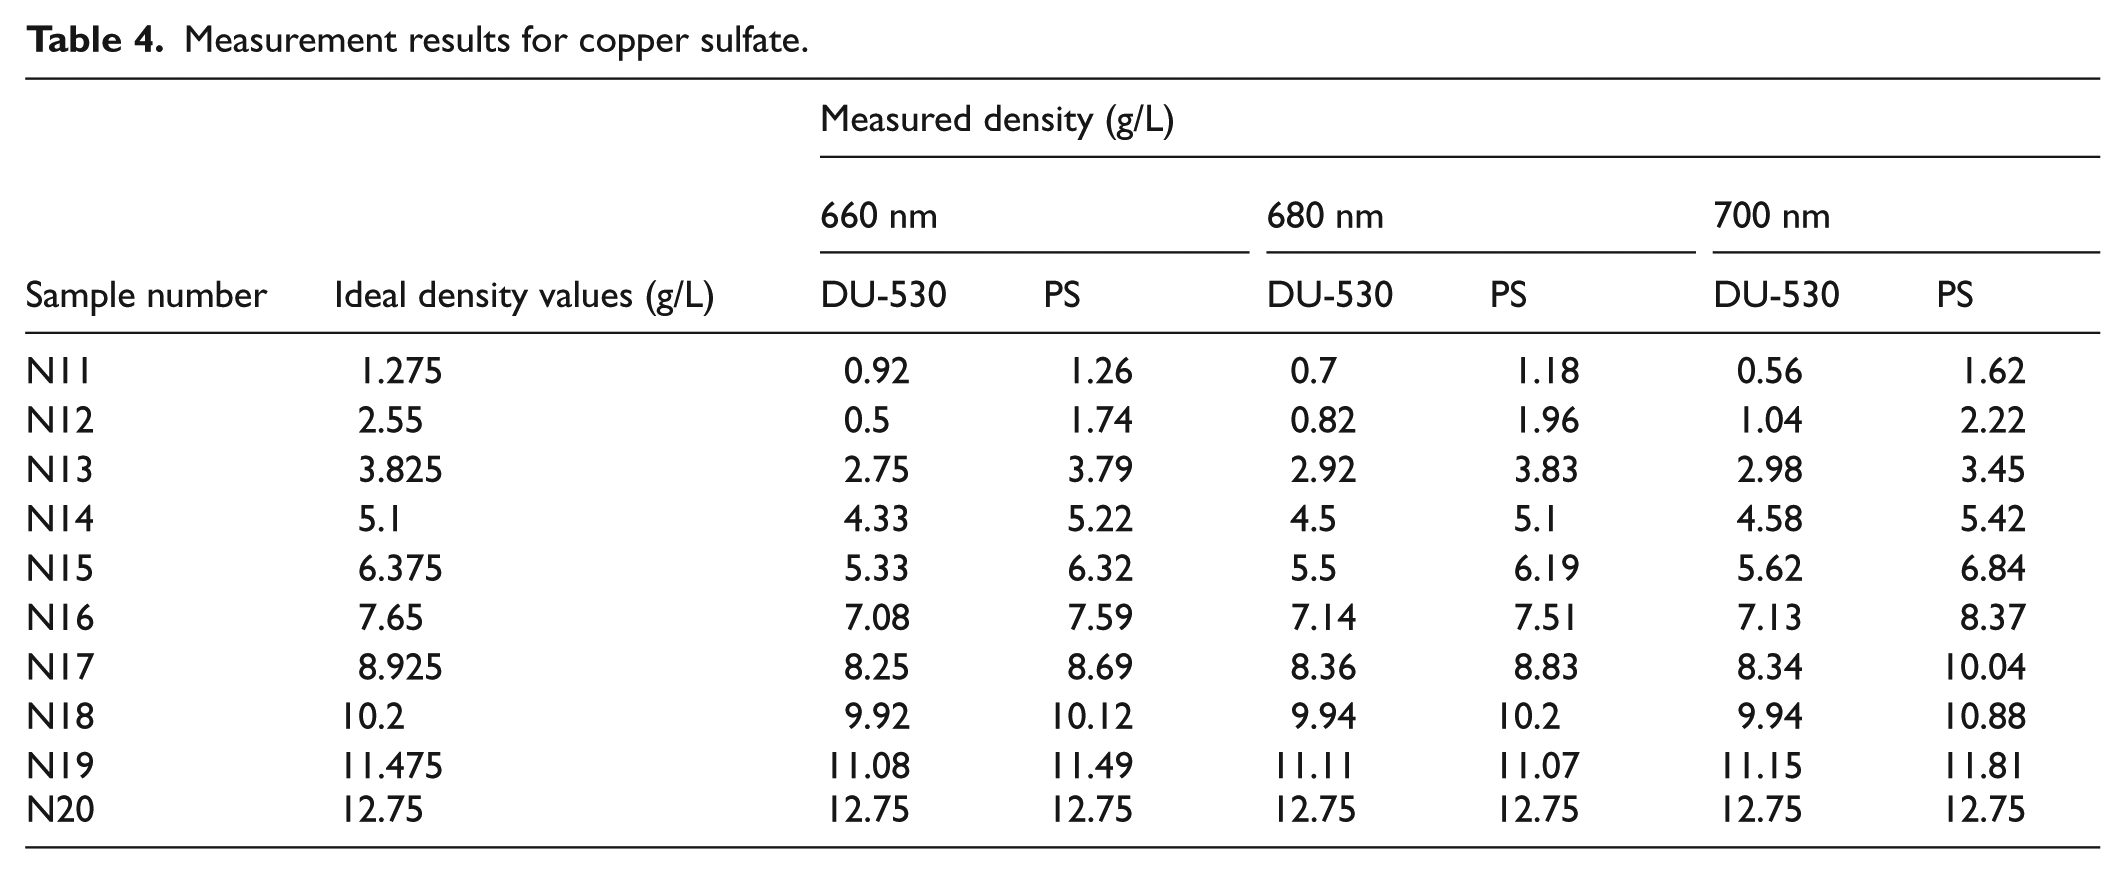
Based on the experiment results, we can conclude that measurement results obtained from Beckman Coulter DU-530 device and the PS are consistent with each other. When measuring low-density solutions, the error rates increase due to low absorption values.
Nonlinearity error rate percentages based on the data in Tables 3 and 4 can be seen in Figures 5 and 6. In all graphs, vertical axis indicates the density either as milligram/liter for methylene blue or gram/liter for copper sulfate, while horizontal axis indicates the sample numbers (1 stands for N1 and so on).
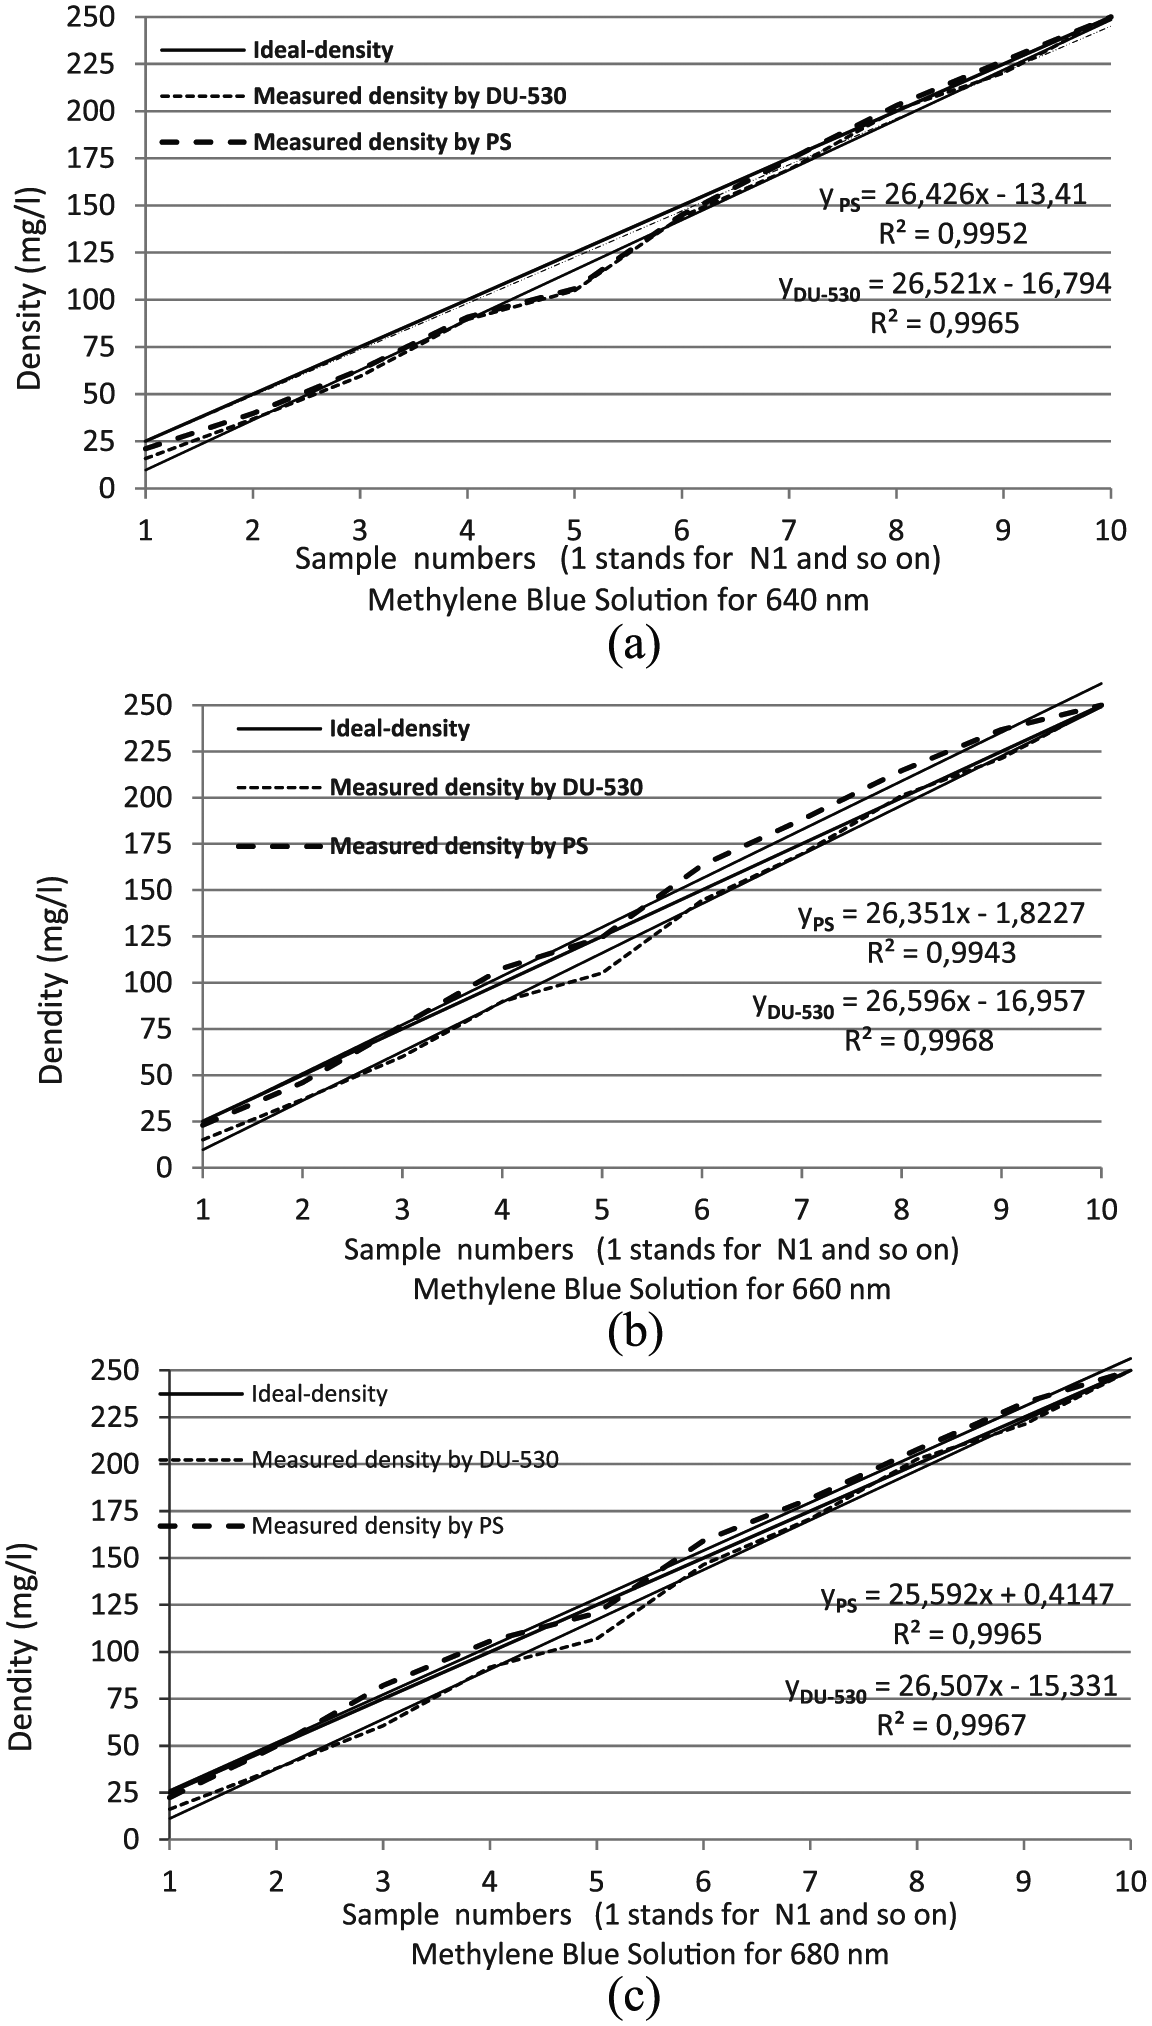
Comparison graphs for methylene blue solution: (a) 640 nm, (b) 660 nm and (c) 680 nm.
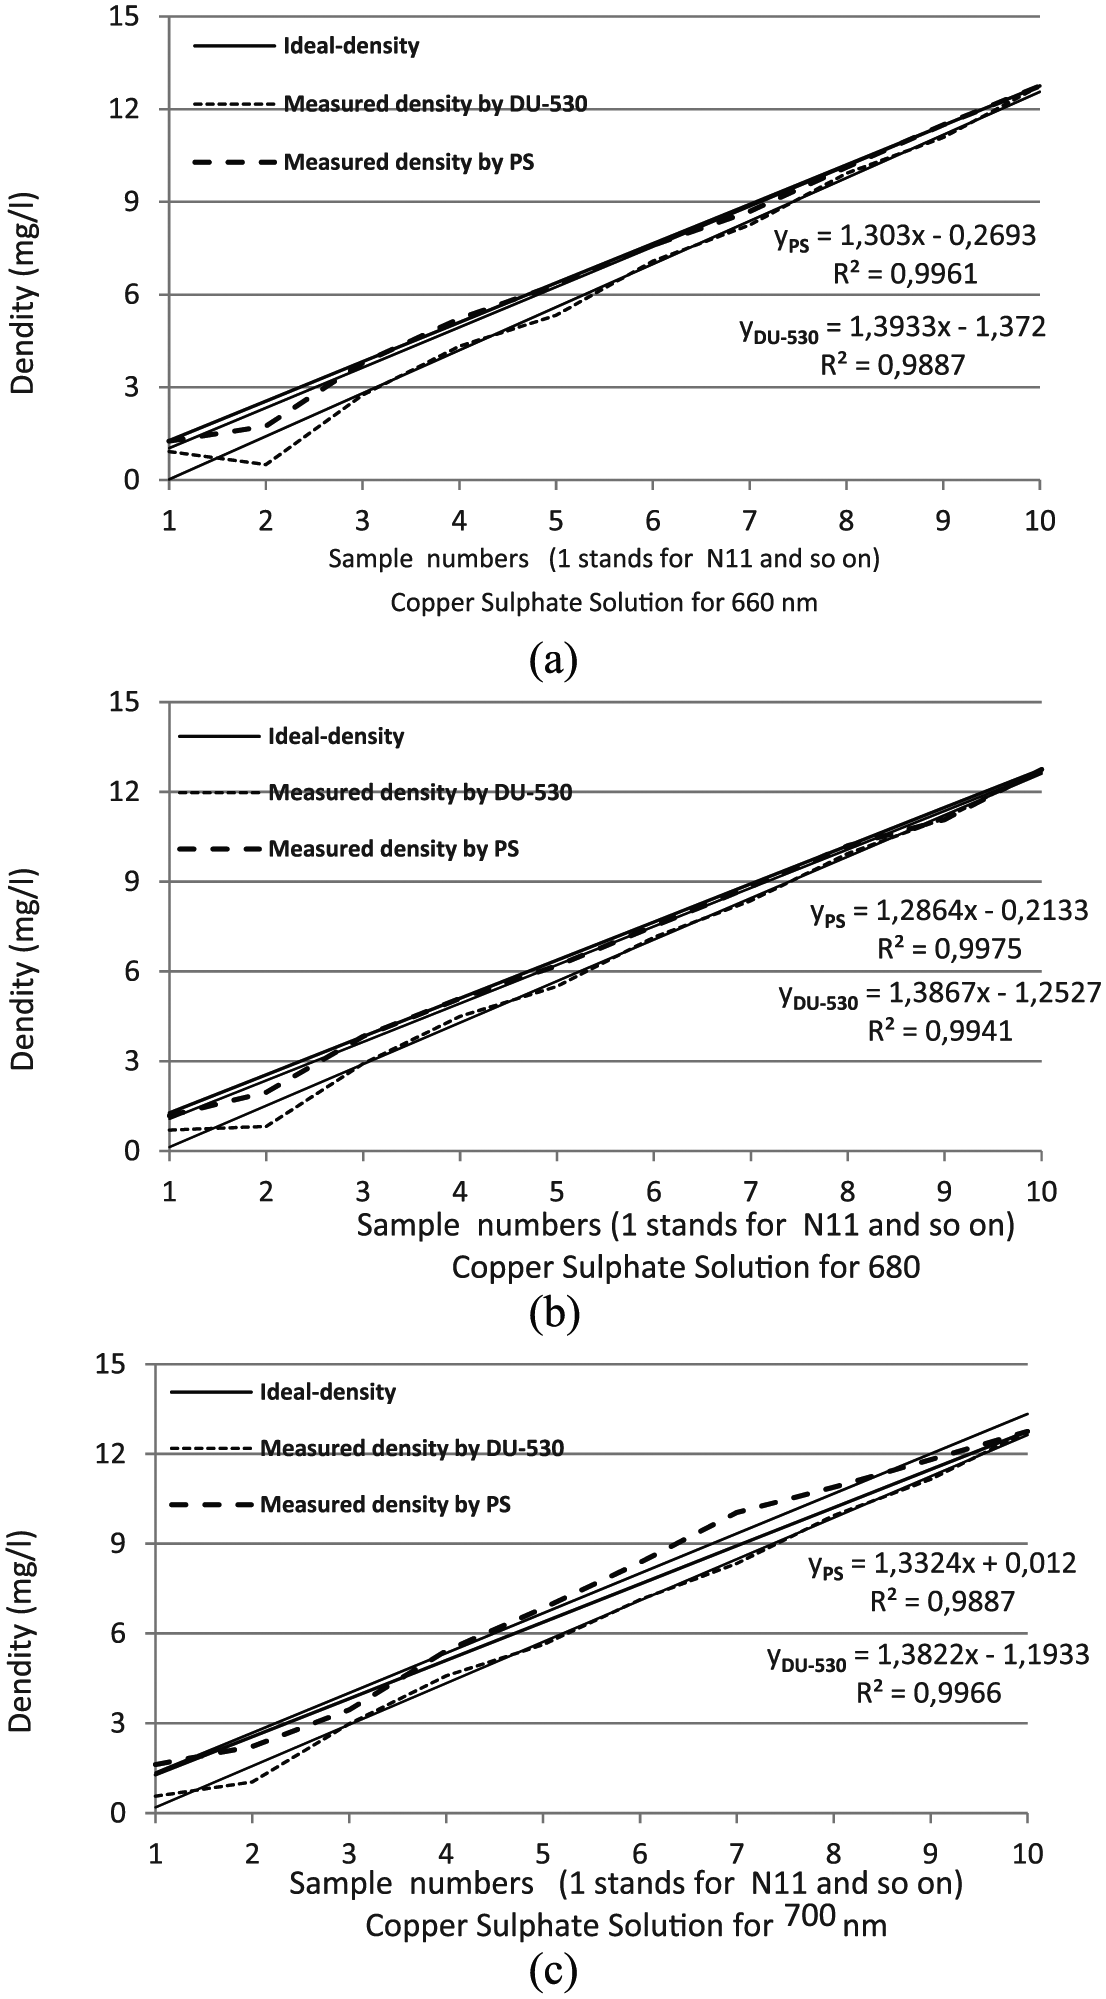
Comparison graphs for copper sulfate solution: (a) 660 nm, (b) 680 nm and (c) 700 nm.
The nonlinearity percentage values obtained from different waveforms are shown in Figure 7. Nonlinearity values are calculated by using Equation (6)

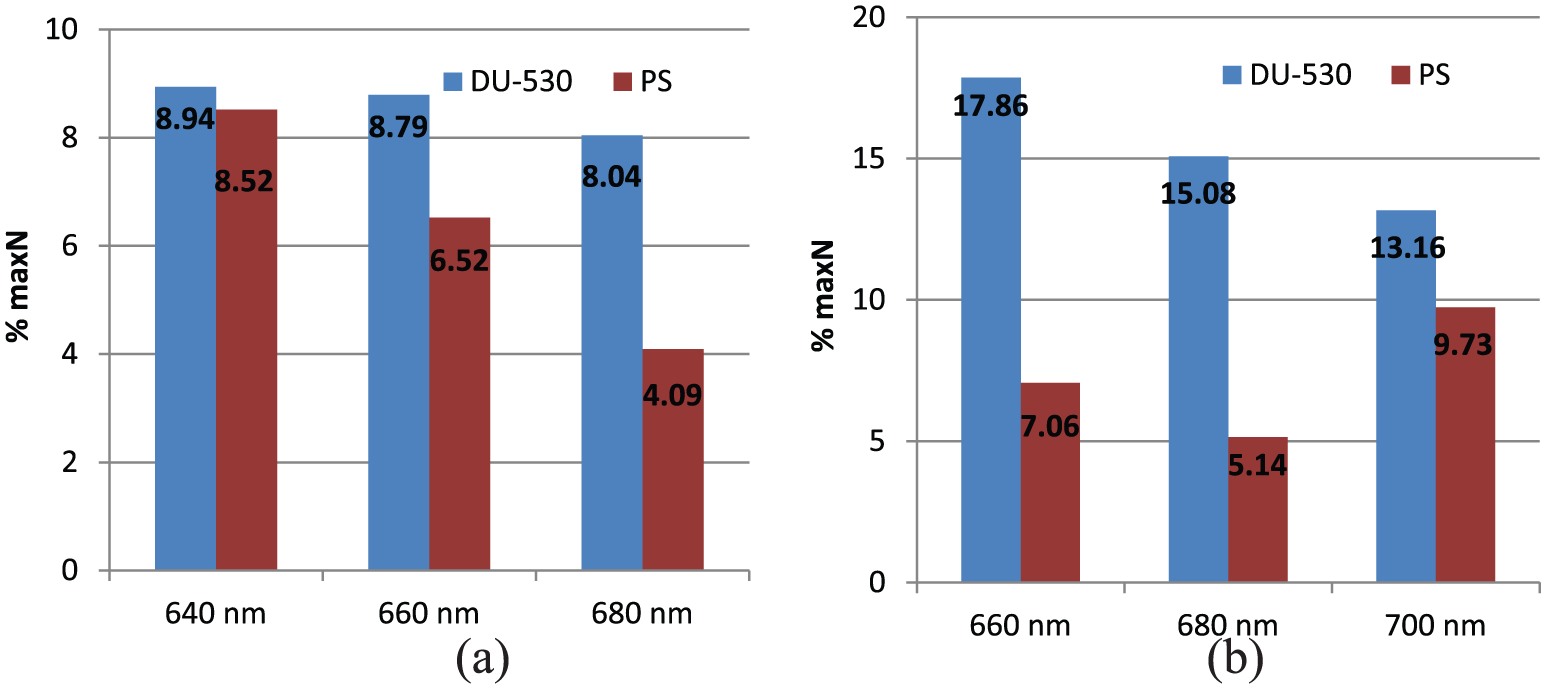
Comparison of nonlinearity percentages between DU-530 and proposed system: (a) for methylene blue solution and (b) for copper sulfate solution.
here, max N% indicates the maximum nonlinearity as a percentage, N is the largest difference between the ideal and the measured values, and Omax–Omin shows the difference between the expected largest and the smallest measurement value at the output.
The error rate of the PS for methylene blue solution is found to be lower than the results obtained from Beckman Coulter DU-530 device as can be seen from Figure 7(a). Figure 7(b) shows the error rates for copper sulfate solution. In the graphs, vertical axis indicates the nonlinearity percentages. Here, the proposed system achieves a lower nonlinearity error rates.
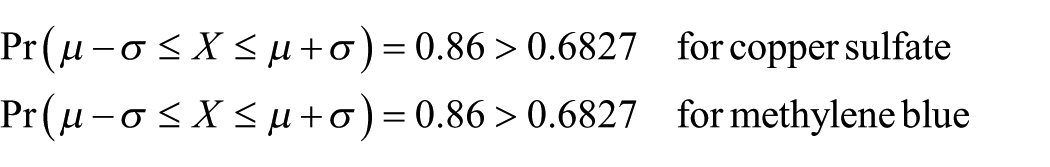
Additionally, a statistical analysis was conducted. Repeatability shows the closeness of the values between acquired data for the same input carried out under the same conditions. To learn how the PS was reliable, a series of measurements were carried out. Measurements were repetead 50 times for copper sulfate of 12.75 gram/liter density and 43 times for methylene blue solutions of 0.003% density at the wavelength of 660 nm as shown in Figures 8 and 9, respectively. The Gaussian (normal) distribution functions obtained from this set of voltages satisfy three sigma rule. This rule states that 68.27%, 95.45% and 99.73% of the measured values must lie within 1, 2 and 3 standard deviations of the mean, respectively.
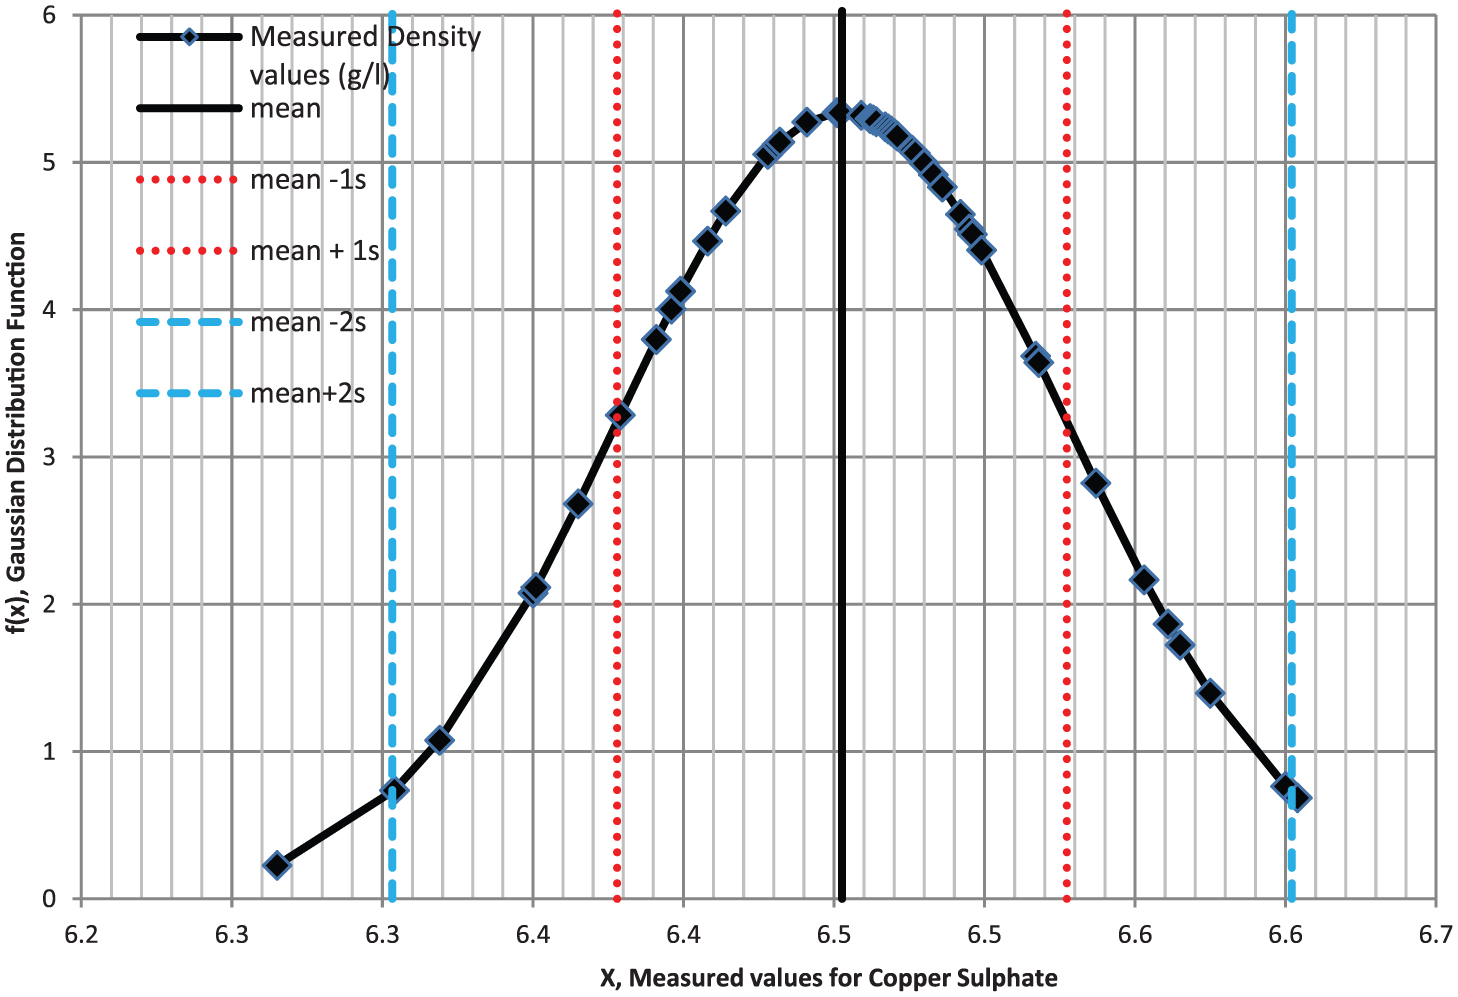
Gaussian distribution function for copper sulfate solution.
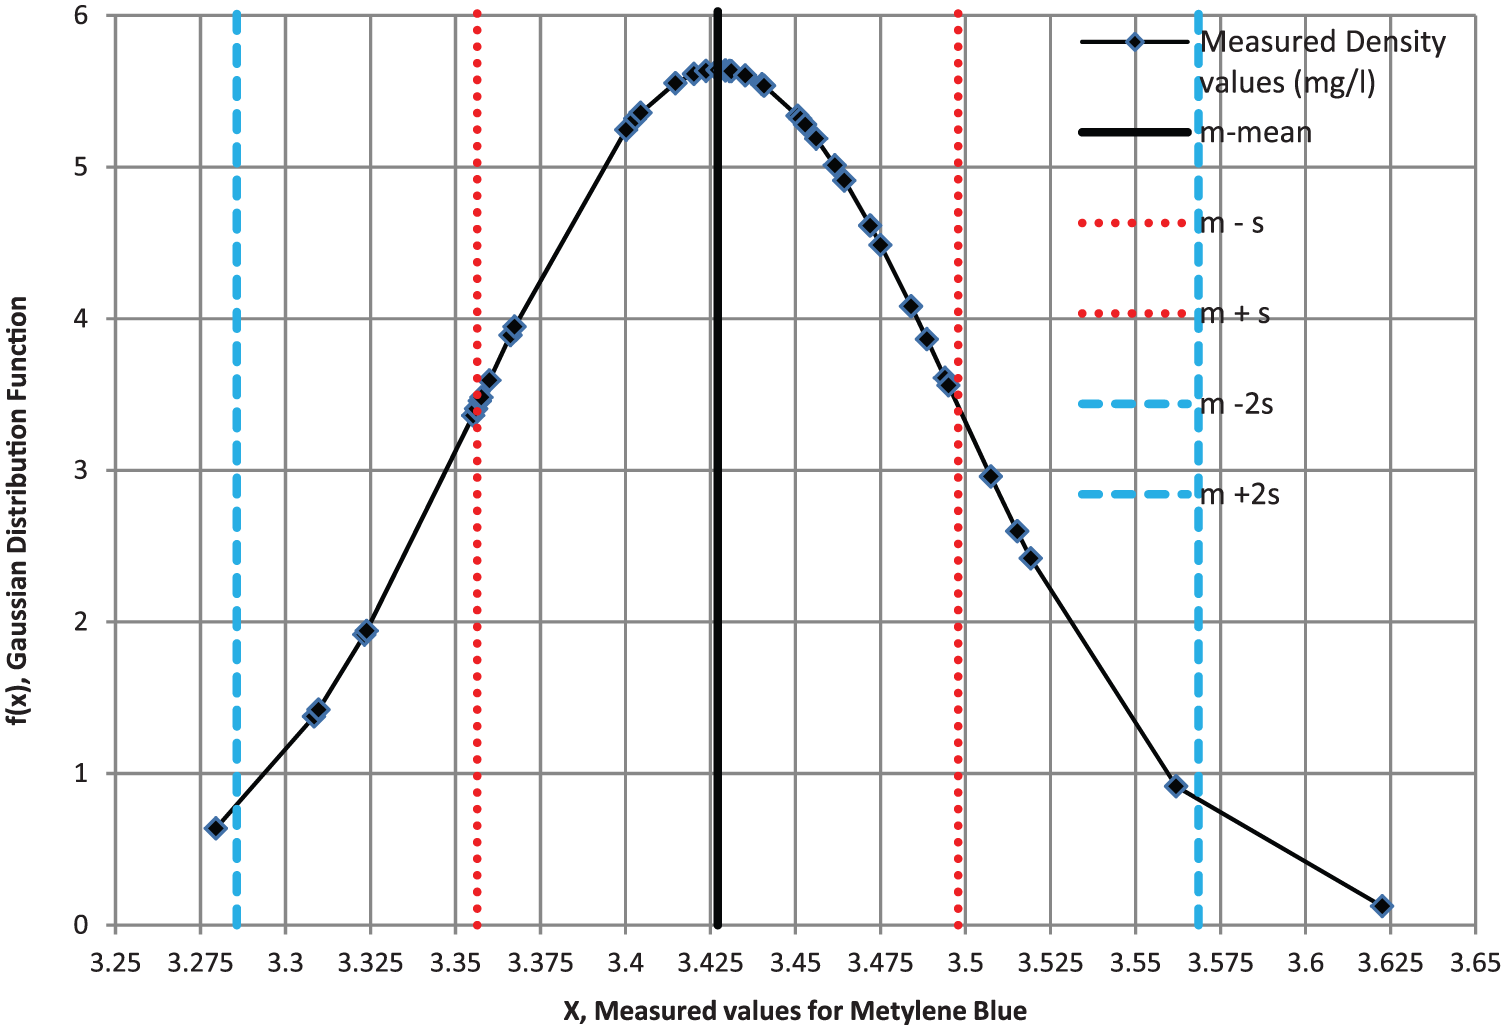
Gaussian distribution function for methylene blue solution.
After evaluations of the results, it can be seen that about 87% and 98% of the total number of measurement lies within 1 and 2 standard deviations of the mean, respectively. As a result, we can say that the reliability of the proposed system is high enough
Conclusion
By using a modular, computer-controlled spectrophotometer with a user interface, it is possible to measure the density value of any material in a sample solution. The results of experiments conducted with methylene blue and copper sulfate samples in the visible range show that the PS achieves lower nonlinearity error rates.
This study focuses on designing a portable, modular, computer-controlled and low-cost device for educational purposes rather than designing a high-accuracy device for all kinds of samples. PS was designed to measure the densities of the predetermined samples. Calibrating the system according to the solution used increases the accuracy and reliability. In this study, the calibration process can be described as determining the wavelength interval that the sample shows a relatively high sensitivity compared with the entire range. For this reason, accuracy and reliability characteristics of the PS were obtained higher for only defined range.
As can be seen from the graphs, the measurement results are very close to the ideal response. The closeness to 1 of R2 value shows how well the measurements fit the ideal ones. From the graphs, it can be seen that R2 is equal to 0.9887 in the worst case both of two sample solutions (R2 = 0.9953 for copper sulfate and R2 = 0.9941 for methylene blue). As a result, it can be said that measurement results perfectly fit with the actual ones.
In addition, the average value of Pr(µ−σ ⩽ X ⩽ µ + σ) was 0.87 for both solutions. This indicates that the reliability of the measurement setup is high enough.
Footnotes
Declaration of conflicting interests
The author(s) declared no potential conflicts of interest with respect to the research, authorship and/or publication of this article.
Funding
The author(s) received no financial support for the research, authorship and/or publication of this article.