
Abstract
In practice, the products can be manufactured through several stages. In this manuscript, we will propose an attribute control chart plotting the number of defectives for a two-stage process. The in-control average run length is derived and the out-of-control average run lengths are also analyzed according to the process shifts in the first and/or the second stage process. The tables of the average run lengths are given for various specified parameters. An example is given with synthetic data for the illustration of the proposed control chart.
Introduction
Control charts have been considered as a powerful tool in any industry for the improvement of product quality. A control chart constructs lower and upper control limits and plots a suitable statistic at each subgroup. The process is declared as out of control if the plotting statistic is beyond the control limits. The early detection of an out-of-control, if any, is very important to minimize the nonconforming products. It will be also important for a control chart to minimize the type-I error (the probability of declaring the process as out of control when it is actually in control) and type-II error (the chance of declaring the process as in control when it is actually out of control). Basically, control charts are classified as (1) attribute control charts and (2) variable control charts. The former is used when the quality characteristic is obtained from a process of categorizing a product as conforming or nonconforming. The latter is used when the quality of interest is obtained from the measurement process, such as the measurement of diameter of a ball bearing. Both control charts have been widely used in the industry for the improvement of quality. Among variable control charts, the X bar chart is the most popular in the industry,
1
while among attribute control charts, the
Usually, attribute control charts are designed to monitor a single process. But, in the industry, there are many situations where manufacturing of the product is based on several production stages or processes. For example, in fire extinguisher manufacturing, cylinders pass through various processes before they are finally produced, as described in Duffuaa et al. 18 According to Duffuaa et al., 18 products are processed through several stages and more than one process impacts on product quality characteristics.
According to our best knowledge, the designing of a control chart for a two-stage process has not been studied before. Therefore, there have been not much works for a two-stage or a multi-stage process. In this paper, we will develop an attribute control chart plotting the numbers of defectives for a two-stage process.
Designing of proposed control chart
It is assumed that the two processes considered here are independent of each other so that the statistics obtained from two processes are statistically independent. We propose the following attribute control chart for a two-stage process:
Step 1: Select a random sample of size
Step 2: Select a random sample of size
Suppose that the fractions nonconforming at the first process and at the second process are
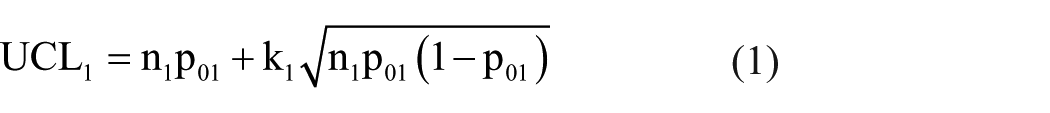
where


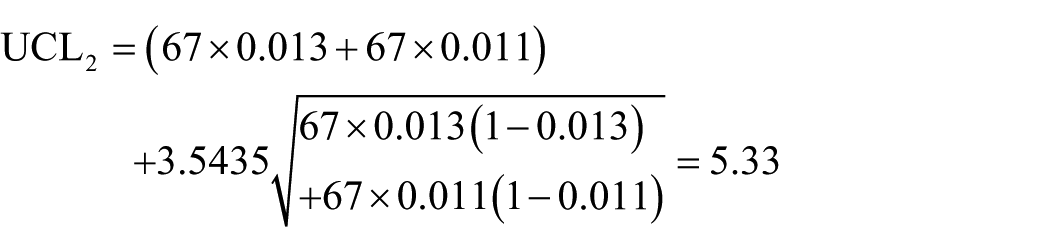
Therefore, the UCL for the combined process,
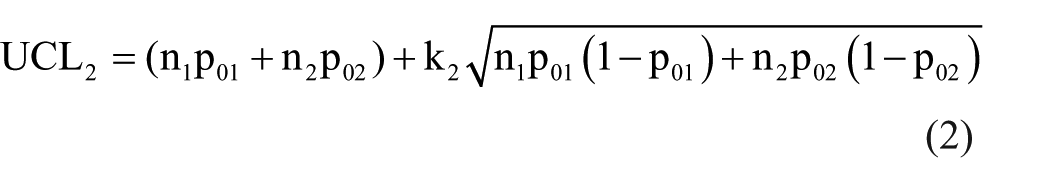
where
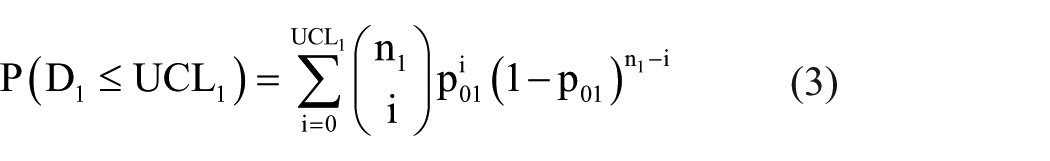
The probability of declaring as in-control for first process when it is actually in control is derived as follows
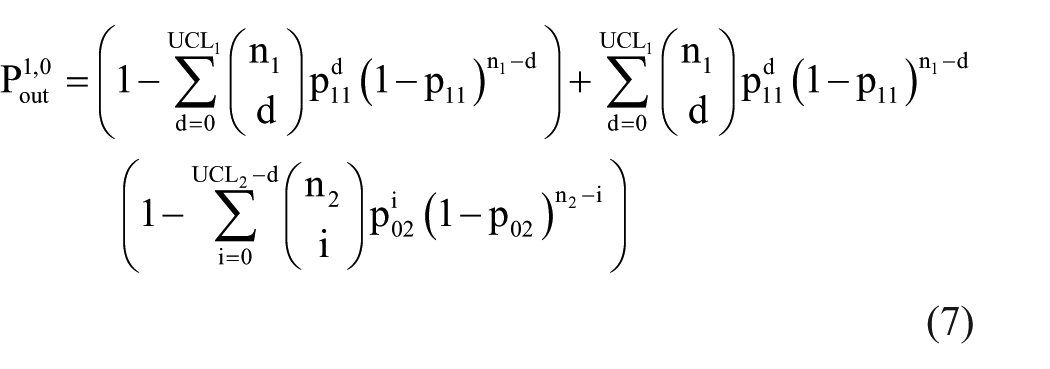
The probability of declaring as out-of-control for the two-stage process when the processes are actually in control is given by


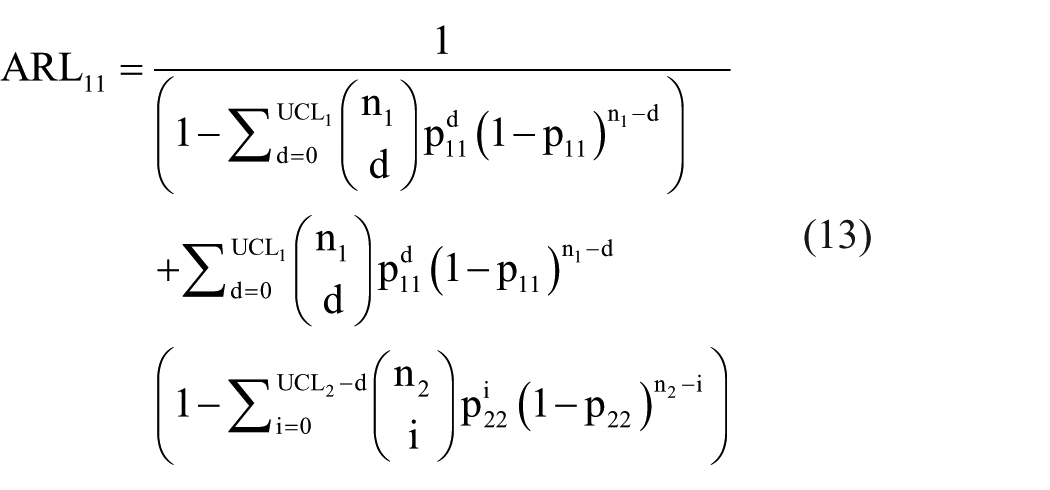
Hence, the in-control average run length (ARL) which is indication when the process will be out-of-control on average is given as follows
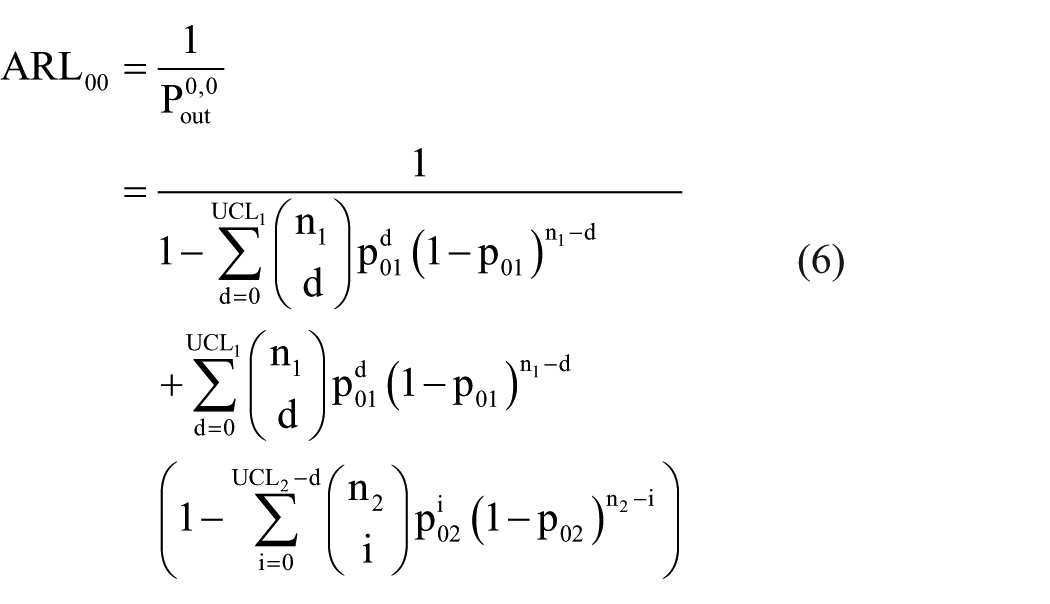
In the next sections, we will derive the out-of-control ARL when (1) just first process is shifted, (2) just second process is shifted and (3) both processes are shifted.
Just first process is shifted
Suppose that the first process has been shifted to
The probability of declaring as out of control for the shifted process is given as follows
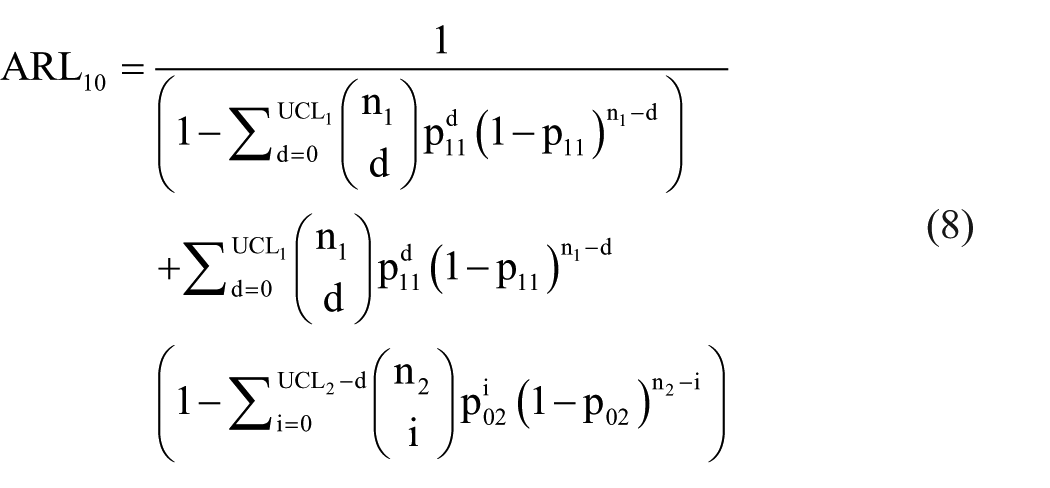
The out-of-control ARL when just the first process has shifted will be
Just second process is shifted
Now, suppose that the second process has been shifted to

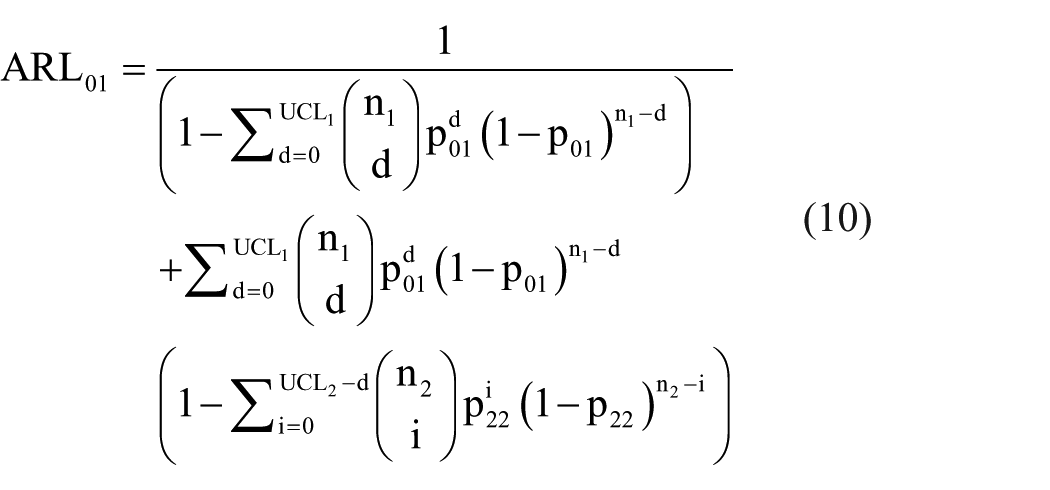
Therefore, the out-of-control ARL for this case is given by
Both processes are shifted
Now, suppose that the both processes have been shifted such as

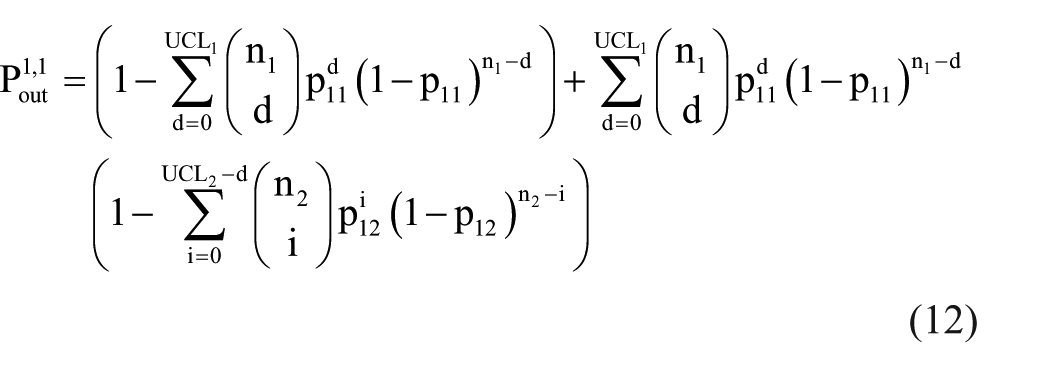
The probability of declaring as out-of-control for the two-stage process when the processes are shifted is given by
Hence, the out-of-control ARL for this case is obtained by
These out-of-control ARLs for three cases are obtained using the following procedure:
Specify values of
Determine the control coefficients
Obtain the out-of-control ARLs for various values of shift constants
To construct the tables for ARLs, we consider two cases for fractions nonconforming such as
Tables 1 and 2 show the ARLs when
The ARLs of the proposed chart with equal sample size when p01 = p02 = 0.01.
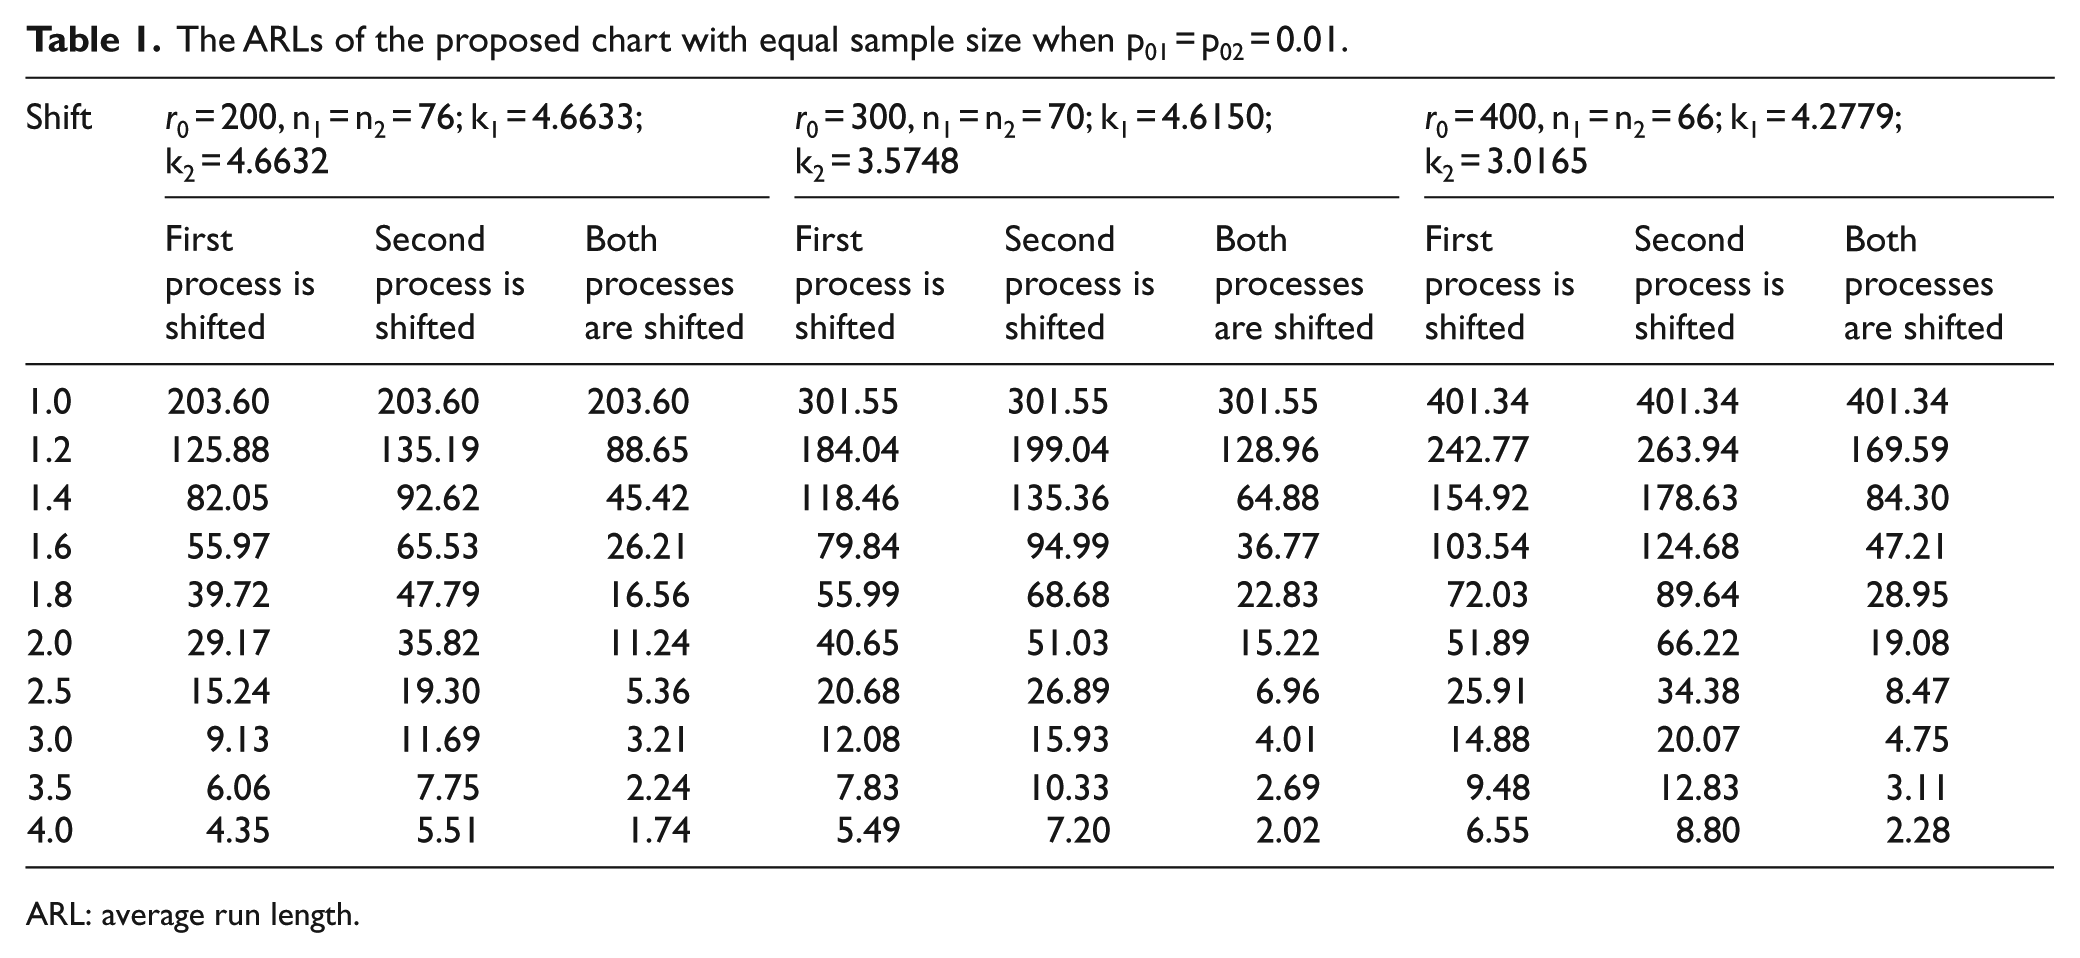
ARL: average run length.
The ARLs of the proposed chart with unequal sample size when p01 = p02 = 0.01.
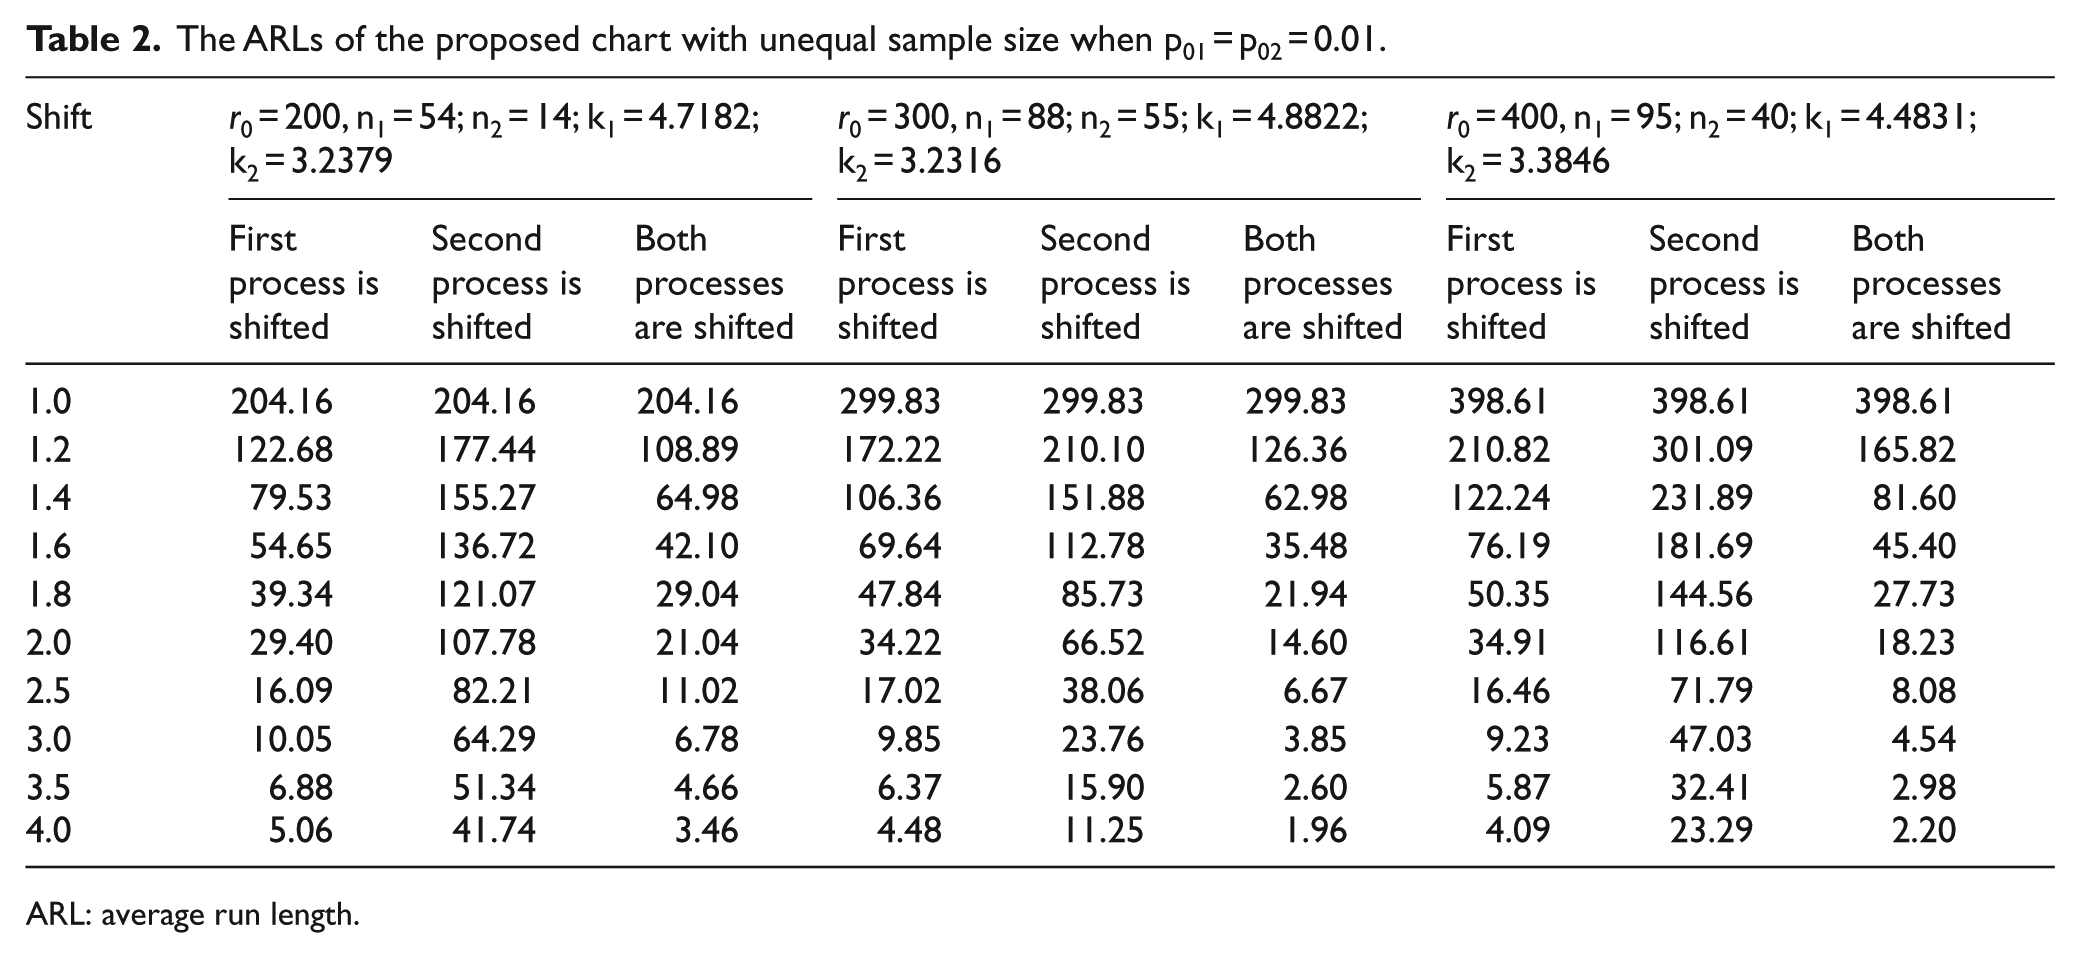
ARL: average run length.
The ARLs of the proposed chart with equal sample size when p01 = p02 = 0.05.
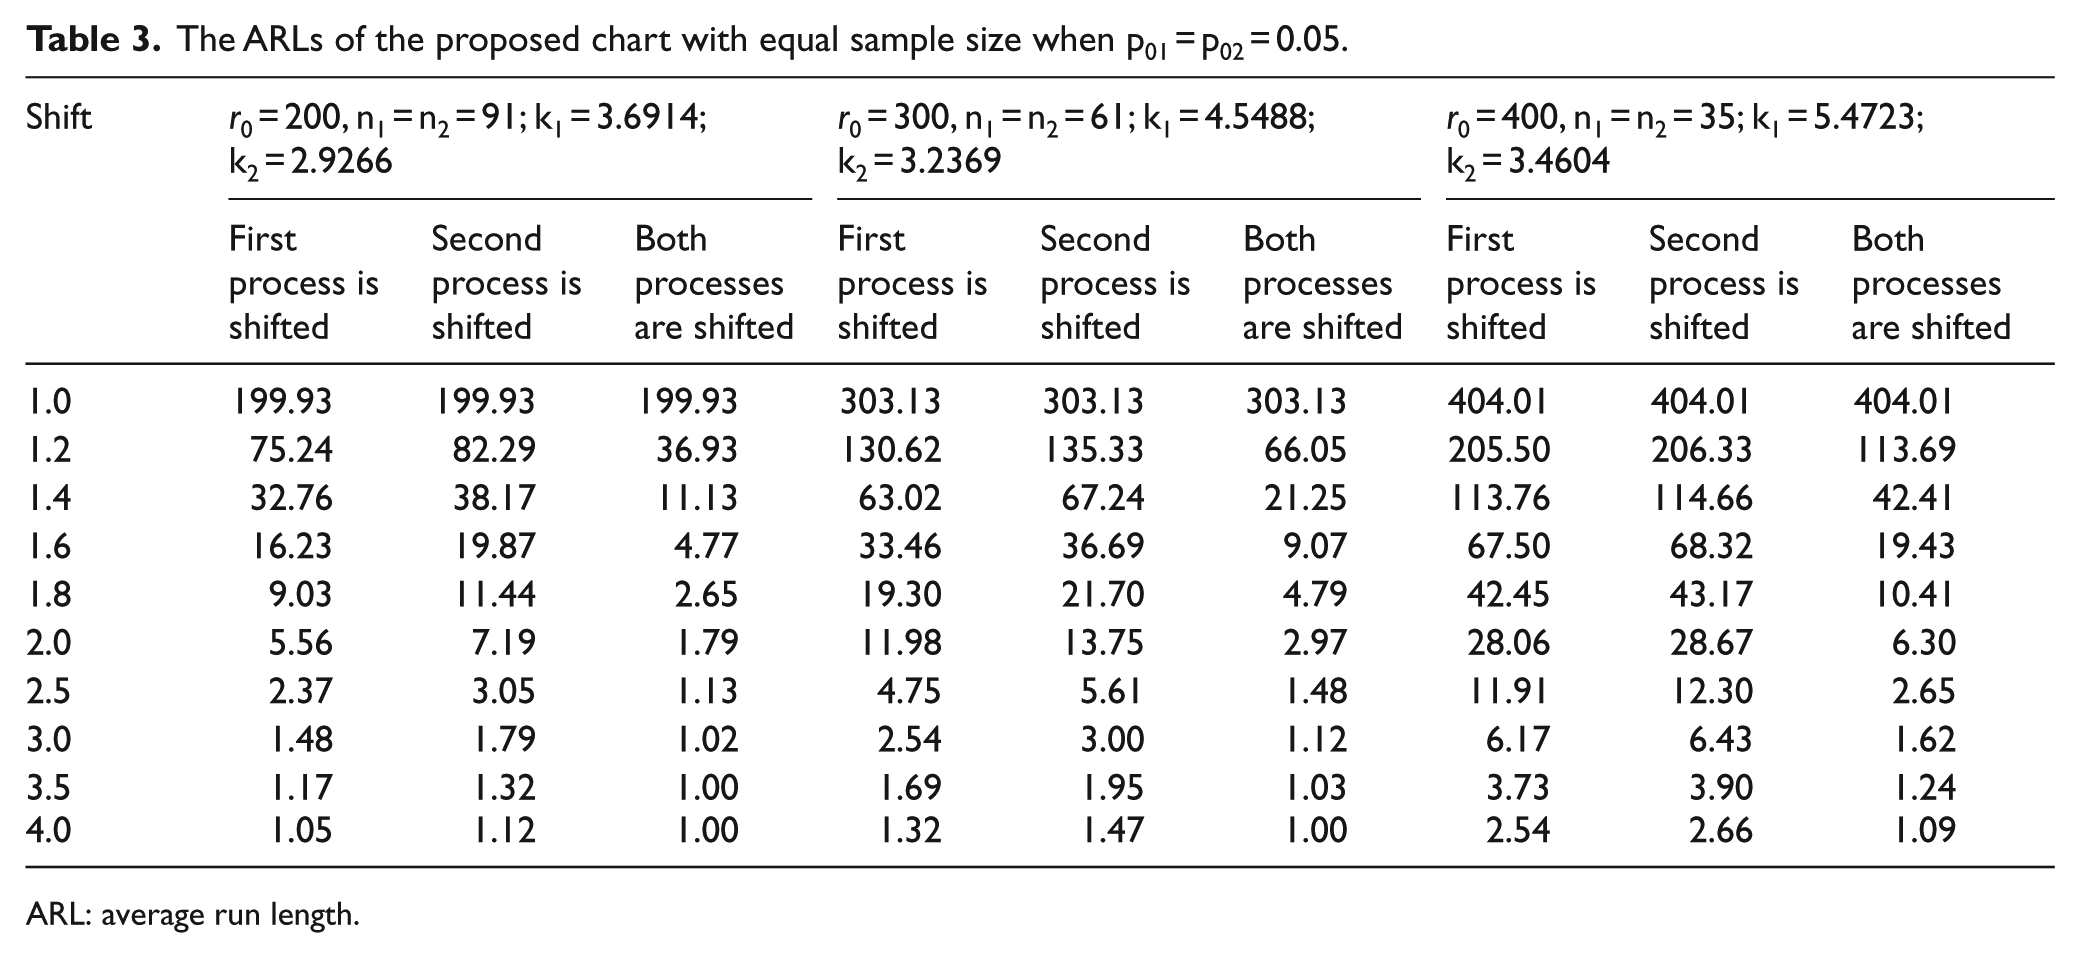
ARL: average run length.
The ARLs of the proposed chart with unequal sample size when p01 = p02 = 0.05.
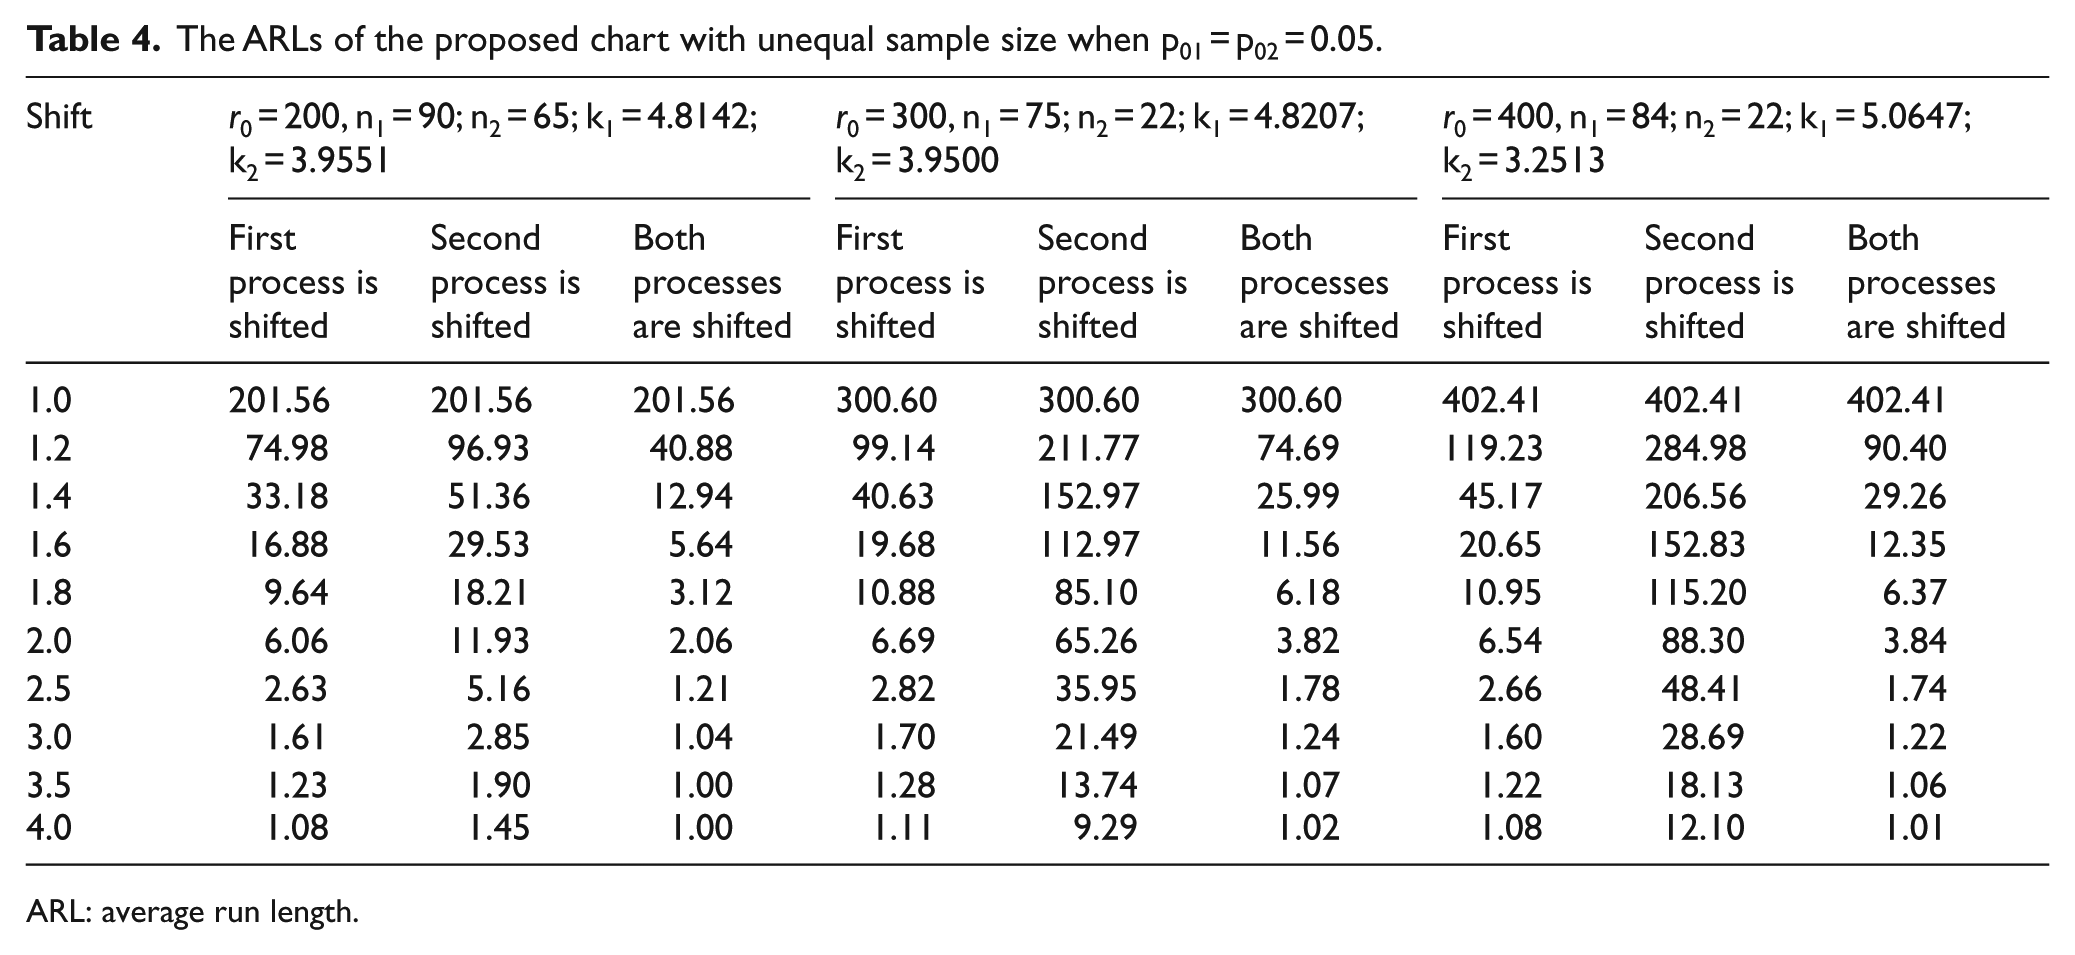
ARL: average run length.
From Tables 1 –4, we note the following trends:
As the fraction nonconforming increases, the out-of-control ARLs decrease more rapidly.
As the target in-control ARL increases, smaller sample sizes are required for the two-stage process.
According to the sample size allocation at the first and the second process, the ARL performance can be different.
Figure 1 shows the trend in ARLs according to the shift constants when p01 = p02 = 0.01 and
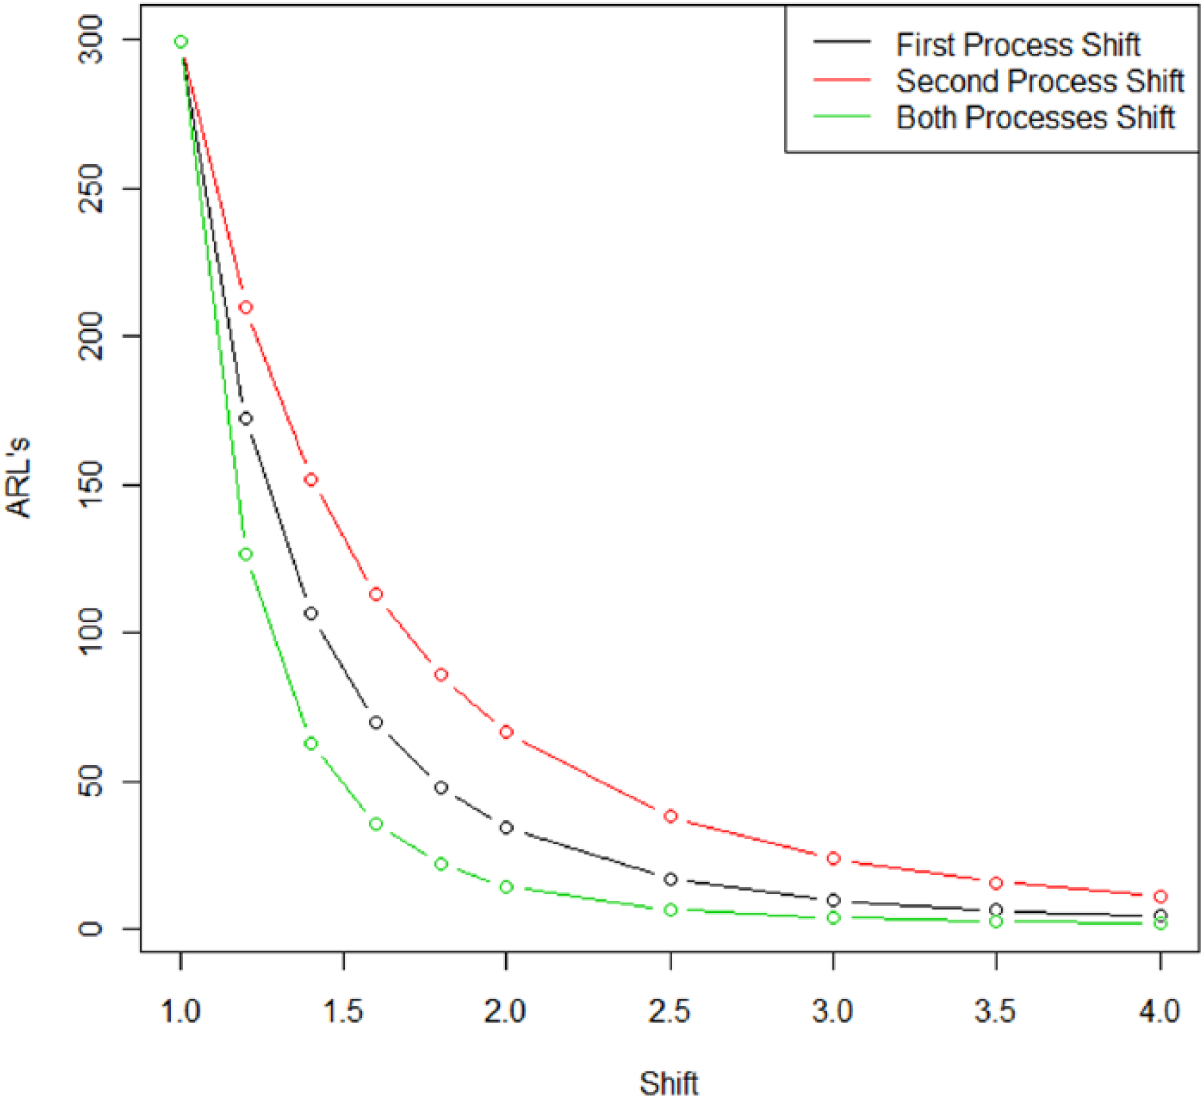
Comparison of ARLs according to different process shifts when p01 = p02 = 0.01 and
Example
For the possible application to an industrial data, we illustrate the use of the proposed chart with synthetic data. Suppose that there is a two-stage manufacturing process, where the number of nonconforming items is counted at each process by subgroups. To generate the synthetic data, it is assumed that p01 = p02 = 0.01 and
Cans data.
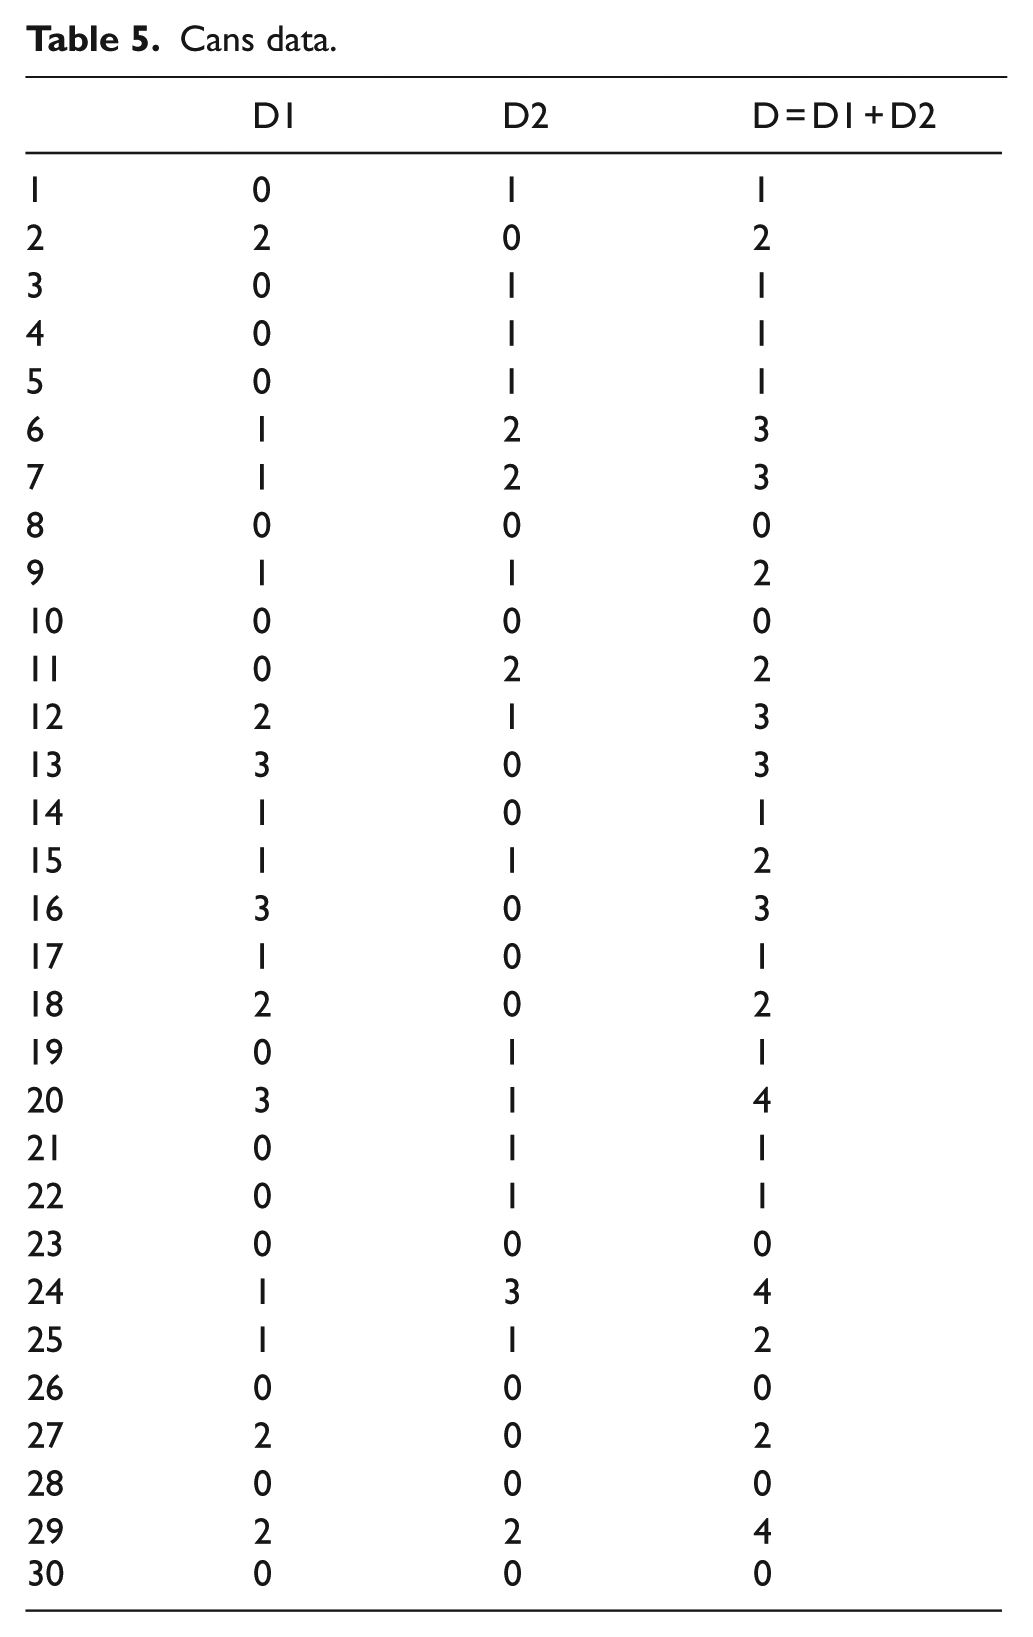
The estimated fraction nonconforming for our data is given as follows
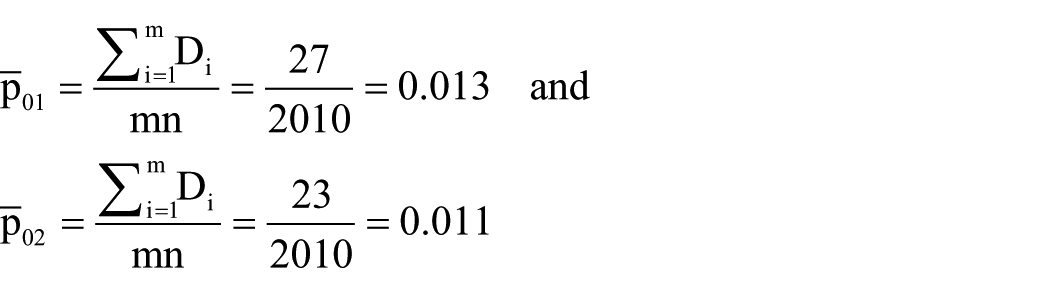
where
The target in-control ARL is selected as r0 = 372. The two control constants for this target and the true fractions nonconforming are obtained by

Therefore, the control limit for first process when using the estimated fraction nonconforming is calculated as
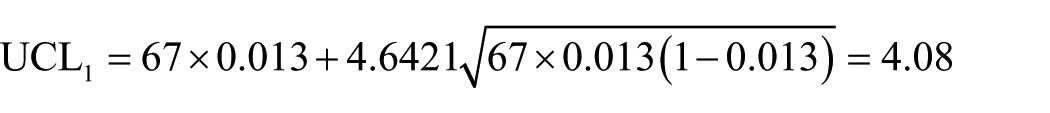
The
We plotted the number of nonconforming cans on control chart for the first process in Figure 2.
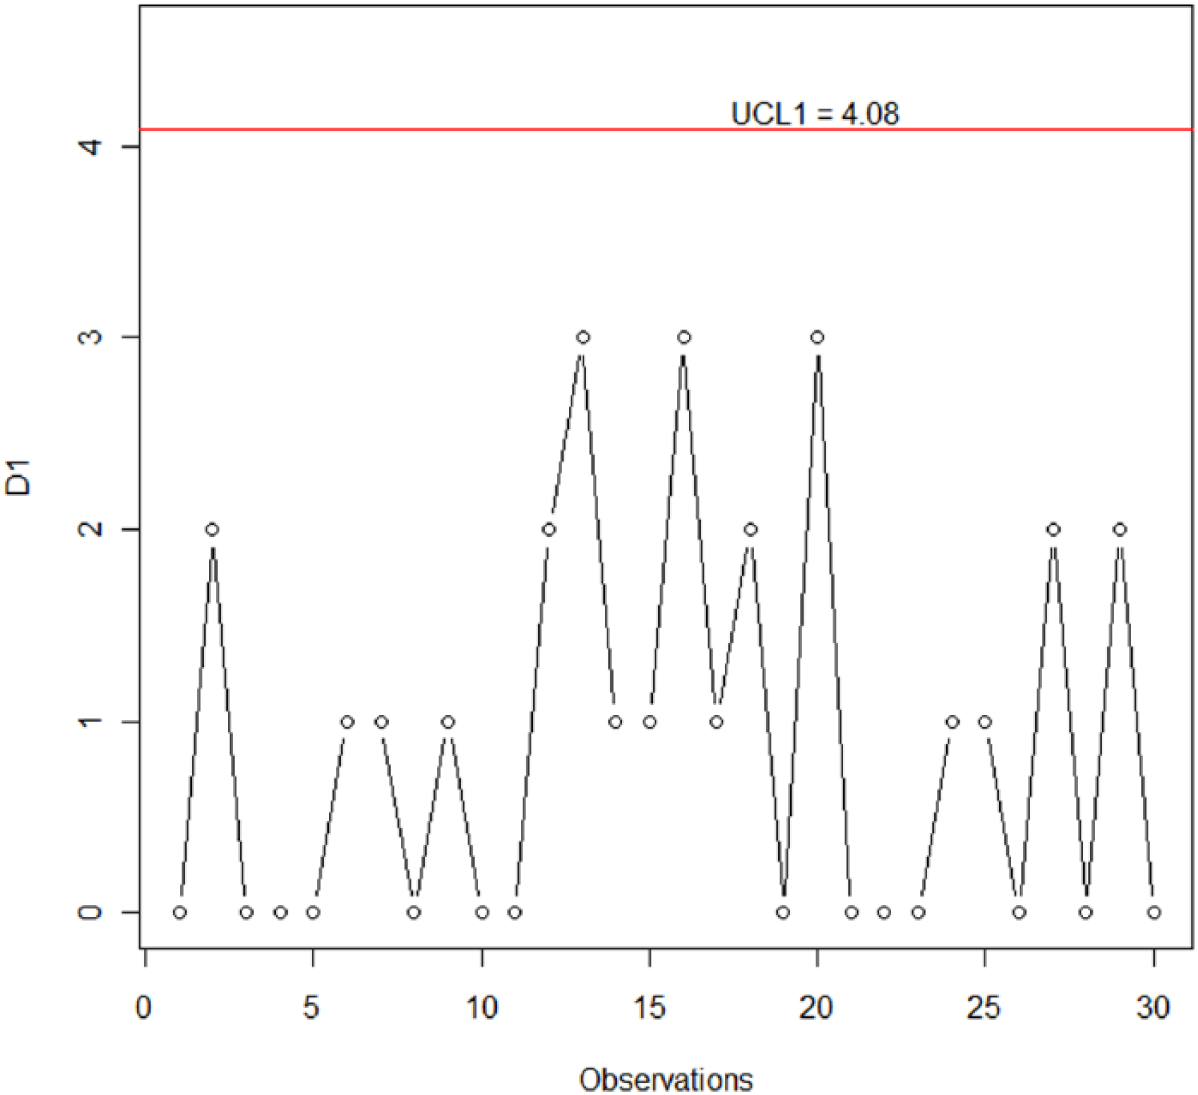
Control chart for the first process in our example.
From Figure 2, we note that all the values of
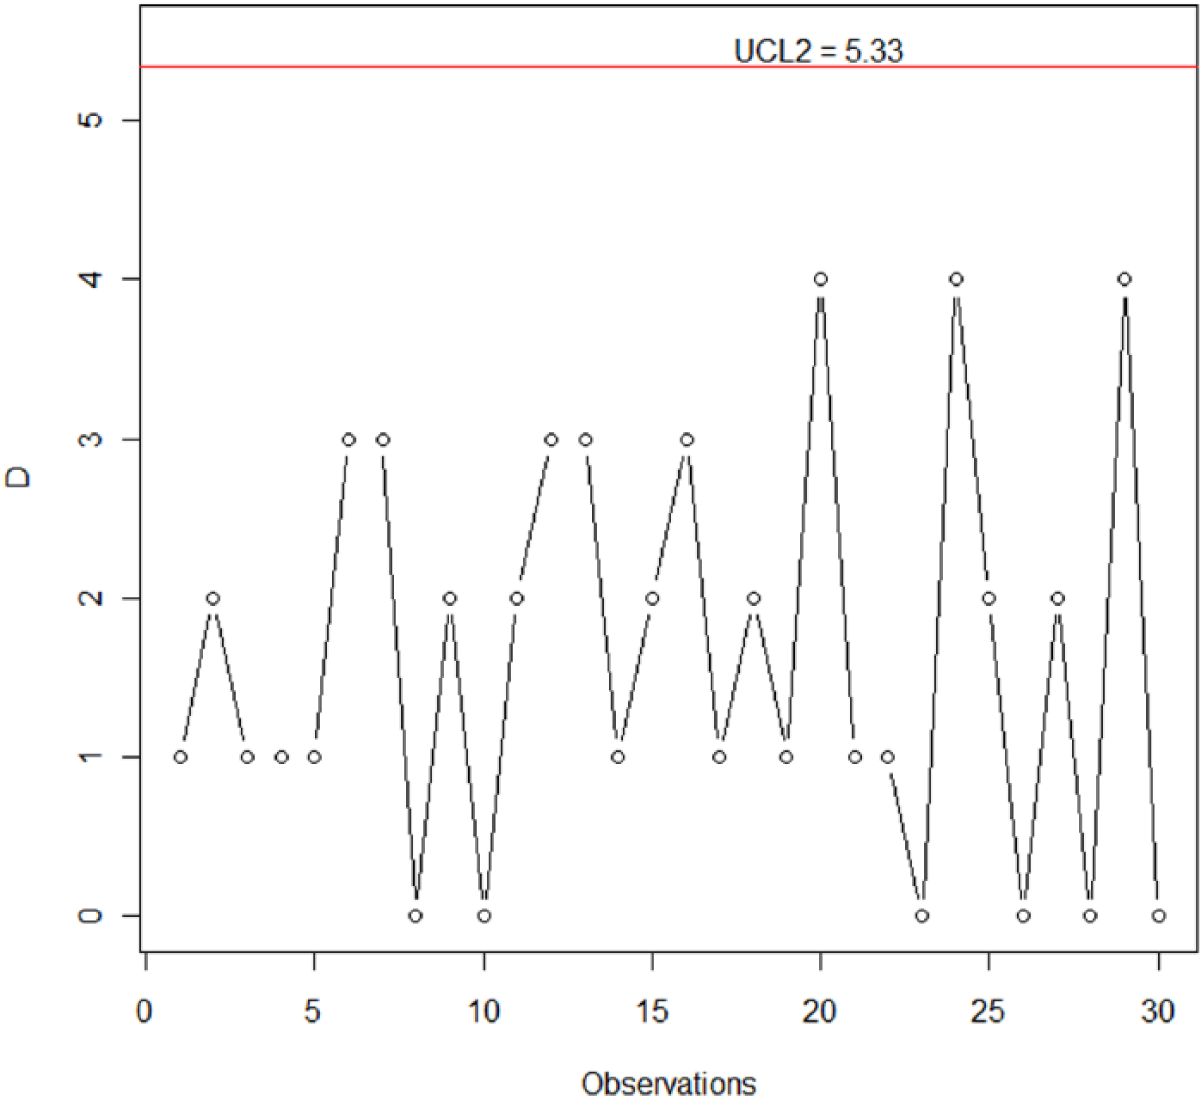
Control chart for the combined process in our example.
From Figure 3, we note that all the values of
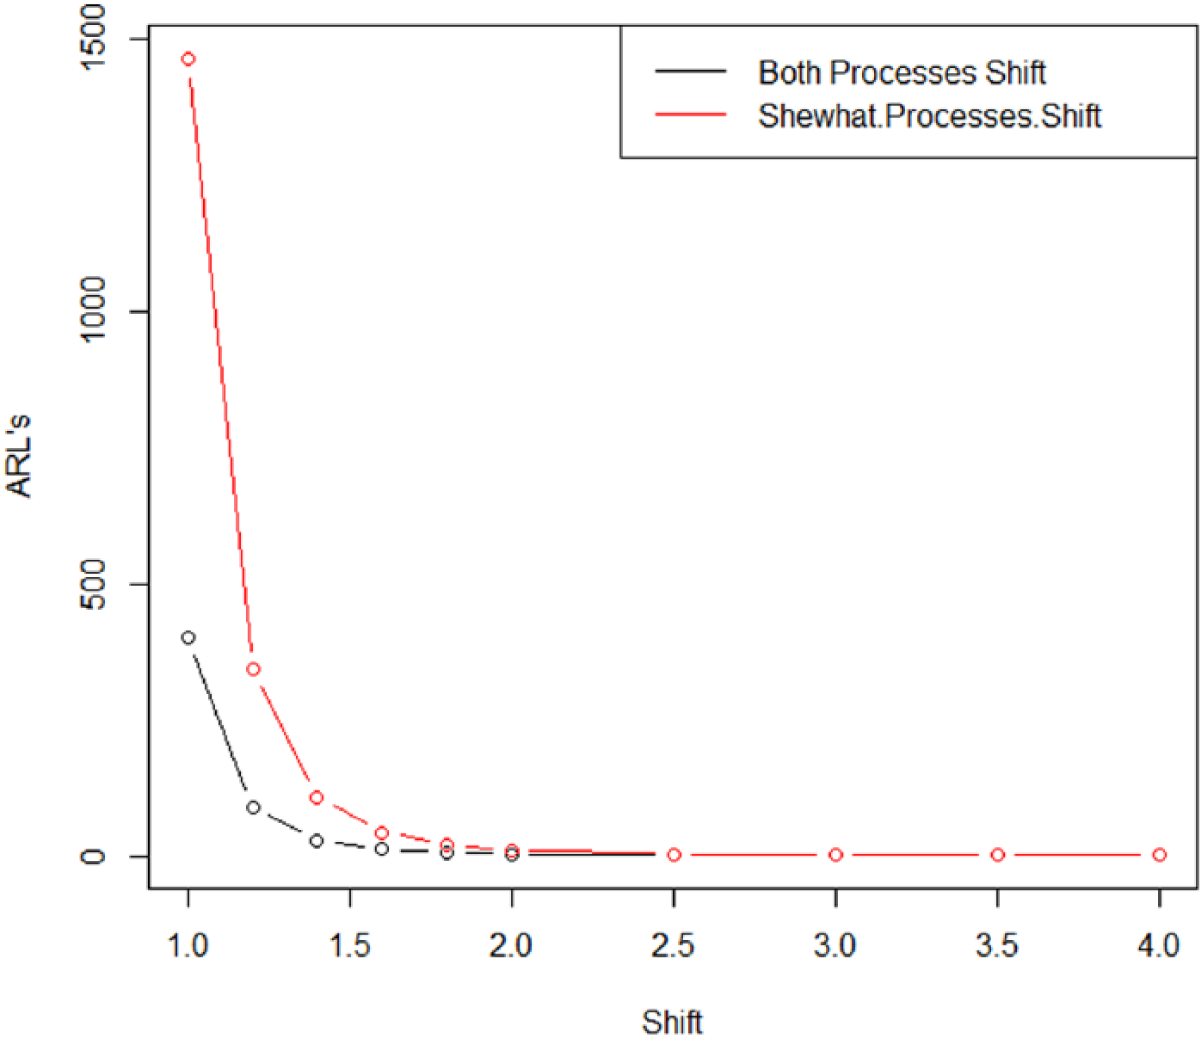
Comparative study
In this section, we will compare the performance of the proposed control chart with the Shewhart np control chart using
The comparisons of the proposed chart and Shewhart control chart when p01 = p02 = 0.05 and
Concluding remarks
In this manuscript, we designed an attribute control chart for a two-stage process. The performance of the proposed chart is assessed in terms of ARLs. The proposed chart is illustrated with a synthetic data set. It is observed that ARLs are decreasing rapidly when both processes, although they are also reasonably fast decreasing when the first process is shifted or the second process is shifted. We also note that the values of ARLs are more slowly decreasing when only the second process is shifted than when only the first process is shifted. These ARLs can be decreased faster if a larger sample size is allocated either the first or the second process.
An attribute control chart for a more general multi-stage process can be extended as a future study. Also, a variable control chart for a two-stage process should be developed in the future.
Footnotes
Acknowledgements
The authors are deeply thankful to editor and reviewers for their valuable suggestions to improve the quality of this manuscript.
Declaration of conflicting interests
The author(s) declared no potential conflicts of interest with respect to the research, authorship, and/or publication of this article.
Funding
This article was funded by the Deanship of Scientific Research (DSR) at King Abdulaziz University, Jeddah. The author, Muhammad Aslam, therefore, acknowledge with thanks DSR technical and financial support. The work by Kyung-Jun Kim and Chi-Hyuck Jun was supported by a research grant from Samsung Electronics Company.