
Abstract
Fuel pipes popularly used in automotive industry applications carry fuel from the fuel tank to the engine and work under variable vibrations having different magnitude and frequency parameters due to the engine’s rotation frequency and road profile’s spontaneous change. Considering that the transfer of the fuel to the engine in the desired way has a crucial importance on the driving performance, any problem that may exist because of the vibrations cannot be acceptable in the pipe assembly. Because of this reason, all manufactured fuel pipes have to be well tested in terms of some industrial standards. The fluid excitement test is a very useful and commonly accepted method in the industry. However, this method produces enormous amount of noise that does not allow to obtain healthy pressure values from the sensors. In this study, Kalman filtering method has been used to interpret the data that have been obtained from the sensors. The usefulness and effectiveness of the proposed Kalman filtering method have been shown and discussed based on the test results.
I. Introduction
In automotive industry, fuel pipes are the subjects of different magnitude and frequency vibrations. The main reason of this situation is that dynamics of vehicle and road profile constantly change.1,2 Fuel pipes have to be robust against all the different vibration schemes; otherwise, stress and strain parameters may become unstable and assembly may be harmed.3–5 After manufacturing process, all fuel pipes have to be well tested in terms of their sustainability.6,7 Almost all test methods in the literature are based on stress–strain analysis. 7 However, this analysis has two side effects. First side effect: it is very time-consuming, especially for mass production companies. Second side effect: stress–strain test is not well suited for plastic materials. 8 During the test, the fuel pipe shows only plastic behavior, so that its damping ratio, which is a parameter of elasticity, cannot be well measured.
In this study, a new testing machine is proposed to deal with the problems given above. The design is based on a hybrid system, which consists of hydraulic and pneumatic parts controlled by a programmable logic controller (PLC). The test basically involves filling the pipe with fuel by a PLC-controlled pump and creating vibrations on it through a membrane excited by air. Magnitude of air pressure is adjusted by a PLC-controlled compressor and frequency of the air pressure is adjusted by a PLC-controlled solenoid valve.
During these excitements consisting of different vibration characteristics, the pressure values are being measured by the sensors located at the entrance and the exit of the pipe. The ratio of these two parameters is used to interpret the damping characteristic of the test pipe. However, due to the mechanical noise caused by solenoid valve working at high frequencies, the sensor outputs are always being corrupted. To deal with this issue, Kalman filter approach is used to process the obtained signals.
The rest of the study is organized as follows; in the “Kalman Filtering Method” section, Kalman filtering method is introduced. In the “Design” section, the design and its specifications are given. In the “Results and Discussion” section, the results of the study are conducted and discussed. In the “Conclusion” section, the conclusion is given.
II. Kalman Filtering Method
Kalman Filter is an algorithm that uses a set of measurements over time, containing statistical noise, and produces estimates of unknown variables that tend to be more precise than those based on a single measurement alone. It has a great importance to deal with signals containing noise. 9
Solenoid valve is opening and closing at high frequencies, so that it produces so much noise that corrupts pressure parameters read by the sensors. Using of Kalman filter is necessary to get rid of this situation.
The pressure parameters are written in the difference equation form below, where w1 represents process noise for the pressure parameter-1 and w2 represents process noise for the pressure parameter-2


When Equations (1) and (2) are put into a linear state-space representation, the following equations are obtained
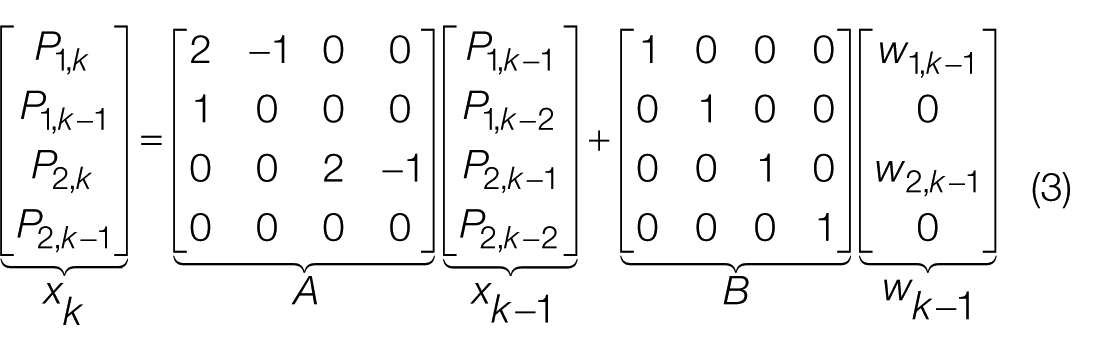
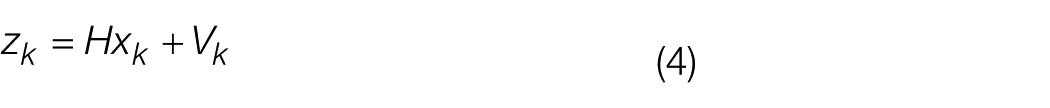
where A is the system matrix, B is the input matrix, H is 2 × 2 identity output matrix and Vk stands for the measurement noise. Iterative working steps of the Kalman filter are given in
Figure 1
. The state estimator and the error covariance parameters are being updated at each step.
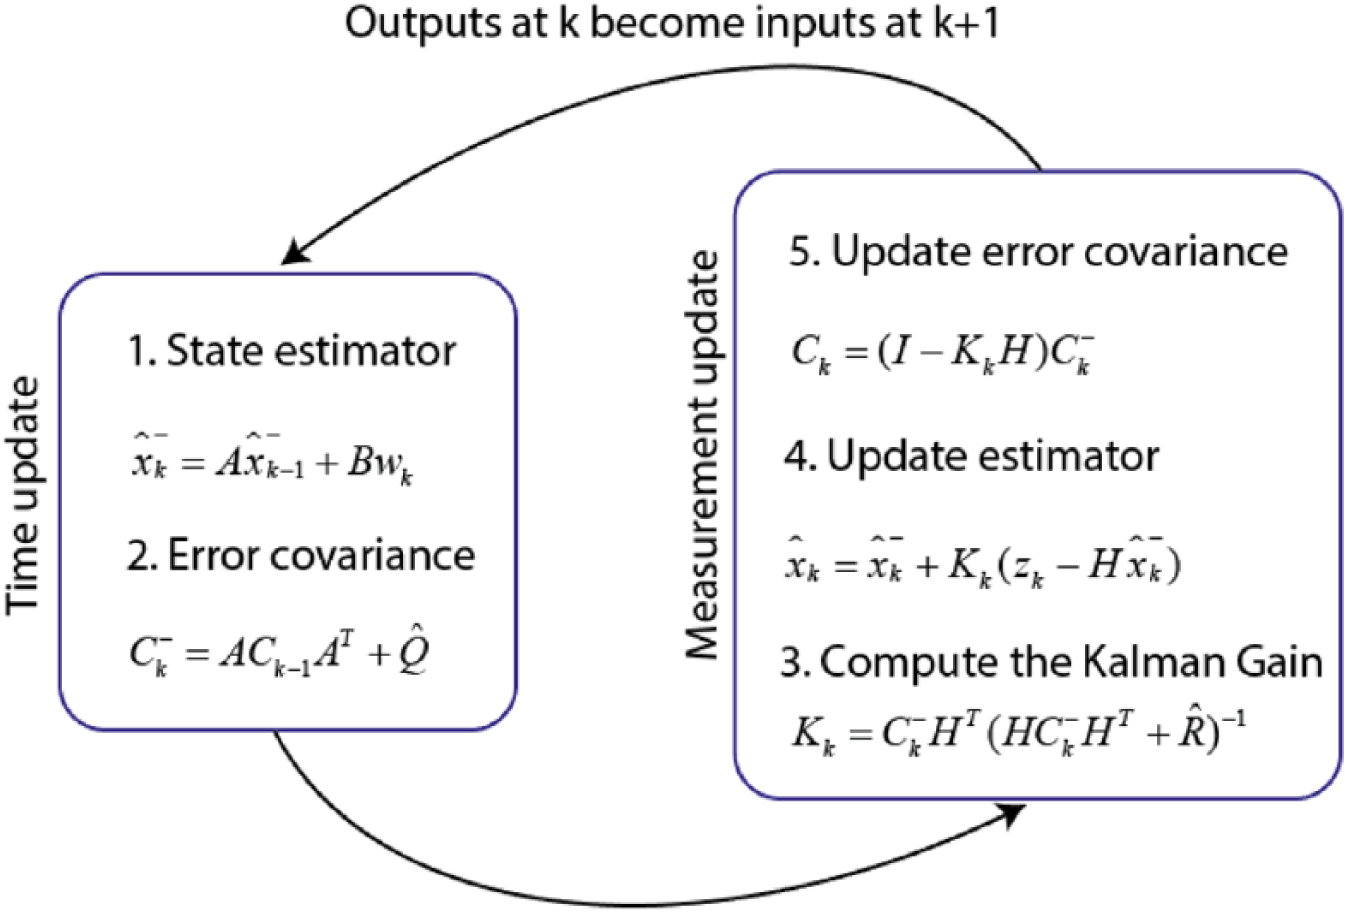
Iterative working steps of Kalman filter
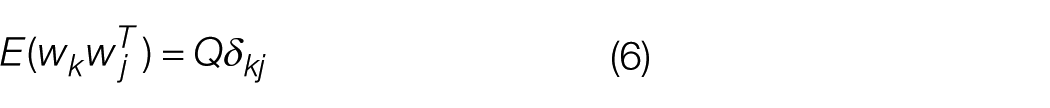
For synthesizing the filter gain, K, the covariance of the process and the measurement noise, Q and R, should be well estimated. In this study, the estimation process of Q and R parameters is achieved by the correlations of the innovation sequence method. 10
It is assumed that wk and Vk are uncorrelated Gaussian stationary white noise sequences with zero mean; therefore, covariance of Q and R can be written as follows


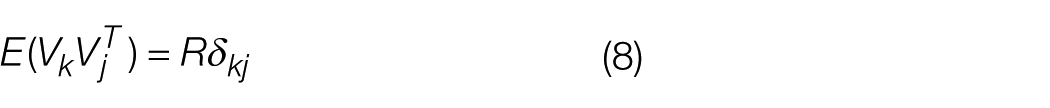
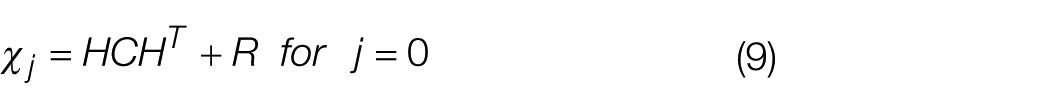
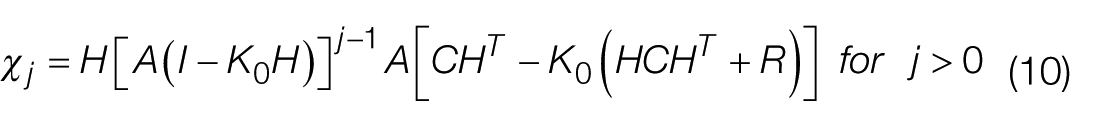
δkj is the Kronecker delta function and E(·) is the expectation value function. χ, the covariance function of the innovation process for any stable observer gain K0, is given in Equations (9) and (10) 11
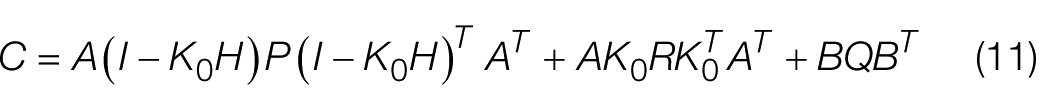
where the covariance of the state error is in the steady state, and the solution of the Riccati equation is given below 12
The covariance function of the innovation process for each iteration can be seen in Equation (12)
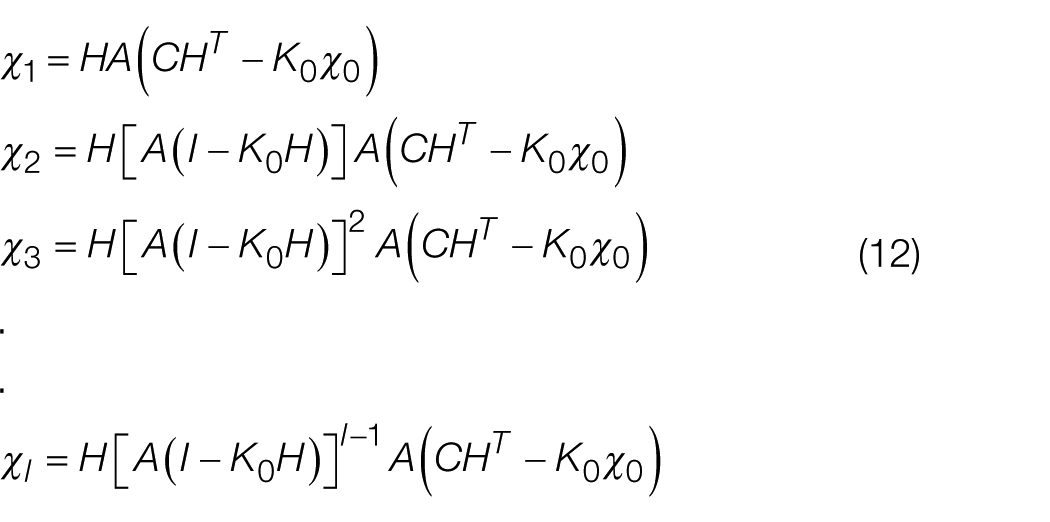
And, Equation (12) can be summarized with Equation (13)
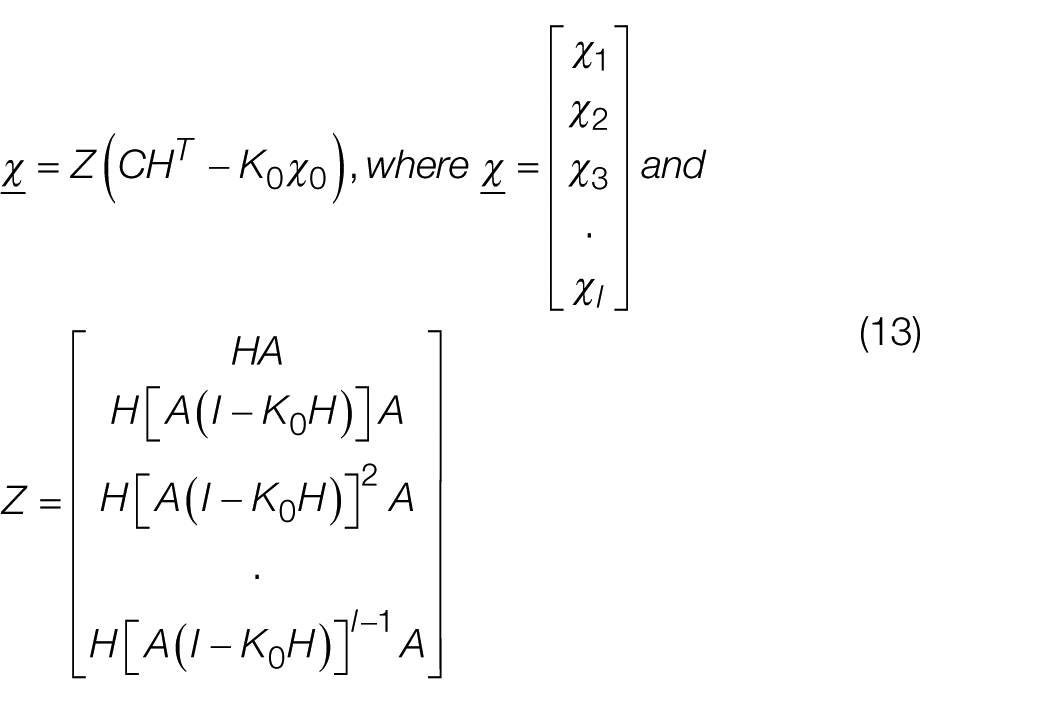
Therefore, if Z matrix has full-rank, then CHT and the estimation of R can be obtained as follows
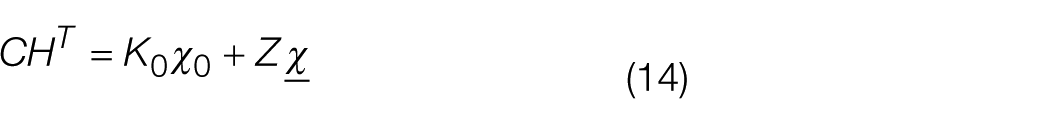
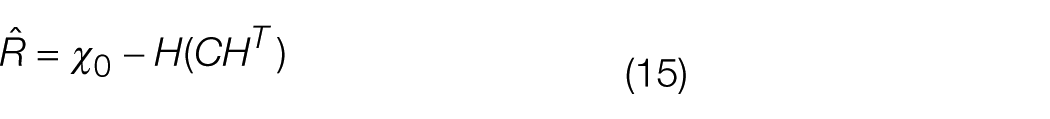
If Z matrix does not have full-rank, then the well-known pseudo-inverse lemma can be applied to Z matrix. When R parameter in Equation (11) is replaced by its autocorrelation value at zero lag, Equation (11) becomes Equation (16)
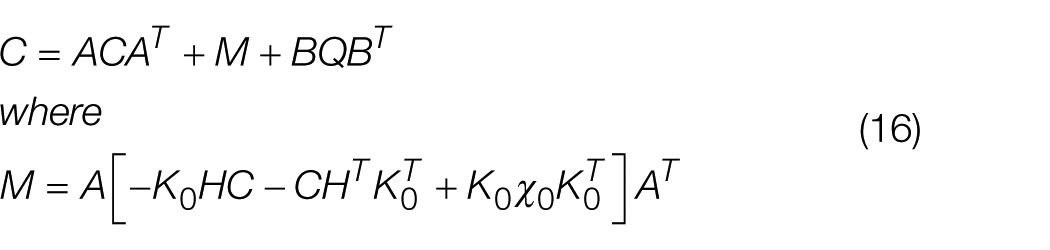
And the generalized form of Equation (16) for the recursive iteration process
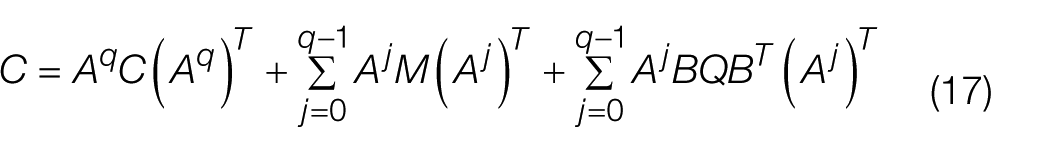
For both sides of Equation (17), post-multiplying by CT and pre-multiplying by CA−q are applied. Therefore, Equation (18) is obtained
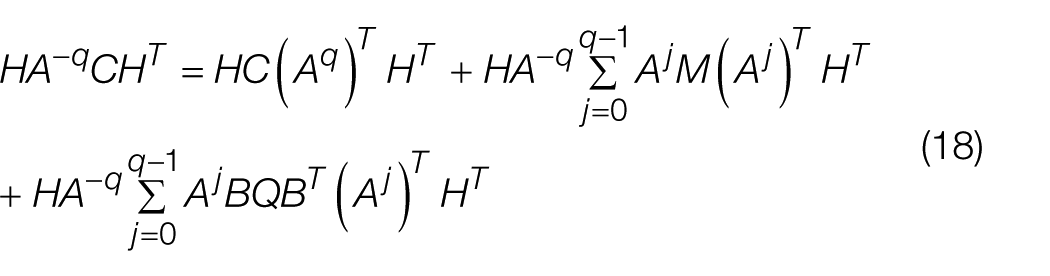
If it is assumed that C is a symmetric matrix, then Equation (19) is obtained as follows
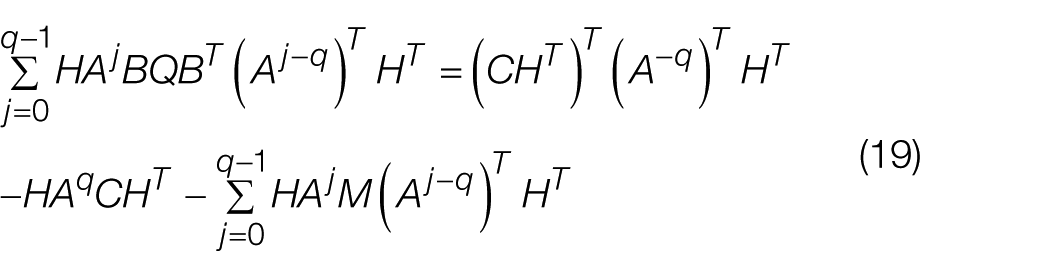
Equations (20)–(22) are given as a generalized form of Equation (19)
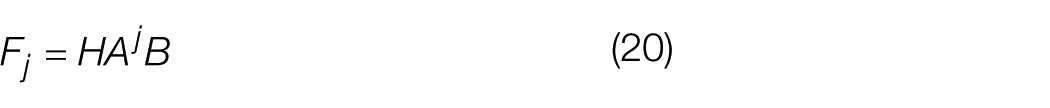
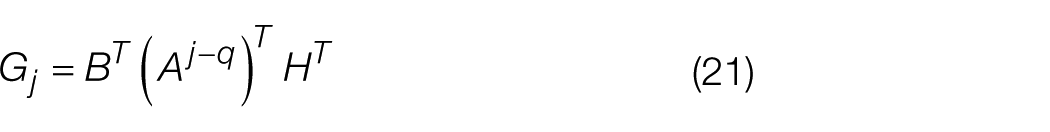
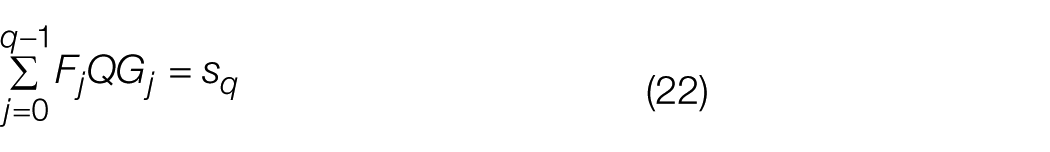
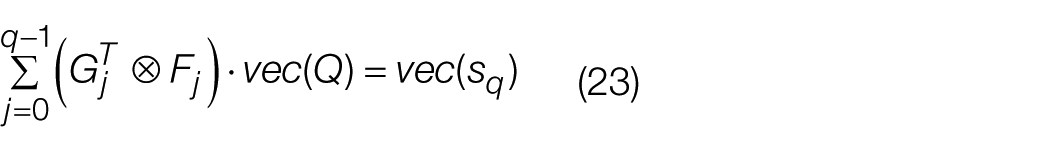
Equation (22) can also be written in the vector form in Equation (23) given below
If it is assumed that
For signal processing implementation of any industrial application, it is too hard to obtain an invertible
III. Design
The proposed design is given in Figure 2 . The design consists of a hydraulic pump, a compressor and two solenoid valves, and all these elements are being controlled by a PLC. To measure the pressure values, two pressure sensors are located at the entrance and the exit of the test pipe, respectively.
The scheme of the designed machine parts
As can be seen in Figure 2 , fuel and air are separated by a membrane. After air is compressed at a stable pressure level, valve-2 is driven until its frequency reaches 1600 Hz. Frequency is increased by 10 Hz in each 5 s. During this event, the average pressure parameters for each frequency level, P1 and P2, are sent to PLC, and PLC evaluates whether the pipe passes the test. The flow diagram of the algorithm is given in Figure 3 .
Flow diagram of algorithm
During the test, it is observed that the pressure parameters P1 and P2 show sinusoidal characteristics for each frequency level. For example, in Figures 4 and 5 , P1 and P2 parameters are measured at 500 Hz.
P1 at 500 Hz
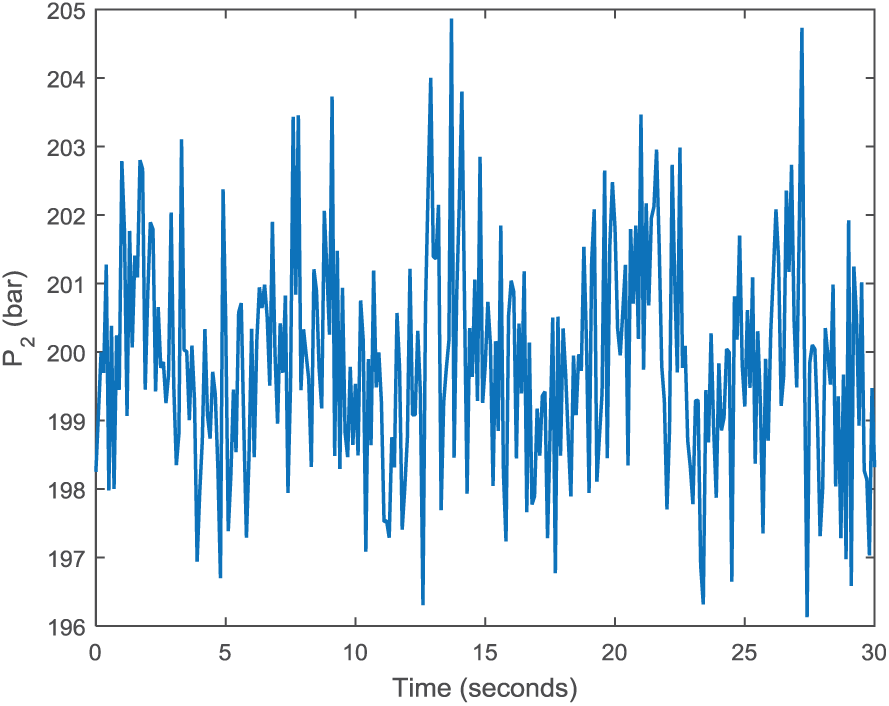
P2 at 500 Hz
The picture of the pressure sensors located at the entrance and the exit of the test pipe is given in Figure 6 .
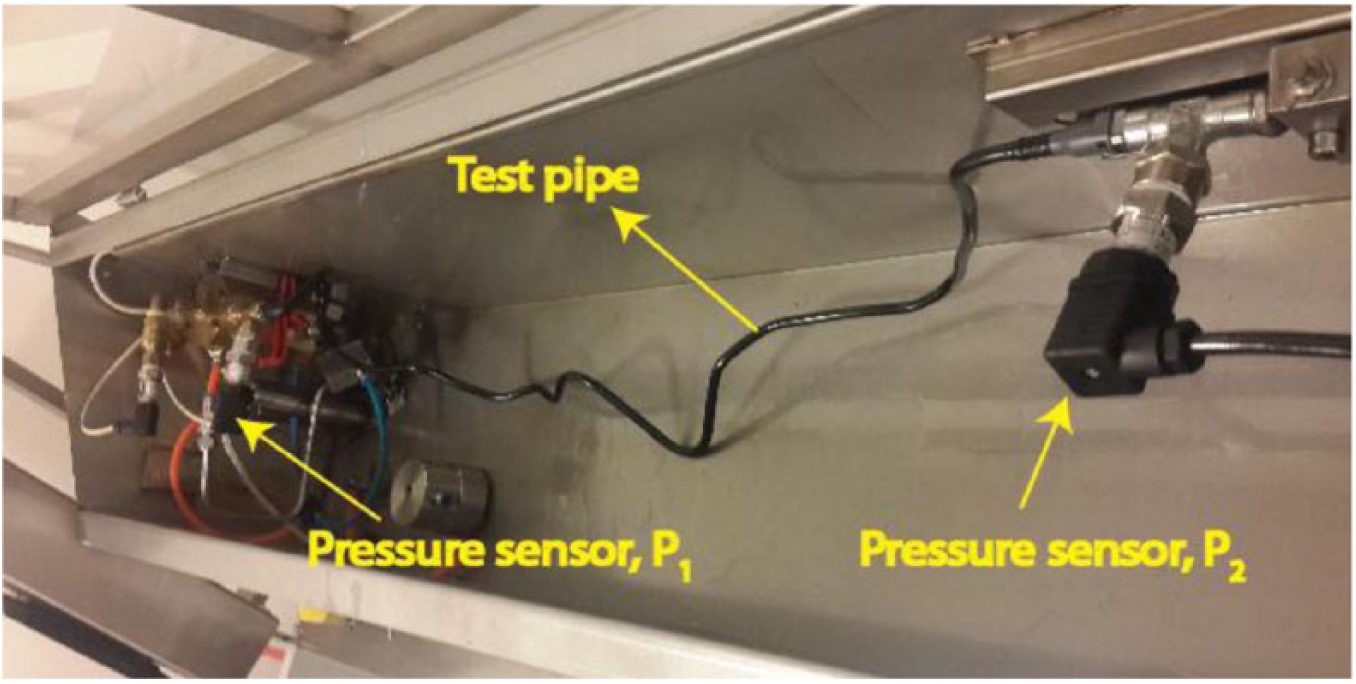
Pressure sensor (P1) located at the entrance, test pipe and pressure sensor (P2) located at the exit
Fuel entrance, air entrance and polyurethane membrane can be seen in Figure 7 .
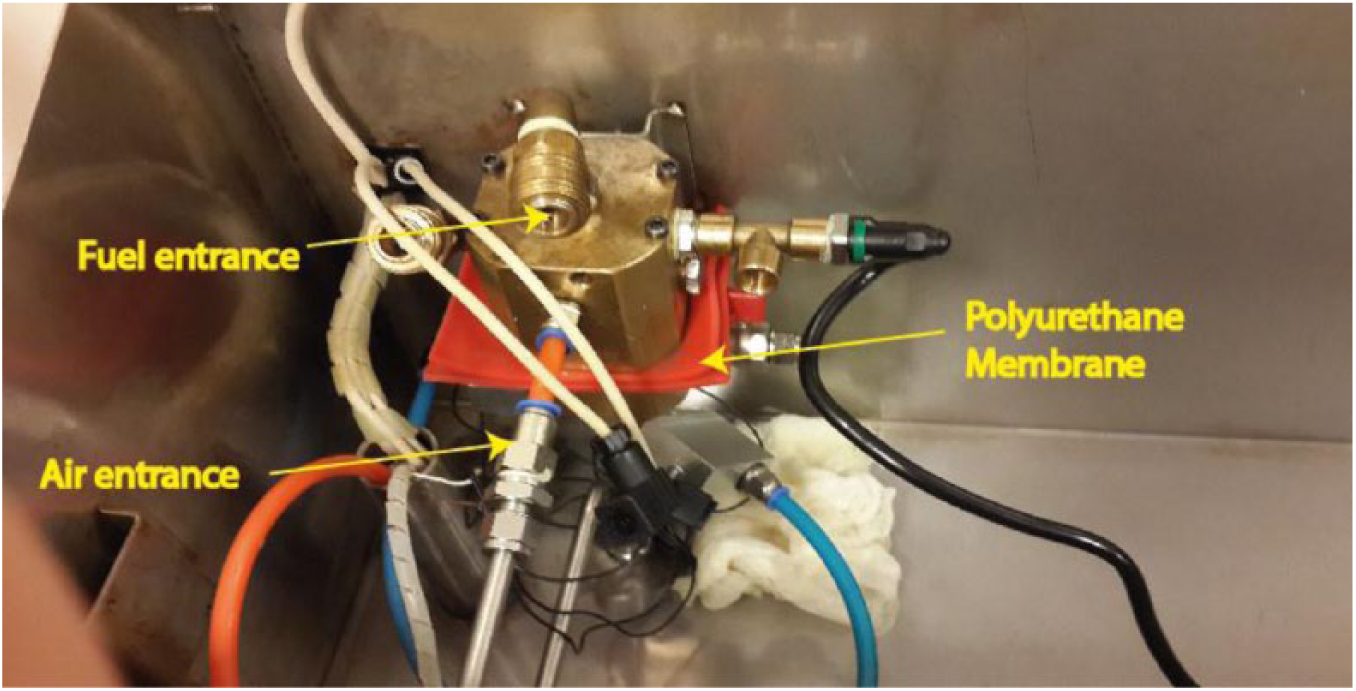
Fuel entrance, air entrance and polyurethane membrane
Hydraulic pump and valve-1 can be seen in Figure 8 . Hydraulic pump and valve-1 are directly being controlled by PLC. Moreover, an accumulator and a pressure sensor are being used to stabilize the hydraulic pump working at the desired pressure value.
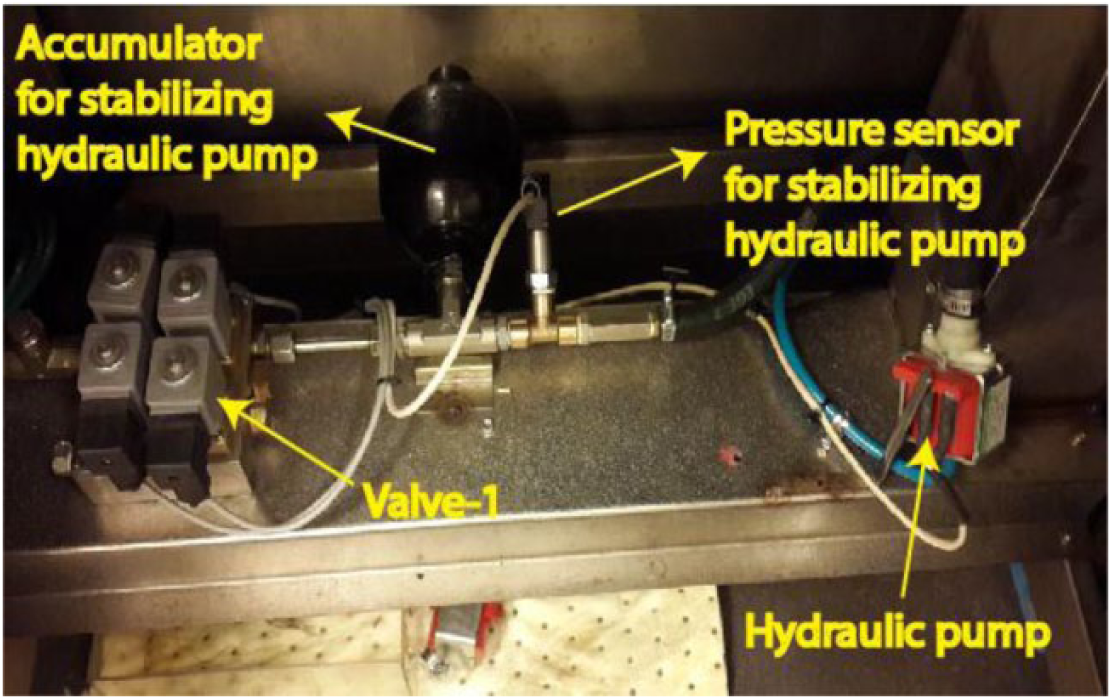
Hydraulic pump and valve-1
IV. Results and Discussion
Tests are completed for two different cases. The first case is the test without Kalman filtering method, and the second case is the test with Kalman filtering method. The sensor data without Kalman filtering method and the sensor data with Kalman filtering method can be seen in Figures 9 and 10 , respectively. The desired limit of the damping ability at different frequencies is modeled as a simple line that has a negative tangent. The main reason of this situation is that it is desired that fuel pipes should be more robust against vibrations occurring at high frequencies. This damping limit standard is determined by many automotive companies producing fuel pipes.
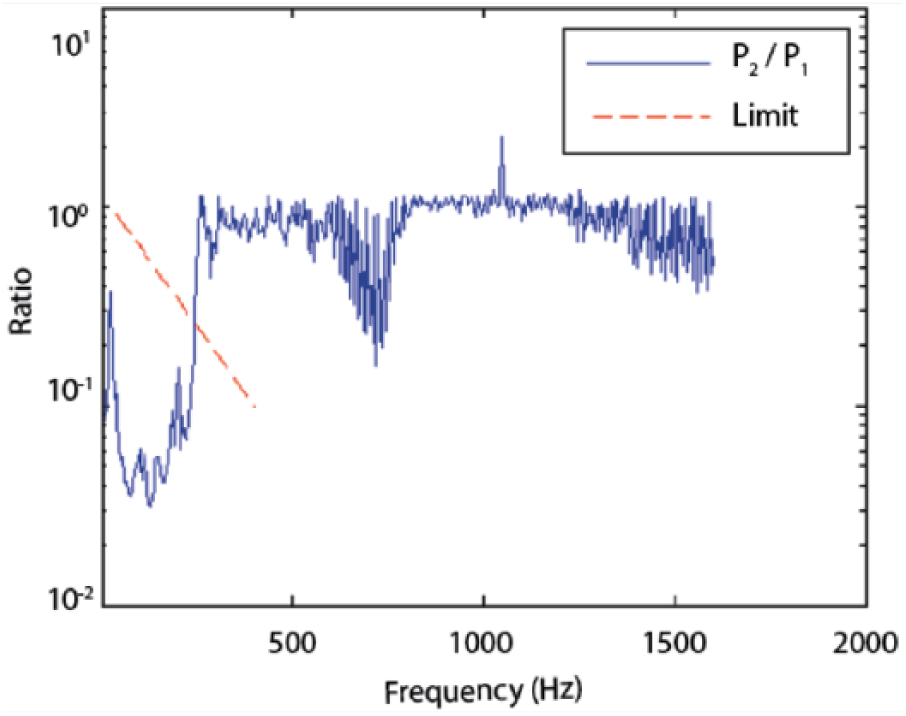
The sensor data without Kalman filtering method
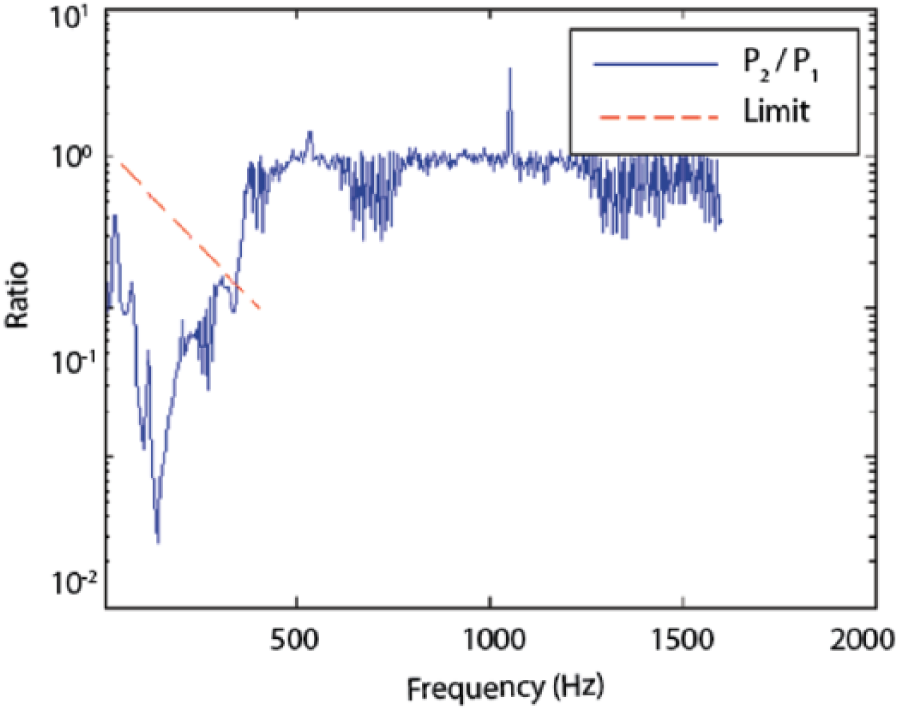
The sensor data with Kalman filtering method
As can be seen from Figures 9 and 10 , the higher the frequency is, the lower the damping factor occurs; P2/P1 ratio converges to 1 with a varying steady-state error, which means that the fuel pipe loses its damping ability at high frequencies.
In Figure 9 , the sensor data without Kalman filtering method show that the fuel pipe loses its damping ability after the solenoid valve-2 opening–closing at 400 Hz frequency.
However, when the data are filtered in Figure 10 , it becomes clear that the fuel pipe is actually valid for the damping standard, the ratio passes the limit line after the frequency reaches above 500 Hz. Moreover, it is also observed that the oscillations have more peak values for the sensor data with Kalman filtering method. Especially around 200 Hz, the test pipe shows the most appropriate vibration damping behavior for both cases. After 600-Hz band, both cases give similar results except various minimal deflections.
V. Conclusion
During the fluid excitement test, variable frequency vibrations have been applied to the test pipe; thus, the damping characteristic of the fuel pipe has been tested by interpreting the pressure values occurring at the entrance and the exit of the test pipe.
For the test without using Kalman filtering method, the sensor data show that the fuel pipe loses its damping ability when the membrane is excited around 400 Hz frequency. However, these data are corrupted by a serious amount of noise. Therefore, the validity of the test is not reliable, and the data need to be filtered.
For the test using Kalman filtering method, the noise that corrupts the sensor data has been cleared by using Kalman filtering method based on the correlations of the innovation sequence method, and a more precise test has been conducted to determine the validity of the test pipe according to the damping standard. Therefore, the safety of the mass production process has been guaranteed.