
Abstract
In this paper, we proposed an effective method for detecting fiducial points in arterial blood pressure pulses. An arterial blood pressure pulse normally consists of onset, systolic peak and dicrotic notch. Detection of fiducial points in blood pressure pulses is a critical task and has many potential applications. The proposed method employs empirical wavelet transform for locating the systolic peak and onset of blood pressure pulse. The proposed method first estimates the fundamental frequency of blood pressure pulse using empirical wavelet transform and utilizes the combination of the blood pressure pulse and the estimated frequency for locating onset and systolic peak. For dicrotic notch detection, it utilizes the first-order difference of blood pressure pulse. The algorithm was validated on various open-source databases and was tested on a data set containing 12,230 beats. Two benchmark parameters such as sensitivity and positive predictivity were used for the performance evaluation. The comparison results for accuracy of the detection of systolic peak, onset and dicrotic notch are reported. The proposed method attained a sensitivity and positive predictivity of 99.95% and 99.97%, respectively, for systolic peaks. For onsets, it attained a sensitivity and predictivity of 99.88% and 99.92%, respectively. For dicrotic notches, a sensitivity and positive predictivity of 98.98% and 98.81% were achieved, respectively.
I. Introduction
Arterial blood pressure (BP) is a vital sign of the cardiovascular system of the human body. BP pulse represents the cardiac activity of contraction and relaxation. The BP pulse duration is divided into systolic and diastolic phases. The systolic phase indicates the contraction activity of heart, whereas diastolic phase specifies the relaxation behaviour of heart. The significant characteristic points in BP pulse generally include onset, systolic peak and dicrotic notch. 1 The systolic peak and onset represents the maximum and minimum BP during a cardiac cycle, respectively. The existence of dicrotic notch in BP pulse indicates the closure of aortic valve.2,3 The time interval between dicrotic notch and onset is termed as diastolic period, whereas diastolic period variability (DPV) is the variation in beat-to-beat diastolic period interval. 1 Figure 1 represents a BP pulse indicating the various fiducial points and the diastolic period interval. Just like electrocardiogram (ECG), BP pulse also contains rich information about cardiovascular system such as heart rate and systolic, mean and diastolic arterial pressures. 2 The cardiac health status may be monitored through BP pulse in a scenario where ECG signal is extremely noisy or due to surgical dressing of patients, ECG data acquisition may not be possible. 4 In some cases, parallel analysis of BP pulses along with ECG has resulted in reducing false alarms to a certain extent for critical arrhythmias detection. 5 Detection of fiducial points in pressure pulses is a vital task and has numerous potential applications such as in pulse oximeters to estimate oxygen saturation, measures of baroreflex sensitivity,6,7 pressure pulse contour analysis DPV computation and multimodal heart beat detection algorithms. 4 Multimodal algorithms provide considerable improvement in performance for noisy multimodal data sets compared to when only the ECG signal is used. Thus, accurate location of beats in BP pulses is also important in case of multimodal beat detection. Following the guidelines on heart rate variability (HRV), 8 the significance of HRV as a tool for assessing the autonomic nervous system activity in various healthy and pathological conditions has steadily increased. The importance of short-term HRV (less than 30 min) is increasing consistently for several reasons including the suitability for ambulatory care and the ability to provide an almost immediate test result. 9 Current studies have also focussed on cardiac DPV examination. 1 The short-term DPV analysis may thus provide valuable information in addition to HRV. Thus, beat detection in pressure pulses is also important for accurate computation of DPV.
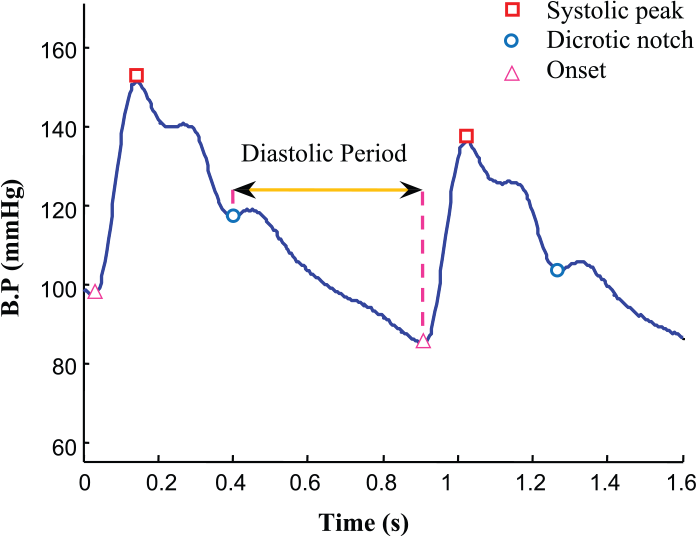
BP pulse depicting systolic peak, dicrotic notch, onset and diastolic period 1
Many beat detectors for delineation of BP pulses have been reported in the literature.2,3,10–16 The various detectors reported involve various signal processing methods such as weighted Slope Sum Function and adaptive thresholding, 2 combined analysis of BP pulses and their derivatives, 3 filter bank, spectral estimates of the heart rate, rank-order nonlinear filters, decision logic, 11 wavelet transform, 13 and empirical wavelet transform (EWT). 16 Most of the reported detectors paid major attention on systolic peaks and the onsets or dicrotic notches only.2,9,14 There are only few detectors which pay attention towards full delineation of BP pulse. 3 In this paper, we have proposed an efficient algorithm for finding the fiducial points in BP pulses. We have utilized EWT method for finding the systolic peak and onset, whereas the dicrotic notch is determined by first-order difference. The EWT was previously used for finding the systolic peaks and the onsets in BP pulses. 16 However, the mathematical details were not explained, and moreover, the proposed algorithm decomposes the BP pulse randomly into five different modes which is not optimum. In this work, we have optimized the boundaries for computation of EWT. We have presented a detailed study of the proposed method and compared it with some existing detectors.
II. Proposed Method
A. EWT
EWT is a novel signal processing method which provides fully adaptive and data-driven analysis of signals. The empirical mode decomposition (EMD) is used to decompose a data series into intrinsic mode functions. 17 Despite of its lack of mathematical theory and high computational complexity, EMD has found its applications in wide range of areas. EWT is a relatively new approach for decomposing a time series into its building modes and utilizes an empirical scaling and wavelet functions. 18 The empirical scaling function and wavelet functions are band pass filters and adapt themselves to the processed signal. The operation of EWT algorithm relies on the Fourier spectrum of the signal under analysis. At first, it computes the Fourier spectrum of the signal, then performs spectrum segmentation and finally extracts the building modes using empirical scaling function and wavelet functions. 18 In brief, the EWT algorithm uses the following steps:
Find the frequency spectrum of the signal. Find the set of maxima in the spectrum with their corresponding frequencies and arrange the maxima in the descending order.
Segmentation of Fourier spectrum is performed. We separate the Fourier spectrum into N segments. The boundary of each segment is located as the centre of two consecutive maxima.
An adaptive wavelet filter bank using a scaling function and wavelet functions is then designed based on the boundaries specified. The modes are then computed as the output of filter bank.
B. Description of the proposed method
In this section, we describe the details of the proposed methodology. The block diagram of the proposed method is shown in Figure 2 . The raw BP pulse is pre-processed using a sixth-order high-pass Butterworth filter with a cut-off frequency of 0.4 Hz. This pre-processing is used to remove the baseline wander noise which may be present in the original BP signal. An example of raw BP pulse with baseline wander noise and filtered BP pulse is shown in Figure 3 . For systolic peak and onset location, we used an empirical wavelet approach, whereas first difference signal is used for dicrotic notch location.
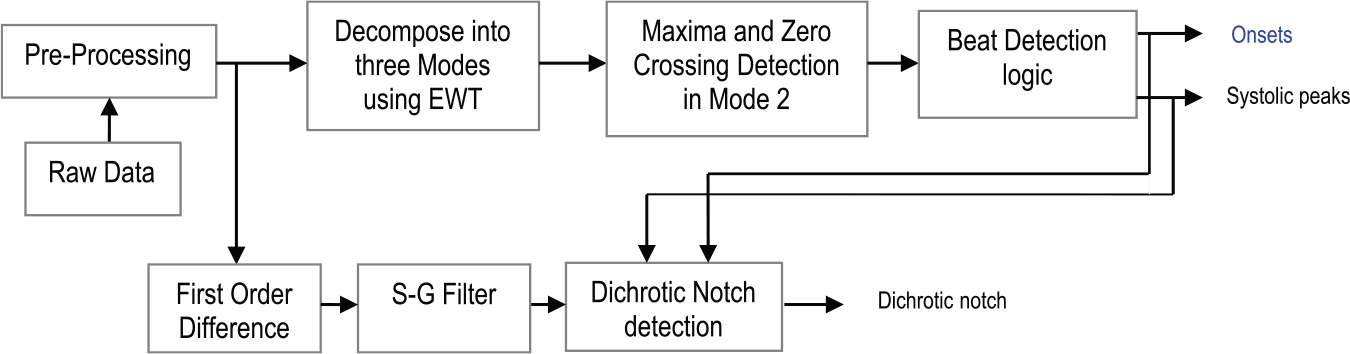
Block diagram of proposed algorithm
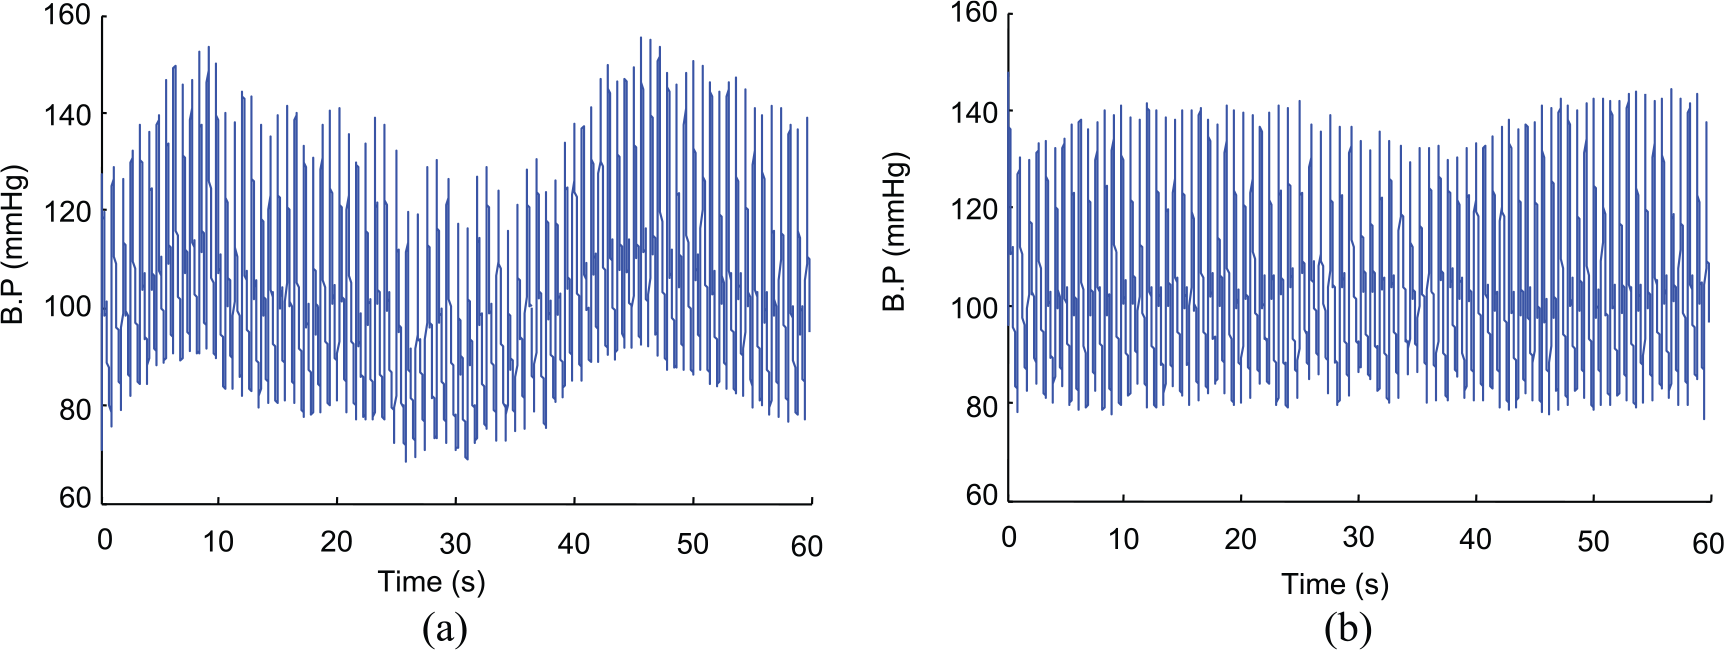
(a) BP pulse with baseline wander and (b) filtered BP pulse
Detection of systolic peak and onset
Since BP pulse is nearly periodic and more sinusoidal in nature, most of the signal power is concentrated in a low-frequency range that includes the fundamental frequency, generally below 3.5 Hz in humans. 9 Figure 4 shows the Fourier spectrum of a BP pulse sampled at 250 Hz. As evident from Figure 4 , the Fourier spectrum of BP Pulse indicates a dominant frequency at 2.686 Hz, which typically represents the fundamental frequency of the BP pulse. This fundamental frequency component is extracted adaptively from the BP pulse using EWT. EWT is an adaptive signal processing technique used to find the oscillating modes in a given signal. It computes the boundaries from the Fourier spectrum of the signal and then constructs an adaptive wavelet filter bank based on the detected boundaries. For extracting a specific mode from the signal, an empirical wavelet function is designed with its frequency response centred on the frequency of mode. Thus, in order to extract the fundamental frequency component in the spectrum, the BP pulse is decomposed into three modes. For boundary detection, the two major maxima are detected in the Fourier spectrum and boundary is set as the mid-point between two maxima. Another boundary is set as the centre between origin and the first maxima (Refer Figure 4(b) for details). Once the boundary is specified, the modes are extracted using empirical scaling and wavelet functions. The BP pulse and the extracted modes are shown in Figure 5 . The second mode and BP pulse are shown collectively in Figure 6 .
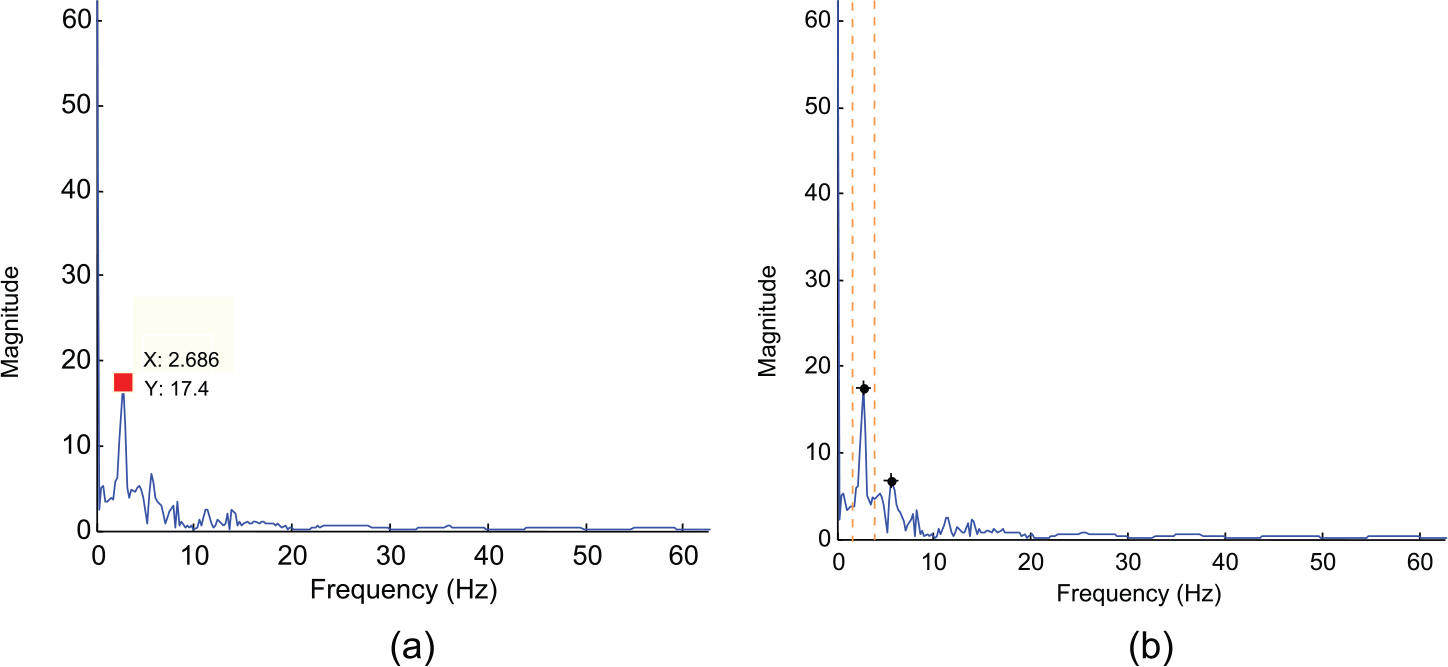
(a) Spectrum of BP pulse and (b) segmentation of Fourier spectrum
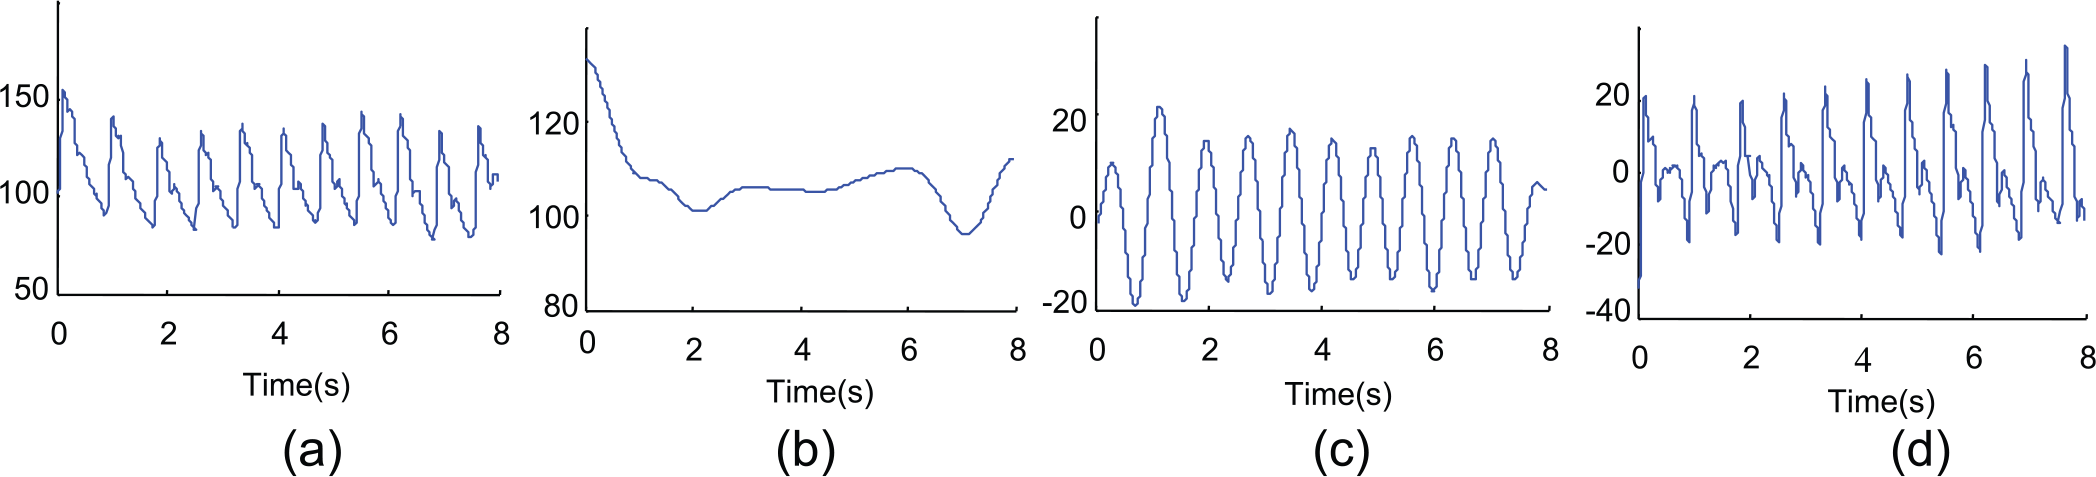
(a) BP pulse, (b) first mode, (c) second mode and (d) third mode obtained using EWT
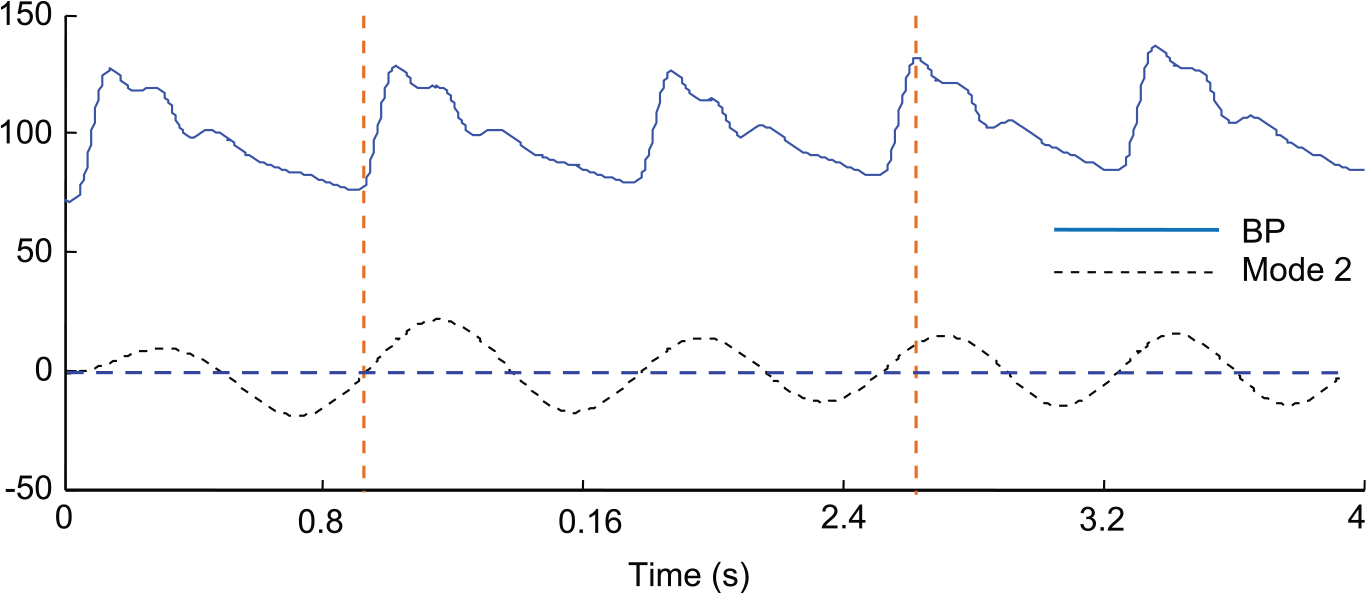
BP pulse with second mode of EWT
As can be seen from Figure 6 , the frequency of the second mode obtained through EWT decomposition is the fundamental frequency of BP pulse. Since this mode is almost a sinusoid, it is simpler to process it further. This mode is thus used in the further stages for detection of systolic peaks and onset. The algorithm first locates the maxima and zero-crossing points in the estimated mode. As observed, the alternate zero-crossing points in estimated mode and the onset in the BP pulse are almost aligned. Hence, these zero-crossing detections can be used for finding the time location of onset in BP pulse. The entire set of alternate zero-crossing points in the estimated mode is computed, and then, a series of differences between these locations is constructed. Then, a window function having a time span equal to half of the mean of the difference series is specified. For each alternate zero-crossing point, the algorithm then search for the minima of BP pulse within the window function centred on the zero-crossing point. The location of these minima represents the onset location. For systolic peak location, the algorithm locates the maxima of BP pulse within the window function centred on the maxima of estimated mode. Finally, corrections for erroneous points or missing points are employed as are generally applied in any beat detection methods; for example, in case of onset, if the difference between two consecutive onset locations is less than a threshold, the algorithm searches for other minima between current onset to next systolic peak location and the current location of onset is updated accordingly.
Detection of dicrotic notch
For dicrotic notch detection, the algorithm utilizes the first-order difference of the filtered BP pulse. The algorithm first computes the first-order difference of the filtered BP pulse. The first-order difference time series is then smoothed using Savitzky–Golay filter. 19 Savitzky–Golay filter is a method of data smoothing based on local least-squares polynomial approximation. 19 The first-order difference of the BP pulse and the smoothed version of it are shown in Figure 7(a) and (b) , respectively. Figure 7(c) shows a smoothed first-order difference and original BP pulse. For finding the dicrotic notch, we utilize the first-order difference signal along with the locations of systolic peaks and onset. For every detection of the onset in BP pulse, we again set a window with a time duration from the location of preceding systolic peak to the mid-point between systolic peak and current onset (Refer to Figure 7(c) ). The algorithm then locates the major maxima in the smoothed first-order time series within this window (marked with “+” sign in Figure 7(c) ). Finally, the algorithm locates the nearest minima in the BP pulse from this maxima towards the preceding systolic peak. This minima locates the dicrotic notch in the BP pulse. If no minima are detected, the algorithm then locates dicrotic notch as the centre between the detected major maxima and the preceding minima in the smoothed signal.
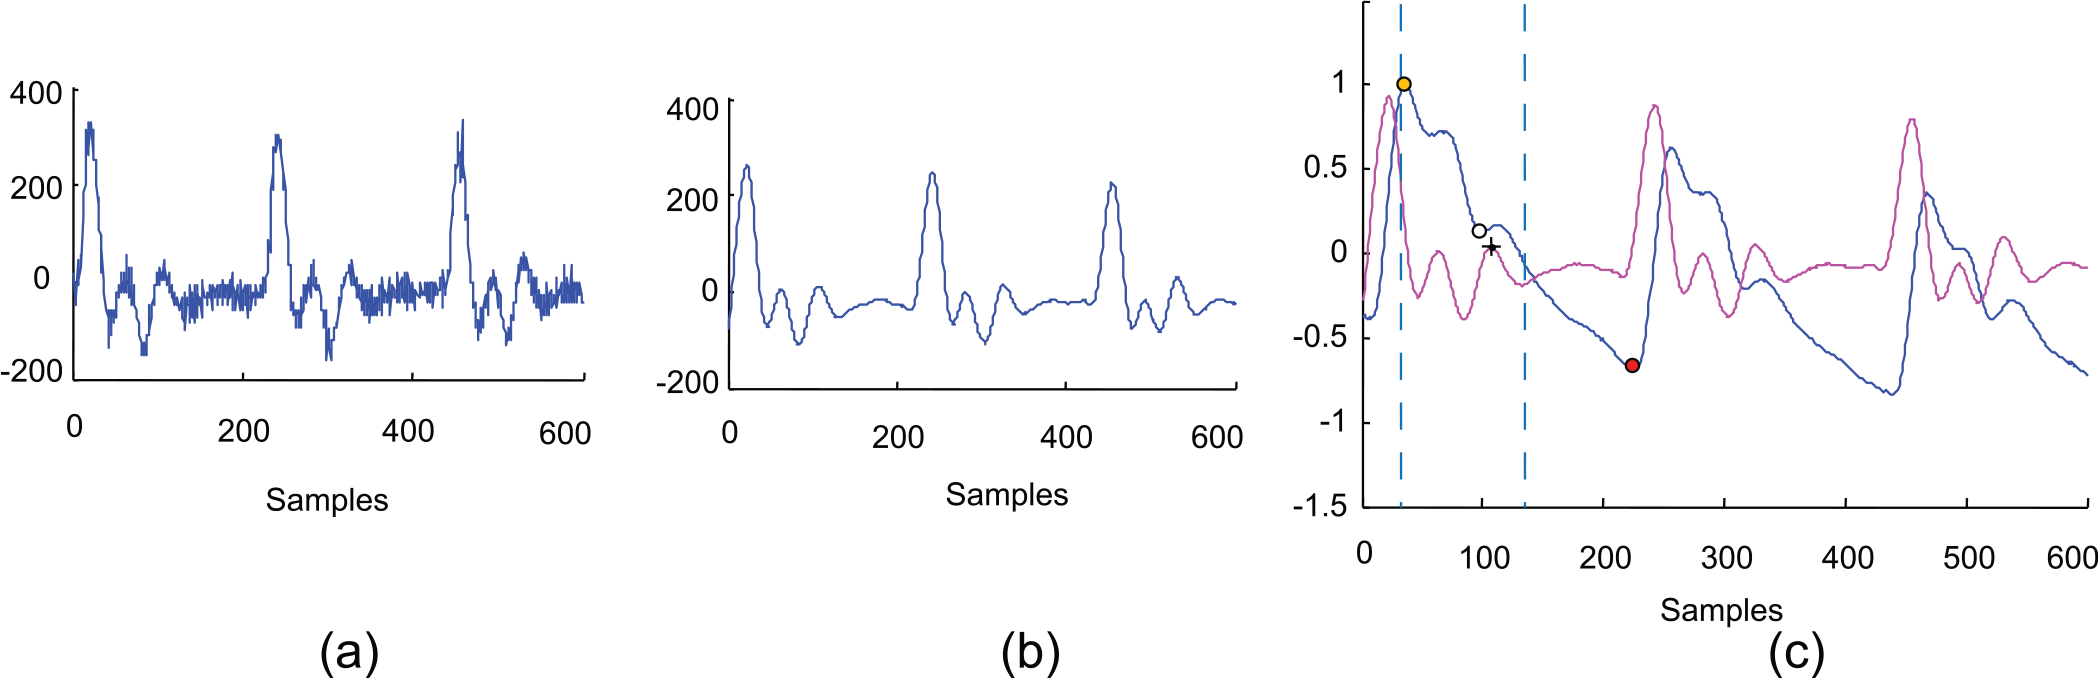
(a) First-order difference of BP pulse, (b) smoothed first-order difference and (c) dicrotic notch detection strategy
III. Results and Discussions
Several standard databases are accessible for the performance evaluation of beat detection algorithms. We have assessed the performance of our proposed algorithm on several databases available from PhysioNet (www.physionet.org). The various open-source databases used in this study include fantasia database, 20 MIT-BIH polysomnographic database, 20 MIMIC database 20 and computers in cardiology challenge 2014 training set 20 database freely available from PhysioNet. Fantasia database includes continuous recordings of electrocardiographic (ECG) and respiration signals of young and old rigorously screened healthy subjects. Some of these recordings also include an uncalibrated continuous non-invasive BP signal. Various physiological signals in fantasia database digitized at a sampling rate of 250 Hz. The MIT-BIH Polysomnographic Database includes a collection of multiple recordings of physiologic signals during sleep. The MIMIC Database includes data recorded from over 90 intensive care unit (ICU) patients. A training data set for computers in cardiology challenge 2014 was developed and is available on PhysioNet for study. It is a set of 100 records where each record includes multiple physiological signals. We have selected segments of 5- to 10-minute duration (generally used for short-term variability studies) from each signal. A total of 12,230 beats were selected from a data set of 25 subjects including 5 subjects from each database. For fantasia database, a total of 10 subjects (5 from each age group) were selected. The subjects for fantasia database include (f2o02, f2o04, f2o05, f2o09, f2o010, f2y01, f2y03, f2y04, f2y05 and f2y09), for MIMIC database (mimic220, mimic212, mimic221, mimic404, mimic037), for MIT-BIH polysomnographic database (slp01b, slp03, slp14, slp16, slp32) and for computers in cardiology challenge 2014 training set (100,103,107,109,111) were considered.
In all these databases, there are no reference annotations for dicrotic notches. The BP pulses were manually annotated by a group of trained cardiologists. By means of such well-annotated database, it is then possible to fully evaluate the delineator with regard to the systolic peaks, onset and dicrotic notches. The confidence interval was limited within ±2 samples. Thus, if the difference between the detected location and the annotated one is within ±2 samples, the algorithm treats it as true positive (TP). Finally, the evaluation was assessed using two standard benchmark parameters: sensitivity (Sen) and positive predictivity (Pre)


where TP stands for the number of true positives, FN for the number of false negatives and FP for the number of false positives. The overall performance of the proposed algorithm is presented in Table 1 .
Performance evaluation of the proposed algorithm
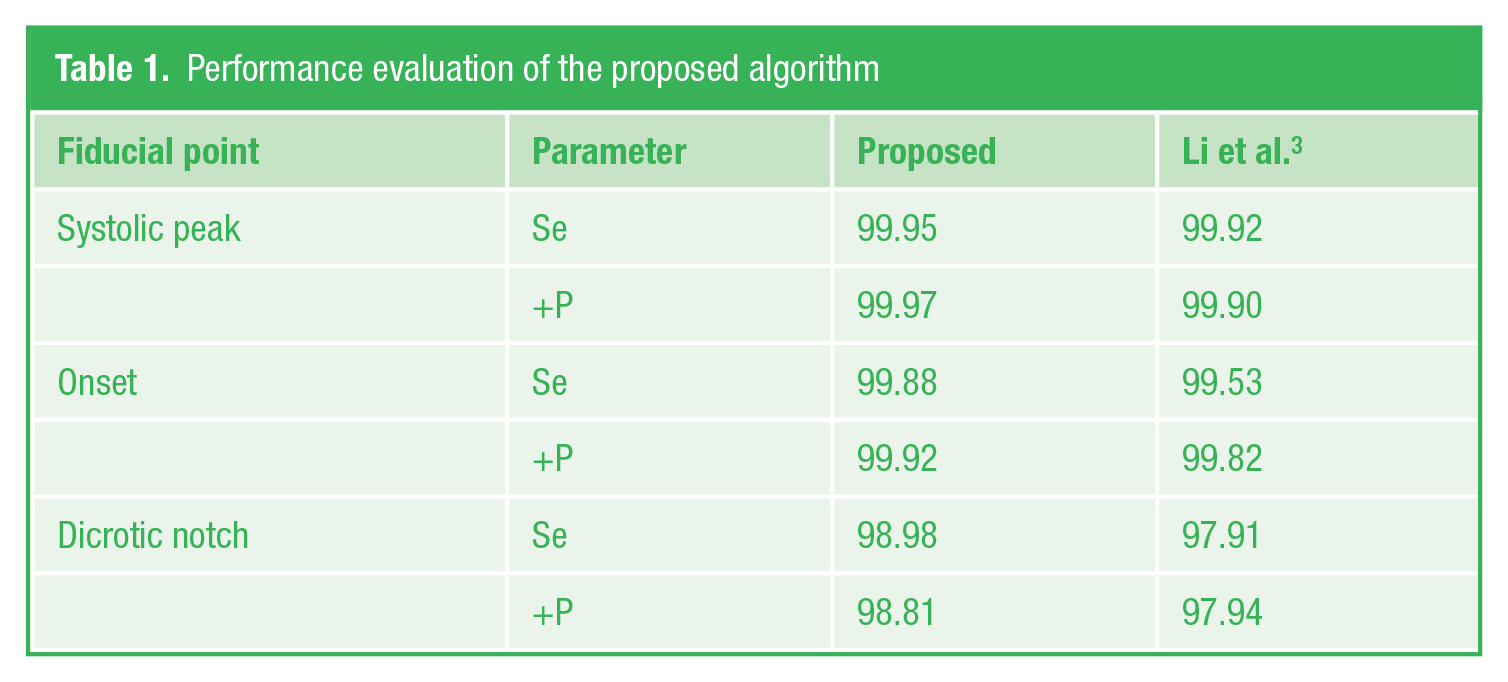
The performance of the proposed algorithm is also compared with a reference BP pulse delineator. 3 As evident from Table 1 , the proposed algorithm delivers a better performance. Figure 8(a) and (b) shows the comparison of proposed method with reference delineator 3 for a young subject f2y09 from fantasia database.
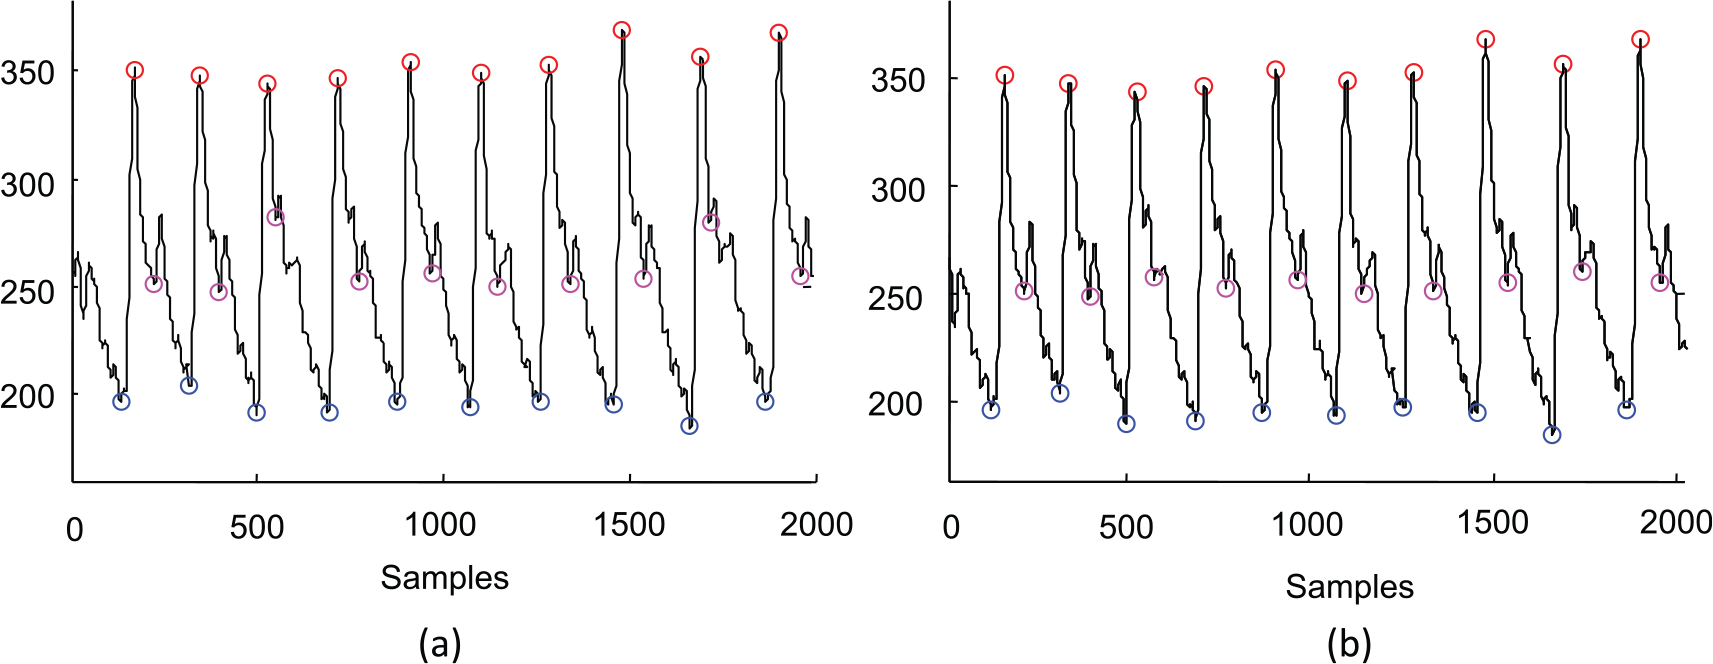
Detected fiducial points in record f2y09 from fantasia database using (a) reference delineator 5 and (b) proposed algorithm
It can be observed from Figure 8 that the reference delineator 3 is not able to locate all the dicrotic notches accurately. In Figure 9 , we have shown the performance of the proposed algorithm for a subject mimic037 from MIMIC database and compared it with the reference delineator. 3 As seen in the details (zoomed) view, the proposed algorithm accurately locates all the fiducial points, whereas the reference delineator does not locate the dicrotic notches accurately. The proposed algorithm thus gives a better performance in terms of sensitivity and positive predictivity. In Figure 10 , we have estimated the DPV for a young and an old subject from fantasia database using the proposed methods.

Detected fiducial points in record mimic037 from fantasia database using (a) reference delineator, 5 (b) details of ‘a’, (c) using proposed algorithm and (d) details of ‘d’
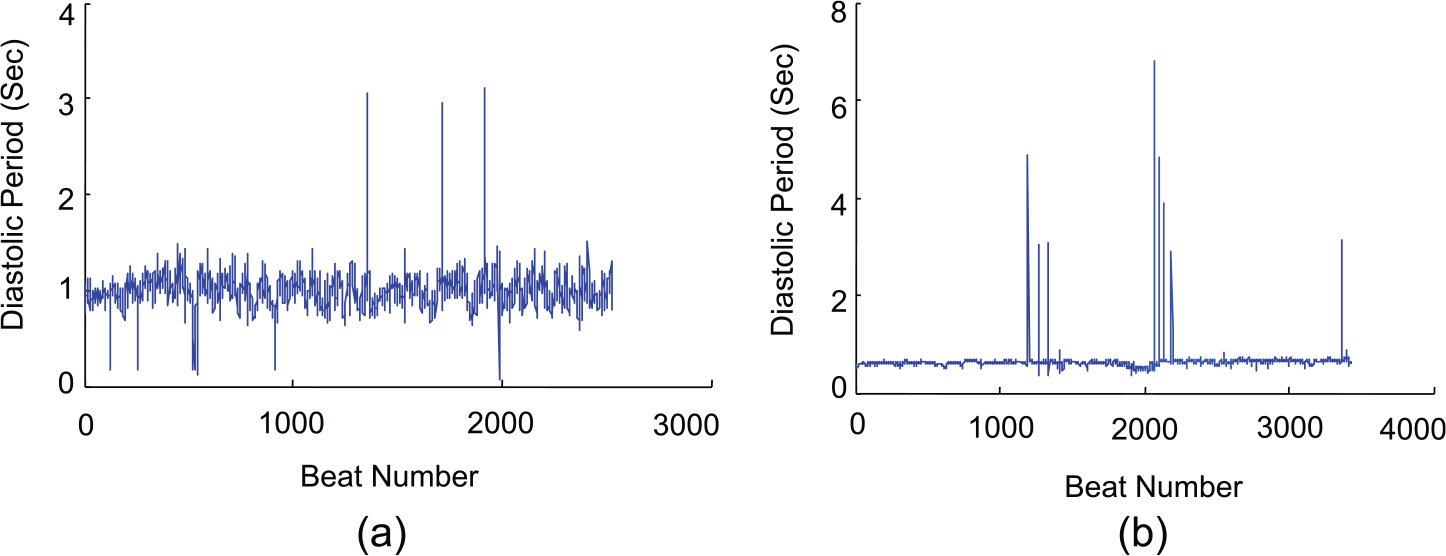
Diastolic period variability time series for (a) young subject from fantasia database and (b) an old subject from fantasia database
IV. Conclusion
We have presented a new approach for computing DPV from BP pulses. The algorithm uses a recently developed EWT algorithm for finding the systolic peak and onset. For dicrotic notch detection, it utilizes the first-order difference. The proposed algorithm was tested on various open-source data sets from PhysioNet. The performance of the algorithm was evaluated using two benchmark parameters: sensitivity and positive predictivity. The proposed delineator attained a sensitivity and positive predictivity of 99.95% and 99.97%, respectively, for systolic peaks. For onset, it attained a sensitivity and predictivity of 99.88% and 99.92%, respectively. For dicrotic notches, a sensitivity and positive predictivity of 98.98% and 98.81% were achieved. The performance of the proposed algorithm was also compared with other existing methods. The proposed algorithm delivers a better performance and hence can be reliably used for DPV estimation.
Footnotes
Funding
The author(s) received no financial support for the research, authorship and/or publication of this article.