
Abstract
Dissolved gas analysis of transformer insulating oil is considered the best indicator of a transformer’s overall condition and is most widely used. In this study, a Bayesian network was developed to predict failures of electrical transformers. The Duval triangle method was used to develop the Bayesian model. The proposed prediction model represents a transformer fault prediction, possible faulty behaviors produced by this transformer (symptoms), along with results of possible dissolved gas analysis. The model essentially captures how possible faults of a transformer can manifest themselves by symptoms (gas proportions). Using our model, it is possible to produce a list of the most likely faults and a list of the most informative gas analysis. Also, the proposed approach helps to eliminate the uncertainty that could exist, regarding the fault nature due to gases trapped in the transformer, or faults that result in more simultaneous gas percentages. The model accurately provides transformer fault diagnosis and prediction ability by calculating the probability of released gases. Furthermore, it predicts failures based on their relationships in the Bayesian network. Finally, we show how the approach works for five distinct electrical transformers of a power plant, by describing the advantages of having available a Bayesian network model based on the Duval triangle method for the fault prediction tasks.
I. Introduction
Transformers are electrical devices widely used in electric power production, transmission, and distribution. Since they are vital, their availability is highly required and their monitoring must be rigorous and efficient. Depending on the case, it is desirable to put transformers under monitoring to decide to intervene when a certain threshold is reached. But controls remain systematic and are part of non-destructive testing means. This monitoring process is part of the conditional preventive maintenance, which is performed by taking relevant measurements on the equipment in operation. One of these measurements and techniques is the dissolved gas analysis (DGA) method which is essentially based on monitoring the changing proportions of the gases contained in the dielectric transformer oil. The definition of precursor gases, relevant indicator of the rate of transformer degradation, and the design of monitoring and control means of these precursors for the DGA technique was subject to several papers and research work. 1 The detection of exceeding a threshold assigned to the evolution of a dissolved gas starts the diagnosis of the causes of the failure. The conclusions of this diagnosis allow defining the intervention of maintenance.
Predictive maintenance of electrical transformers is a preventive maintenance subordinate to the analysis of the evolution of released gases proportions, which are significant indicator of degraded operation of the equipment. Predictive maintenance differs from conditional maintenance only by the idea to deduce the tendency of dissolved gases evolution. At this level, computer science takes an essential place especially in prediction of gases dissolved in oil and diagnosis of transformer failures. Artificial intelligence methods are an integral part of computing tools intended for this type of maintenance. 2 From the prediction, it is possible to extrapolate the tendency of a fault to plan its date. From this forecast, the date of diagnosis and triggering the maintenance work is planned, so that this last is completed before the required level for the studied parameter is exceeded.
In practice, the analysis of dissolved gases in oil is the key to a successful predictive maintenance program, and beside it the analysis of physicochemical and dielectric parameters. The water content has a negative impact on the breakdown voltage of dielectric oil. Corrective actions are required when a predetermined permissible threshold of one of the two parameters is exceeded because they are directly related to the ability of the oil to isolate. 3
It must be emphasized that it is well known in the industry that many laboratories provide reasonably accurate DGA results to their customers but that many others provide quite inaccurate results. Even the best laboratories produce results with some inaccuracy, which, therefore, needs to be known to determine the reliability and accuracy of the diagnosis. It is strongly recommended that each laboratory evaluates and provides its own accuracy figures. When this is not possible, fault accuracy values based on international surveys can be used.
In this context of uncertainty and inaccuracy results, several artificial intelligence methods have been used to improve the accuracy of results and remove the uncertainty inherent in the diagnosis and reliability of data (fuzzy logic, artificial neural networks, support vector machine (SVM), evolutionary algorithms, expert systems). 4 A review of the artificial intelligence methods conducted by Sun et al. 2 has shown the effectiveness of these tools in the diagnostic field of fault of electrical power transformers. The literature shows that most authors have been concentrated on the DGA in oil for fault diagnosis.5–7 Prediction is one of the most successful applications of Bayesian networks (BNs). The ability of probabilistic knowledge representation techniques to perform a mixture of both predictive and diagnostic inference makes it very suitable for prediction. 8 BNs can perform fusion of observations such as predispositions and risk factors with symptoms and test results.
From this overview, it is possible to conclude that the reliability of data, the poor input data used in the models, and uncertainty are the major and joint constraints of all methods and tools used in DGA. The BN model proposed in this paper is generated on the basis of a mapping of the Duval triangle into BN. It represents a powerful tool in uncertainty reasoning and it can identify the problem of lack of samples due to high cost of analysis and long intervals between analyses (the analysis is performed yearly in most predictive maintenance programs). This lack of samples causes mainly the poor data and the inaccuracy of diagnosis. The BN represents a little-used artificial intelligence tool in the diagnosis and prediction of transformer failures. They are mainly based on the experience feedback and the experimental data. The objective of the Bayesian Duval triangle method, which will be presented in this paper, is to give more flexibility to the Duval triangle method and expand its scopes.
The remainder of this paper is organized as follows: section II provides a brief review on different methods and tools used in the diagnosis and prediction of transformer failures. In section III, Bayesian reasoning is presented. Section IV is devoted to the research methodology for faults transformer prediction. Before finishing this paper by giving some conclusions in section VI, an application of our approach on the five electrical transformers of a power plant is presented in section V.
II. DGA and the Duval Triangle
The transformer fault involves a release of gases due to the effects of heat and intense electrical field. The DGA method allows detection of these gases, even in low percentage, the occurrence of a fault in the transformer allows releasing of one or more gases. DGA technology allows for early detection of fault and avoids other faults to have birth. There are seven types of key gases which are hydrogen (H2), methane (CH4), ethane (C2H6), ethylene (C2H4), acetylene (C2H2), carbon monoxide (CO), and carbon dioxide (CO2). The concentrations of various gases provide information about the nature of the fault (thermal or electrical). Also, the evolution of these concentrations provides information on the fault severity.
The majority of methods used nowadays for fault transformer diagnosis based on DGA can be found in IEEE C57.104 9 or IEC 60599 guides, 10 as well as in other national or international guides based on these two. These traditional and universal diagnosis methods are 2 Key Gas Method, Dornenburg Ratio Method, Rogers Ratio Method, Nomograph Method, IEC Ratio Method, Duval Triangle Method, CIGRE Method, and recently Duval Pentagon as a complementary tool for the interpretation of DGA. 11 In the remainder of this paper, only the Duval triangle method is detailed.
The Duval triangle method uses values of three gases CH4, C2H4, and C2H2 and their location in the triangle. 12 To plot this triangle, gases are transformed into triangular coordinates ( Figure 1 ). The three detectable fault types are partial discharges, electrical faults (high and low energy arcing), and thermal faults (hot spots of various temperature ranges) and are presented by fault zones. Although this method is easily performed, careless implementation can obtain false diagnosis since no region of the triangle is designated as an example of normal aging.
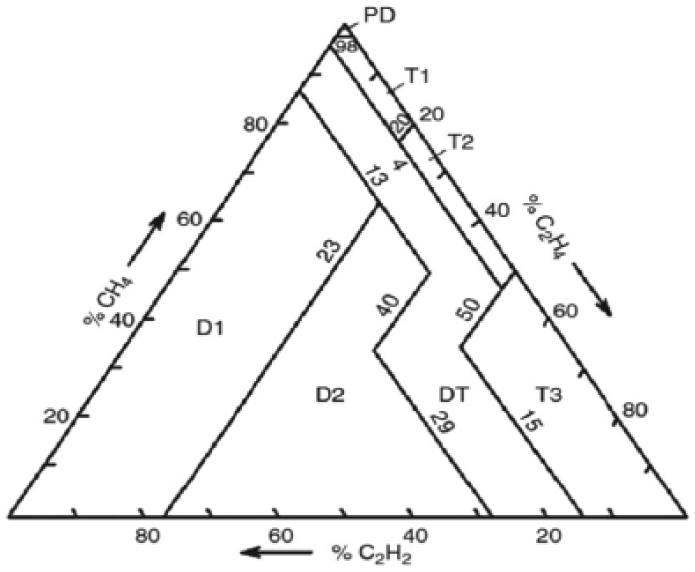
Duval triangle coordinates
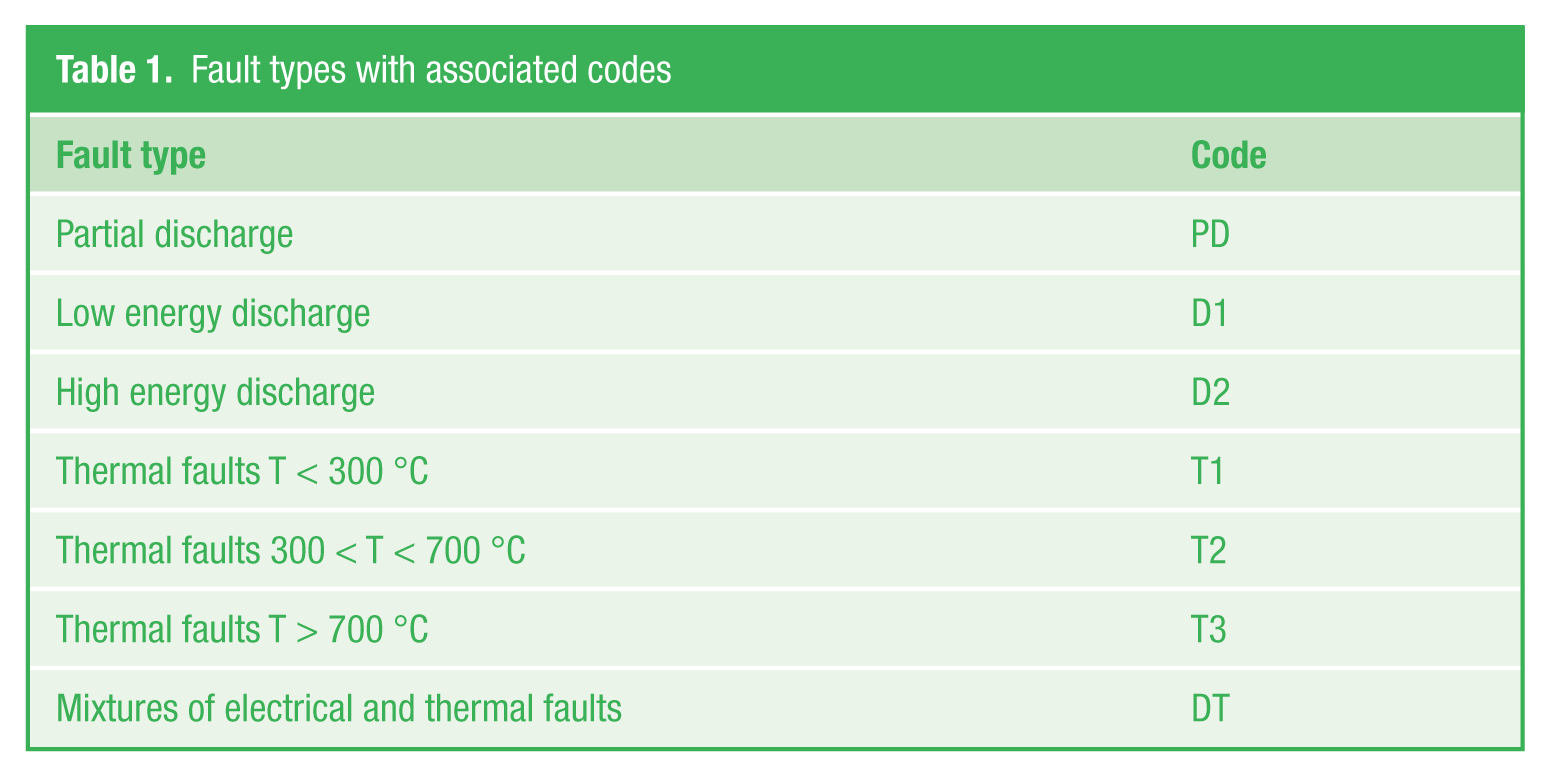
Table 1 classifies the fault types and the codes addressed in this paper.
Fault types with associated codes
The Triangle coordinates corresponding to DGA results in ppm can be calculated as follows:
%C2H2 = 100 x/(x + y + z);
%C2H4 = 100 y/(x + y + z);
%CH4 = 100 z/(x + y + z).
with x = (C2H2); y = (C2H4); z = (CH4), in ppm.
Duval triangle method is a fault diagnosis tool; the question is how to make it a prediction tool?
III. Bayesian Reasoning
Probabilistic and inferential reasoning of experts leads naturally to the use of BNs in order to represent their knowledge and automate their reasoning. Many other representation techniques could be used (Fault Tree, fuzzy logic, expert system, decision tree, etc.), but the preference is given to BNs more particularly to their versatility. In this case, we can use the same model for diagnosing failures (causes → symptoms), or to make predictive analysis (symptoms → causes).
The interest of BNs also resides in their ability to take into account several types of information (subjective information from experts and those from the statistical treatment of data) in the same model. Finally, the graphical representation of BNs is intuitive and understandable by a non-specialist. This explains their use more and more in the medical and industrial field in important and very specific subjects where they show encouraging results. 13
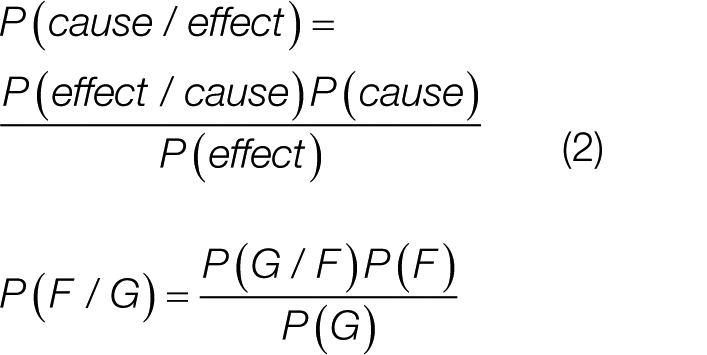
A BN is a system representing knowledge and for calculating conditional probabilities and which provides solutions to different sorts of problems. A Bayesian model used for faults diagnosis is a direct application of Bayes’ theorem. Inversely, a Bayesian prediction model can be developed by applying the inverse Bayes’ theorem for predicting failures ( Figure 2 ). In this context, the Bayesian reasoning is a probabilistic reasoning that is completely defined by a causal graph, so a BN is defined by:
A directed acyclic graph (DAG), G = (V, E) where V is the set of nodes of G, and E the set of edges of G;
A finite probability space (Ω, Z, p);
A set of random variables associated to the nodes of the graph and defined by (Ω, Z, p) such that
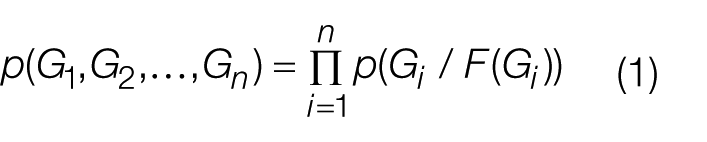
where F (Fault) is the set of causes Gi (Gas) in the graph G.
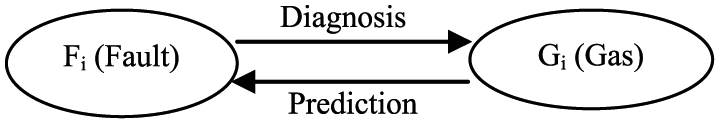
Simple BN for fault diagnosis prediction
Once this formulation is made, Bayes’ theorem gives immediately the required probabilities. For a transformer fault (F) and a released gas (G), provided that P (G) ≠ 0
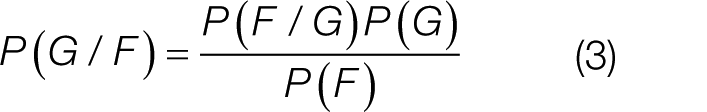
Bayes’ theorem can reverse the probabilities. This means that if the released gases are known due to a transformer fault, observing the symptoms can predict failures
These rules can be extended to several variables with multiple states. The graph shown in Figure 2 is called the “structure” of the model and the probability tables its “parameters.” Structure and parameters can be provided by experts or calculated from data.
IV. Proposed BN Model for Electrical Transformer Fault Prediction
The presented Bayesian Duval triangle is built using a combined method. In this approach, the network structure is described by mapping the Duval triangle into BN and the parameters are given with the help of the maintenance staff and the history of failures. This mapping takes into account the different thresholds for defining multiple states; each state corresponds to a threshold. The probabilities are obtained from results of DGA. The links will go from symptom of the failure, and according to the a priori probabilities of gases and by inference in the BN, it is possible to calculate the a posteriori probabilities of each fault. Once the structure of the Bayesian causal map has been constructed, numerical parameters of the network need to be assessed so that results can be calculated. These calculations are typically embedded inside Bayesian model.
A. Mapping the Duval triangle into BN
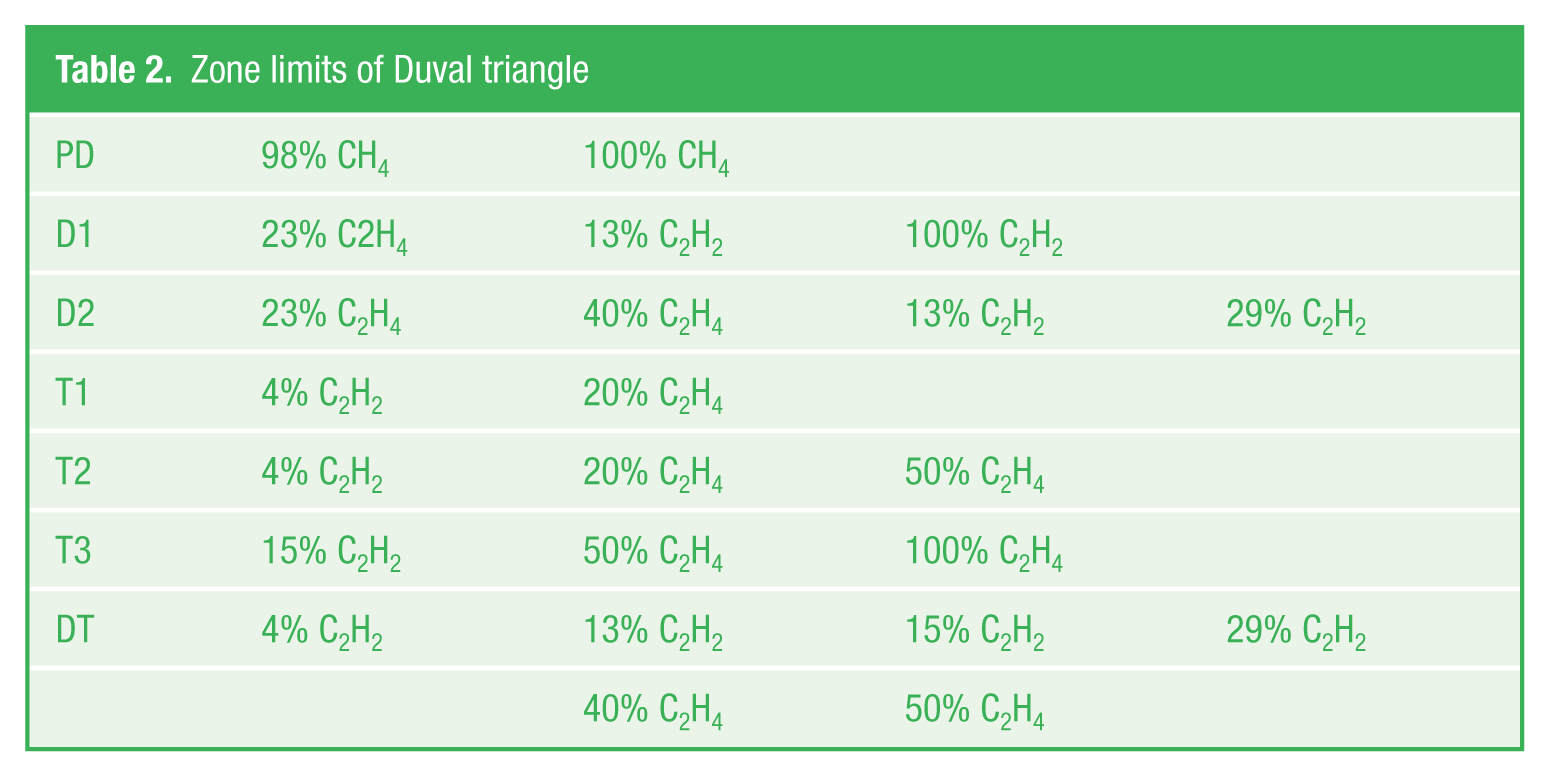
The coordinates and limits of the discharge and thermal fault zones of the Triangle are indicated in Figure 1 . Zone DT in Figure 1 corresponds to mixtures of thermal and electrical faults. To map the Duval triangle into BN, Figure 1 must translate in a table that gives the limits of each fault, which are summarized in Table 2 .
Zone limits of Duval triangle
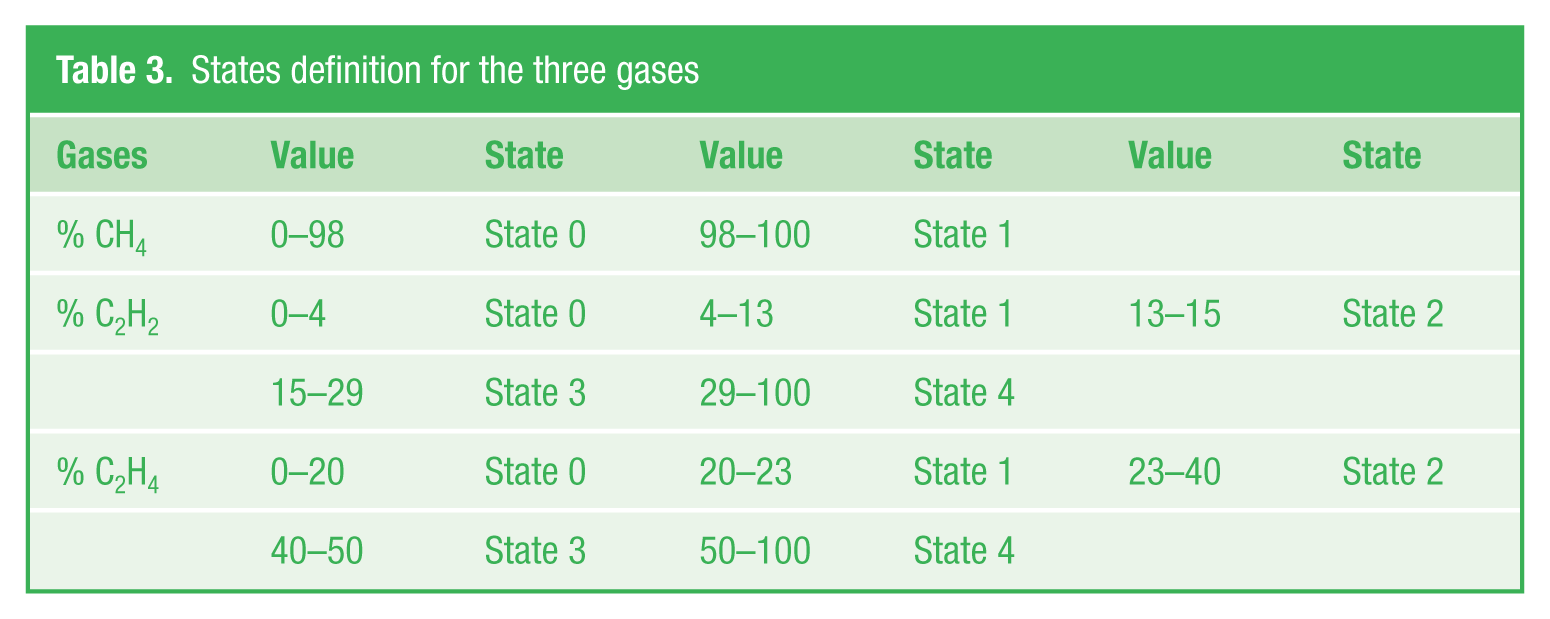
The model structure has three input variables representing the three percentages of gas: %C2H2, %C2H4, %CH4, with these specific states ( Table 3 ). The various failures will be modeled by seven output variables in the model (fault type) ( Figure 3 ). The input data in the model are the probability of existence in the sample of each gas percentage. While the output data will be calculated by inference in the network, which immediately provides a predictive probability of the fault occurrence.
States definition for the three gases
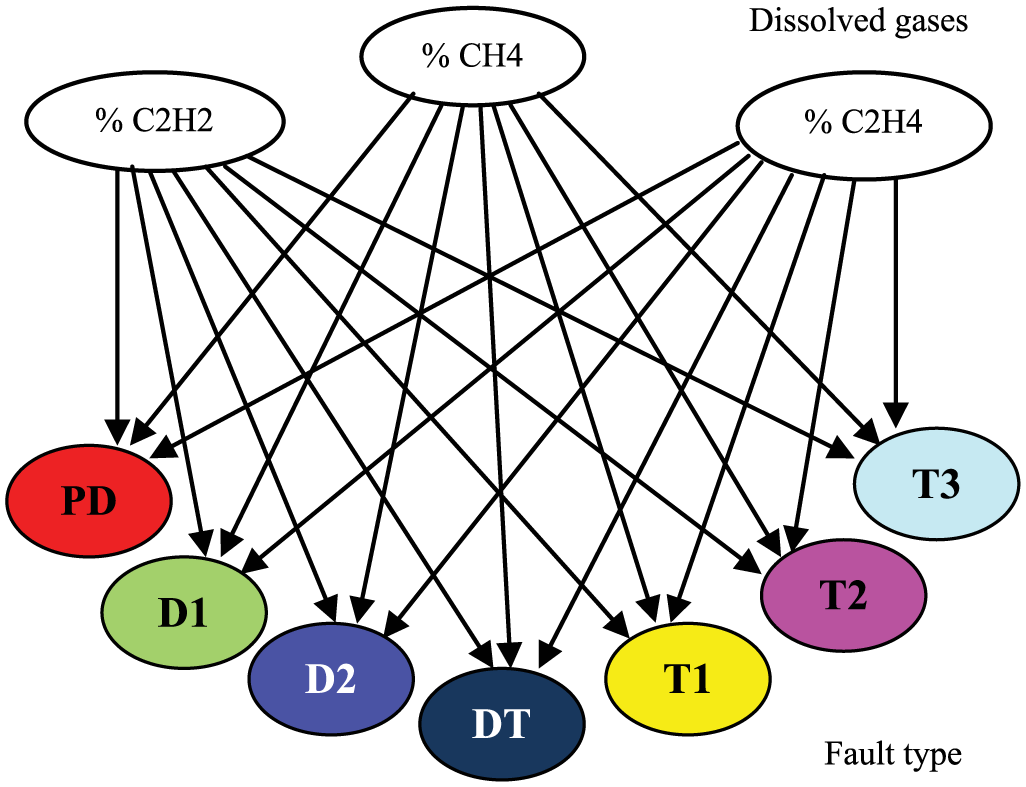
BN model for Duval triangle method
From Table 2 , we find that the three gases can take several values. However, Table 3 defines the different states corresponding to different values.
B. The coordinates of Bayesian Duval triangle
In this new Bayesian formulation, Table 4 gives the limits for each fault type.
Zone limits of Bayesian Duval triangle
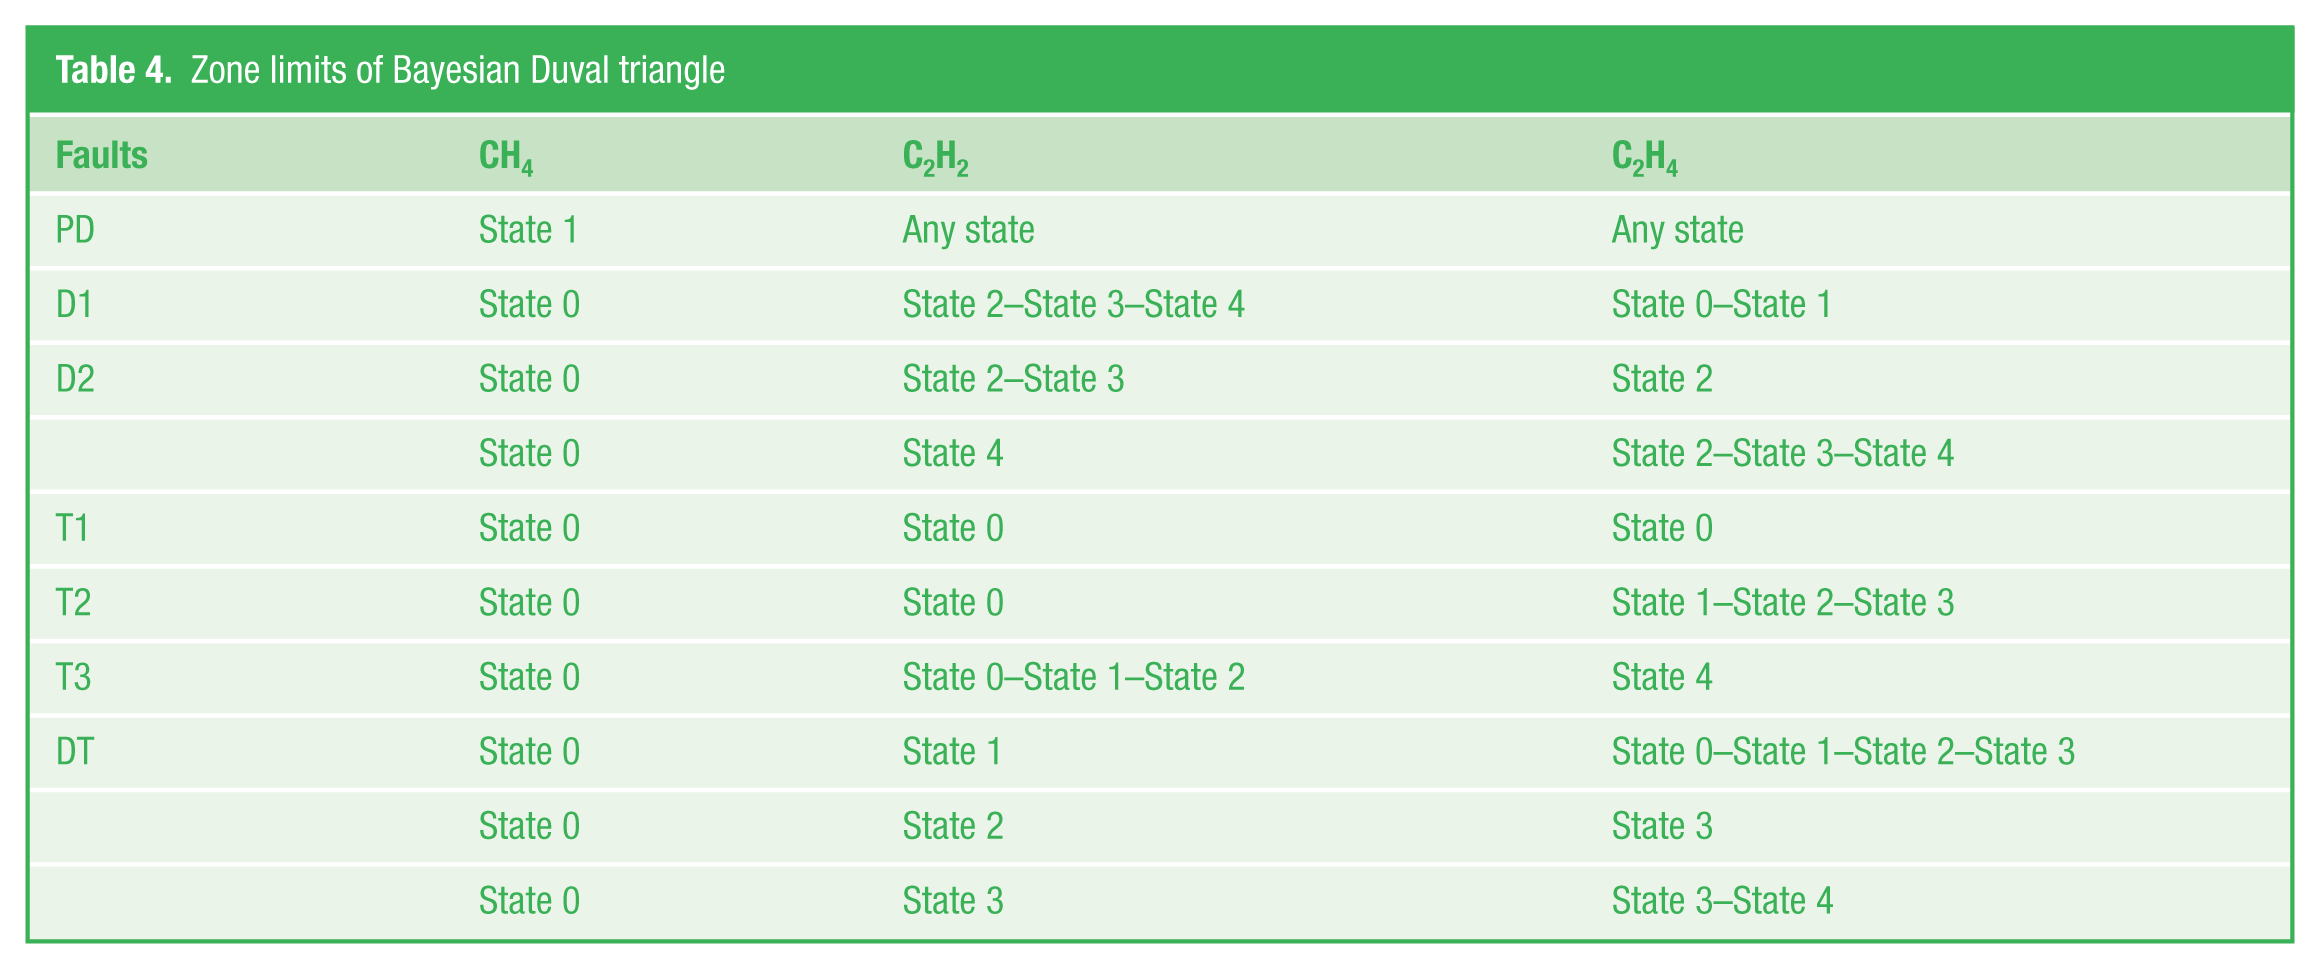
The new coordinates of the discharge and thermal fault zones of the Triangle are indicated in Figure 4 .
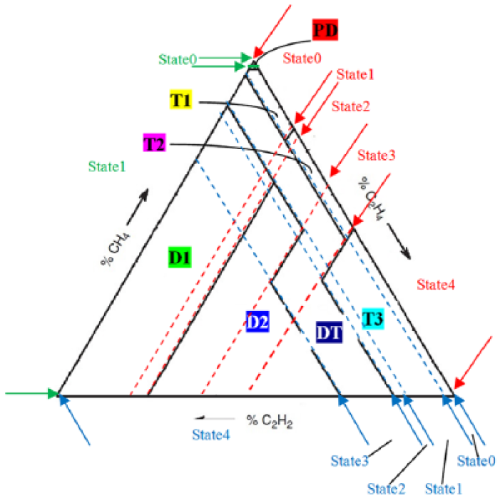
Bayesian Duval triangle coordinates
The conditional probability table (CPT) gives definition of causal links in the new formalism presented in Table 4 . For example, Table 5 shows the CPT for the fault: partial discharge (PD).
CPT for partial discharge fault
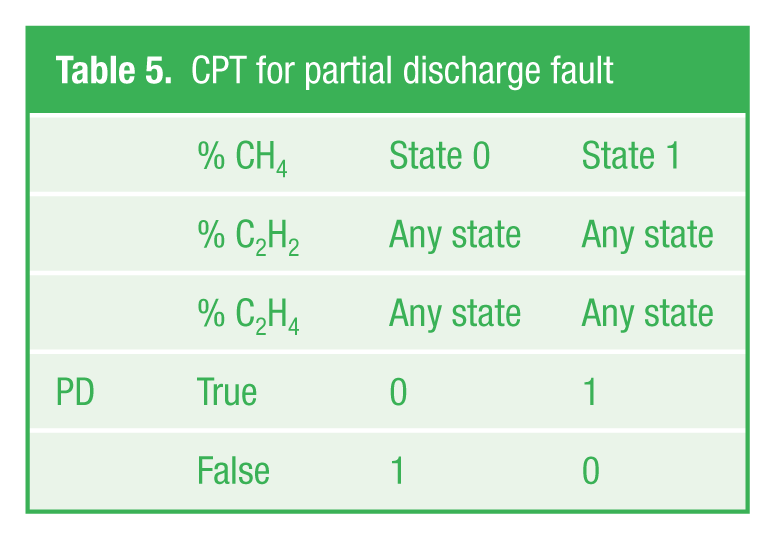
The inference rules are given by the CPT. Some readings are as follows:
If C2H2 takes all states from State 0 to State 4 and C2H4 takes all states from State 0 to State 4 and CH4 takes State 1, then fault is PD.
If C2H2 takes all states from State 0 to State 4 and C2H4 takes all states from State 0 to State 4 and CH4 takes State 0, then fault is not PD.
If C2H2 takes State 2 or State 3 or State 4 and C2H4 takes State 0 or State 1, then fault is D1.
If C2H2 takes State 0 and C2H4 takes State 1 or State 2 or State 3 then fault is T2.
If C2H2 takes State 1 and C2H4 takes State 0 or State 1 or State 2 or State 3 then fault is DT.
V. Case Study of Five Transformers
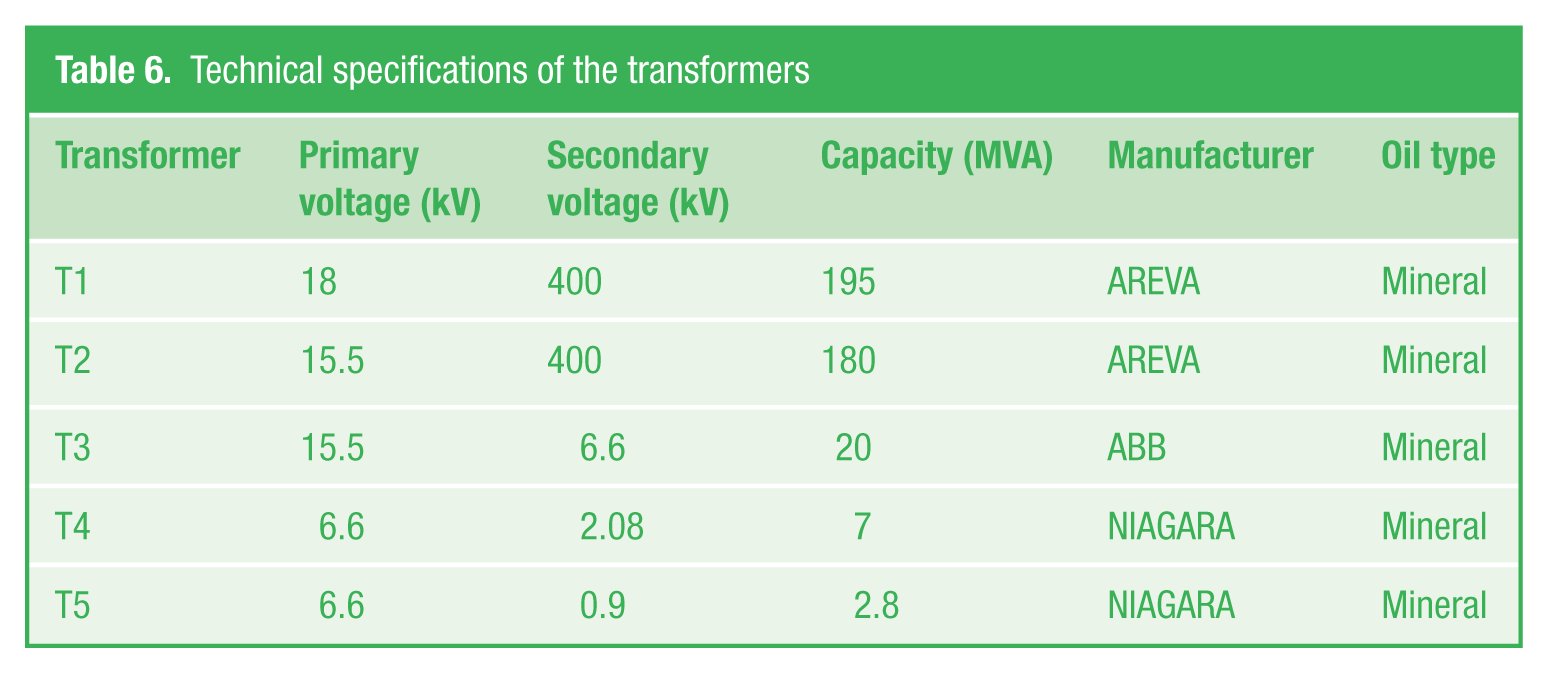
Analyses were performed for monitoring five transformers of power plant of the Algerian company of electricity production SONELGAZ/SKS/SNC LAVALIN, and their characteristics are given in Table 6 .
Technical specifications of the transformers
An extract of the analysis results made between 2008 and 2012 for the man transformer T1 is given in Table 7 . DGA was carried out on a sample at the Buchholz. The sample was taken after significant purging of pipe and Buchholz, to allow recovery of a representative sample from the transformer tank. For the year 2012, concentrations of dissolved gases in oil are below typical permissible values defined in the IEC 60599 standard. The unit is in proper and good operating condition. The history file shows values above typical values that require a diagnosis.
DGA for monitoring the transformer T1 according to IEC 60599
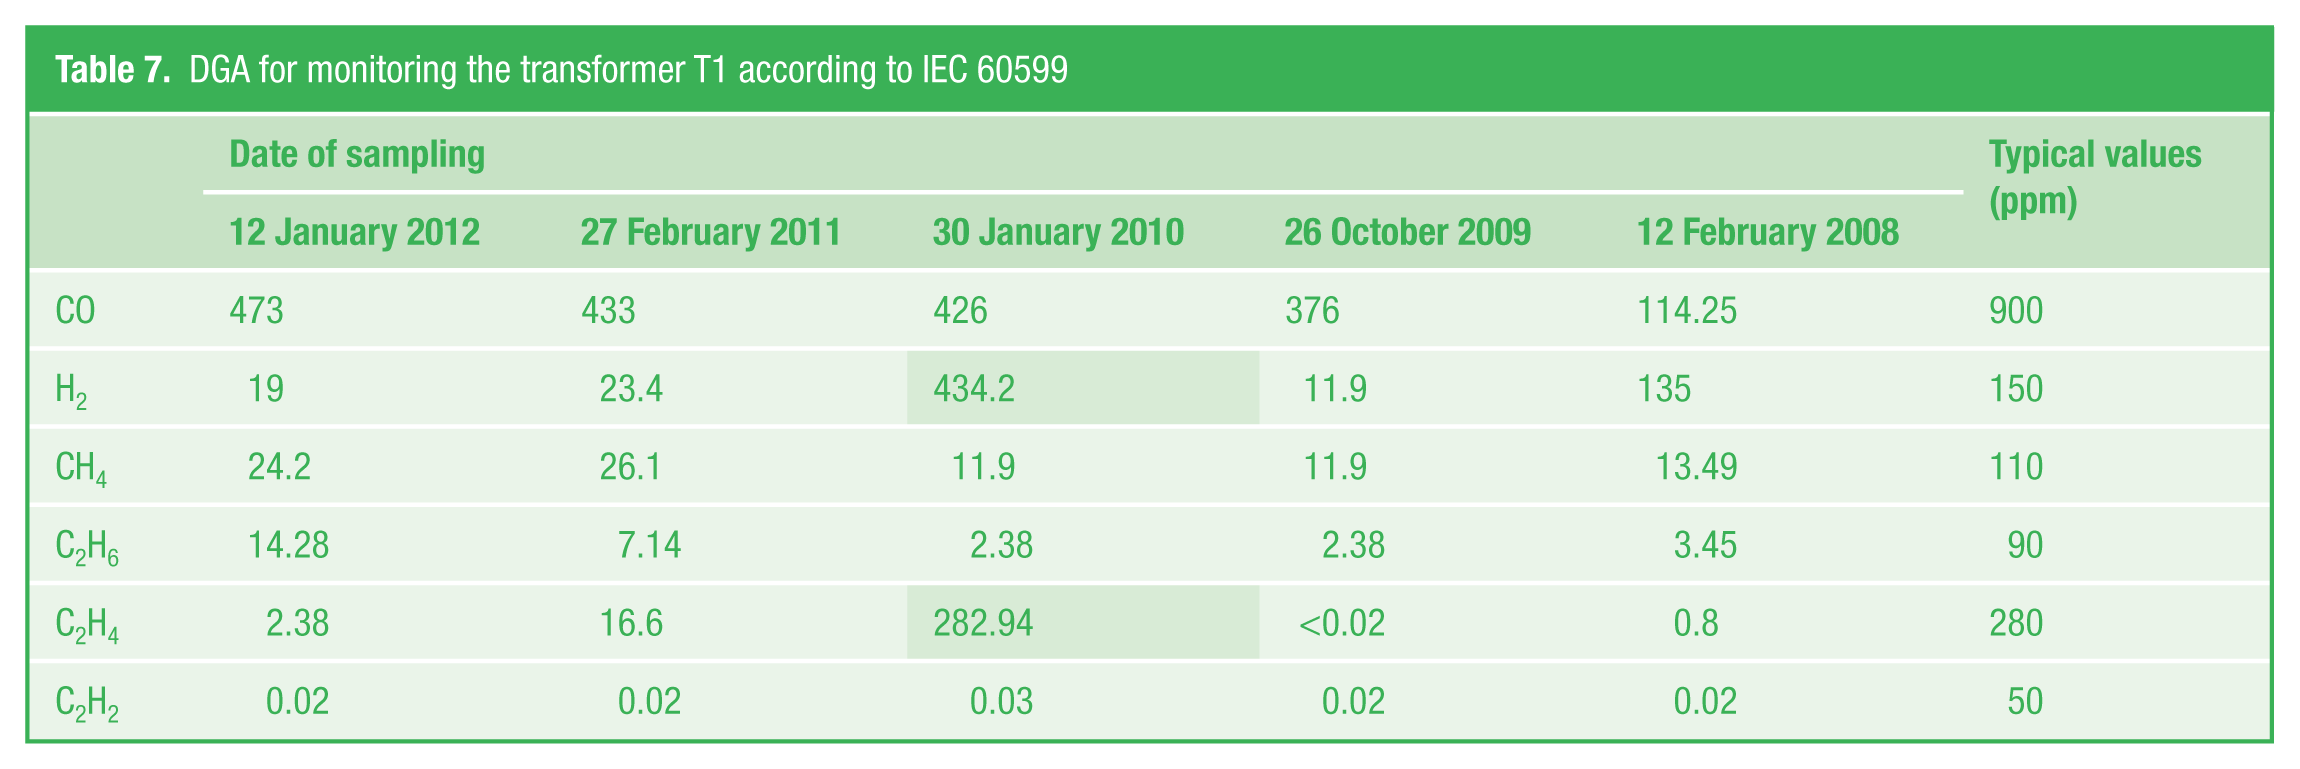
From Table 4 , we see a threshold overrun for H2 and C2H4 in 2010, for this purpose a diagnosis is needed. By applying the Duval triangle method, defined in section II, the percentages of the three gases CH4, C2H2, and C2H4 are calculated:
x (C2H2) = 0.02 ppm; y(C2H4) = 282.94 ppm; z(CH4) = 24.2 ppm;
%C2H2 = 100 x/(x + y + z) = 0.006%;
%C2H4 = 100 y/(x + y + z) = 92.114%;
%CH4 = 100 z/(x + y + z) = 7.878%.
By reporting the above percentages in the Duval triangle, the fault is of thermal nature T > 700 °C (T3), this was confirmed by consulting the history file of the transformer.
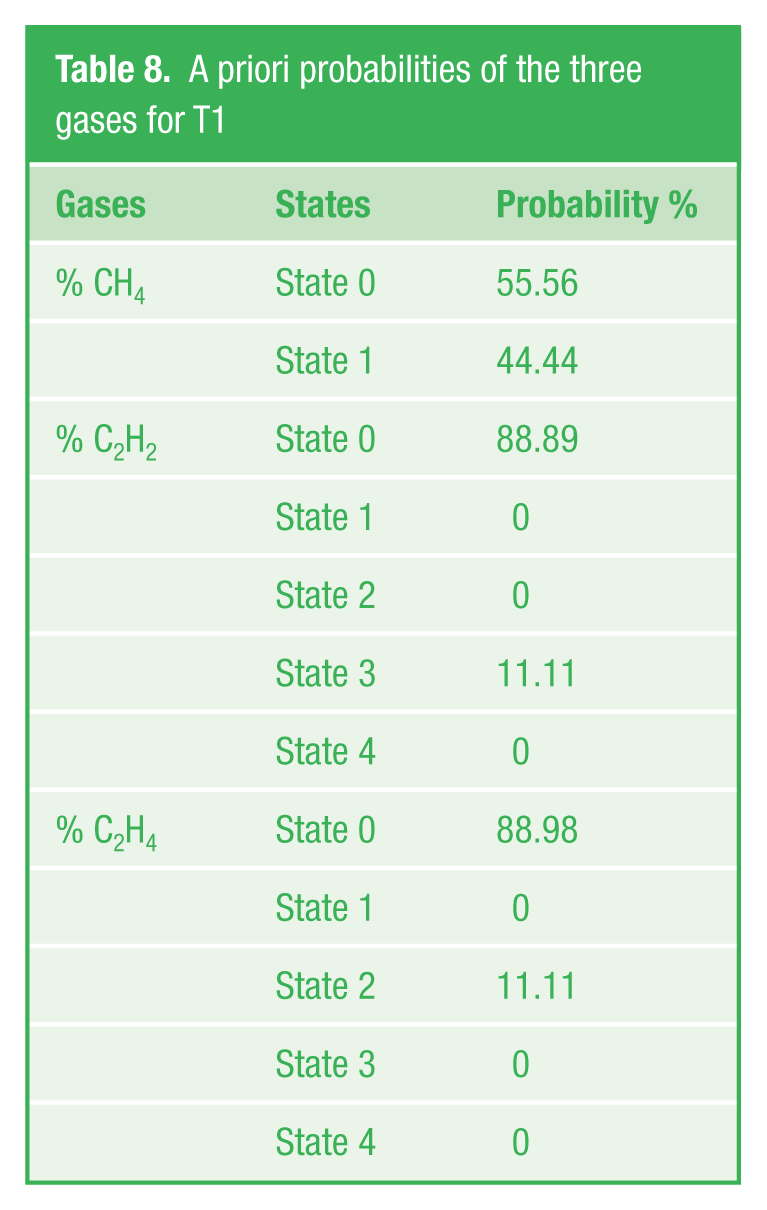
For fault prediction, the experience of diagnostic engineers, the history files of the operation of the transformers as well as the existing standards were considered as data sources to generate the prediction model. After determining the structure of the model, the a priori probabilities were generated from oil samples analysis and the statistical analysis of failure history data. Also the a priori conditional probabilities were provided by the presented approach. Transformer dielectric oil was analyzed 17 times on a yearly basis. Among the 17 analyzed samples, 09 are indicative of fault for T1, 06 for T2, 14 for T3, 11 for T4, and 06 for T5. The probabilities of existence of the three gases for T1 are taken as example and given in Table 8 .
A priori probabilities of the three gases for T1
Inference in the BN provides a posteriori probabilities and updates the results of fault prediction. Figure 5 presents the results prediction and assessment of failures for the five transformers.
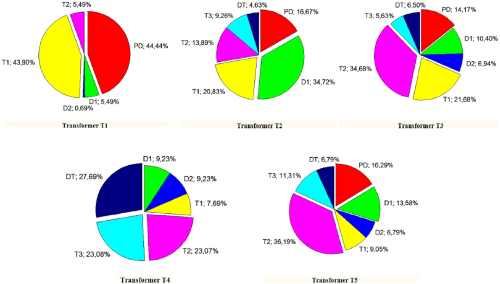
Prediction results for the five transformers
From Figure 5 , we find that for T1 the partial discharge fault is the most likely and then comes thermal faults T < 300 °C. For T2, the low energy discharge is the most likely, and so on. Following this analysis, it is recommended to target actions in order to predict these faults and minimize their occurrence likelihood.
It took 3 years (2013, 2014, and 2015) of transformers monitoring to validate our approach. The diagnosis results for the five transformers over the 3 years are given in Table 9 .
Fault diagnosis for validation of the Bayesian Duval triangle method
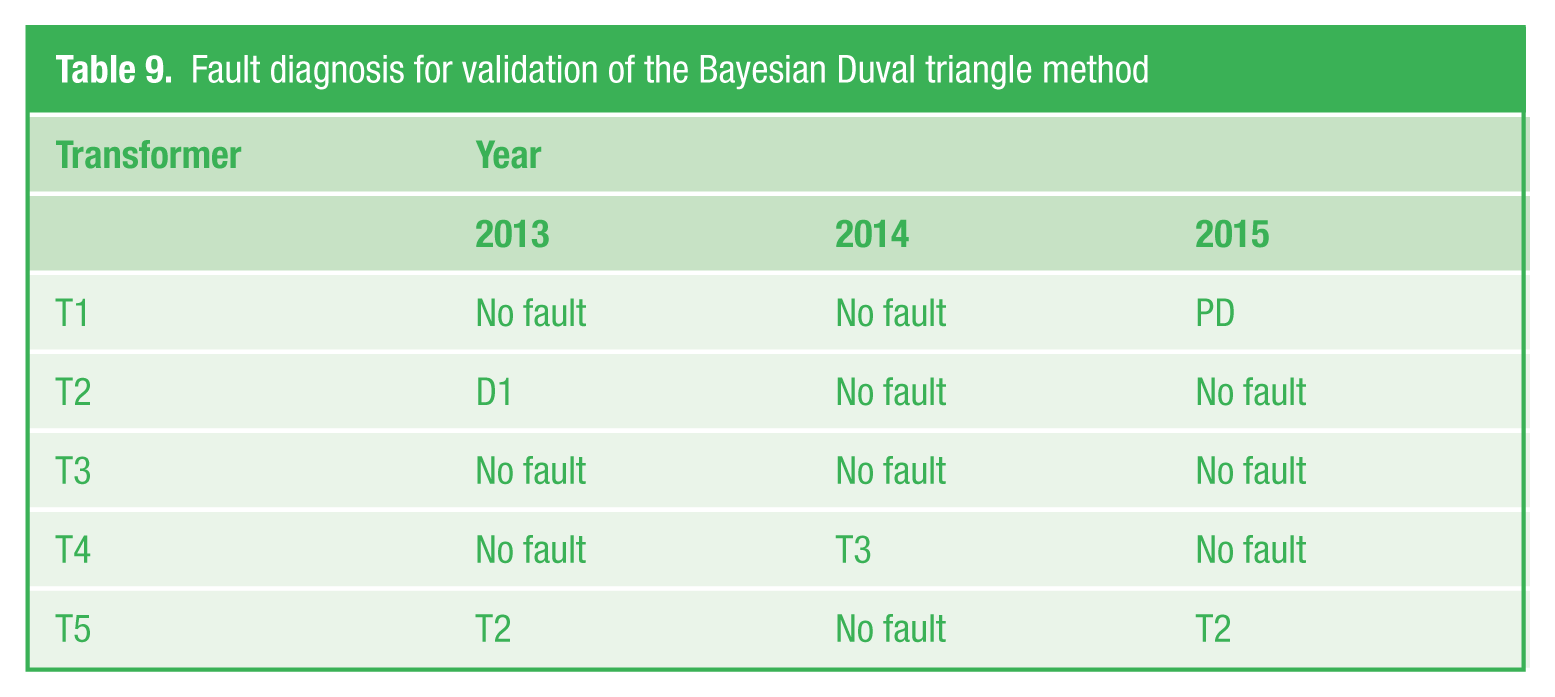
For the transformers T1, T2, and T5, monitoring shows accurate results; this qualifies the prediction to be very reliable. For the transformer T4, the method shows that the most likely fault is DT, whereas the real fault comes at the second position. Although, as illustrated in Figure 5 , second fault T3 and third fault T2 are both of thermal origin, which proves that they are very close to reality (T3), this is justified by a small gap. This method gave (gives) a good result despite the small size of the knowledge data base. Bayesian Duval triangle method examines all the past cases of the base corresponding to a fault and percentages of released gases. Then, each of the a priori probabilities will be updated. In other words, in the case where any new information is available, the a priori probabilities must be updated and the calculating of the a posteriori probabilities must be redone.
VI. Conclusion
In this paper, we have outlined a Bayesian approach for fault prediction of an electrical power transformer on the basis of DGA. After mapping the triangle of Duval into BN, we were able to define and quantify causal relationships between dissolved gases and the different faults. The BN developed in this study is versatile; we can use the same model for predicting as for diagnosing transformer faults. That is to say, any new information on any gas can change the knowledge that we have about the nature and the occurrence probability of fault, and conversely, any information on the nature of the fault can modify the knowledge that we have on the released gas probability. The method presented in this paper has made the Duval triangle a good tool for prediction and assessment of failures beside its traditional role as a diagnostic tool.
The proposed model in the present paper has given the opportunity to make a quantitative prediction analysis of transformer faults, which supported the IEEE C57.104 standard that offers users the opportunity to make a qualitative diagnosis of failures. In practice, the developed approach can be employed as a supportive method to traditional DGA methods.
Footnotes
Acknowledgements
The authors acknowledge the support of the Algerian Society of electricity and gas (SONELGAZ) and SNC-Lavalin company, Algeria. They would also like to express their appreciations for the valuable time of anonymous reviewers spent on the review process.
Funding
The author(s) received no financial support for the research, authorship, and/or publication of this article.