
Abstract
Integrating sensors in machine tools for monitoring purpose entails dealing with different issues, not only related to accessibility and safety but also to measureable bandwidth and linearity of the sensors. Those factors could be related to the sensor itself but also to sensor–machine interaction that could drastically affect sensor performances and reliability. This paper presents a dedicated experimental investigation of the actual response of microphone transducer inside the machine-tool chamber, highlighting the effects of the machine-tool chamber in altering response linearity. The identified response is then processed with specifically developed equalization filters to correct the measured response and rescale the amplitude of frequency contributions, as required by most chatter detection techniques. The main aspect of both the experimental identification procedure and the development of an effective correction approach are presented and discussed. Finally, the technique is tested in processing signals acquired in experimental chatter tests to estimate the achievable improvements.
I. Introduction
In recent years, many research studies have been focused on understanding the cutting processes involved in machining with the purpose of improving productivity and surface quality, or reducing tool wear and environmental impact of the process, for example. Most of these tasks are still of main interest in machining-related studies, but addressing them would be possible only by gaining deeper understanding and control of the complex phenomena involved in the milling process itself. In this direction, employment of specific sensors integrated in the machine tool has nowadays become a common practice in both the scientific and industrial fields. 1 Monitoring of machining processes and chatter detection techniques are a clear exemplification of such scenario: many research activities have deeply focused on the investigation, modeling and monitoring of this process instability,2,3 that still represents one of the most limiting factors in improving modern machining performances. None of these steps would have been achievable without having different sensors available. This aspect gets even more relevant when considering a potential industrialization of monitoring techniques (e.g. unmanned machining), where developing effective, accurate, and robust approaches is an absolute requirement. 4 Defining the most suitable sensor for advanced monitoring and chatter detection application is a renowned issue: many authors already suggested and tested the use of different sensors and signal processing techniques for this purpose.1,5 Nevertheless, integrating sensors inside the machine-tool chamber entails considering various factors not only related to the sensors itself, especially in industrial applications: cost, accessibility, and safety issues could indeed represent major constraints. Taking all those factors into account, microphone could represent one of the most relevant alternatives mainly due to its low cost and ease of integration. 1 Although presenting those relevant benefits, microphone data are usually less robust with respect to noise and disturbances compared to other top-notch sensors like dynamometers or accelerometers.1,6 Machine-tool chamber response could indeed establish reverberations, reflections, and absorptions that could directly impact over the “linearity” of microphone response in the measurement frequency bandwidth (i.e. constant amplitude response within the frequency range of interest, often referred to as “linearity” of the response in sensor specifications). This effect could drastically affect accuracy and robustness of specific monitoring applications based on frequency analysis of sensors signals, such as most chatter detection techniques. 7
While different techniques have been presented in the literature to address analogous issues with alternative sensors,8,9 microphone response inside the machine-tool chamber has not been adequately investigated yet and no dedicated correction technique has been presented for the purpose of improving reliability of this specific sensor in monitoring and data acquisition of milling operations.
This paper presents a dedicated equalization technique developed in order to improve “linearity” of microphone response integrated inside the machine-tool chamber. The experimental procedure for the identification of microphone response in operative setup by means of dedicated omnidirectional speaker is presented and subsequently the effects of the machine-tool chamber in drastically altering “linearity” of sensor response are highlighted. Based on the identified sensor response, a corrective parametric equalization filter is computed to recover the actual sound generated inside the machine-tool chamber. Experimental milling tests have been carried out to investigate the effects of the proposed equalization technique in correctly rescaling frequency contributions of cutting signals for potential chatter detection or monitoring applications.
II. Identification and Correction of Microphone Response
Consider the acoustic system inside the machine-tool chamber consisting of a noise source S (i.e. milling tool in machining operation) and a microphone M, as schematized in Figure 1 .
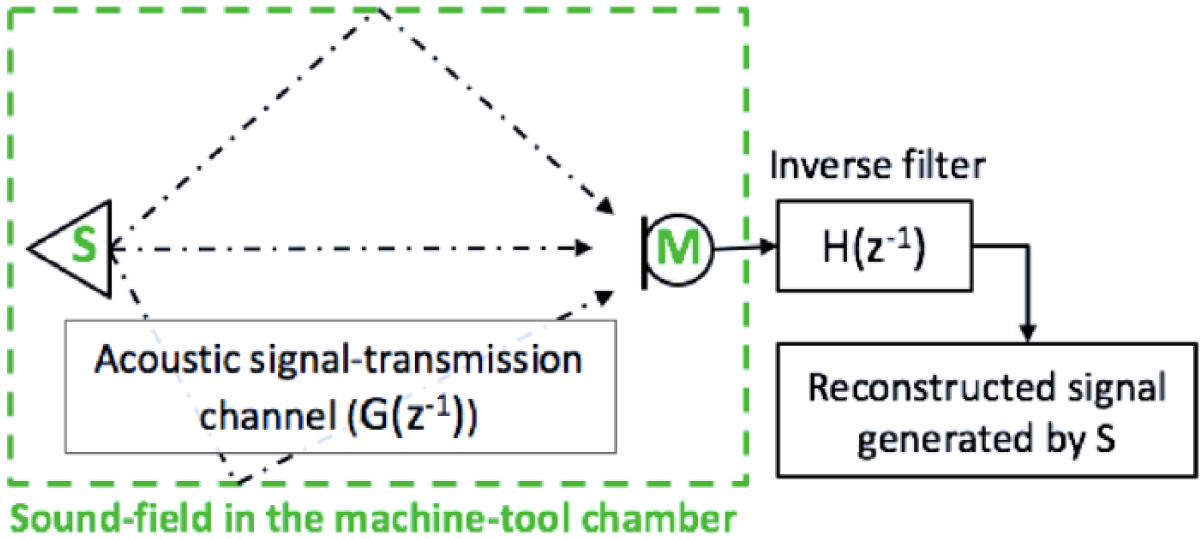
Schematic representation of the acoustic system, composed by the noise source (S) and microphone (M)
Assuming it to be a linear time-invariant (LTI) system, once the transfer function (TF; G(Z−1)) is identified, an inverse filter H(Z−1) satisfying Equation (1) can be computed to compensate for the alterations induced by the acoustic response of the machine-tool chamber, as discussed in Kirkeby et al. 10
In order to develop an effective inverse filtering strategy, the first step would hence be the identification of the TF of the acoustic signal-transmission channel between the noise source and the microphone.
A. Experimental response identification
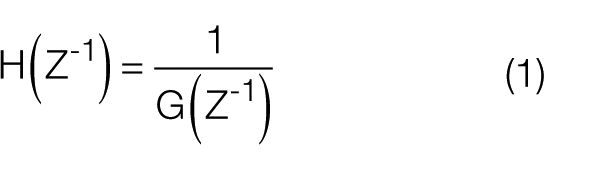
In order to identify actual response of the microphone (i.e. Brüel & Kjaer type 4165) in the setup configuration on a Mori Seiki NMV-1500DCG milling machine, some experimental tests have been conducted, using a Lookline D303 omnidirectional speaker as noise source and an LMS Scadas III as acquisition system. The experimental setup inside the machine tools is shown in Figure 2 .
Setup for the experimental identification of microphone response
The microphone was fixed to the machine-tool door with a magnetic fixture in line with the speaker virtual center of emission at approximately 350 mm from front face of the speaker. Tests have been performed with doors closed, as in operative conditions.
Different signals have been fed to the audio source using both LMS Scadas III generator and Lookline D303 built-in generator. In accordance with the assumption of the transmission channel to be treated as LTI, the following signals and sources have been tested:
White noise generated by LMS Scadas III acquisition system (frequency range 40–8000 Hz);
White noise generated by D303 integrated signal generator (40–8000 Hz);
Sine sweep generated by D303 integrated signal generator (100–8000 Hz).
The choice was made of not using the sweep sine generated through LMS Scadas III because the sweep rate was excessively high to ensure the reach of the steady state and hence would not allow for an adequate identification of microphone response. 11
Although significant information could be extracted by this simple test, the actual measured response of the sensor could be directly employed to evaluate the sensor TF only if input signal is assumed to be of constant amplitude and phase in the investigated bandwidth. The amplitude of the signal generated by the D303 omnidirectional speaker is certified to be within ±3 dB in 40 Hz–20 kHz frequency range that seems appropriate for general acoustic analysis of room responses, but could be not adequate for the specific application. Analogous tests have thus been conducted to characterize the actual signal generated by the omnidirectional speaker: by doing so the accuracy of the response identification is maximized, since the machine-tool chamber acoustic frequency response function (FRF) is computed taking into account the actual excitation signal and not the theoretical one (i.e. ±3 dB amplitude response of the speaker output).
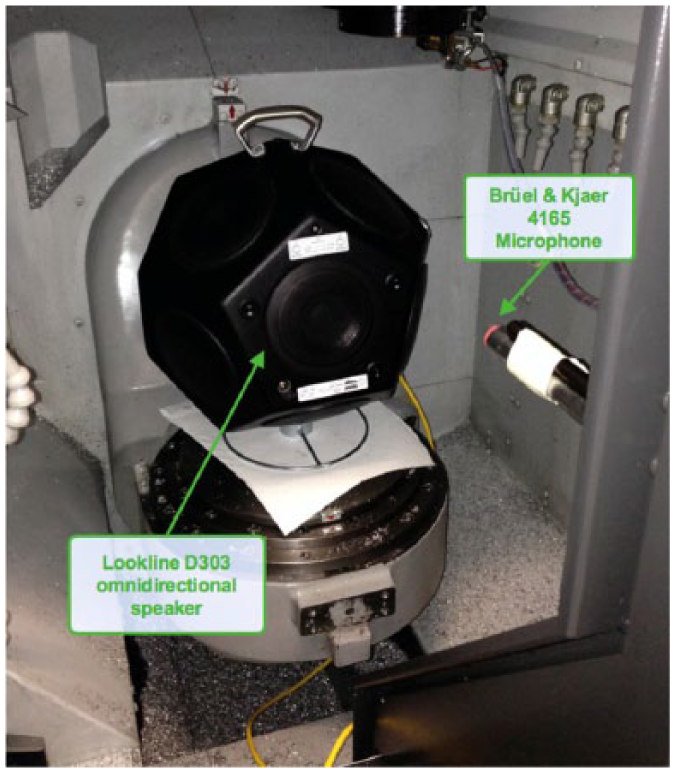
The source characterization tests setup is reported in Figure 3 . Tests have been conducted in an open environment sufficiently far from any reflective or reverberating surface. The Brüel & Kjaer microphone was again set at approximately 350 mm from the front face of the speaker using the same magnetic fixture.
Setup for the noise source characterization
In order to identify microphone response in the experimental setup, the system FRF was computed using the measured signal inside the machine tool as system output and the experimentally identified speaker generated signal as system input. For this purpose, LMS Test.Lab 11b software was used and H1 calculation method was selected for FRF computation, with uniform windowing.
Figure 4 reports the amplitude of the estimated FRFs in the investigated frequency range, for each excitation signal: as clearly shown all input signals provided similar results, although some discrepancies in terms of amplitude at some specific frequencies can be highlighted. This is likely due to the fact that the FRF computed using white noise excitations generated through LMS Scadas III (i.e. blue line in Figure 4 ) is averaged over five measurements, while averaging signals generated through D303-embedded generator was not possible with the required accuracy, for alignment and offset reasons. Taking that into account, authors decided to process only the averaged FRF for successive filter computation.
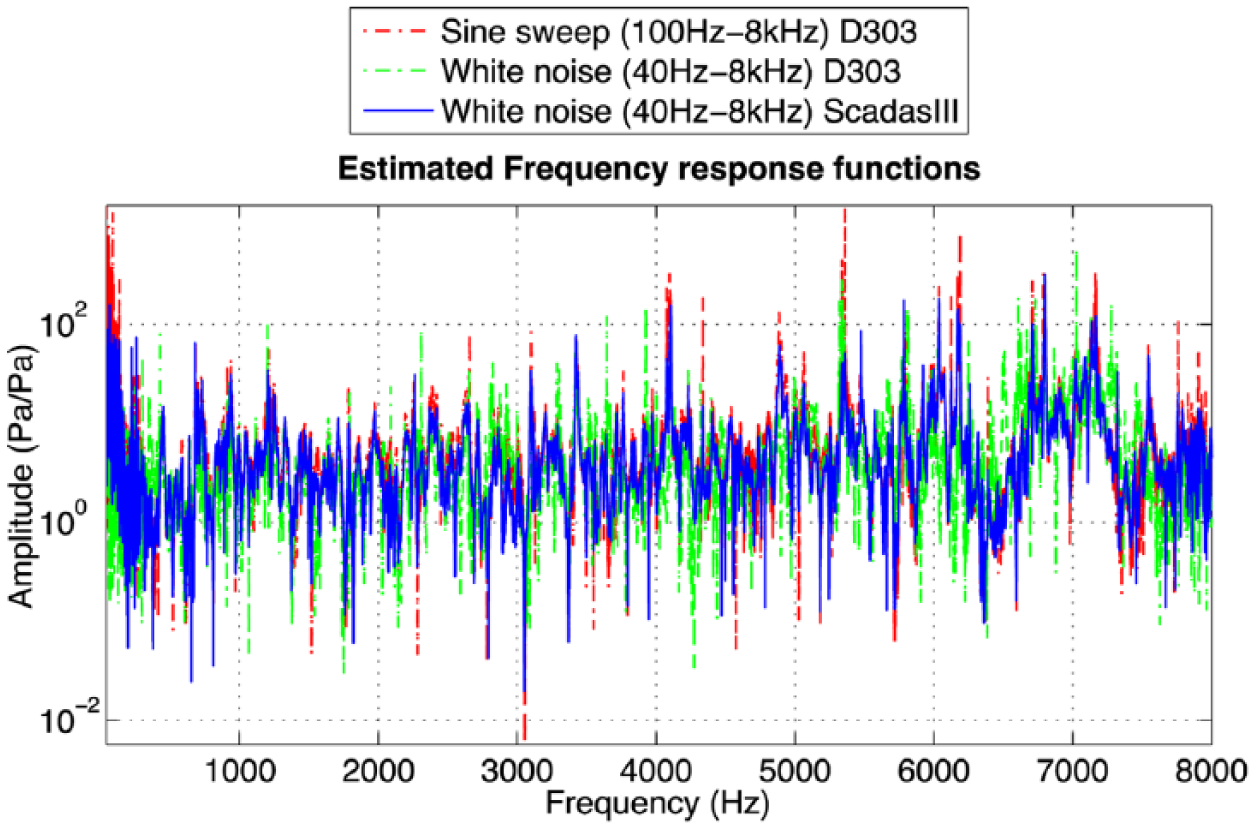
Estimated TFs using different excitation signals
By analyzing the amplitude of the identified FRFs, shown in Figure 4 , it clearly appears that microphone response is actually non-constant in the investigated frequency range and measured signals would hence present amplitude distortions for different frequency contributions in the measured signals. This consideration should hence be taken into account when processing and analyzing data in frequency domain, such as in most chatter detection applications, like the one presented by Riviére et al. 7 Analogous considerations could be made for the phase response, here not reported to avoid confusion. Phase response should be compensated for, if the interest is also focused on correcting the phase shifts in the measured signals. This is generally an avoidable requirement in the specific application (i.e. chatter detection) that relies mainly on the analysis of the amplitude of the different frequency contributions.
B. Correction of microphone response
Dedicated techniques are presented in the literature to compute the inverse filter H(Z−1) of an identified TF of a single-input single-output (i.e. SISO) system, also for specific acoustic response application, 12 but a crucial step is represented by the frequency-domain curve fitting of experimental data into the mathematical TFs representation. In some cases, the identified responses, both in terms of amplitude and phase, show many peaks and troughs, requiring high-order polynomials for the fitting TF and not ensuring adequate accuracy, as already highlighted by Scippa et al. 9 As clearly shown in Figure 4 , this is the case of the identified response; adequately curve-fitting the measured TF was indeed hindered by the excessively high-order polynomials required and the intrinsic ill-conditioning of the system. 9 This actually impeded the application of renowned inversion and compensation techniques and required a different strategy to correct microphone response: following the anticipated general requirements of the chatter detection application, if the final goal is to accurately rescale amplitude of frequency contributions in the frequency spectra of measured signals, phase contributions could be neglected as initial approximation. Such a simplified approach would hence allow avoiding the need of curve-fitting the measured FRF in complex domain and simplifies the development of the compensation filter computation by approaching it as a relatively simple parametric equalization filter.
To simplify the approach of defining the filter to compensate for the measured microphone amplitude response, the experimental data of the identified response are inversed and processed in one-third octave bands instead as on a frequency-by-frequency basis, following a common approach employed in acoustic analysis. The inversed FRF in one-third octave is reported in Figure 5 . The inversion and conversion to one-third octave format of the estimated FRF is performed by LMS Test.Lab 11b.
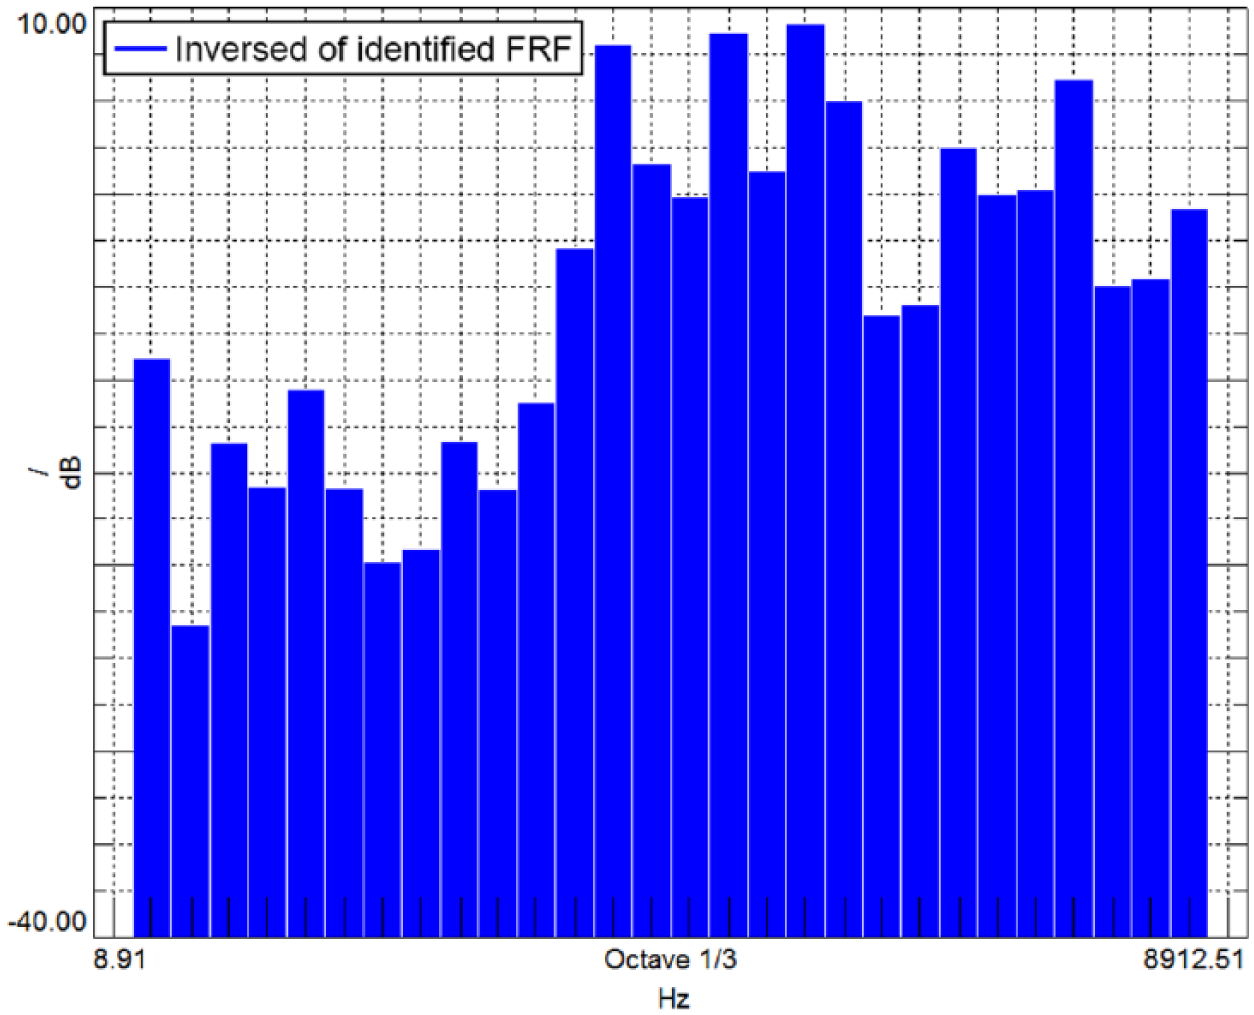
Inversed microphone FRF fractionalized in one-third octave bands
Once the desired equalization curve is defined with the described procedure, a specific parametric equalization filter can be computed to compensate microphone response. This procedure was performed in MATLAB® with the built-in filter design and analysis toolbox.
III. Experimental Tests
In order to test the developed equalization approach in practical applications, specific experimental tests were performed on the Mori Seiki NMV 1500 DCG milling machine, with a two-flute end-mill (8–mm-diameter Garant 201770) and using a 60 mm squared bar workpiece of aluminum 6082-T4 alloy, fixed to a Kistler 9257A table dynamometer. Figure 6 shows the setup used to perform experimental cutting tests, and the microphone, not shown, was mounted in the same exact position as the previous tests. The dynamometer was used to acquire cutting forces during the tests in order to make available a reference signal to be used in estimating equalization performance. To maximize accuracy, cutting forces were processed with a validated compensation strategy, 9 already proven to be effective in similar applications. 13
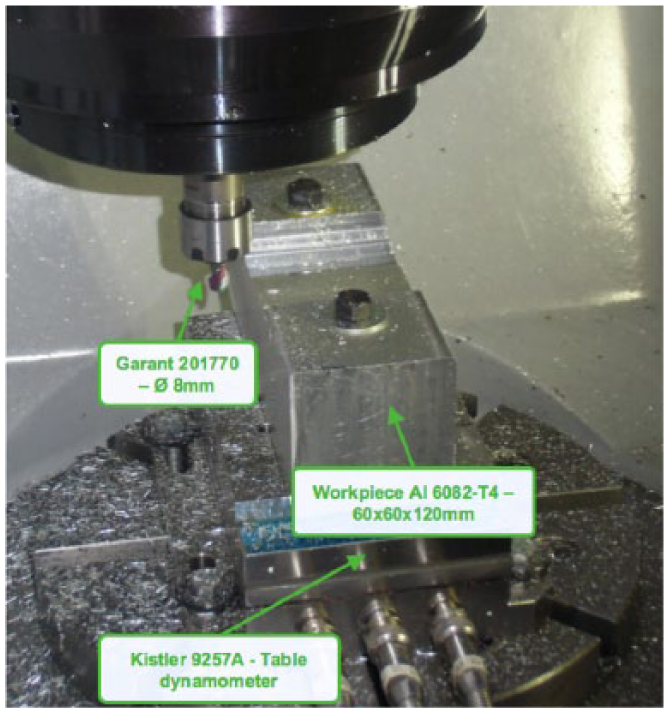
Experimental setup for cutting tests (microphone not shown)
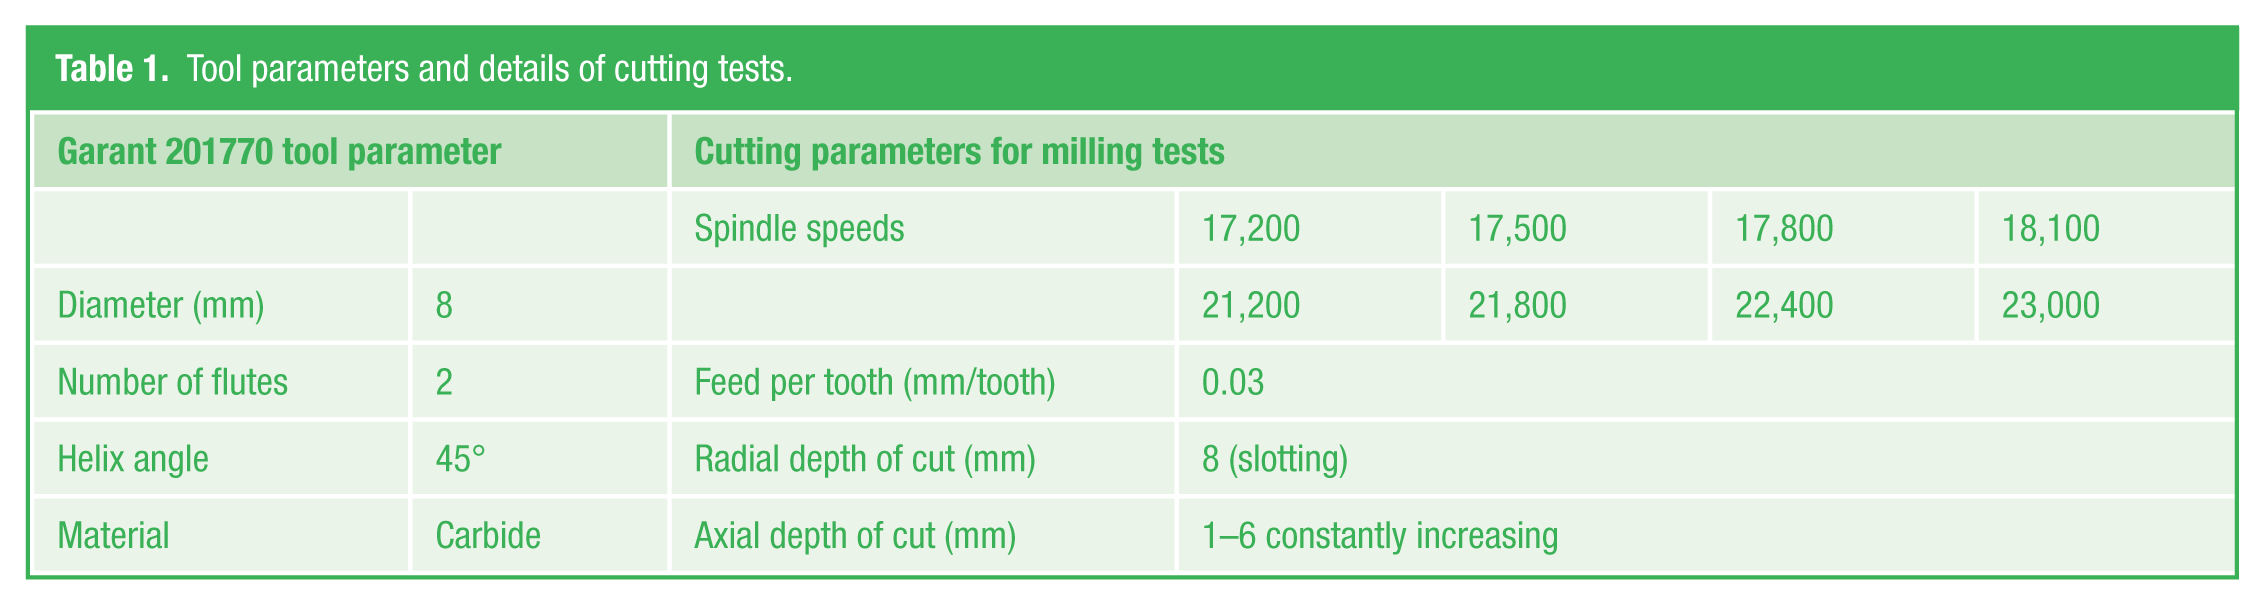
Cutting tests were performed in accordance with the test procedure reported by Quintana et al., 14 constantly increasing axial depth of cut from 1 to 6 mm, in full radial immersion (i.e. slotting operation); this way both stable and unstable cutting conditions can be recreated. Different spindle speeds were employed, keeping feed per tooth constant to 0.03 mm/tooth, in accordance with producer suggested parameters. Table 1 summarizes tool parameters and all the investigated cutting conditions.
Tool parameters and details of cutting tests.
Signals were acquired by LMS Scadas III frontend and synchronously sampled at 102,400 Hz to be successively processed with the dedicated compensation techniques by means of specific MATLAB routines.
A. Results of experimental tests
In order to estimate the performance of the developed technique, measured and equalized signals were processed with spectral analysis techniques.
Figures 7 – 9 show the spectrograms of measured and equalized microphone obtained with uniform Hamming windowing: amplitude of spectral contributions in the microphone signals is sensibly rescaled by the equalization procedure. Moreover, the signals processed with the proposed technique are more in accordance with the spectral contributions of compensated force used as reference signals (i.e. force measured along Z-axis of the machine-tool reference system), suggesting equalization effectiveness.
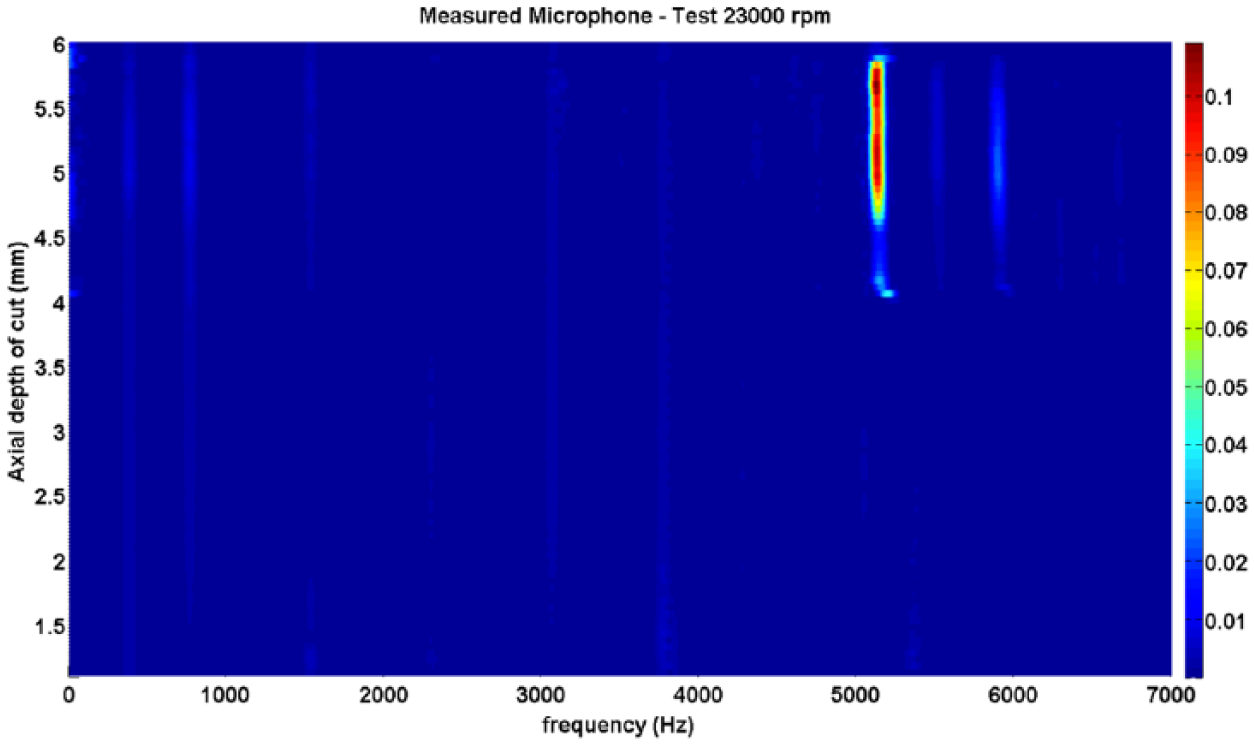
Spectrogram of not compensated microphone signal in the 23,000 r/min cutting test
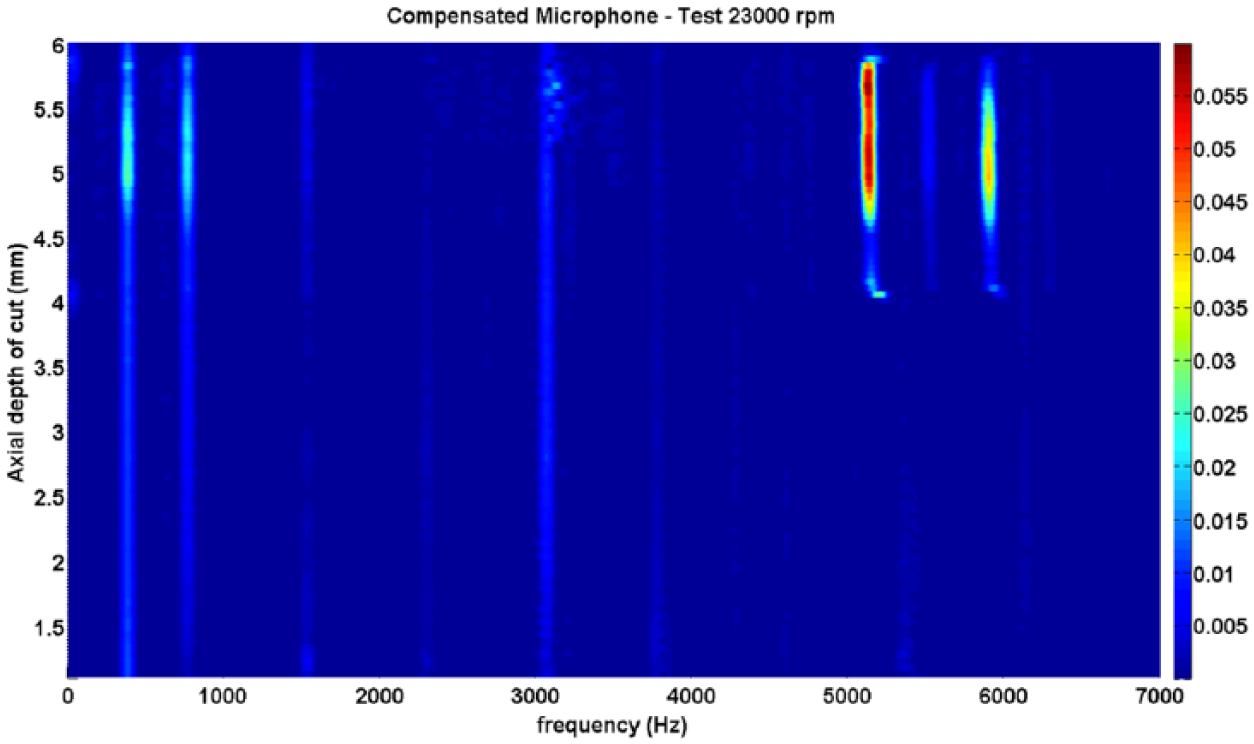
Spectrograms of compensated microphone signal acquired in the 23,000 r/min cutting test
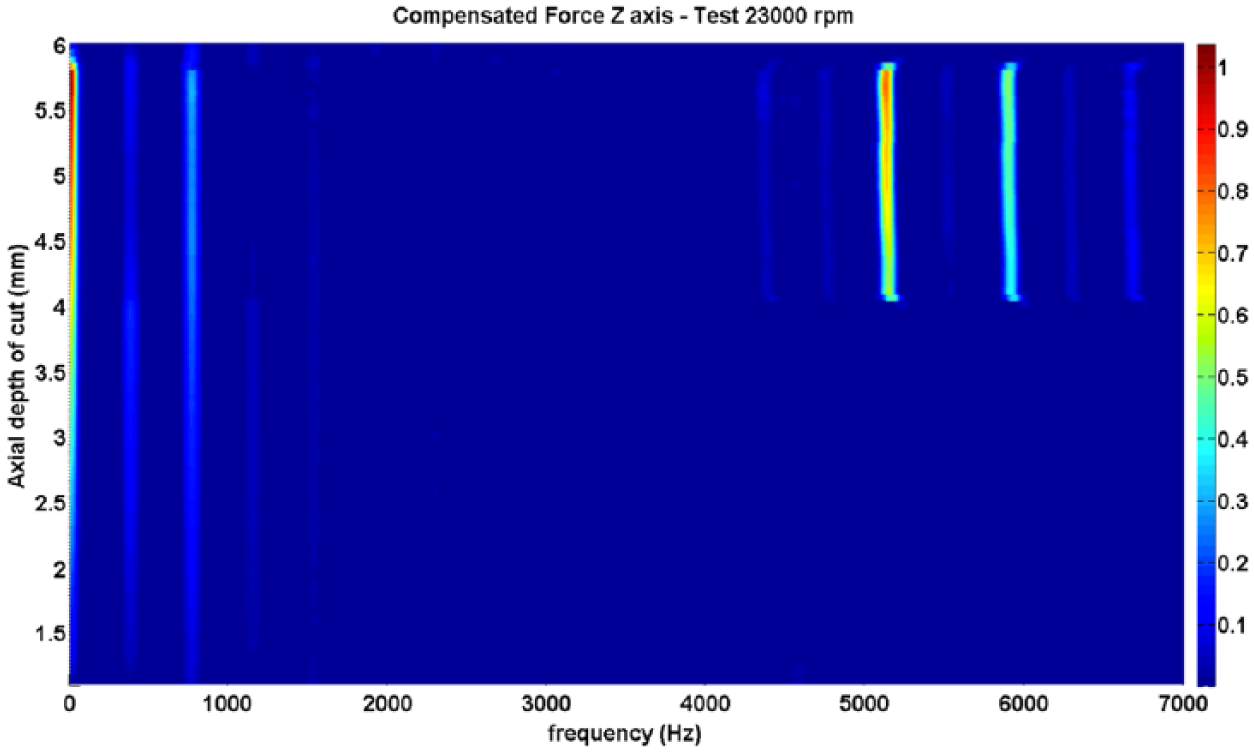
Spectrograms of compensated force Z signal acquired in the 23,000 r/min cutting test
Particularly relevant is the effect gained in relatively rescaling chatter frequency amplitude (i.e. 5130 Hz) with respect to tooth pass frequency (i.e. 767 Hz). This effect can provide appreciable benefits in potential chatter detection applications. Indeed, many researchers5–7,15–17 propose the identification of such a detrimental phenomenon by means of dedicated indicators, based on discriminating between τ-periodic and τ-aperiodic components of the signals, where τ is the period of tool rotation. The main adopted solution is based on the analysis of sensor signals in the frequency domain, in which the fundamental τ-periodic part is represented by the tooth pass frequency (tpf), while the main aperiodic part is the chatter frequency (cf).
In order to investigate the effectiveness of the proposed compensation strategy on chatter detection application, a simple indicator is here implemented as the ratio between the amplitude associated with the two characteristic frequencies
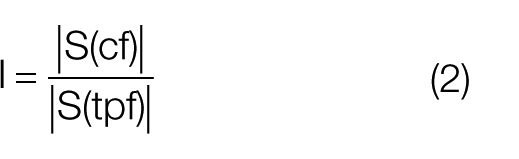
where I is the chatter indicator, S stands for signal in frequency domain, cf for chatter frequency, and tpf for tooth pass frequency. Chatter indicators for the analyzed signals are presented in Figure 10 as a function of the increasing depth of cut.
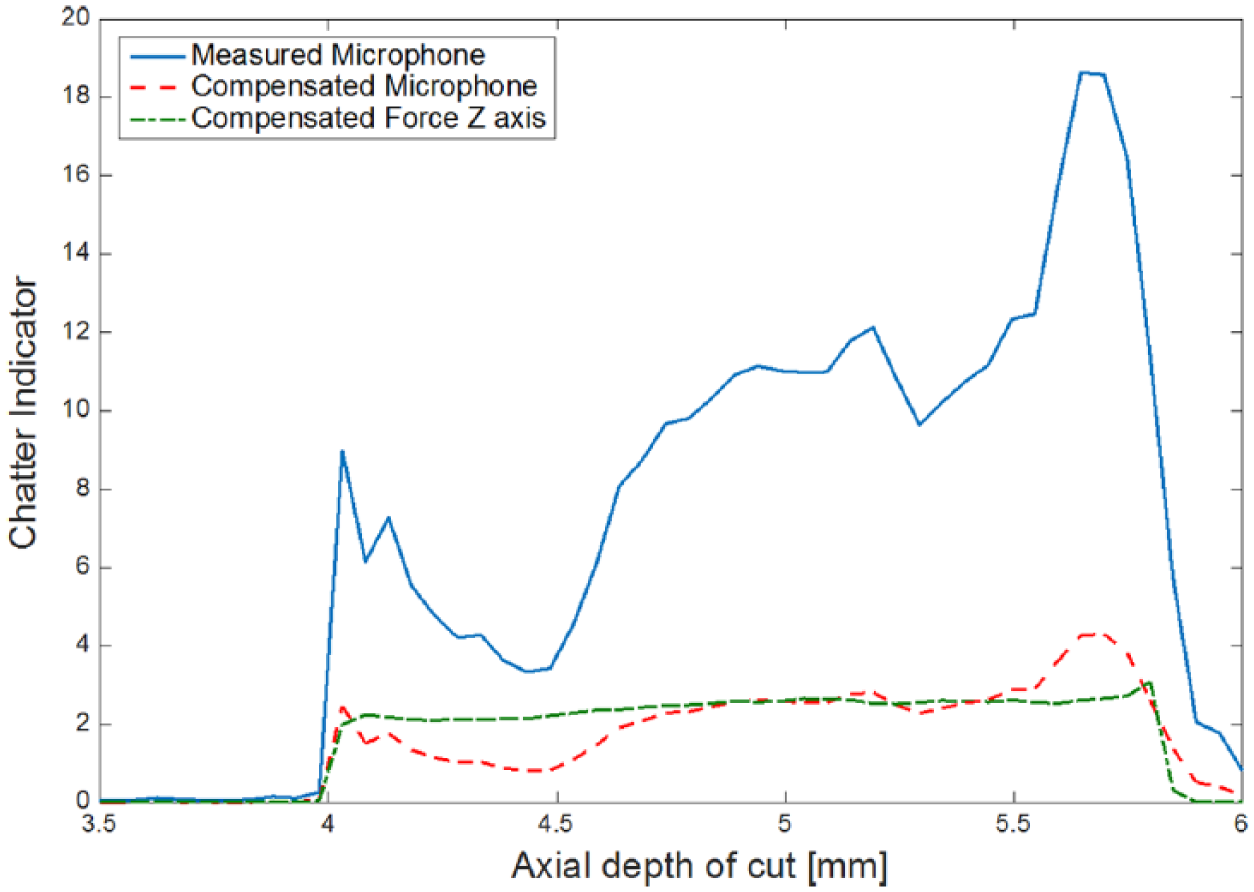
Chatter index evolution in the 23,000 r/min cutting test
As shown in the figure, the proposed microphone equalization strategy is able to provide a chatter indicator in line with compensated Force Z results, considered one of the most reliable signals.5,16 On the contrary, the measured microphone signal shows an overestimate of chatter indicator, potentially affecting chatter detection accuracy. Analogous results have been obtained for all the conducted cutting tests.
By analyzing Figure 8 , one could see that while the potential effectiveness of the proposed equalization technique is shown, some frequency contributions in the equalized signals seem to be not consistent with the spectrogram of compensated cutting force. Primarily attention should be put over amplitude of the frequency contribution associated with the rotational frequency (i.e. around 383 Hz): compared to compensated dynamometer signals, both raw and equalized microphone signals show higher amplitude of rotational frequency with respect to tooth pass frequency. This is consistent with the fact that rotational frequency is acquired through measured forces only by means of run-out contributions, while the rotating spindle can produce relevant noise in the machine-tool chamber, reflecting in higher amplitude of this spectral contribution in the microphone signals.
Rotational frequency is not the single anomalous frequency contribution that shall be highlighted in the microphone signals and especially in the equalized ones. Figure 11 reports a comparison between measured and equalized microphone signals acquired in the 23,000 r/min cutting test (i.e. Hamming window used) where the anomalous frequency contributions are highlighted.
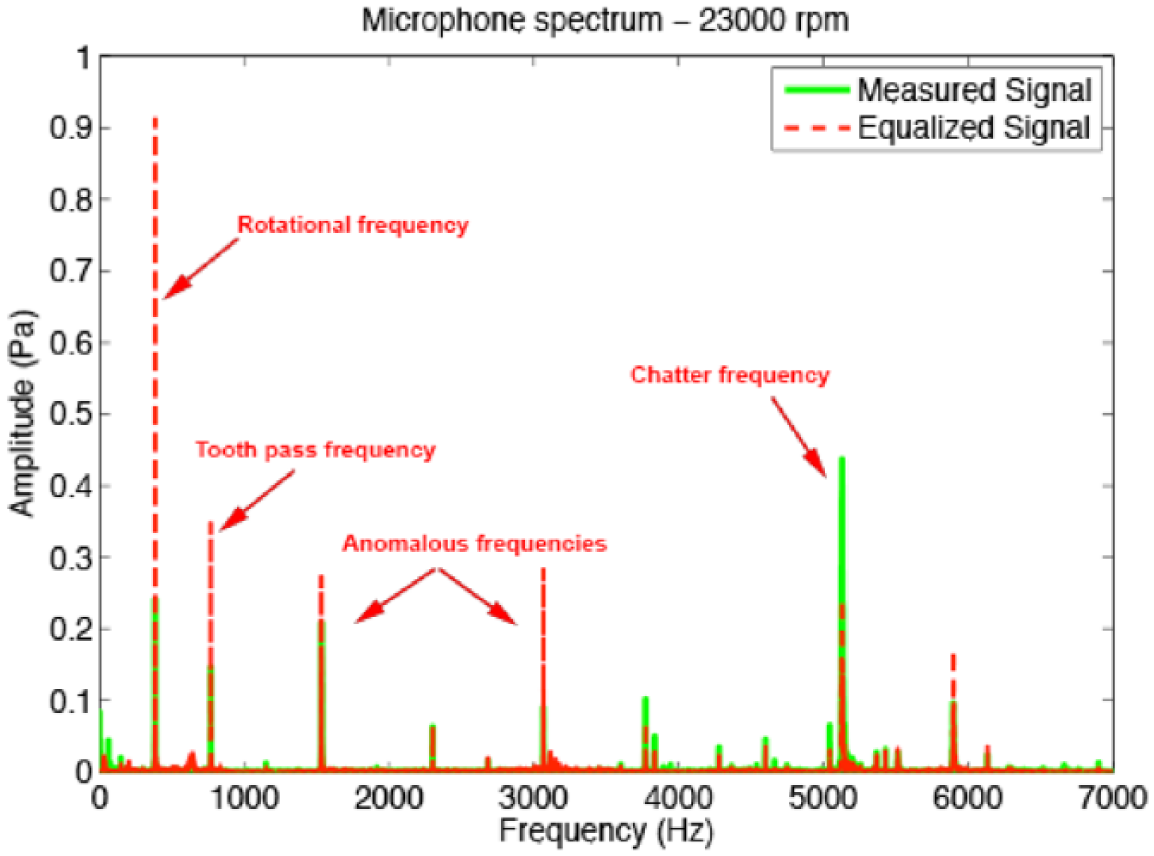
Comparison between measured and equalized microphone signals
Microphone signals acquired in air cutting tests, Figure 12 , showed that these anomalous frequencies are actually harmonics of rotational frequencies that are probably generated by noise source synchronous with the rotational frequency (e.g. rotating spindle, tooling, and bearings).
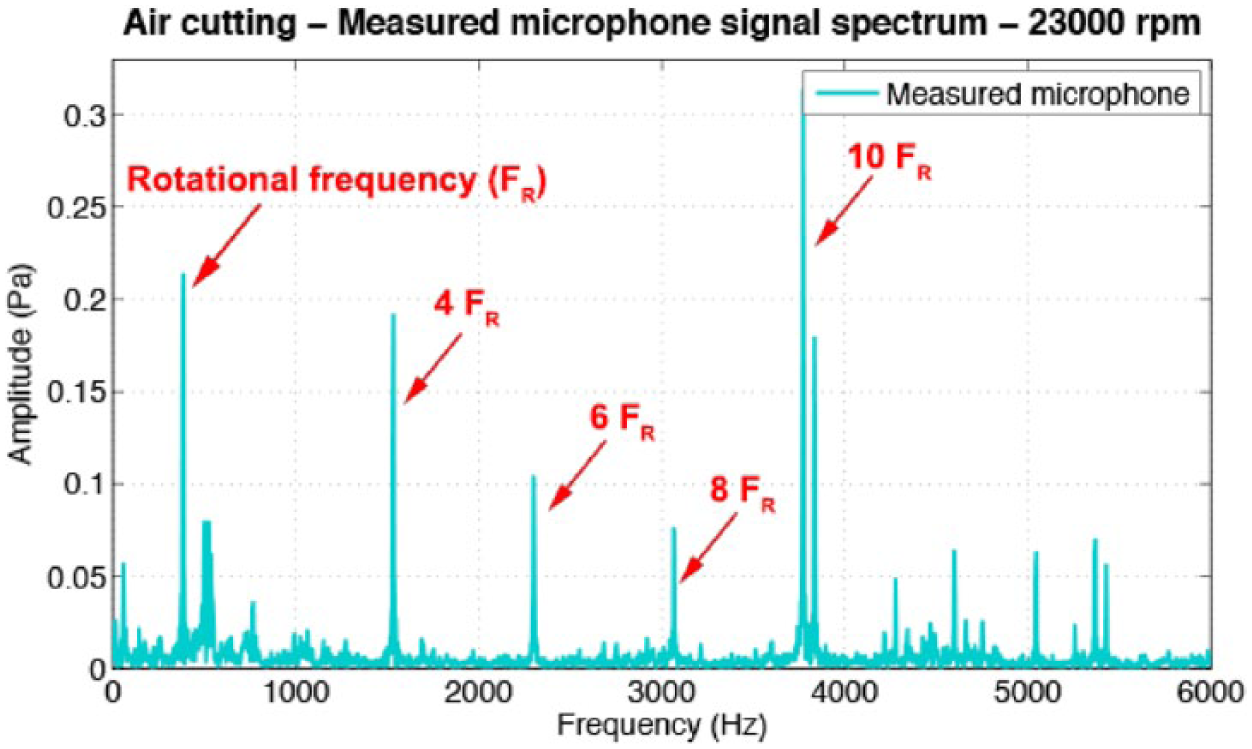
Spectrum of air cutting microphone measurements, 23,000 r/min test: rotational frequency and harmonics
Even though the nature of these anomalous frequency contributions appears quite clear, it shall be pointed out that equalization procedure sensibly amplifies the amplitude of those contributions: this is probably due to the broad fractionalization used for the equalization filters (i.e. one-third octave bands) that is less accurate than a frequency-by-frequency approach. To clarify this aspect, one could analyze the identified microphone TF shown in Figure 4 : around 3 kHz not only an acoustic resonance is present, but also an anti-resonance with much higher amplitude that actually influences the global gain of the related third octave band. The inversed equalization curve will hence lead to an amplification of the frequency contribution around the entire third octave band of the given frequency, as shown in Figure 5 . This seems to be the main limitation of the equalization procedure presented and could be improved in future developments by processing signals in narrower band (e.g. 1/6th octave or 1/24th octave) or possibly in equally spaced frequency bands, instead of logarithmic defined ones (i.e. octave bands). However, this would reflect in more complex filter computation and the numerical limitations described in the previous chapter could actually impede the achievement of these expected improvements.
IV. Conclusion
Machine-tool chamber acoustic response can sensibly alter the ideal constant amplitude responses of microphone transducers. In this paper, this effect has been investigated by dedicated experimental tests which demonstrated that microphone response inside the machine-tool chamber is sensibly altered, especially in terms of amplitude response. Specific correction techniques would hence be required to ensure adequate accuracy in most practical applications, especially in chatter detection techniques.
This work reports the development of a simple equalization technique to compensate for frequency amplitude alterations induced by the machine-tool chamber acoustic response. Based on the experimentally identified microphone response, an inverse parametric equalization filter is computed and applied to measured signals in order to reconstruct the actual noise inside the machine.
The technique was tested in processing signals acquired in real cutting tests and proved to be effective in rescaling the amplitude of relevant frequency contributions, even if some anomalies are reported. The results obtained showed that such a technique could provide valuable benefits in chatter detection techniques using microphone that are particularly interesting for an industrial implementation. The results achieved with the corrected microphone response are in line with the ones obtained using reference sensors (i.e. dynamometer) and renowned compensation approaches.
Further development could improve the proposed techniques by addressing some of the issues highlighted in the paper: more refined frequency bands fractionalization, possibly equally spaced, and more computationally efficient filtering algorithms can produce appreciable results with respect to the anomalous contributions highlighted in the paper.
Finally, optimal positioning of the microphone transducer inside the machine-tool chamber shall be investigated in order to get the best response of the sensor possible; it would allow reducing the degree of the filters used in the parametric equalization procedure and hence improve robustness and computational efficiency. Moreover, further investigation of the anomalous frequency contribution highlighted in the experimental tests could be needed in order to develop dedicated filtering approaches. It should be pointed out that both these further steps would probably need to be aided by the use of numerical model to predict the acoustics modes of the chamber and the noise generated by the machine-tool components themselves (e.g. rotating machinery and auxiliary devices).
Footnotes
Acknowledgements
The authors would like to thank the Mori Seiki Co. and the Machine Tool Technology Research Foundation (MTTRF) for the loaned machine tool (Mori Seiki NMV 1500 DCG 5-axes vertical-type machining center).
Funding
The author(s) received no financial support for the research, authorship, and/or publication of this article.