
Abstract
This paper presents a detection system of geomagnetic induced currents based on the measurement of the magnetic field outside the magnetic core; it is possible to evaluate the core operating conditions of power transformers under the effect of geomagnetic induced currents. The nonlinear behavior of the core due to asymmetric saturation produces a distortion in the external magnetic field which can be evaluated by the measurement of the magnitude of even harmonics; we describe the experimental setup and the instrumentation required for real-time detection of asymmetric saturation caused by quasi-DC magnetic fields. The experimental results obtained by simulating the presence of geomagnetic induced currents are presented.
I. Introduction
Geomagnetic induced currents (GICs) are the currents that are related to current flow in the ionosphere that interact with the power systems. These currents are associated with solar storm activity and produce currents in the power grid that flow through transmission lines. These currents are of very low frequency in the range from 0.01 to 0.001 Hz (quasi-DC) with average magnitudes of 10–15 A and peaks of up to 100 A for 1–2 min. 1
Transformers with star connections and grounded neutrals that are linked by long transmission lines are susceptible to GIC problems due to the induced currents that flow through the transmission line and the neutrals that are grounded to close the circuit.
Several undesirable effects, produced by GICs in electrical power grids and transformers, are reported. Moreover, when the DC magnetic flux is super-imposed on the AC flux, the magnetic cores in the transformers are asymmetrically saturated.2,3 The reported failures in transformers due to GICs are mainly dielectric and not a result of overheating.
The effects of GICs at the electric grid level can be summarized as the main effects: first, when the reactive loads in the system are changed, the protections are misaligned and the internal resonant frequencies of the transformer change. This process generates voltage surges that eventually degrade the insulation. Second, the magnetization impedance decreases, and the magnetizing current and the losses without loading increase. Reactive load absorption can cause instability in the electric grid. 4 Third, the harmonics are contributed to the system, and even harmonics are generated.
The effects on the transformers can be summarized as the main effects on the relative permittivity of the magnetic core and the magnetization impedance decreases significantly.5,6 The magnetic core losses increase due to hysteresis, and eddy currents and the losses in the windings due to the Joule effect increase. Furthermore, the skin effect that is associated with harmonics in the current and in the magnetic flux increases. Additionally, heat increases in the fittings and tank due to the effects of eddy currents that are associated with increasing stray flux and with the appearance of even harmonics.7–10 The first harmonic vibration component in the transformer arises due to magnetostriction. Residual magnetism occurs in the core even when GICs are no longer present and the inrush phenomenon occurs until the transient has died away.
Several solutions have been proposed for the detection of the GICs; one of the solutions consists of a monitoring system to detect geomagnetically induced currents flowing in the neutral earth points of key transmission transformers. 11 Some reports show that it is feasible, for example, to detect deviation from an average value of 0 for the core-flux operating point in a transformer; the other option is an electronic method of measuring large DC levels also exists and is instructive. Other alternative possibility is to use a Hall device to measure the flux in a current transformer core; another option involves waiting until harmonics are detected in the system. 12 Work done to the measured vibration patterns of core and tank shows a DC dependency. 1
The solution proposed in this work considers the placement of a magnetic sensor near the core of a transformer to monitor and measure the magnetic field distortion, and the even harmonic is generated as a key variable to determine the operating conditions of the transformer core. The advantages of this solution are as follows: no modifications to the electrical parts are required to implement the solution, total galvanic insulation and simple signal processing to filter any of the even harmonics.
II. Experimental Setup
The experiment comprises a single-phase small transformer, a controllable DC source, a resistive load and the electronic instrumentation for measuring the AC primary and secondary voltages and currents, the DC used to simulate GICs and the density stray magnetic flux outside the magnetic core. Figure 1 shows a simplified schematic diagram of the experiment.
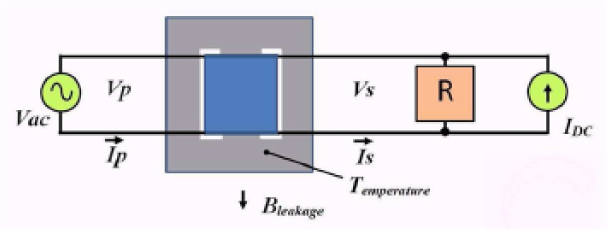
Monophasic transformer GIC simulator block diagram
The single-phase transformer was designed to be fed with a voltage of 120 V in the primary and 6.0 V in the secondary, a load current in the secondary of 100 mA, shell-type construction and a resistive load of 50 Ω. The objective of this circuit is to evaluate the harmonic generation due to the effect of DC simulating GICs with the transformer operating at its rated load. The transformer is fed by a variac that allows changing the supply voltage from 0 to 120 Vac.
The source of DC “IDC,” which simulates the GICs, allows the current supplied to the secondary of the transformer to be adjusted from 0 to 250 mA DC, from 0% to 250% of the value root mean square (RMS) of nominal current. The IDC mainly flows through the secondary winding of the transformer because its resistance is 1/50 of the load resistance.
The currents in the primary and secondary transformers are measured by resistive shunts, and the voltage measurement points have voltage dividers that are appropriate for not exceeding the voltage limits of the data-acquisition system.
The stray magnetic flux density is measured with a Hall effect sensor that is located in the external portion of the core, at the central leg and parallel to the magnetic flux that is produced by the transformer winding. This localization was chosen to determine the leakage flux which leaves the magnetic core when GICs are present.
The instrumentation is based on a commercial signal acquisition card that digitizes the measured variables at a rate of 20,000 samples/s. A control program that was developed in graphical language allows the instrument to acquire the waveforms of the measured variables simultaneously.
The control program allows the user to visualize the behavior of the variables in time and frequency domains. The frequency spectrum of the measured waveforms is spread out by using a discrete Fourier transform (with a Hamming window), and the RMS values and the total harmonic distortion (THD) of the involved variables are also spread out.
III. Results and Discussion
A. Asymmetric nonlinearity with GICs and its effect on waveforms
The voltage waveform in the primary corresponds to the supplied AC power, which is a low-impedance source. The primary current shows significant changes as the IDC increases in the secondary. The average value of the primary current is 0, but the waveform indicates half-wave asymmetry. The peak value of the current is higher by a half-wave compared to the other. This difference demonstrates the decreasing magnetization impedance in the half-cycle, when the peak current is larger. Figure 2 shows two current waveforms that are seen from the primary. The red curve has no DC component, while the blue curve corresponds to the primary current affected by a DC component in the secondary which simulates the GICs. The voltages at the secondary positive and negative peaks are deformed due to symmetrical saturation under normal conditions. However, when the IDC component is present, the half-wave symmetry is lost, and the duty cycle is asymmetrical.
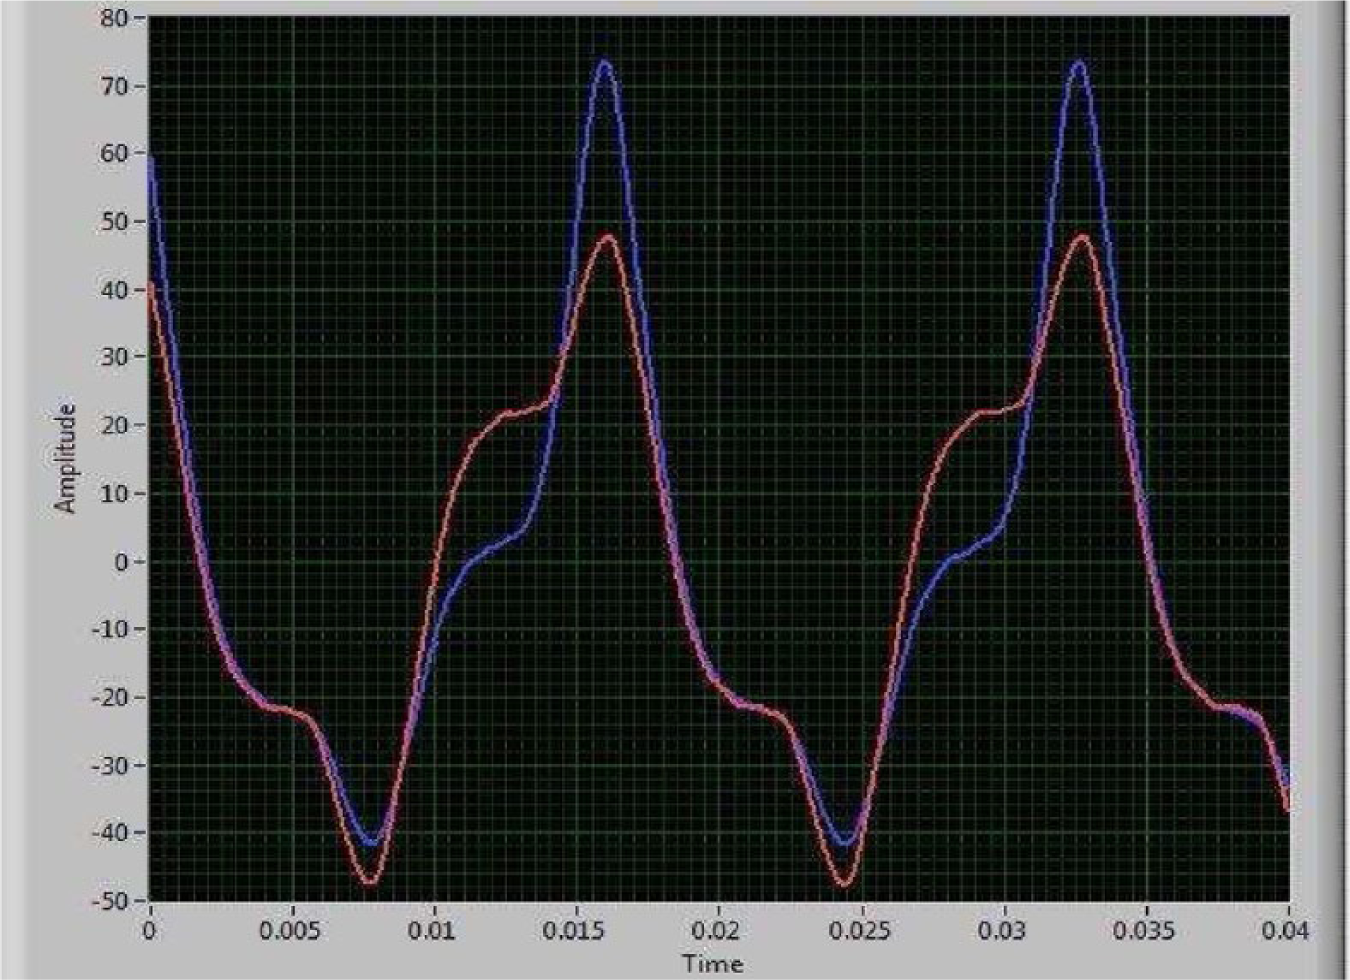
Waveforms of the primary currents with and without GIC (red and blue lines, respectively)
B. The generation of harmonics
The operating point of the magnetic core is determined by design to use the minimum amount of iron. Under normal operation, the magnetic flux density changes as the alignment of the magnetic domains changes within the magnetic circuit. When all the magnetic domains have been aligned, the saturation point is reached, and it further increases in the magnetic field H and has a little change in the values of the magnetic flux B.
A qualitative analysis indicated that the saturation curve is symmetric about the vertical axis when no DC is present. However, when the DC component is present, the curve shifts increasing saturation in accordance with the DC polarization. In contrast, the saturation decreases in the inverse polarization.
The waveform of the magnetic flux density measured in the outer portion of the core is similar to the current waveform measured in primary of the transformer. Figure 3 shows stray magnetic flux waveforms with and without GIC. Thus, the magnetic flux density and the current in primary of the transformer have the same harmonic content. Likewise, the magnetic flux density has a DC component only when GICs are present. Figure 4 provides a comparison of the two spectrum waveforms. The curve in blue corresponds to the presence of GICs, and the curve in red corresponds to the absence of GICs.
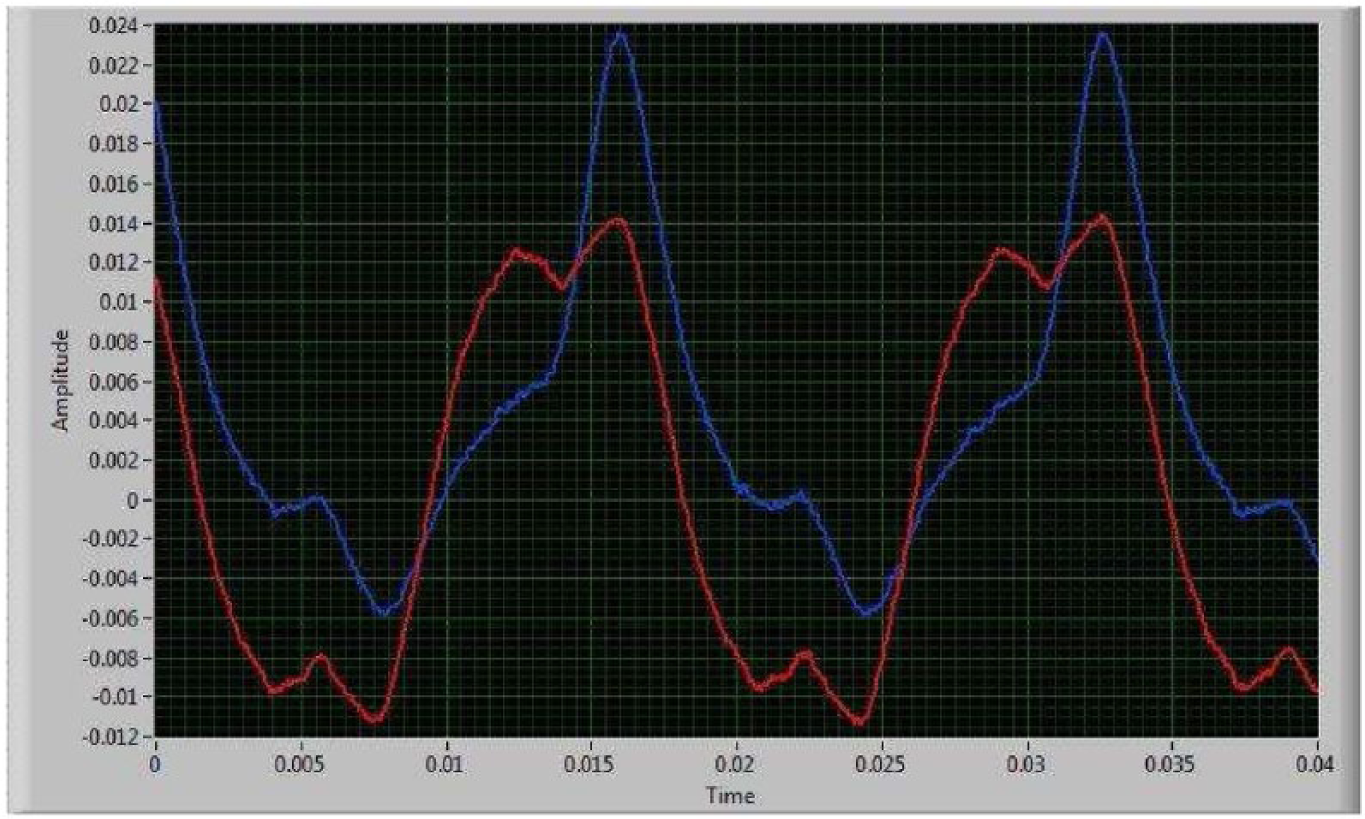
Stray magnetic flux waveforms with and without GIC (red and blue lines, respectively)
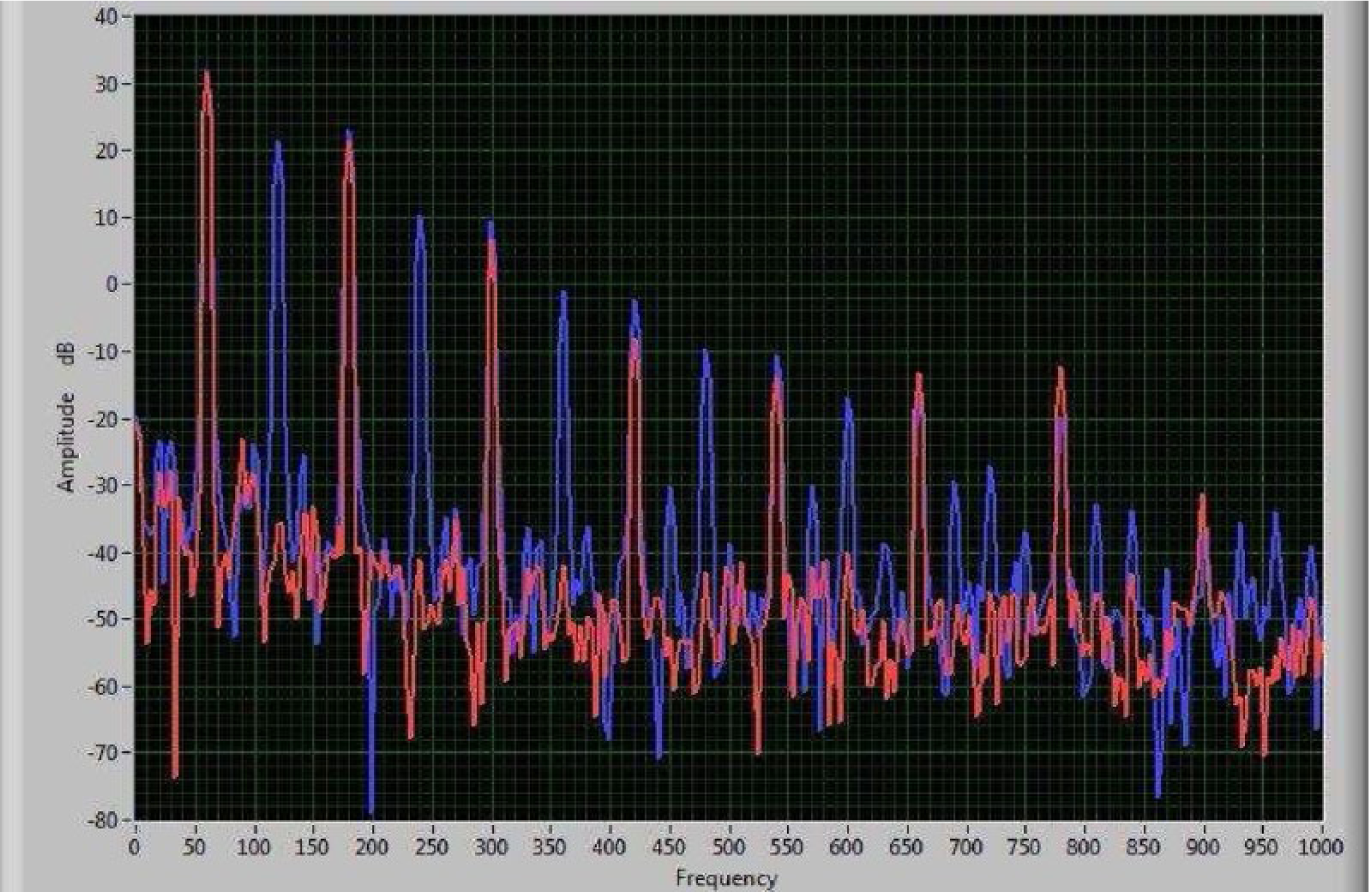
Spectral behavior of the primary currents with and without GICs (red and blue lines, respectively)
The voltage and current waveforms in the secondary of the transformer during nominal operating condition of the fundamental frequency have symmetry of half-wave and are associated with symmetric saturation of the magnetic core. This behavior only has odd harmonic components. Thus, the harmonic components of 1, 3, 5, 7,… represent the components that have these waveforms and satisfy the following property
where T is the period of the periodic signal.
When the GICs flow through the secondary winding, even harmonics are generated as a product of asymmetric nonlinearity and the magnitude of the odd harmonic components remains constant. Even harmonic components appear in the primary and secondary current and secondary voltage. Figure 4 shows the harmonic components of the primary current with and without GICs (solid red and blue, respectively). Figure 5 shows the changing magnitudes of the largest harmonics as a function of the magnitudes of the IDCs.
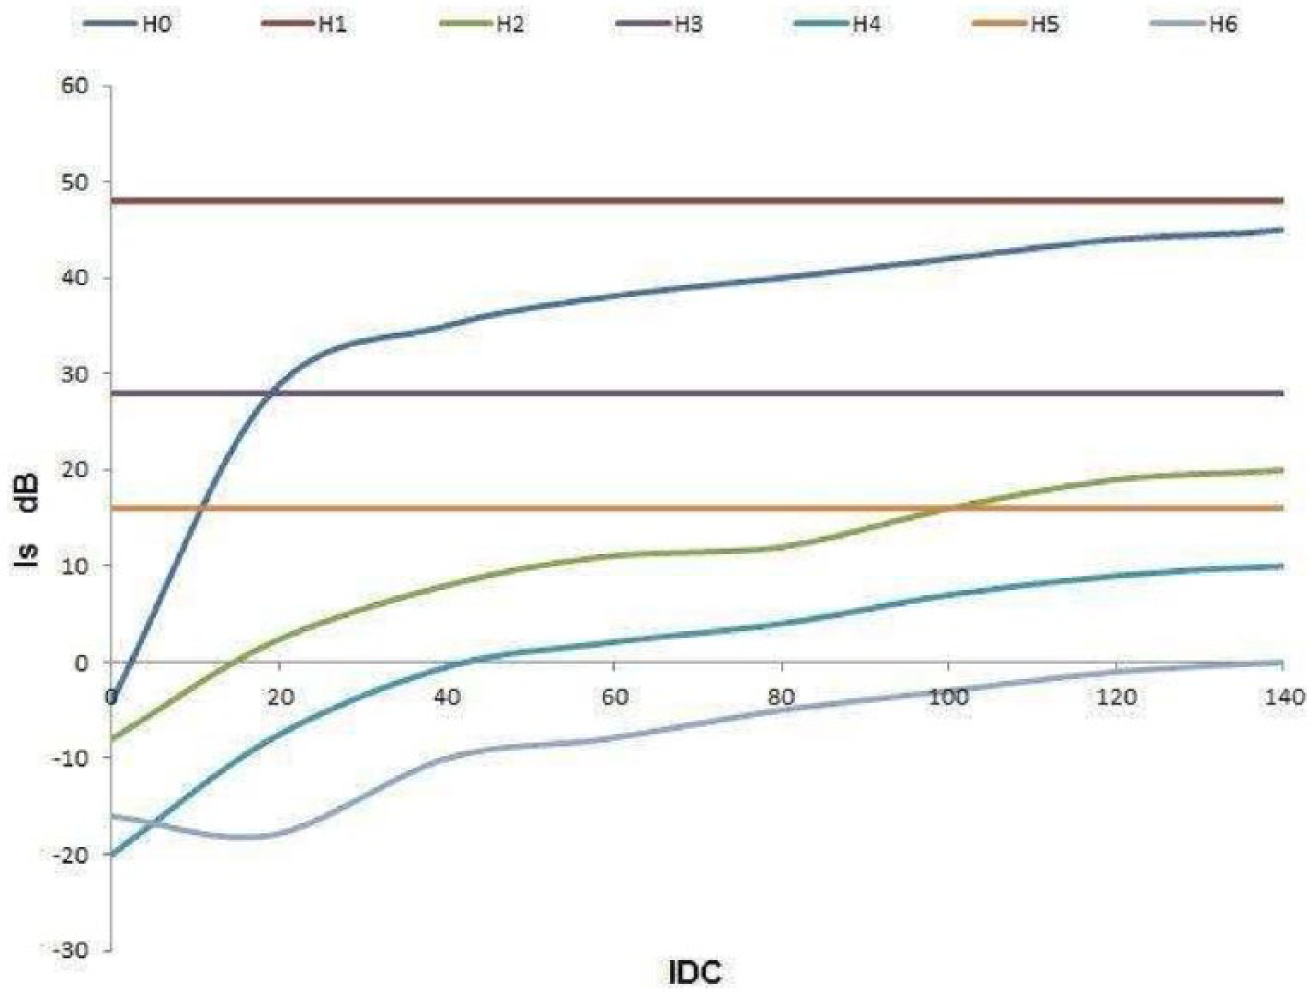
Behavior of the harmonics magnitude as a function of the DC magnitude
IV. Conclusion
A detection system of GICs in power transformers was presented, based on the measurement of the magnetic field outside the magnetic core. The transformer core operating conditions are possible to evaluate by the measurement of the even harmonics caused by asymmetric saturation. The odd harmonics caused by symmetric saturation does not affect the determination of the presence of DC like GICs. The experimental setup and the instrumentation required for real-time detection of asymmetric saturation caused by quasi-DC magnetic fields were presented. The results obtained by simulating the presence of GICs show that the measurement of harmonics allows developing protection systems to be scaled to large power transformers.
Footnotes
Funding
The author(s) received no financial support for the research, authorship and/or publication of this article.