
Abstract
This paper presents a multi-sensor data fusion model for measurement of temperature. The proposed paper puts forward an objective to develop a temperature measuring instrument (a) having improved performance characteristics like sensitivity and linearity (b) that produces accurate measurement even though a sensor is faulty. The technique is designed using the framework of multi-sensor data fusion consisting of sensor like thermistor, thermocouple, and resistance temperature detector. Output from all these sensors are converted to a common representation format using radiometric normalization. Pau’s framework is used for implementing the task of fusion in the proposed paper. Implemented laboratory model is tested for functionality using extensive set of data. Output shows that the proposed technique was able to produce improved linear and sensitive output as compared to system with individual sensor. Root mean square of percentage error obtained for tests conducted is about 0.86%, which is a significant improvement.
I. Introduction
Temperature is one physical quantity which almost affects all processes in nature. Thus, it is a very important parameter which needs to be controlled for desired performance of any process. For a precise control action, accurate measurement of process variable is desired. Measurement involves elements like sensors/transducers, signal conditioning, and data conversion circuits (DCCs). Sensors are the primary elements which convert the actual temperature to any electrical quantities. Different kinds of sensors/transducers are available in market for measurement of temperature. Selection of transducers is often based on range, characteristics, cost, and so on. However, often the selection will end up in a trade-off between two or more sensor characteristics.
A survey on existing temperature measurement techniques is carried on to understand the behavior of existing temperature measurement techniques. Reported works are discussed as in Usamentiaga et al., 1 temperature measurement in the manufacturing process of steel is carried on by processing the captured infrared thermography images. Electromagnetic characteristics are analyzed to compute the temperature of winding coil in Son and Lee. 2 Usamentiaga et al.’s 3 paper discusses infrared imaging technique for detecting temperature of molten pig iron. In Sardini and Serpelloni, 4 design of signal conditioning circuit for measurement of temperature using micro-electro mechanical system (MEMS)-based resistance temperature detector (RTD) is reported. Rayleigh back scattering spectra shift caused in an optical fiber under cryogenic environment is computed for temperature measurement using the technique of optical frequency-domain reflectometry in Du et al. 5 The principle of capacitance variation with temperature is made use of to generate resonating frequency using an inductance in series. The resonant signal is measured using wireless technique to compute temperature in Li et al. 6 Digital image correlation technique is developed in Su et al. 7 for the measurement of disturbance in thermal image caused due to change in temperature. Usage of lithium-niobate pyroelectric ceramic for temperature measurement is discussed in Sarker et al. 8 Design of fuzzy-based proportional integral derivative controller for temperature control in a furnace is reported in Cao et al., 9 and process variable temperature required for obtaining controlled parameters is computed using resistive temperature transducer. Controller design for air temperature control using neural network is discussed in Zhu et al., 10 and actual temperature data for controller is derived from the thermocouple transducer. Aung et al.’s 11 paper discusses the design and implementation of signal conditioning circuit for an electrochemical sensor for measurement of temperature. Design of calibration technique using mapping correlation vectors is reported in Xie and Ng 12 for temperature sensor used in thermal imaging technique. Measurement of temperature by determining the relationship between the spectrum intensity of the scattered wavelength of optical ray derived from halogen lamp is reported in Toriyama et al. 13 The technique also discusses effect of band wavelength on the measurable range. Although a lot of measurement techniques are available for measurement of temperature using different sensors, each of those have certain drawbacks in terms of measurement range, characteristics of sensors, and so on.
These drawbacks have promoted many researchers to develop a technique using the concept of multiple sensors and/or multiple measurements. Some papers have discussed the use of multiple sensors for measurement. A multi-sensor data fusion technique comprising image camera and colorimetric thermometer is used to measure the temperature of billets surface in a secondary cooling zone. Output of colorimetric thermometer and appearance of billets are used to obtain the temperature ranges of billets surface in Zhang et al. 14 In Sugita et al., 15 a cluster of thermocouple micro-sensors are integrated to measure the temperature of the cutting tool. Ultrasonic waveguide are analyzed for computing temperature gradient and used to measure liquid levels as reported in Periyannan and Balasubramaniam. 16 Output of multi-fluorescent micro-sensor is analyzed using fusion technique for accurate measurement of pH and temperature in Liu et al. 17 Similarly, in Yang et al., 18 cladless fiber grating sensor is used to measure the refractive index and temperature of liquid medium using signal processing algorithms. In Molina et al., 19 use of multiple temperature sensor for increasing the redundancy in flow measurement using insertion calorimetric flow meter is reported. Temperature sensor outputs are used to characterize the chemical targets in Raman et al. 20 for untrained backgrounds using the spectral density functions. In Davidson et al., 21 a technique is reported for estimation of real-time temperature of multiple power electronic systems using data fusion analysis. From the above reported works, it is clear that multi-sensor data fusion is gaining importance in instrumentation domain, although a lot of work is more concentrated toward increasing the measurement range and parameters of measure. Less works have been reported in the field of improving the characteristics of measurement. In view of these, the present paper proposes a technique consisting three sensors for improving the characteristics of measuring instrument. Sensors have been considered such that characteristics are dissimilar to each other.
In the proposed technique, three temperature sensors, namely, thermistor, thermocouple, and RTD are used for measurement of temperature. The proposed fusion system will have an improved characteristic in terms of linearity, sensitivity, and fault tolerance as compared to measurement technique with single sensor.
The paper is organized as follows: after introduction in Section I, a brief description about the available measurement technique is given in Section II. Section III deals with the problem statement followed by proposed solution in Section IV. A result of the proposed technique is reported in Section V. Conclusion of proposed work is discussed in Section VI.
II. Available Measurement Technique
A. Temperature measurement using RTD
RTDs are elements that make use of change in electrical resistance of a particular material with change in temperature. The relation between temperature and resistance given by the Callendar-Van Dusen22,23 is as shown in Equations (1) and (2)
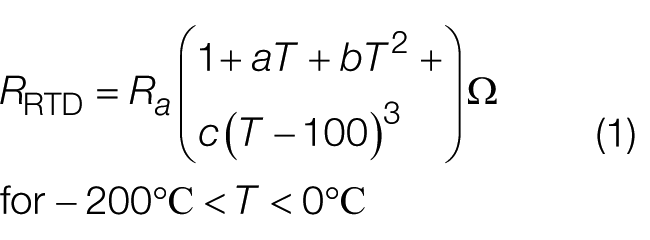
where RRTD is the resistance of RTD at temperature T°C, Ra is the resistance of RTD at temperature 0°C (reference resistance), and a, b, and c are temperature coefficients of RTD.
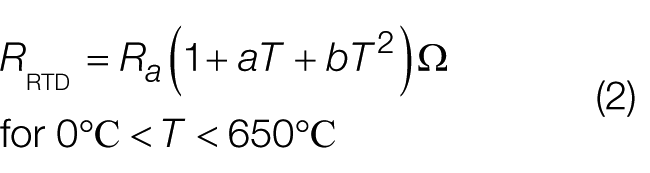
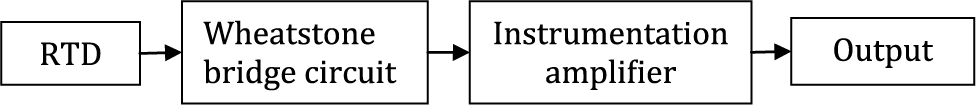
To convert the resistance signal acquired from RTD to an active signal (voltage), a DCC is designed. Representation of the same is shown in Figure 1 , followed by actual circuit in Figure 2 .
Block diagram of temperature measurement system using RTD
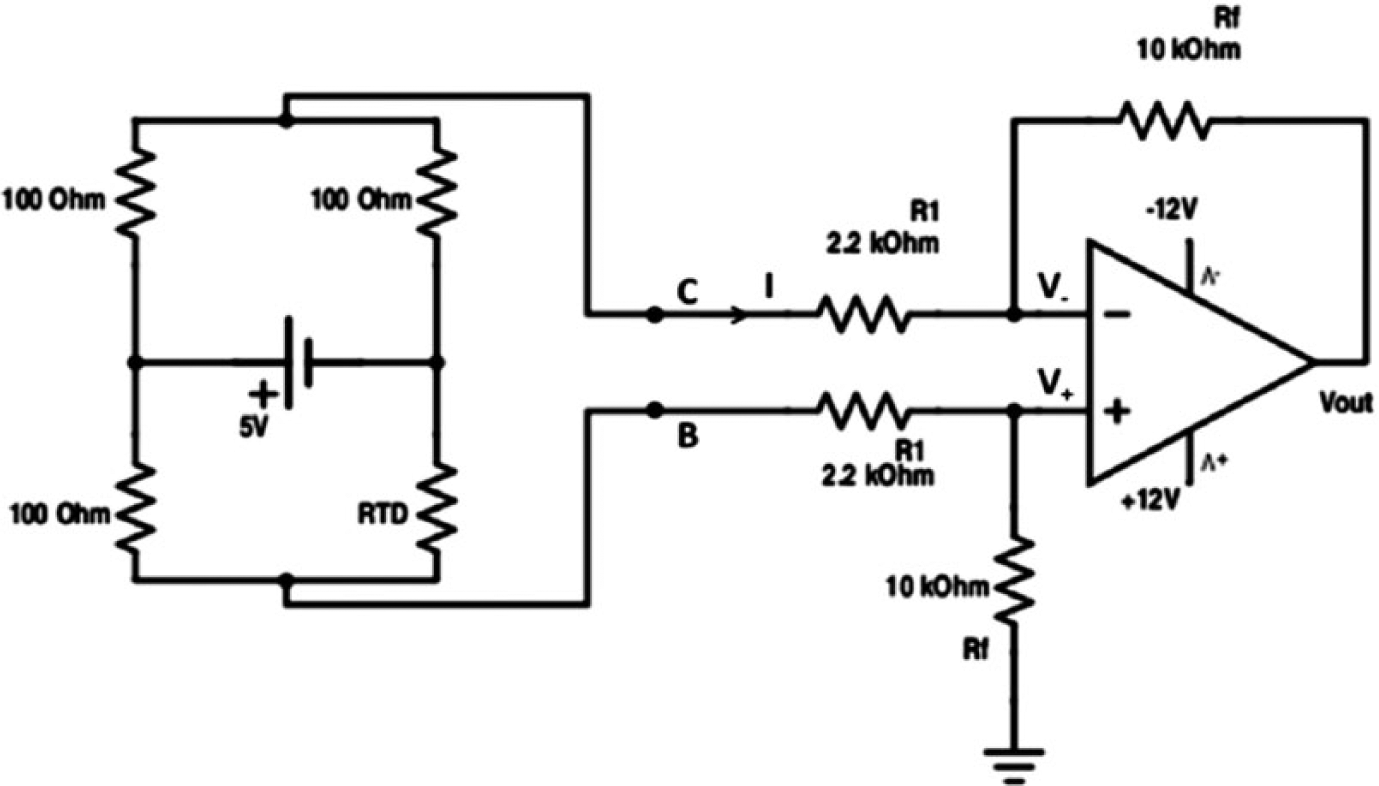
Circuit used to convert output of RTD to voltage
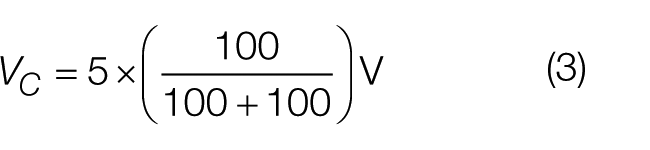
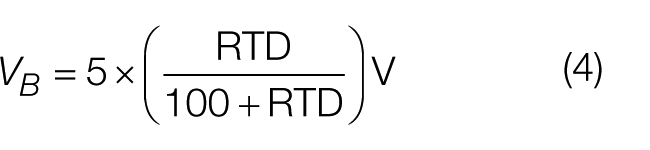
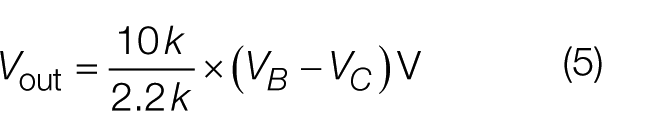
Wheatstone bridge circuit is used to convert resistance to voltage. Wheatstone bridge also decreases the offset present in RTD output. Output of Wheatstone bridge is represented by output Equations (3) and (4). This is further connected to a differential amplifier, whose output is given in Equation (5)
B. Temperature measurement using thermistor
Thermistors are a class of thermally sensitive resistors which have negative temperature coefficient (NTC) or positive temperature coefficient (PTC).22,23 In the proposed work, NTC is used. Resistance of the NTC thermistors varies inversely for variation in temperature. Steinhart–Hart Equation (6) is used to describe the exponential relation between resistance–temperature characteristics
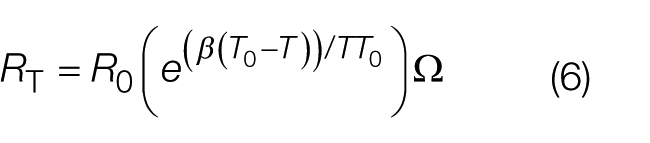
where RT is the resistance of thermistor at T°C, R0 is the resistance of thermistor at T0°C, and β is temperature coefficient
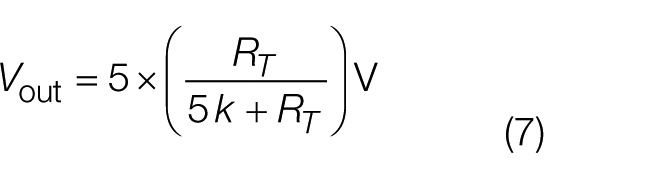
Once the resistance for variation in temperature is computed, it is further converted to voltage using a voltage divider and amplifier circuit. Block diagram and circuit diagram of the same are as shown in Figures 3 and 4 , respectively. The output equation of the same is as represented in Equation (7)
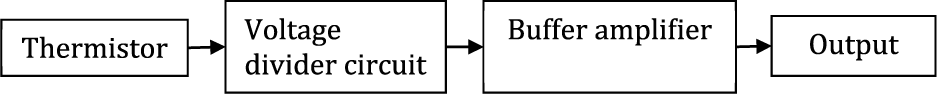
Block diagram of temperature measurement technique using thermistor
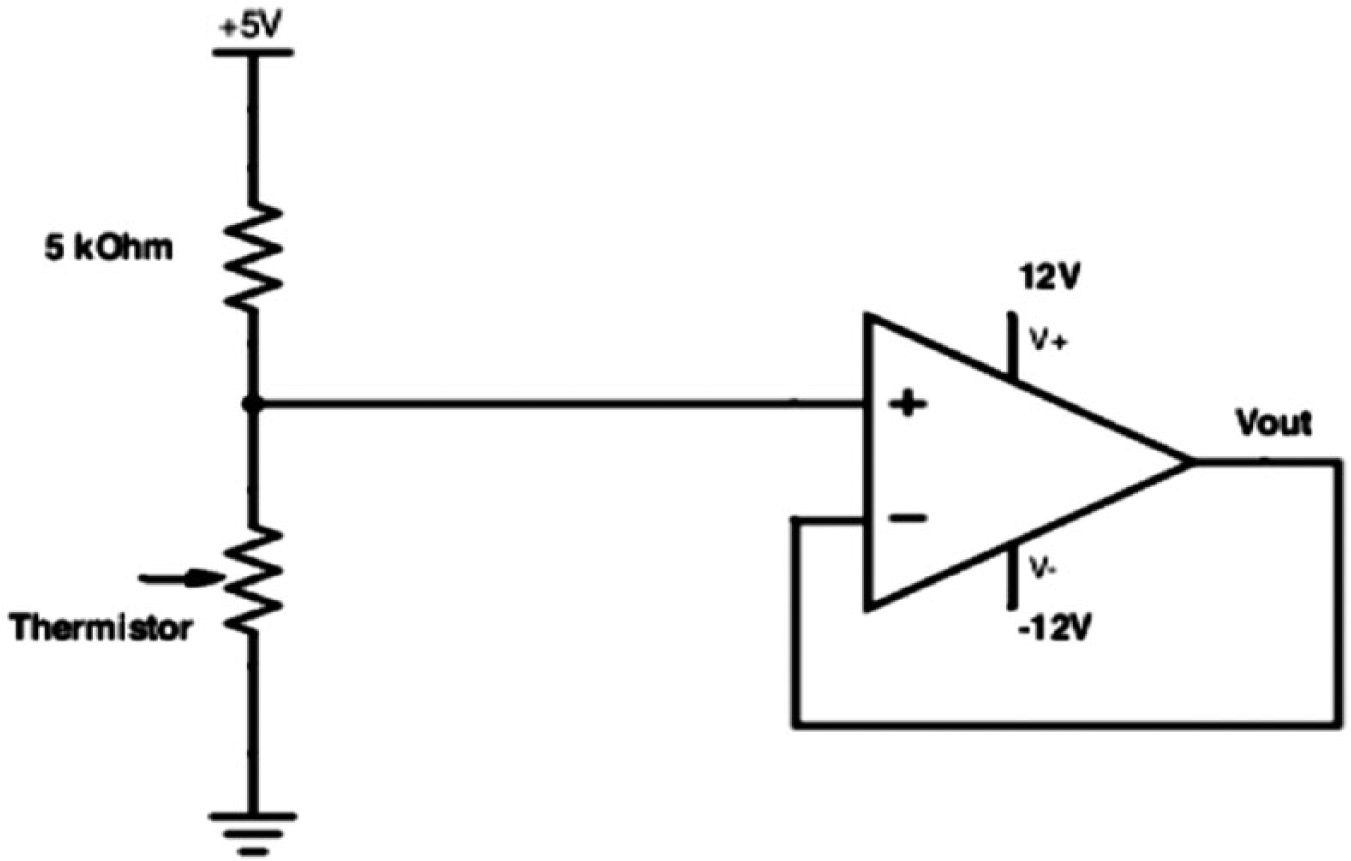
Circuit diagram of data conversion circuit for thermistor
C. Temperature measurement using thermocouple
Block diagram of temperature measurement system using thermocouple is shown in Figure 5 . The measurement system consists of thermocouple and instrumentation amplifier.22,23
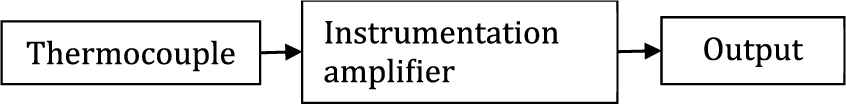
Block diagram of temperature measuring technique using thermocouple
A thermocouple ( Figure 6 ) is made by joining two thermo-electrically different elements. These two thermo elements have a positive and negative property. Thermocouple electrical properties change with the change in temperature to produce potential difference proportional to the change in temperature. The junction end is immersed in the environment whose temperature T2 is to be measured, while the tail end is held at a different temperature T1.
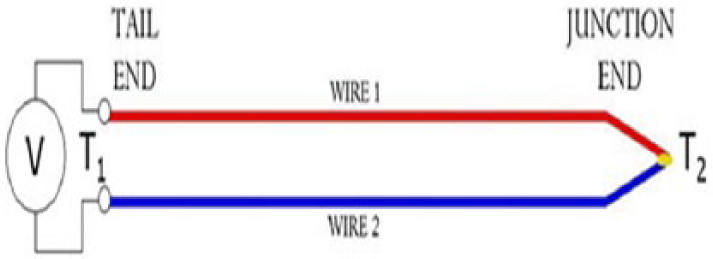
Schematic diagram of a thermocouple
Temperature difference between the junction end and the tail end causes a voltage that is measured between two thermo elements, at the tail end. Equation (8) illustrates the power series model used for J-type thermocouples
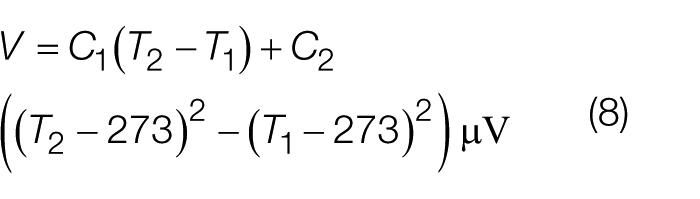
where T2 is hot junction temperature of the thermocouple in °C, T1 is cold junction temperature of the thermocouple in °C, and C1 and C2 are coefficients depending on the materials used.
Output of thermocouple will be of the range micro-volts, and so an instrumentation amplifier is used to amplify the level of signal as shown in Figure 7 . Equation (9) shows the computed voltage output from the thermocouple
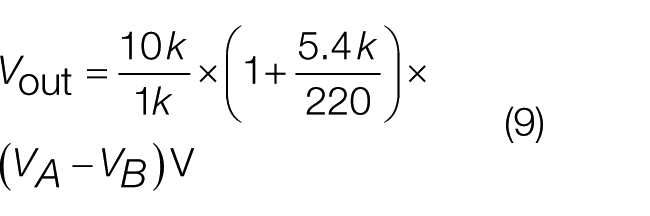
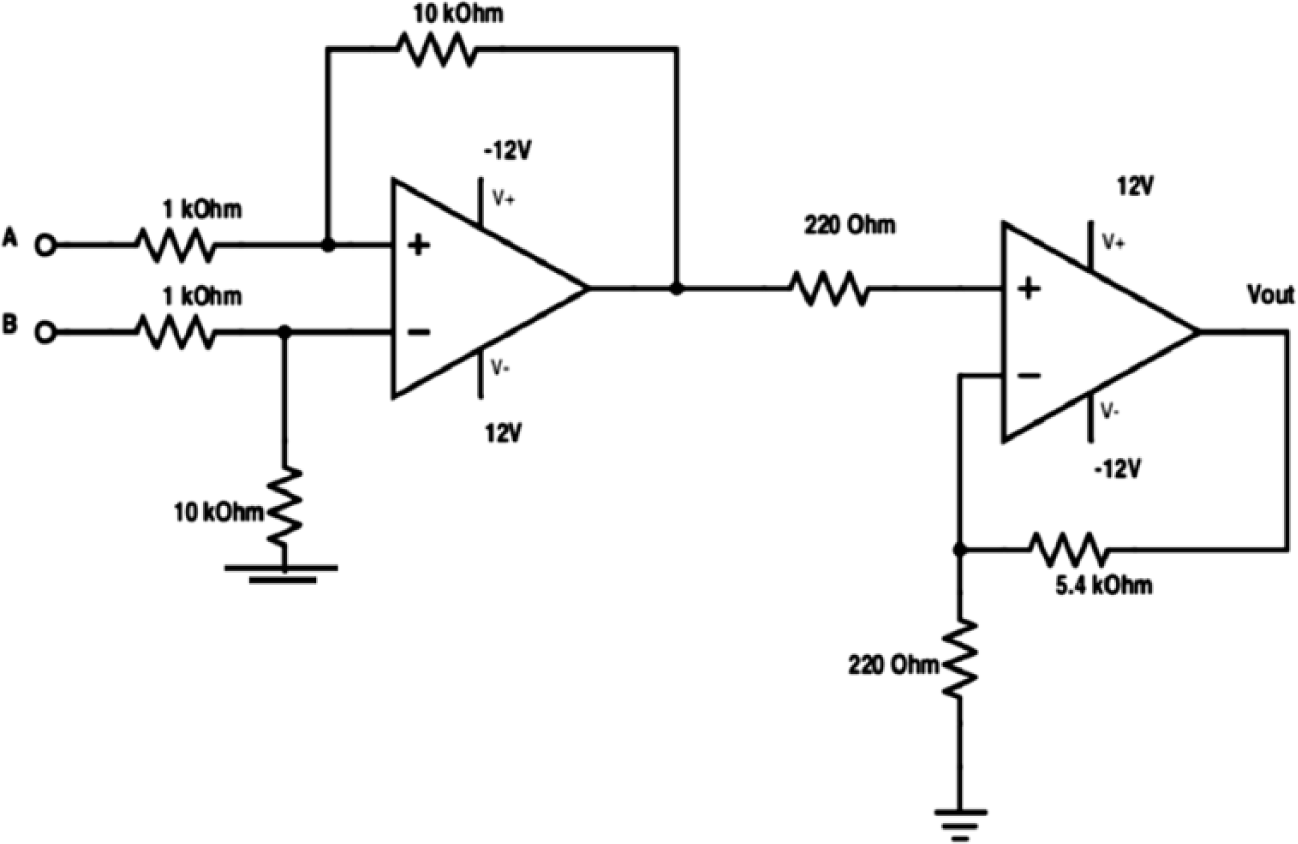
Circuit of instrumentation amplifier used for thermocouple
III. Problem Statement
To analyze the characteristics of all the temperature measuring instruments discussed in the earlier section, they are subjected to test. The laboratory setup involves water bath consisting of water and coil to vary the temperature as shown in Figure 8 . Response obtained from each of the measurement systems for variations in temperature is plotted in Figures 9 – 11 . Figure 9 indicates the response of RTD-based measurement systems. Output characteristics show considerable linear relation with input and ruggedness but have a very low sensitivity and high offset values. Similarly, Figure 10 shows the output of the thermistor-based measuring instrument. Output shows high sensitive characteristics but has highly nonlinear characteristics. On the contrary, the output characteristics of the thermocouple-based instrument as seen in Figure 11 show that its linearity and sensitivity are moderate when compared to other two, but output is highly prone to noise interferences. Measurement of temperature is carried out for the range of 25°C–95°C.
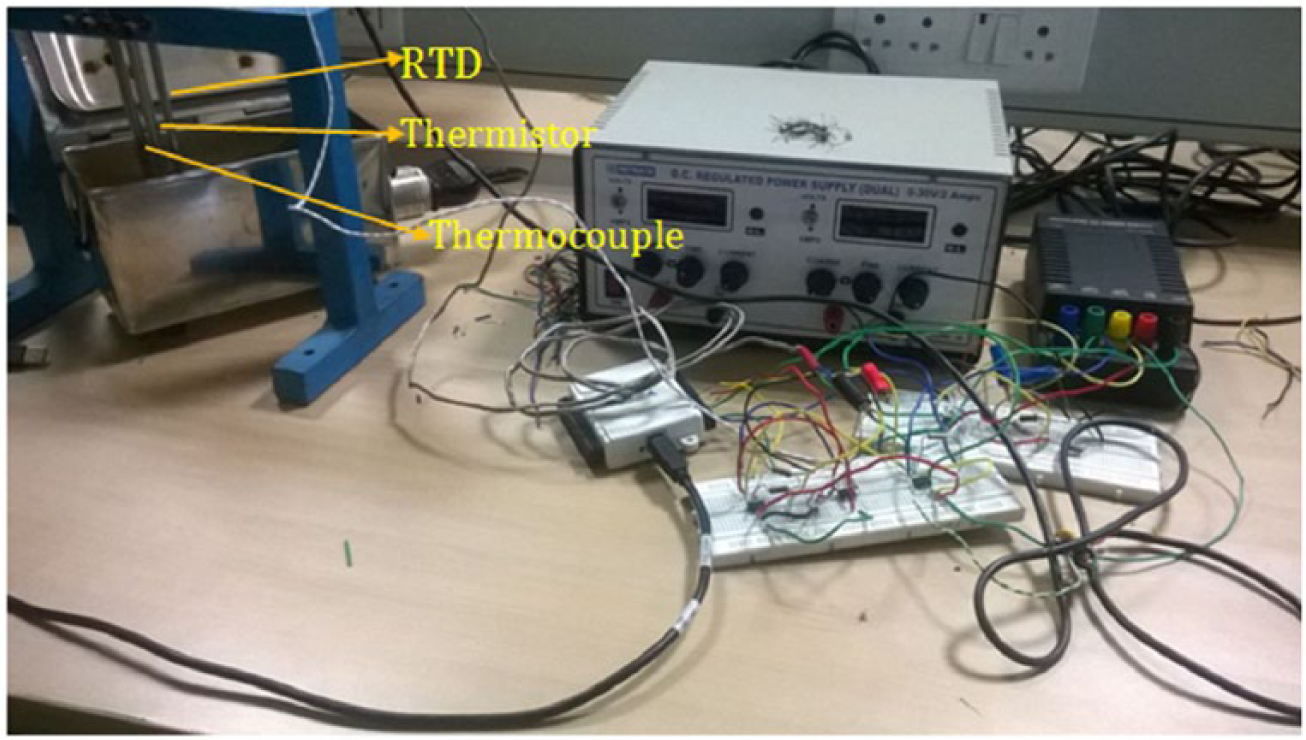
Experimental setup of proposed technique

Output voltage of data conversion circuit with RTD
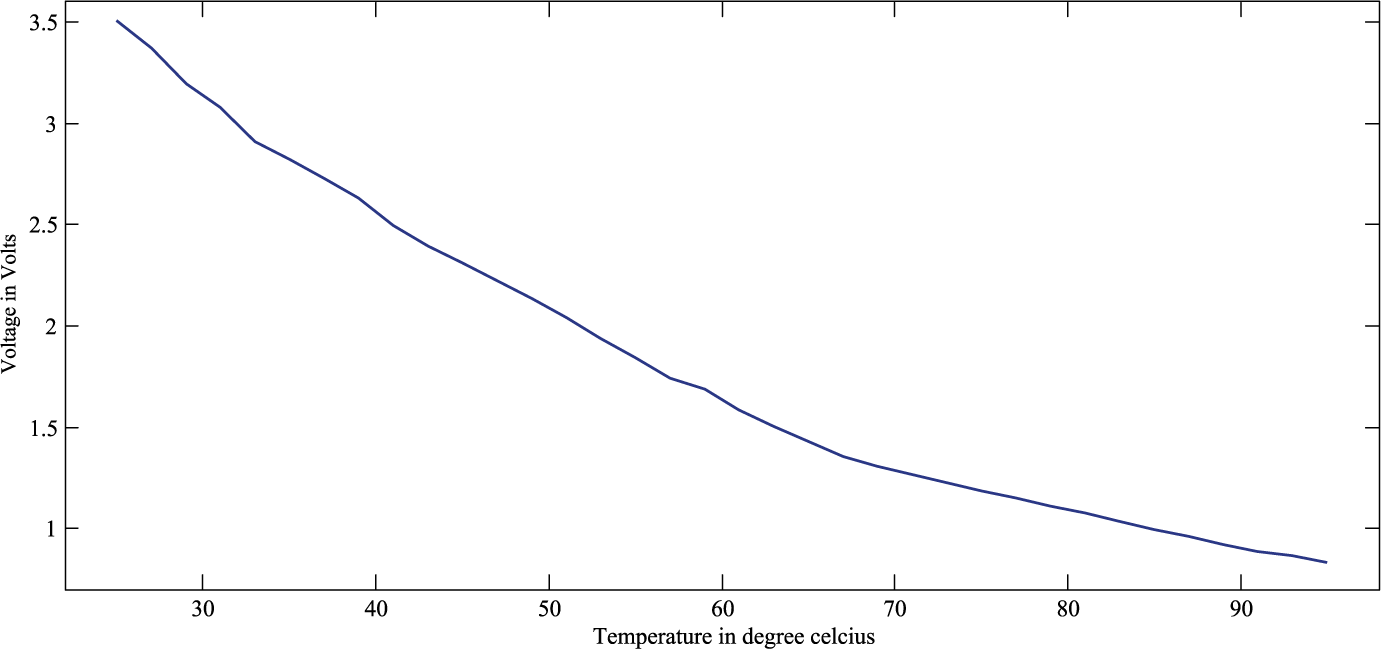
Output voltage of data conversion circuit with thermistor
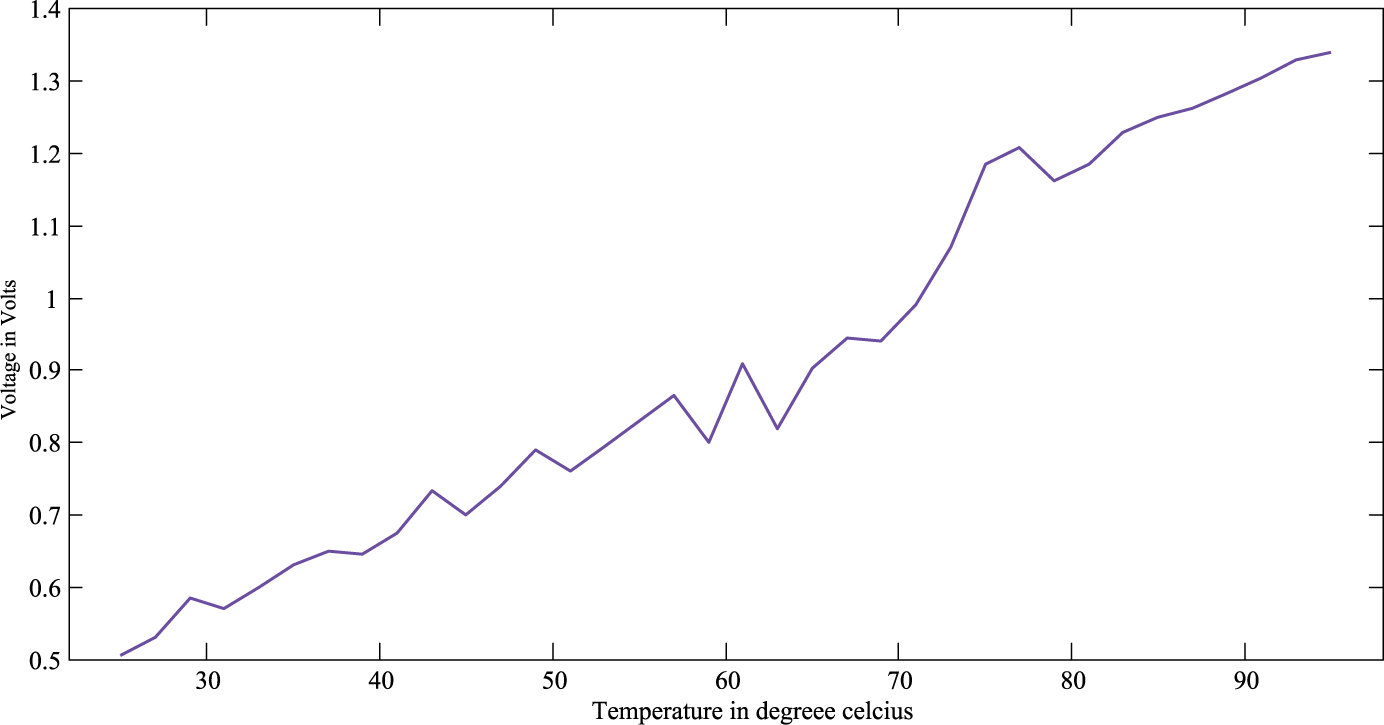
Output voltage of data conversion circuit with thermocouple
From the above plot, the following observations are evident
RTD-based system shows linear relation for changes in input, with less noise interferences, but has high offset and low sensitivity.
Thermistor-based system shows high sensitivity for a large range of input temperature, but has high nonlinearity.
Thermocouple-based system has characteristics intermediate to thermistor and RTD in terms of sensitivity and linearity, but has low output steadiness.
If in case any sensor fails, the system produces erroneous reading.
From the above observations, it is clear that if we use a particular sensor for measurement of temperature, the user will have to compromise between characteristics like sensitivity, linearity, and ruggedness. Therefore, a technique is proposed using multi-sensor data fusion to overcome the said drawbacks. The objectives of the proposed technique are as follows:
(a) Fused system output should be sensitive, linear, and immune to noisy environment;
(b) Indicate and isolate faults in sensors if any;
(c) Produce accurate measurement even though any one of the sensors fails.
IV. Problem Solution
To achieve the objectives discussed in the earlier section, a technique using Pau’s multi-sensor data fusion framework24,25 is used. Pau’s model of multi-sensor data fusion framework (Figure 12) is used because it is a behavioral knowledge–based model. The first level contributes for coordinate dimensions and measured parameter spaces (comprising of sensors and data conversion unit), followed by next level where relevant features are extracted and labeled (feature extraction stage). Next level contains techniques for alignment and associations of defined features. The final step consists of composition of behavioral rules to extract final information. Representation stage is used to display fused output. The whole process is designed using LabVIEW platform. Detailed description of design and implementation is discussed in the following sections.
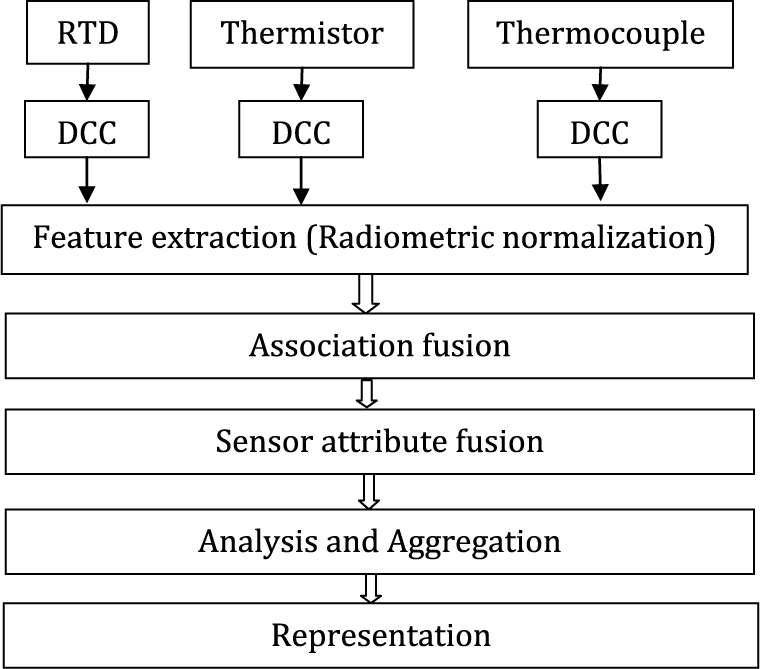
Data fusion framework (Pau’s) used in proposed work
D. Radiometric normalization
The technique of radiometric normalization is used to extract feature from all the three sensors: thermistor, thermocouple, and RTD. Output voltages from the DCC of measuring instrument will be of different ranges for a given temperature. So as to perform the task of sensor data fusion, values of all the sensors should be brought to common magnitudes. It is quite preferred to have data which are dimensionless. In order to perform this task, a technique of normalization as expressed in Equation (10) is considered
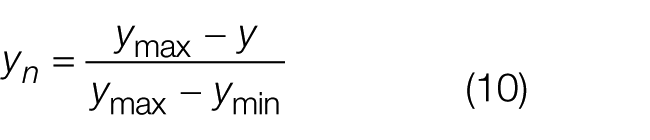
where yn is the normalized value of a given signal, ymax is the maximum value of the respective signal, ymin is the minimum value of the respective signal, and y is the signal to be normalized.
E. Fuzzy logic
Fuzzy logic block is used to design the functionality of association, sensor attributes, analysis, and aggregation in fusion process.26,27 First step of creating fuzzy logic block is to create the membership function for input and output. The membership functions for all the three inputs from normalized values of RTD, thermistor, and thermocouple are shown in Figures 13 – 15 , respectively. Output membership functions considered are shown in Figure 16.
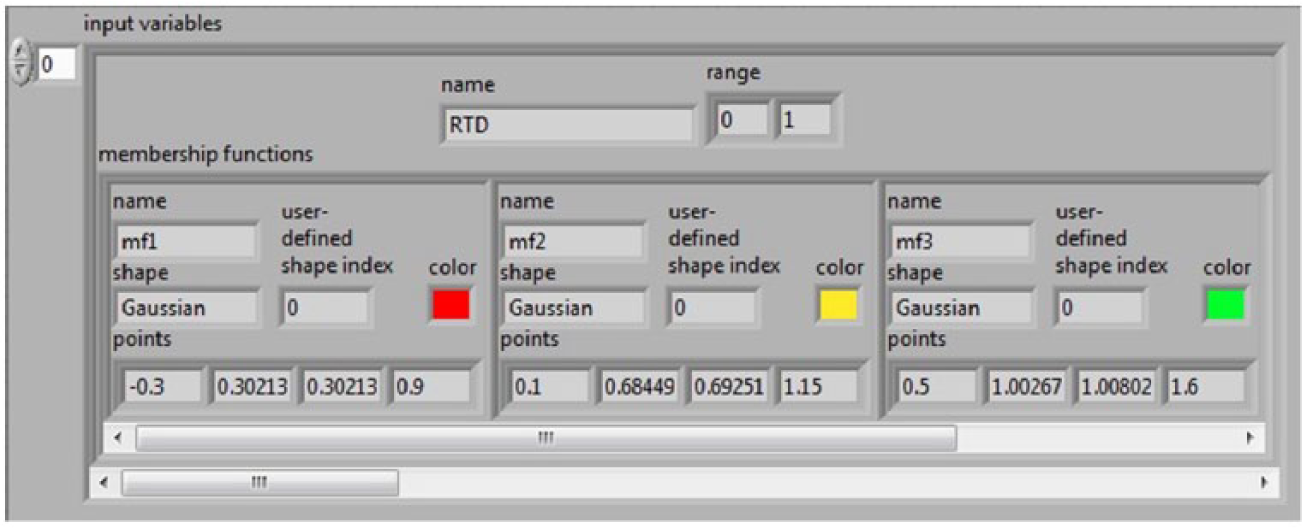
Input membership function representation for RTD output
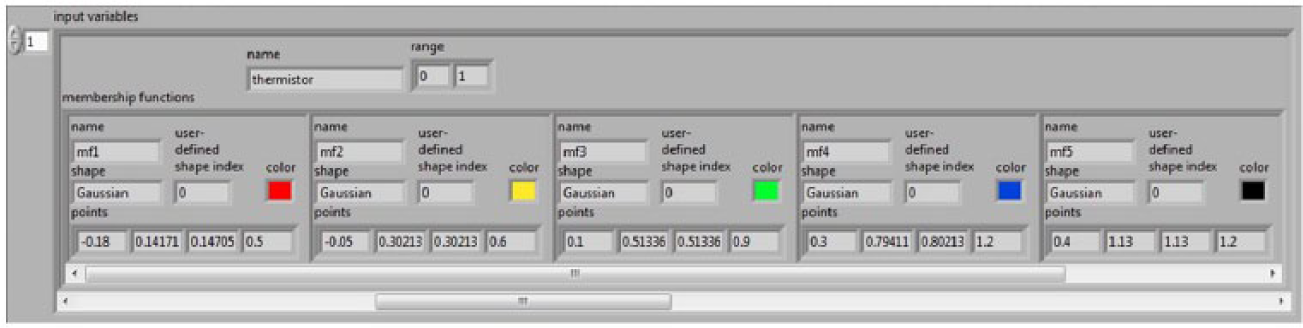
Input membership function representation for thermistor output
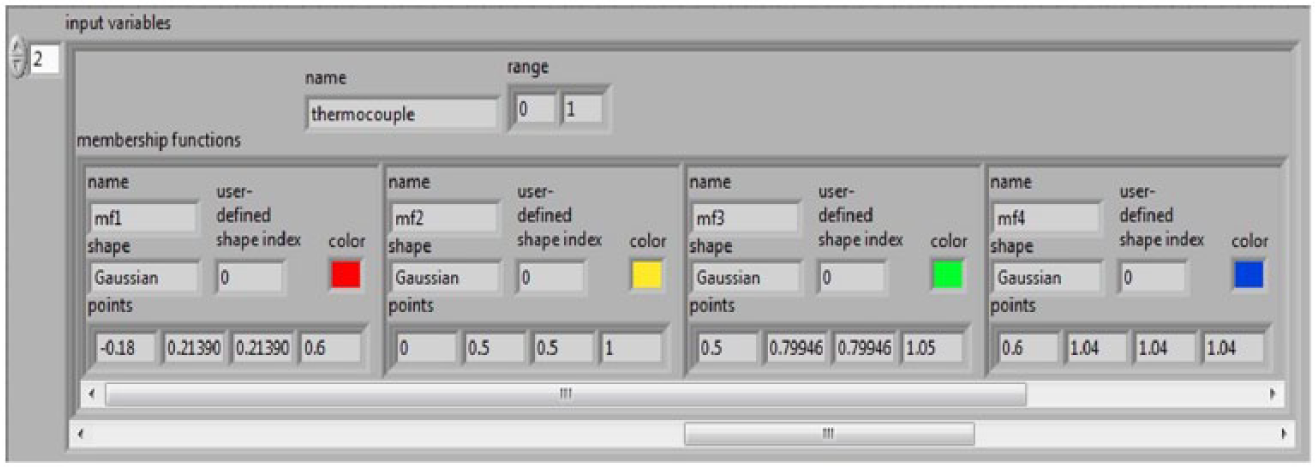
Input membership function representation for thermocouple output
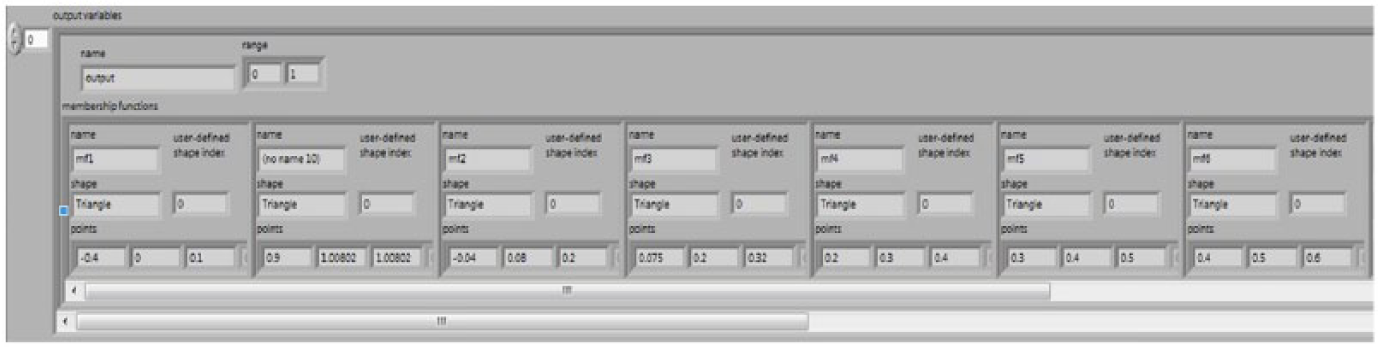
Output membership function representation for desired fuzzy logic block
Fuzzy membership function data in terms of shape, range of functions are decided based on input data characteristics. Gaussian type of function is considered for all the input membership data, and for output, triangular type of function is used. Range of function is considered based on degree of sensitivity of output variation with input. For data with larger variation rate, low values of data are considered and vice versa for smaller variation data. The optimized values are arrived after considering several trials.
F. Fault identification and diagnosis
The proposed technique is also designed to identify faulty sensor, and to also take necessary steps to measure temperature without degrading performance even with faulty sensor. Here, we have considered sensor errors like open circuit, short circuit, and stuck to value. The output at every sample is loaded on to memory using the stack array, every time the value is noted and compared with its previous value to check whether the output remains static for three consecutive cycles, and this condition is compared with that of other sensors; if there is a similar behavior, it means the sensors are functional. If the behavior is not same, then the sensor is considered to be faulty. Once a particular sensor is considered to be faulty, output obtained from remaining sensors are only used to give the measured output using same membership functions but with different fuzzy rule base.
G. De-normalization
Output of the fuzzy block represents output in terms of normalized values in the range of 0–1 with reference to temperature. Therefore, a de-normalization equation is used to represent the output in terms of temperature for the user
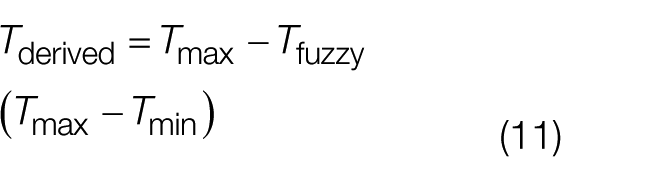
where Tmax is the maximum value of temperature, Tmin is the minimum value of temperature, and Tfuzzy is the output of fuzzy logic block.
The block diagram of fusion process designed on LabVIEW platform is as shown in Figure 17 .
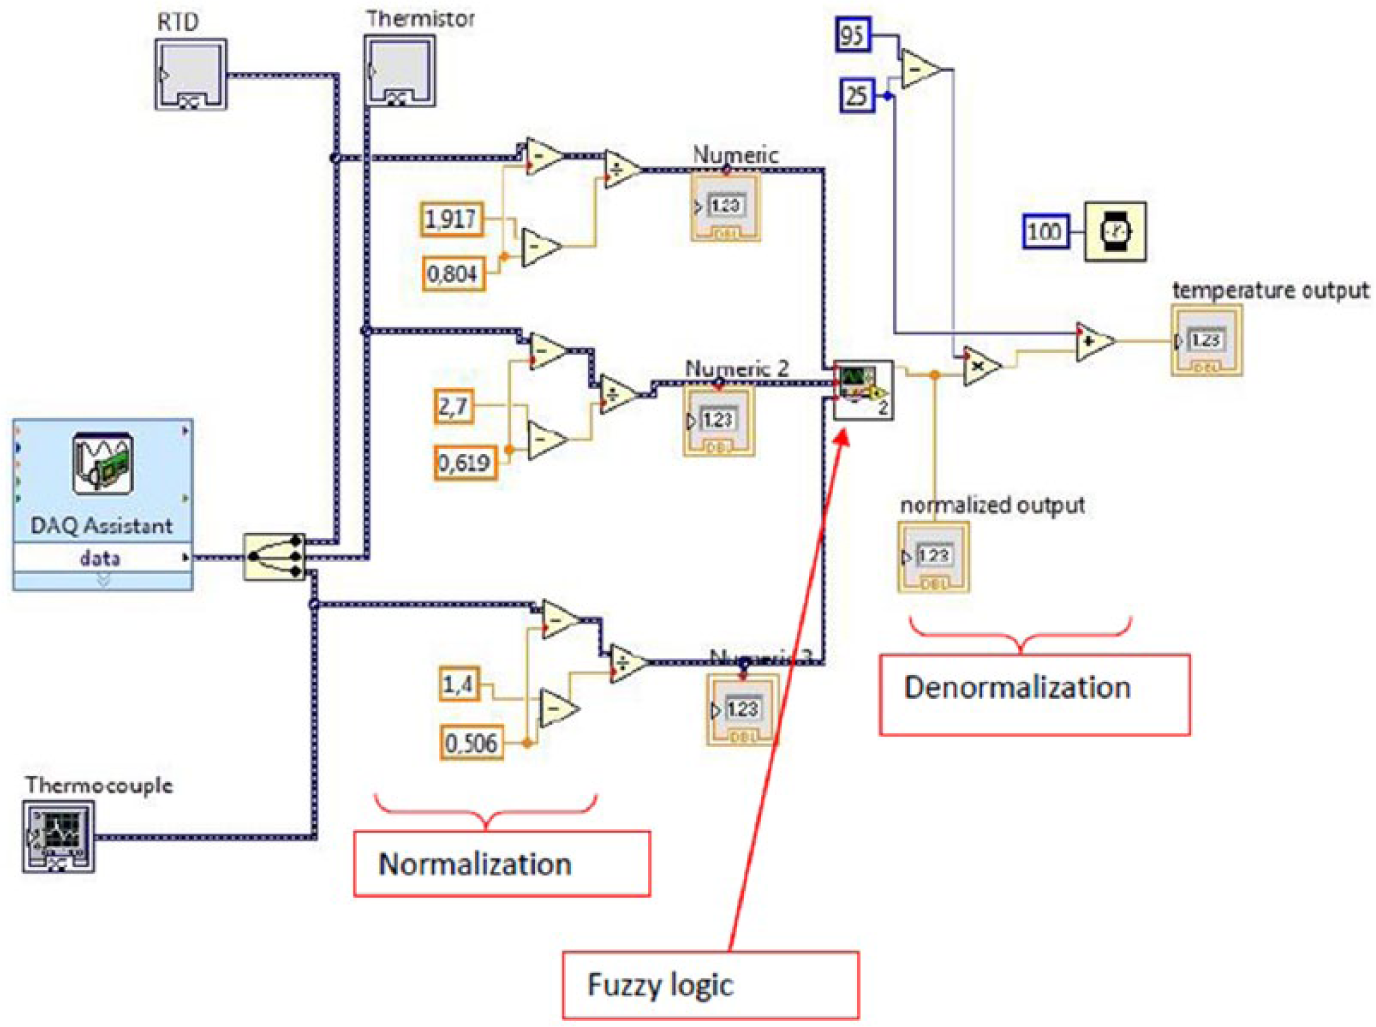
Fusion block designed on LabVIEW platform
V. Results
Once the entire technique is designed with multi-sensor data fusion using Pau’s framework, it is subjected to a series of tests for validating its performance. First, to evaluate the improvement in measurement characteristics, it is subjected with standard temperatures over the range of measurement under both rising and falling values of input temperature. Measurement reading acquired from the standard instrument and reported technique for variations in temperature is tabulated in Table 1 . Table 1 also indicates the percentage of error in comparison to standard and reported works.
Output obtained with all working sensors.
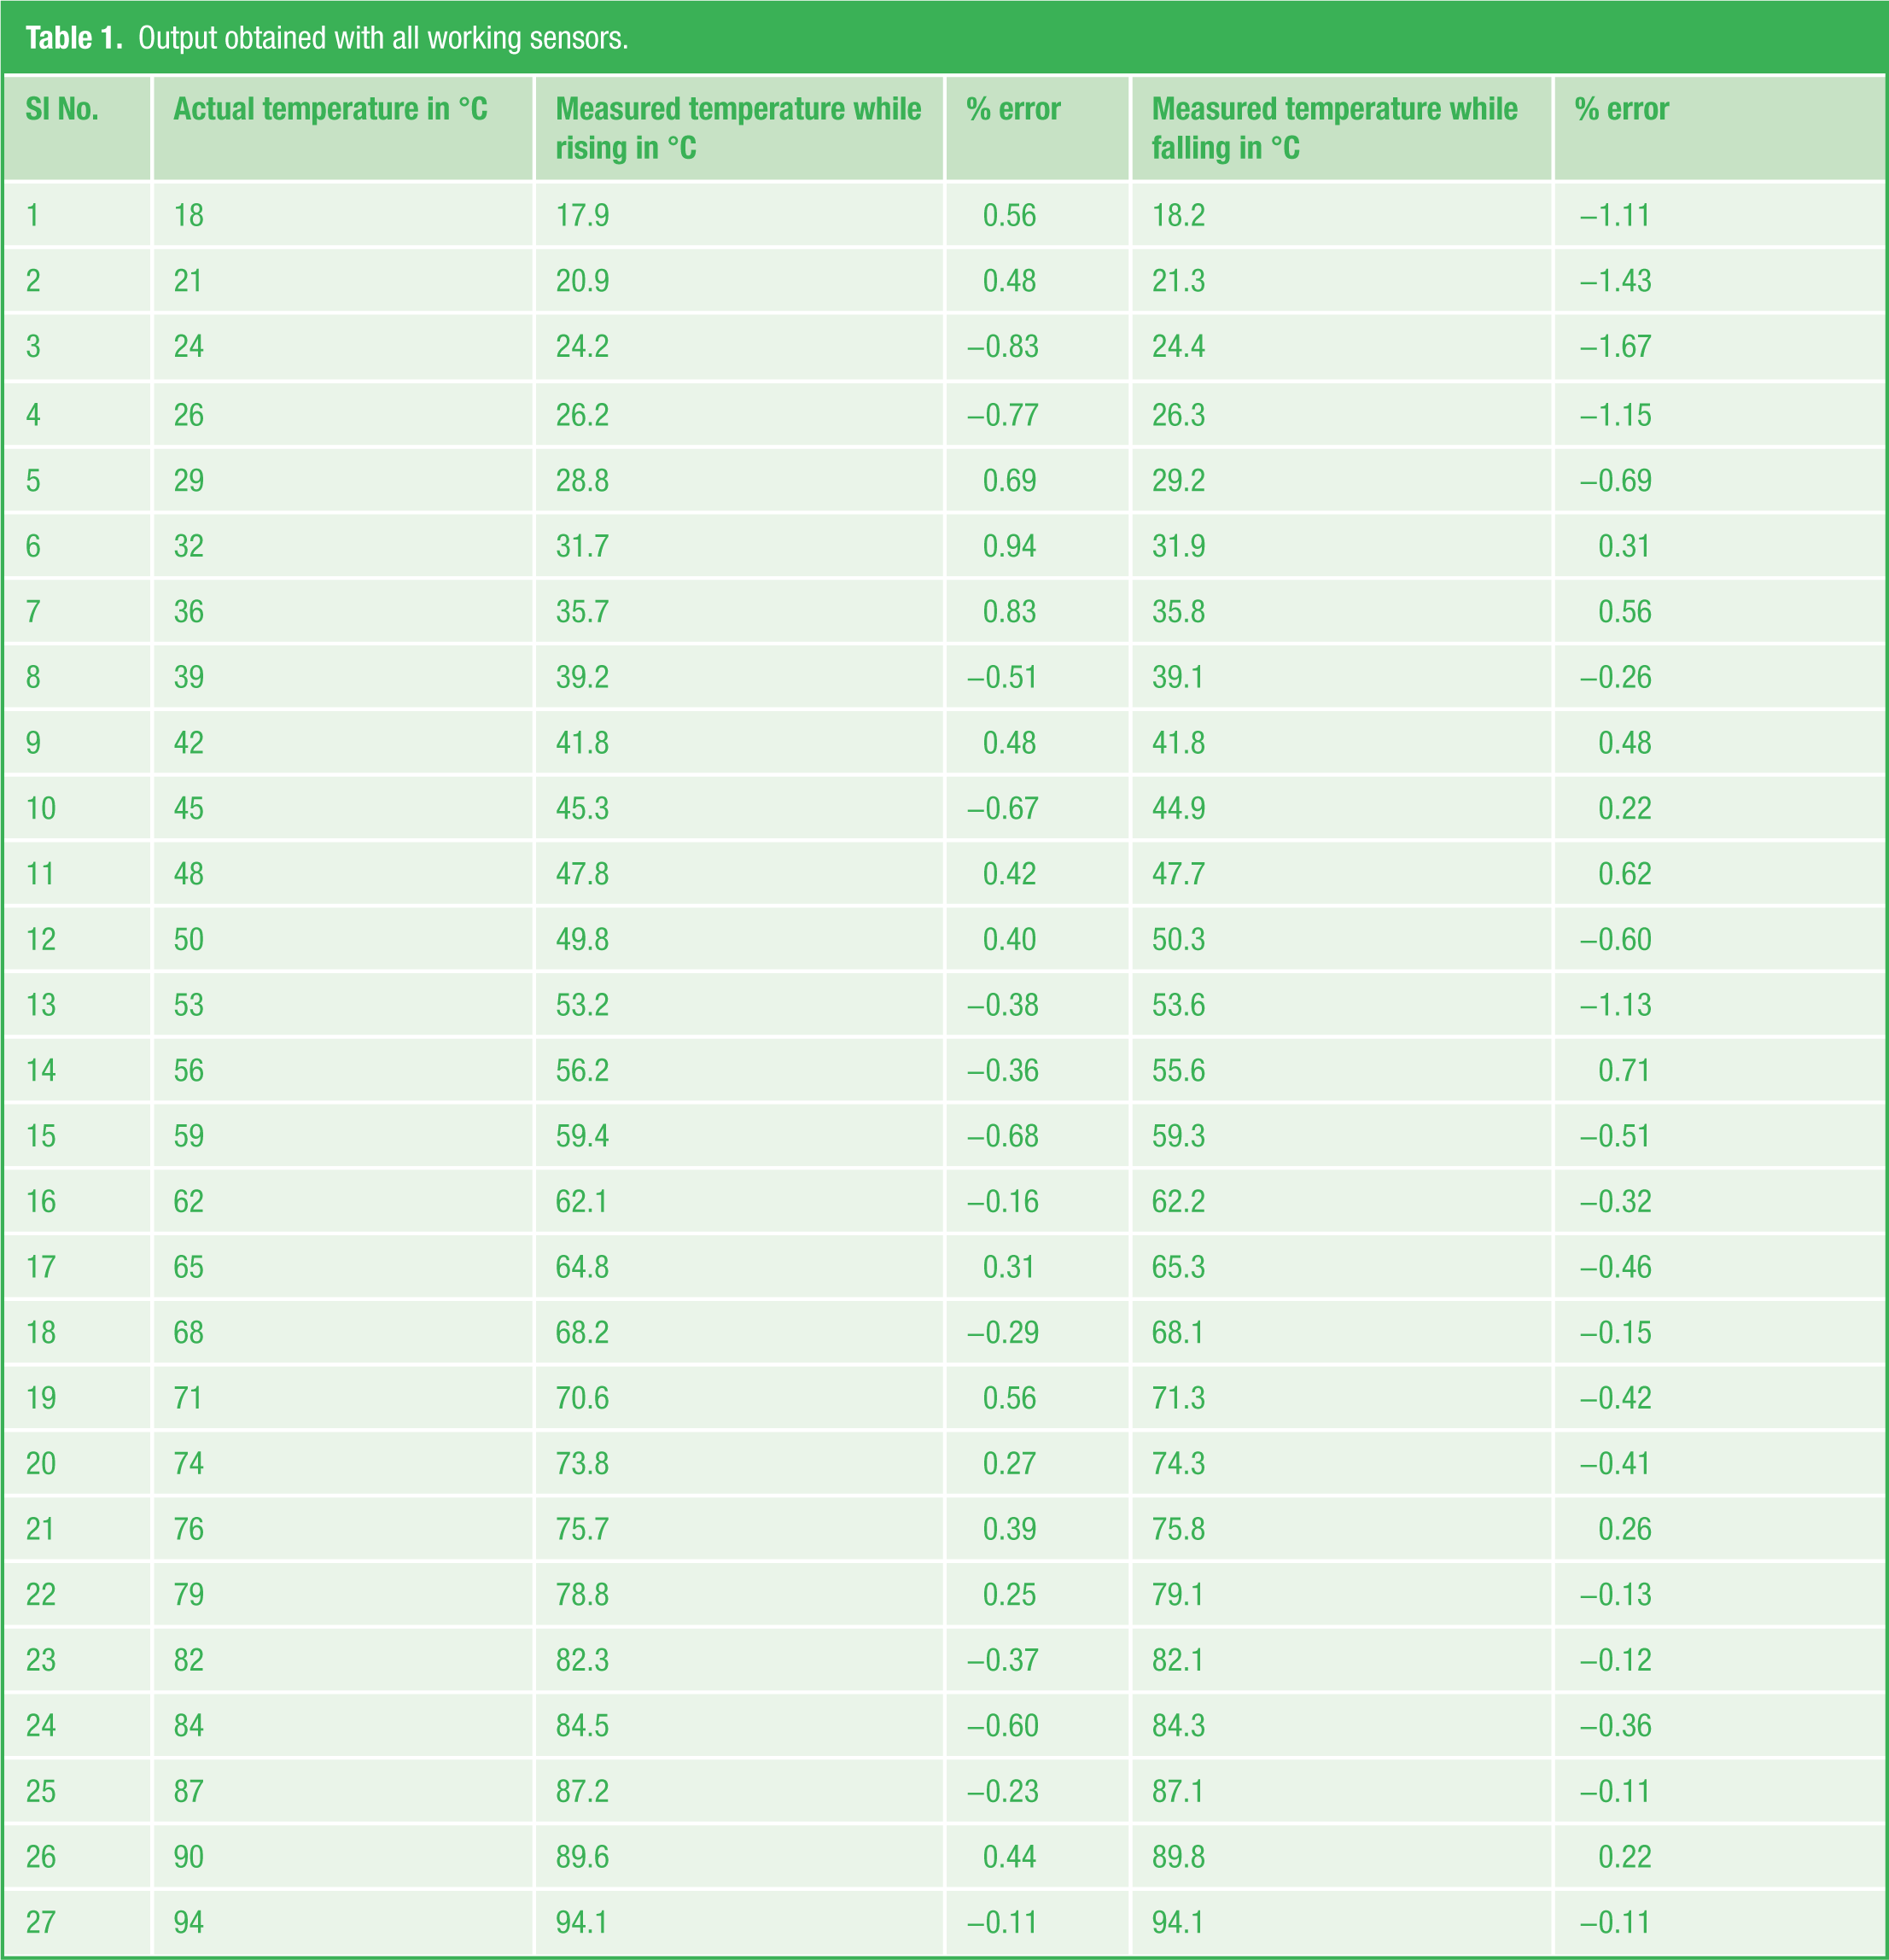
Output obtained from the proposed temperature measurement technique is tabulated in Table 1 , with temperature varying in the range of 18°C–94°C in both dynamic conditions of increasing and decreasing temperature. The performance of the proposed technique can be analyzed by comparing the output with standard measuring instrument, and it is very clear that the difference between them is less than 1°C. Root mean square of percentage error computed from the conducted test is 0.78%, which is an indication of accurate measurement. From the plot of actual versus measured output ( Figure 18 ), it can be seen that desired characteristics in terms of linearity and sensitivity are improved when compared to individual sensor output.
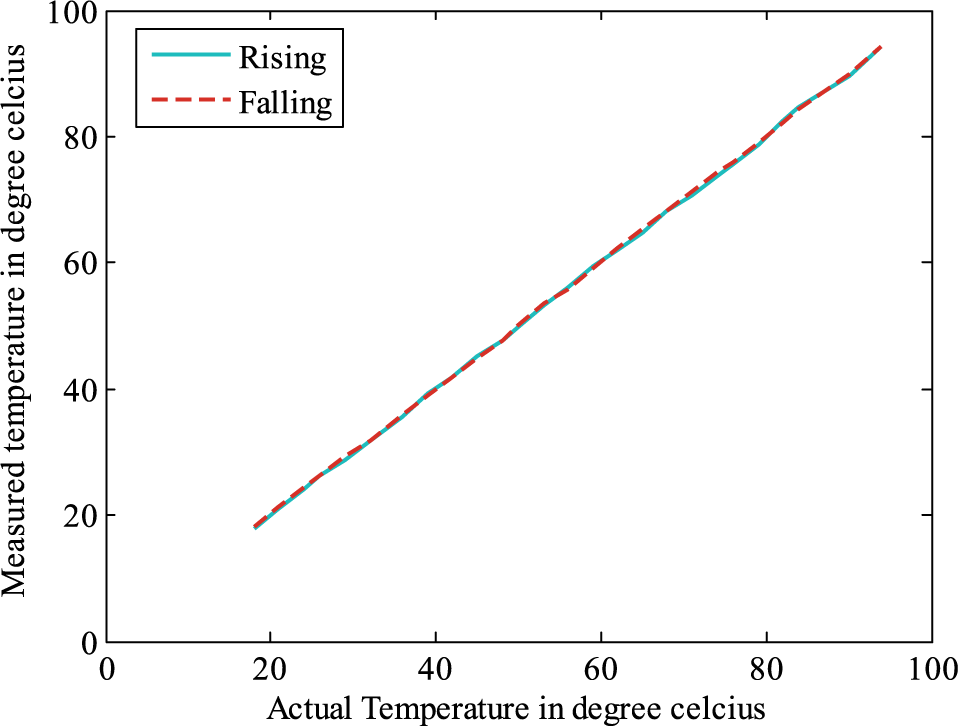
Input versus output characteristics of proposed technique
Once the performance evaluation is carried out for a fused system with all the three good sensors, it is further tested with a faulty sensor. For testing, one of the three sensors is made faulty and output obtained for entire range of measurement is tabulated in Table 2 . The percentage error graph obtained when different sensors are faulty is also shown in Figure 19 . From Table 2 and Figure 19 , it is clear that the proposed system performs well even with one faulty sensor, and the technique is also able to isolate the sensor fault by indicating the faulty sensor. The root mean square of percentage error obtained with a faulty sensor is 0.99%.
Output obtained when one of the three sensors is faulty.
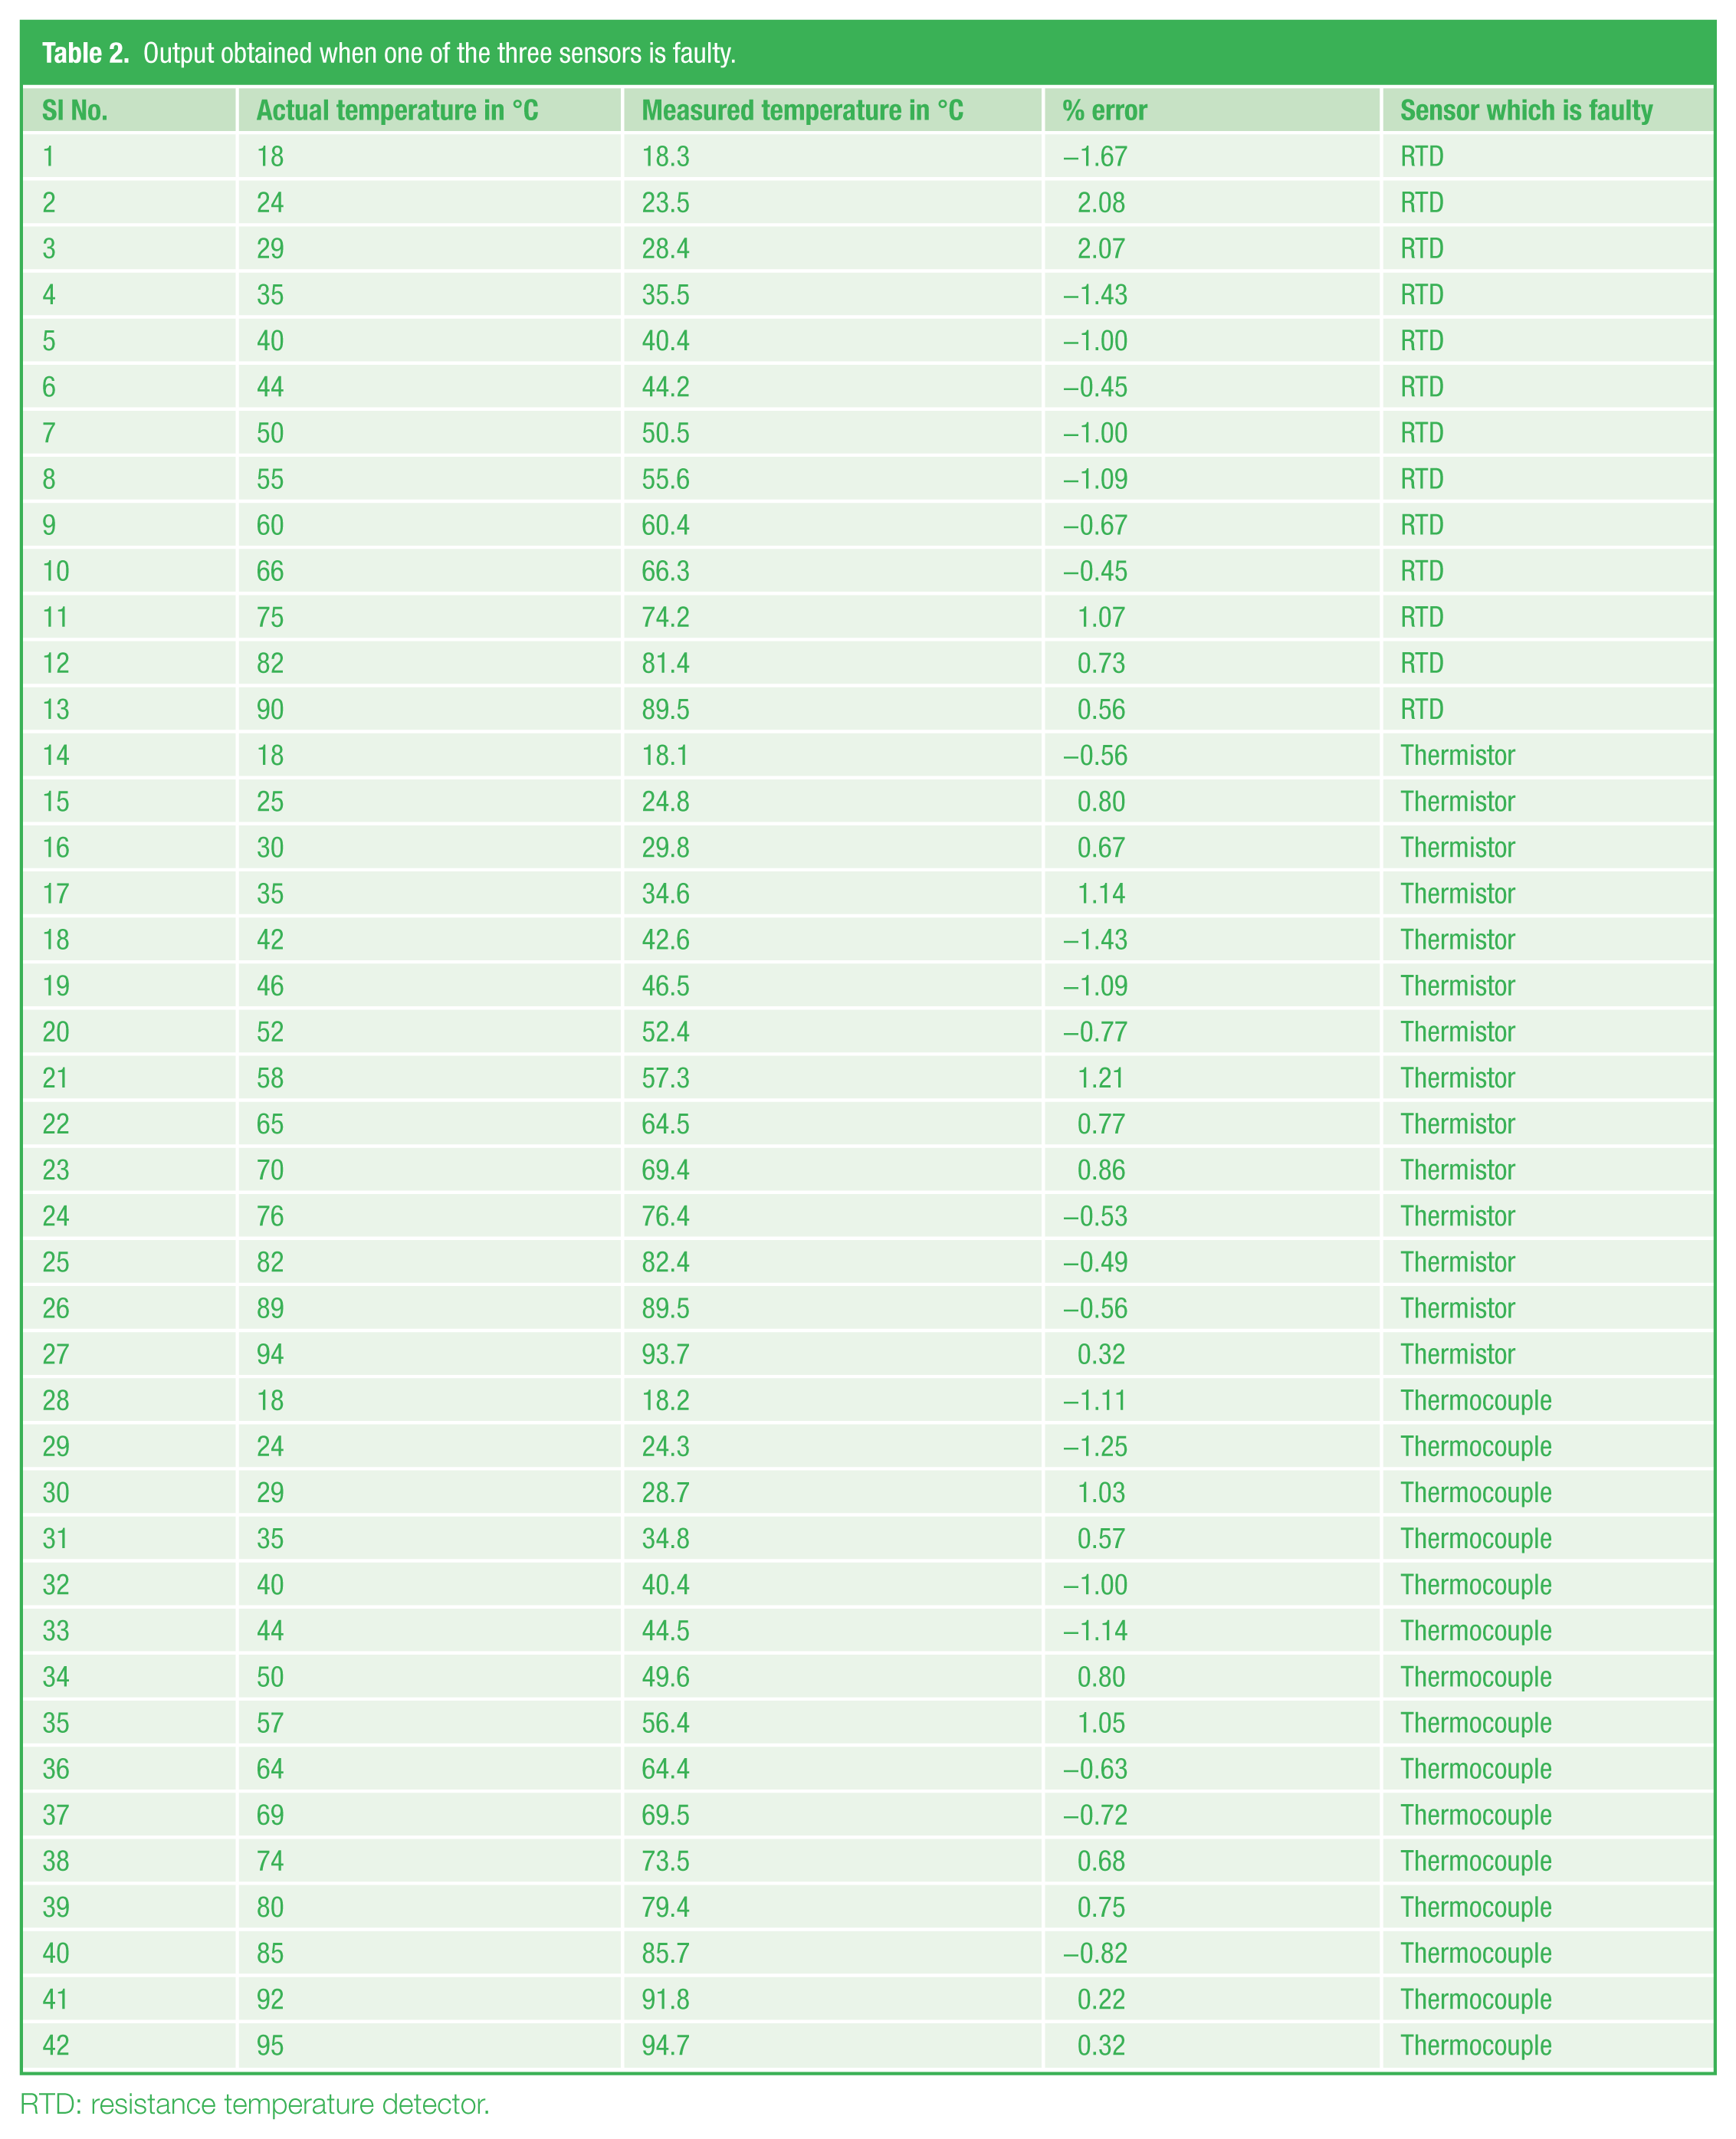
RTD: resistance temperature detector.
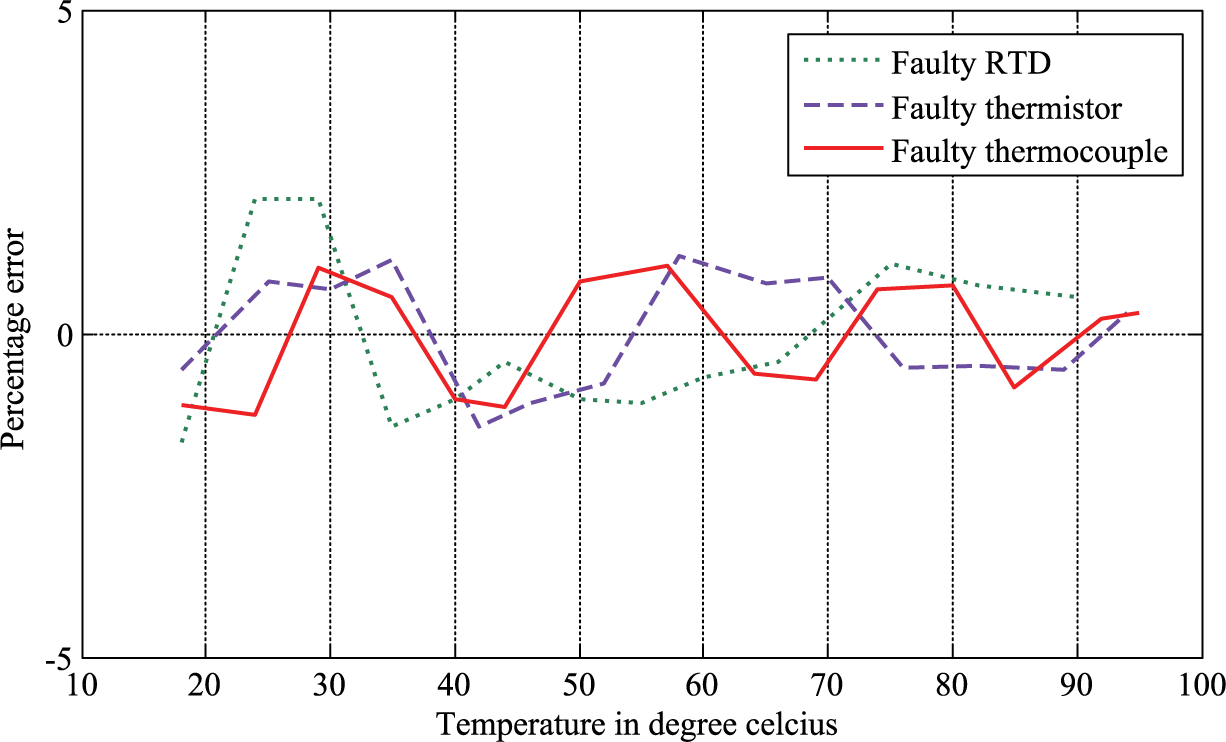
Percentage error plot when any one of the sensor is faulty
VI. Conclusion
The primary element of a measuring technique is the sensor, and the characteristic of the sensor drives the performance of the entire measuring instrument. Sensors are selected based on working range, linearity, sensitivity, size, and so on. It is often seen that while selecting a sensor, one has to optimize the selection by compromising with any of the sensor behaviors. In view of these, the proposed work presented a technique using multi-sensor data fusion with the objective of producing output having improved characteristics as compared to individual sensor. The proposed fusion framework was established using Pau’s framework, and temperature sensors were thermistor, thermocouple, and RTD. The characteristics considered for improvement were sensitivity and linearity. The proposed framework was also designed to identify sensor faults if any and isolate the fault from traversing further. Once the implementation of proposed logic was built, it was tested with a series of tests. The output obtained from the system as indicated in Tables 1 and 2 and in Figures 18 and 19 shows that the proposed system has successfully achieved the set objective of the paper. Root mean square of percentage error for the proposed system while carrying out real-life tests was below 1%, which is significantly a better output for an instrument under real-life application
Footnotes
Funding
The author(s) received no financial support for the research, authorship, and/or publication of this article.