
Abstract
Wind energy has an important place in renewable energy sources. Biggest challenges in wind energy production are the variability of the wind and difficulty of estimation of true wind speed. In this study, 25,777 records have been taken from wind measurements carried out at Mehmet Akif Ersoy University campus. Records include meteorological data such as wind speed at different heights/altitudes, wind direction, temperature, pressure and humidity. In order to estimate the wind speed that may occur at 61 m altitude, multilayer perceptron and radial basis function methods have been used. During the application phase, 100 artificial neural networks were trained and performance evaluations of these networks were done. The obtained results show that the wind speed at 61 m can be estimated with 99% accuracy using artificial neural network when other meteorological data are taken as input.
I. Introduction
Increasing world population and developing technology increase the demand for the energy day by day. Countries have turned to renewable energy sources because it is known that the limited amount of energy reserves will decrease in time and damages of these resources to the environment are also known. 1 Wind energy which is one of renewable energy sources is the most advanced and commercially most economical type of renewable energy. 2
Obtaining energy from a wind energy conversion system depends on the performance characteristics and operating conditions of the energy conversion system. Due to the unstable nature of the wind, it is not possible to determine the transient response of wind conversion system and to develop a model with wind speed and power output data. Therefore, wind power generation is closely related to the wind properties of the region even if the performance characteristics of the wind energy conversion system are available. In the case of establishing the model which provides accurate predictions, control of wind turbines used in wind energy production can be achieved, and increases in wind turbines’ resistance and operating costs can be reduced. This also provides a more stable, reliable and cheap energy production.
First of all, feasibility study should be conducted to determine wind energy potential of a region. Then, wind measurement station is established to a coordinate considered to be the most efficient in the field, related sensors should be assembled, 3 data should be recorded and tracked for at least 12 months, and then it should be analyzed.4,5
In addition to the measured and recorded data, studies to estimate the data in future and back periods have become widespread in recent years. Indeed, when literature studies are analyzed, it is seen that many estimation methods have been used. Ata 6 analyzed the duration of wind blow (which depends on various parameters) of Akhisar area using artificial neural networks (ANNs). In his study, he has made a comparison between ANNs and the traditional method which uses Rayleigh distribution. Kurban et al. 7 have analyzed the wind energy potential of the site using Weibull and Rayleigh distribution functions. They calculated the parameters of these distributions using maximum likelihood method. At the end of the study, they saw that Weibull distribution models the wind speed better than Rayleigh. Shamshirband et al. 8 have developed a new algorithm base on neuro-fuzzy inference system (ANFIS). Power coefficient of the wind turbine, the rotor speed and blade pitch angle have been chosen as input data for ANFIS. The identified model related to input–output has been observed during offline training. After that, the wind speed has been determined online from momentary inputs. The performance of this smart system has been tested in MATLAB/Simulink environment. It has been shown that the developed algorithm is faster than other forecasting methods. Velo et al. 9 have used ANN to determine annual average wind speed with current available short-term data. They have used 60-day data for training. According to the simulation results, they have observed annual average wind speed forecasts with less than 6% error rate compared to the actual speed. Alessandrini et al. 10 have developed analog ensemble (AnEn) method in order to generate probabilistic wind power forecasts (WPF). With this study, they have forecast old data which are similar to existing data. Shukur and Lee 11 have used ANN and Kalman filter (KF) for the detection of nonlinear and uncertain problems. Hybrid KF-ANN model based on autoregressive integrated moving average (ARIMA) has increased the accuracy of the wind speed forecast. They saw that hybrid KF-ANN model made the most adequate and most accurate prediction compared to its discrete components. Pishgar-Komleh et al. 12 have aimed at analyzing wind speed data in Firouzkooh area and worked on 10-year period data of this area. Weibull and Rayleigh have aimed at determining the most appropriate wind speed data by applying distribution functions. The obtained results are highly successful.
Although there have been many studies related to neural networks carried out in the literature, performance of these networks are usually tried to be compared using one or two network structures. The main contribution of this study is performing the experiments with real data consisting of more than 25,000 records and using of many different architecture of neural networks. These architectures have different network structures, different hidden layer neuron numbers, different activation and output functions. As a result of the study, test performances of 100 ANNs have been compared and determination of the best successful network architecture has been ensured.
The paper is organized as follows: obtaining of meteorological data such as wind speed, wind direction, temperature and pressure is described in section II. In section III, structures of supervised and unsupervised neural networks have been mentioned. Section IV is the section where performance assessments of developed ANNs are performed, and conclusions are provided in section V.
II. Data Acquisition
Coordinate determination works have carefully been performed in the campus for the construction of wind measurement station in the Istiklal campus of Mehmet Akif Ersoy University. For this purpose, different points in the field have been visited at different times and wind speeds were observed. Based on the criteria in the literature, the most appropriate point at the field has been identified as UTM E 263254 and N 4173479 coordinates at 1313 m altitude. Wind measurement station has been constructed to detect coordinates, and wind speed sensor, wind direction sensor, temperature and humidity sensor, pressure sensor and data logger have been assembled. System has been engaged and data have been tracked. The station which has been constructed is shown in Figure 1(a) . Schematic illustration of the measuring stations is given in Figure 1(b) .
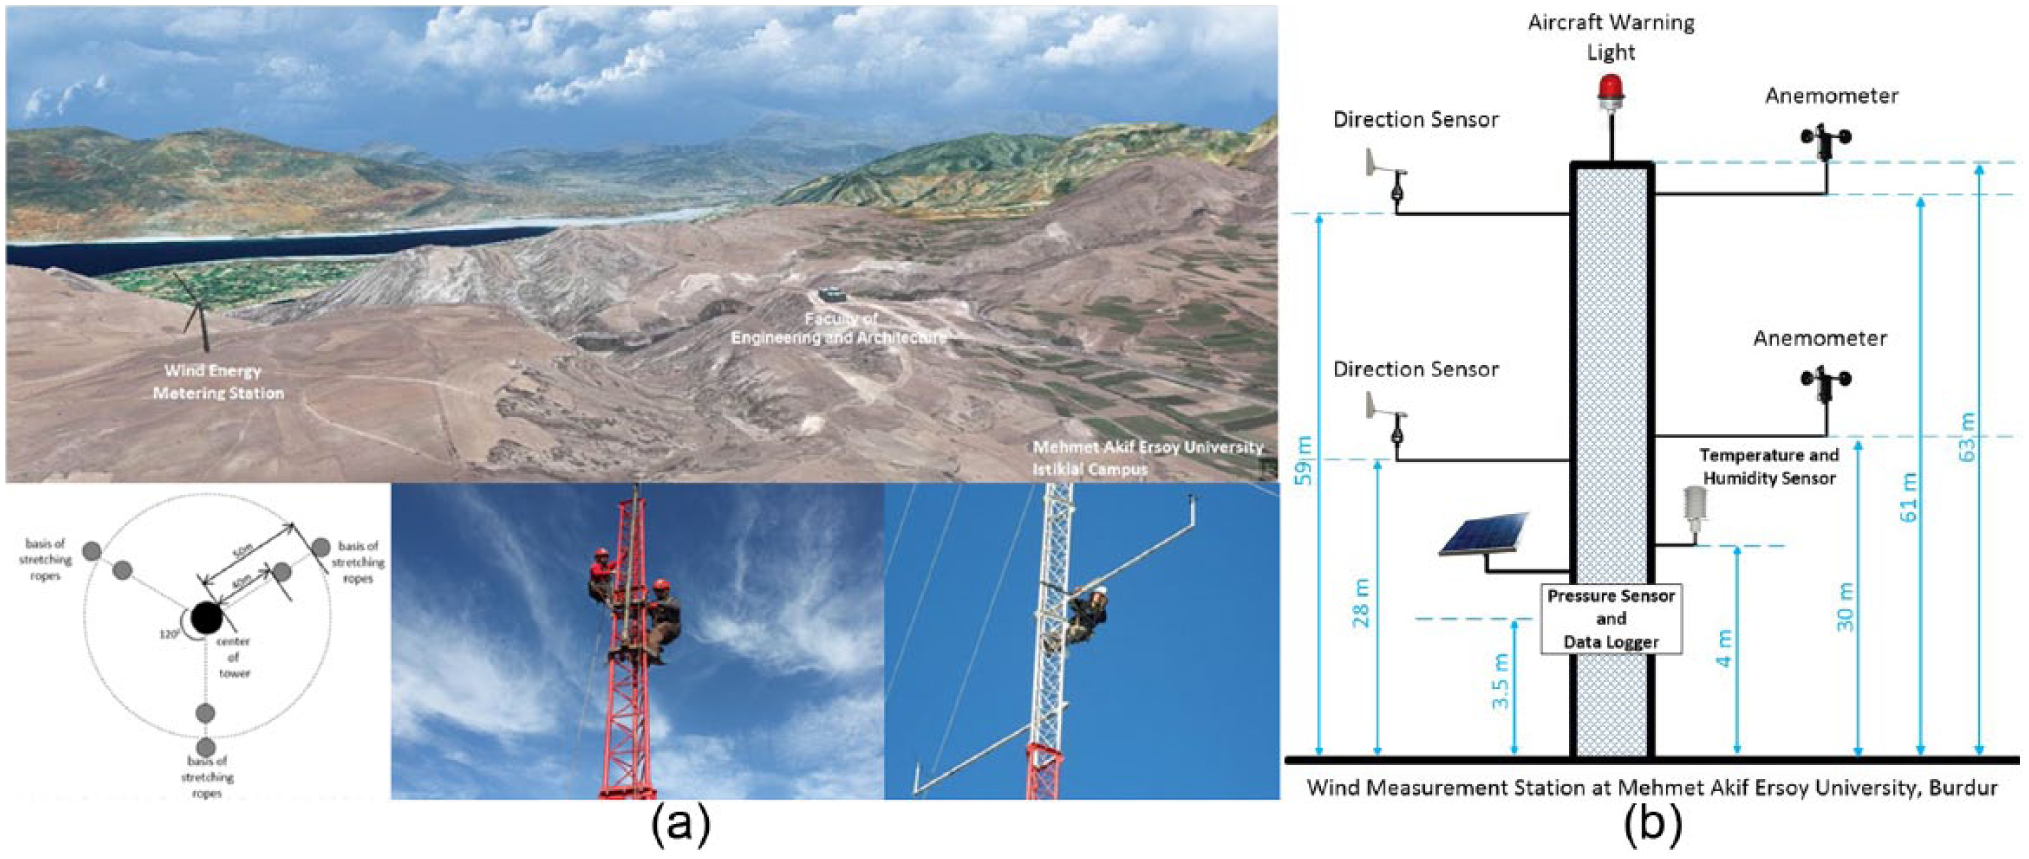
(a) Three-dimensional image of the field work (to scale) and wind measuring station installation procedure. (b) Schematic illustration of the wind measuring station
In this study, wind speed, pressure, temperature, humidity and wind direction measurements carried out for 6 months from February to July 2014 at wind measurement station constructed for measurement have been tried to be analyzed using data mining techniques, and the factors that determine the wind speed have been tried to be determined together with their degrees of influence.
In order to make wind speed forecast, pressure, humidity, temperature, wind direction and wind speed parameters have continuously been measured and measurement averages have been calculated at 10-min intervals. Thus, 25,777 measurement results have been obtained for 6 months. Table 1 shows the statistical data of said parameters.
Descriptive statistical values for the measured parameters.
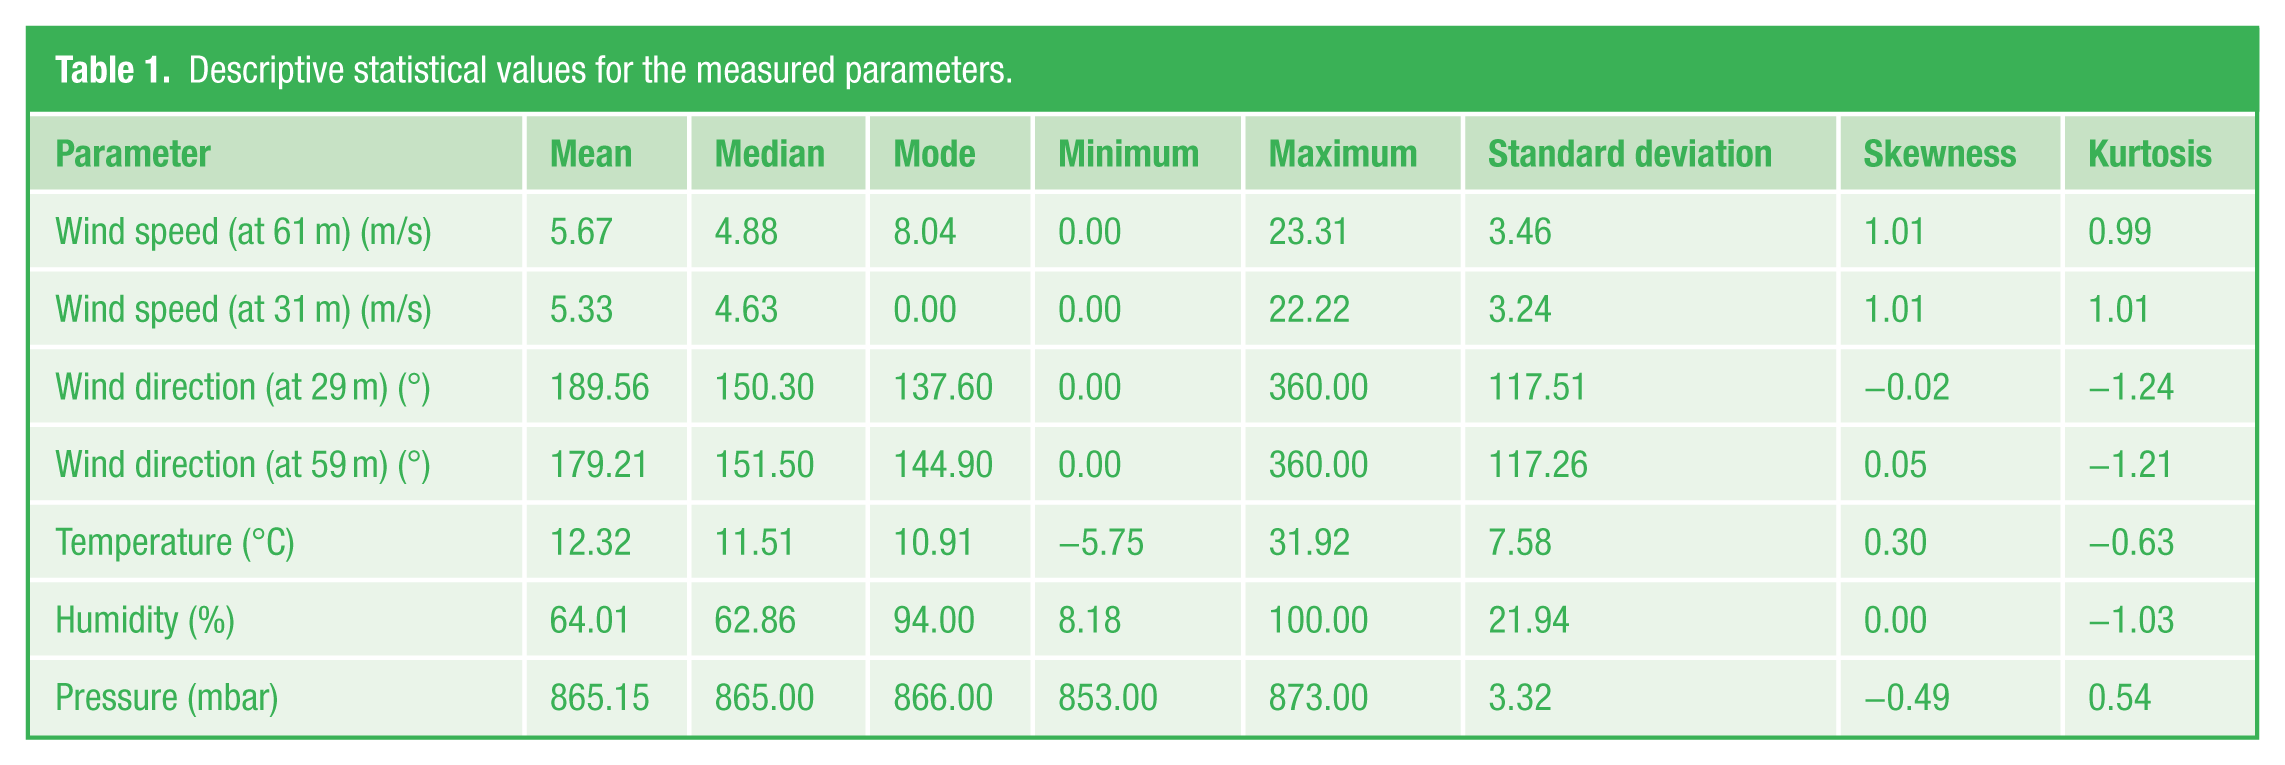
The main objective of this study is the measurement of wind speed at the height where wind turbine has been planned to be constructed and forming of a successful model through these measurements. The relationship between wind speed and wind direction at 61 m in Figure 2(a) is given as 3D surface graphic. The relationship between wind speed, temperature and pressure value is shown in Figure 2(b) . Comparison of wind speed, temperature and pressure is given in Figure 2(c) . The linear relationship between the wind speeds at 61 and 31 m can be clearly seen in Figure 2(d) .
(a) Wind speed versus wind direction relationship, (b) wind speed versus temperature and pressure relationship, (c) wind speed versus temperature and humidity relationship and (d) wind speed versus pressure relationship
III. Multilayer Perceptron and Radial Basis Function ANNs
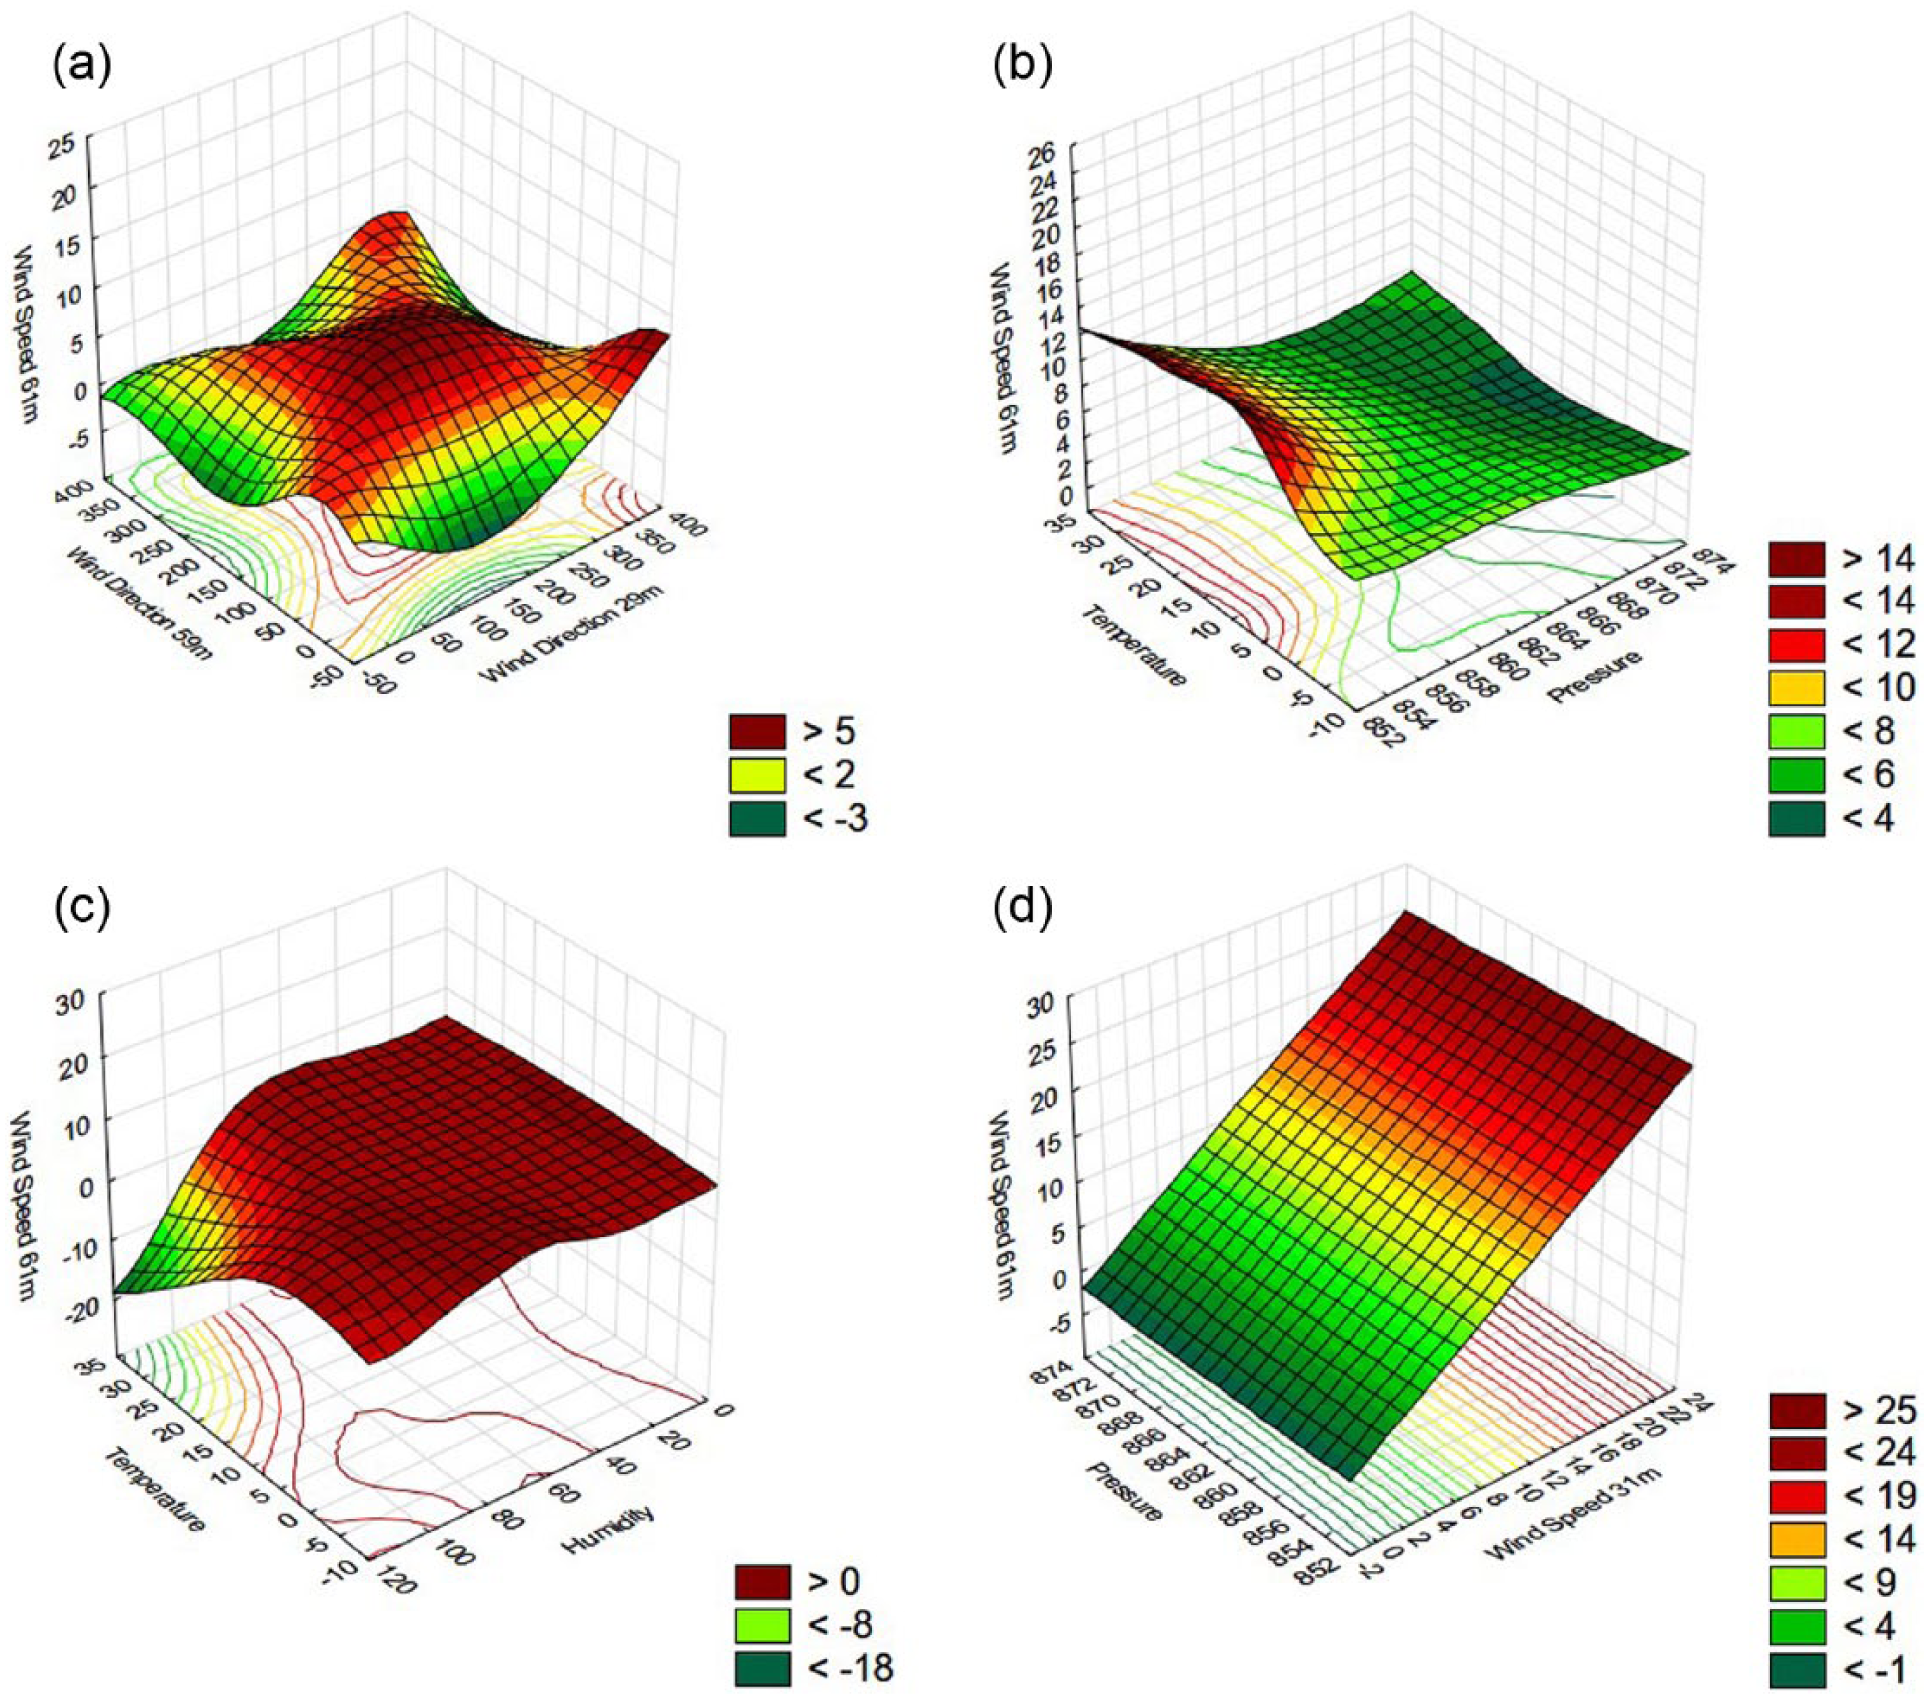
Two basic neural network models have been studied on with the aim of modeling wind speed data at 61 m, which constitutes the subject of the study. Multilayer perceptron (MLP) structure has been used for supervised ANN, and radial basis function (RBF) network structure has been used for unsupervised ANN. Input values of ANNs consist of wind speed at 31 m, wind direction at 29 and 59 m, temperature, humidity and pressure data. The output value gives the wind speed at 61 m. MLP network structure is given in Figure 3(a) . RBF network structure is shown in Figure 3(b) .
The structure of neural network: (a) a multilayer perceptron network and (b) a radial basis function network
A. MLP networks
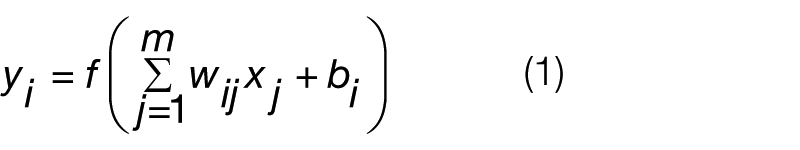
An MLP is a feedforward ANN model that maps sets of input data onto a set of suitable outputs. An MLP consists of three or more layers of nodes in a directed graph, with each layer fully connected to the next one. This type of network is called as a fully connected network. Except for the input nodes, each node is a processing element or neuron with a nonlinear activation function. MLP utilizes a supervised learning technique called backpropagation for training the network. 13 In a MLP type network structure, each node in one layer connects with a certain weight wij to every node in the following layer. Output layer is calculated as shown in Equation (1)
MLP is applied for solving some difficult and different problems successfully. In this method, error backpropagation algorithm is usually used as training algorithm. Each neuron model on the network includes nonlinearity at the output. The important point here is that nonlinearity has smooth transition compared to sharp transition function used in Rosenblatt’s perceptron. The network has one or more hidden neurons that do not belong to input or output. These hidden neurons allow the network to learn complex works. In the network, each neuron is interconnected. A change in the connections causes the change in synaptic connections and weights. The development of backpropagation algorithm has been a turning point in the use of neural networks. 14
B. RBF networks
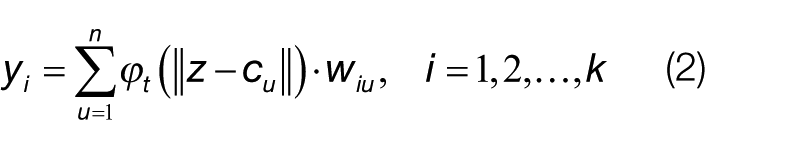
RBF network consists of input layer, hidden layer containing radial basis neurons and output layer mostly consisting of neurons with linear activation function. RBF is a different approach that demonstrates the curve fitting problem in multi-dimensional space. From this perspective, statistically, learning is equivalent to the finding of the most appropriate surface to the training data in multi-dimensional space. While the transformation from input space to hidden layer space is nonlinear, it is linear from hidden layer space to output space. 15 Output layer is calculated as shown in Equation (2)
where
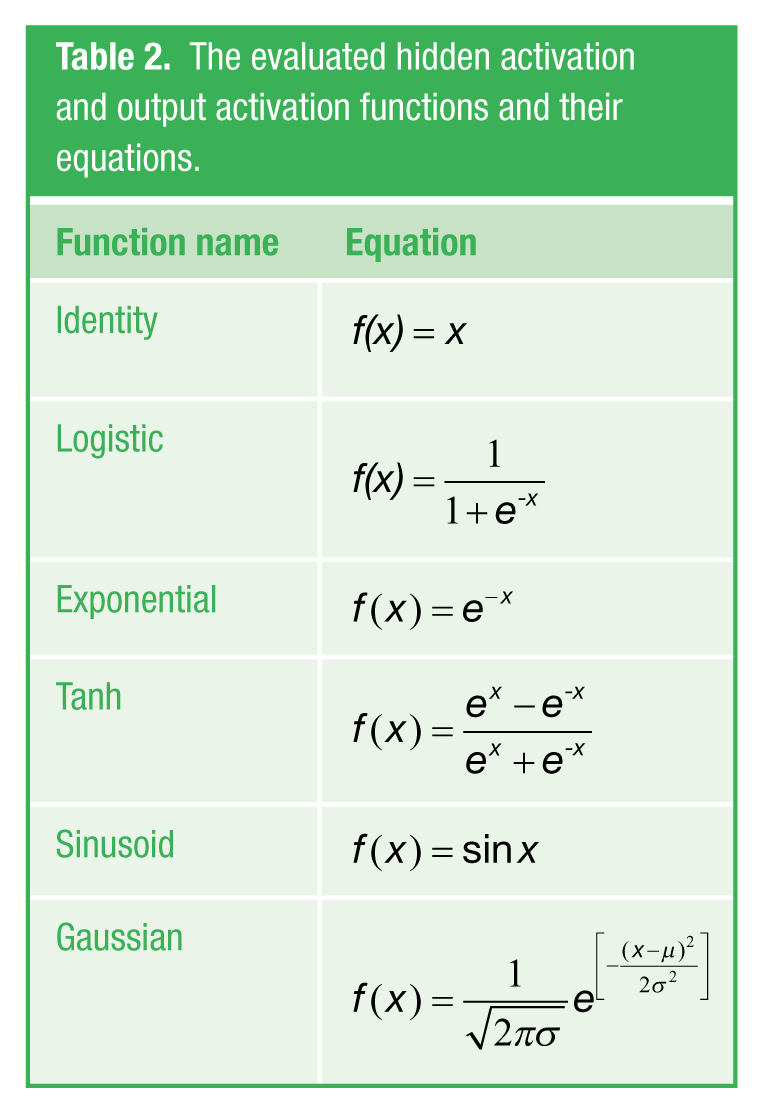
The parameter values in ANNs affect the results significantly. Selection of the number of nodes forming the network structure and the activation function that enables the relationship between the nodes and output function is important. 17 It is very difficult to predict which parameter values will give better results; therefore, numerous ANN combinations have been tried in this study. Activation and output function types used in the networks are given in Table 2 .
The evaluated hidden activation and output activation functions and their equations.
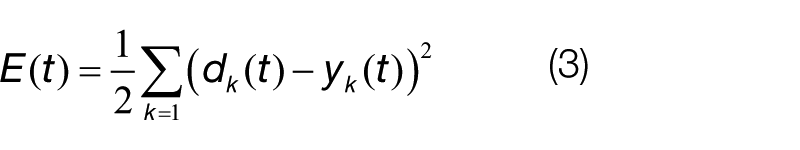
Sum of squares error function has been used in order to calculate the error rate of trained networks. The error function used is given in Equation (3). Here, dk is the target value for dimension k
IV. Performance Evaluation
Within the scope of the study, a total of 100 ANNs which have different network structures, different number of hidden nodes and different activation and output functions have been used. For the training of neural networks, 60%, 20% and 20% of the total data have been randomly allocated and used for training, validation and test, respectively.
As a result of training, validation and test operations performed using neural network characteristic of Statistica program, performance values, the number of hidden nodes and activation and output functions are listed from most successful one to the least successful one. In the study, 50 pieces of MLP and 50 pieces of RBF type artificial neural networks have been created and trained. After the training and testing operations, evaluation data related to 20 ANNs which have most successful test performance are given in Table 3.
Training results and structural properties of the best 10 results for supervised and unsupervised ANNs.
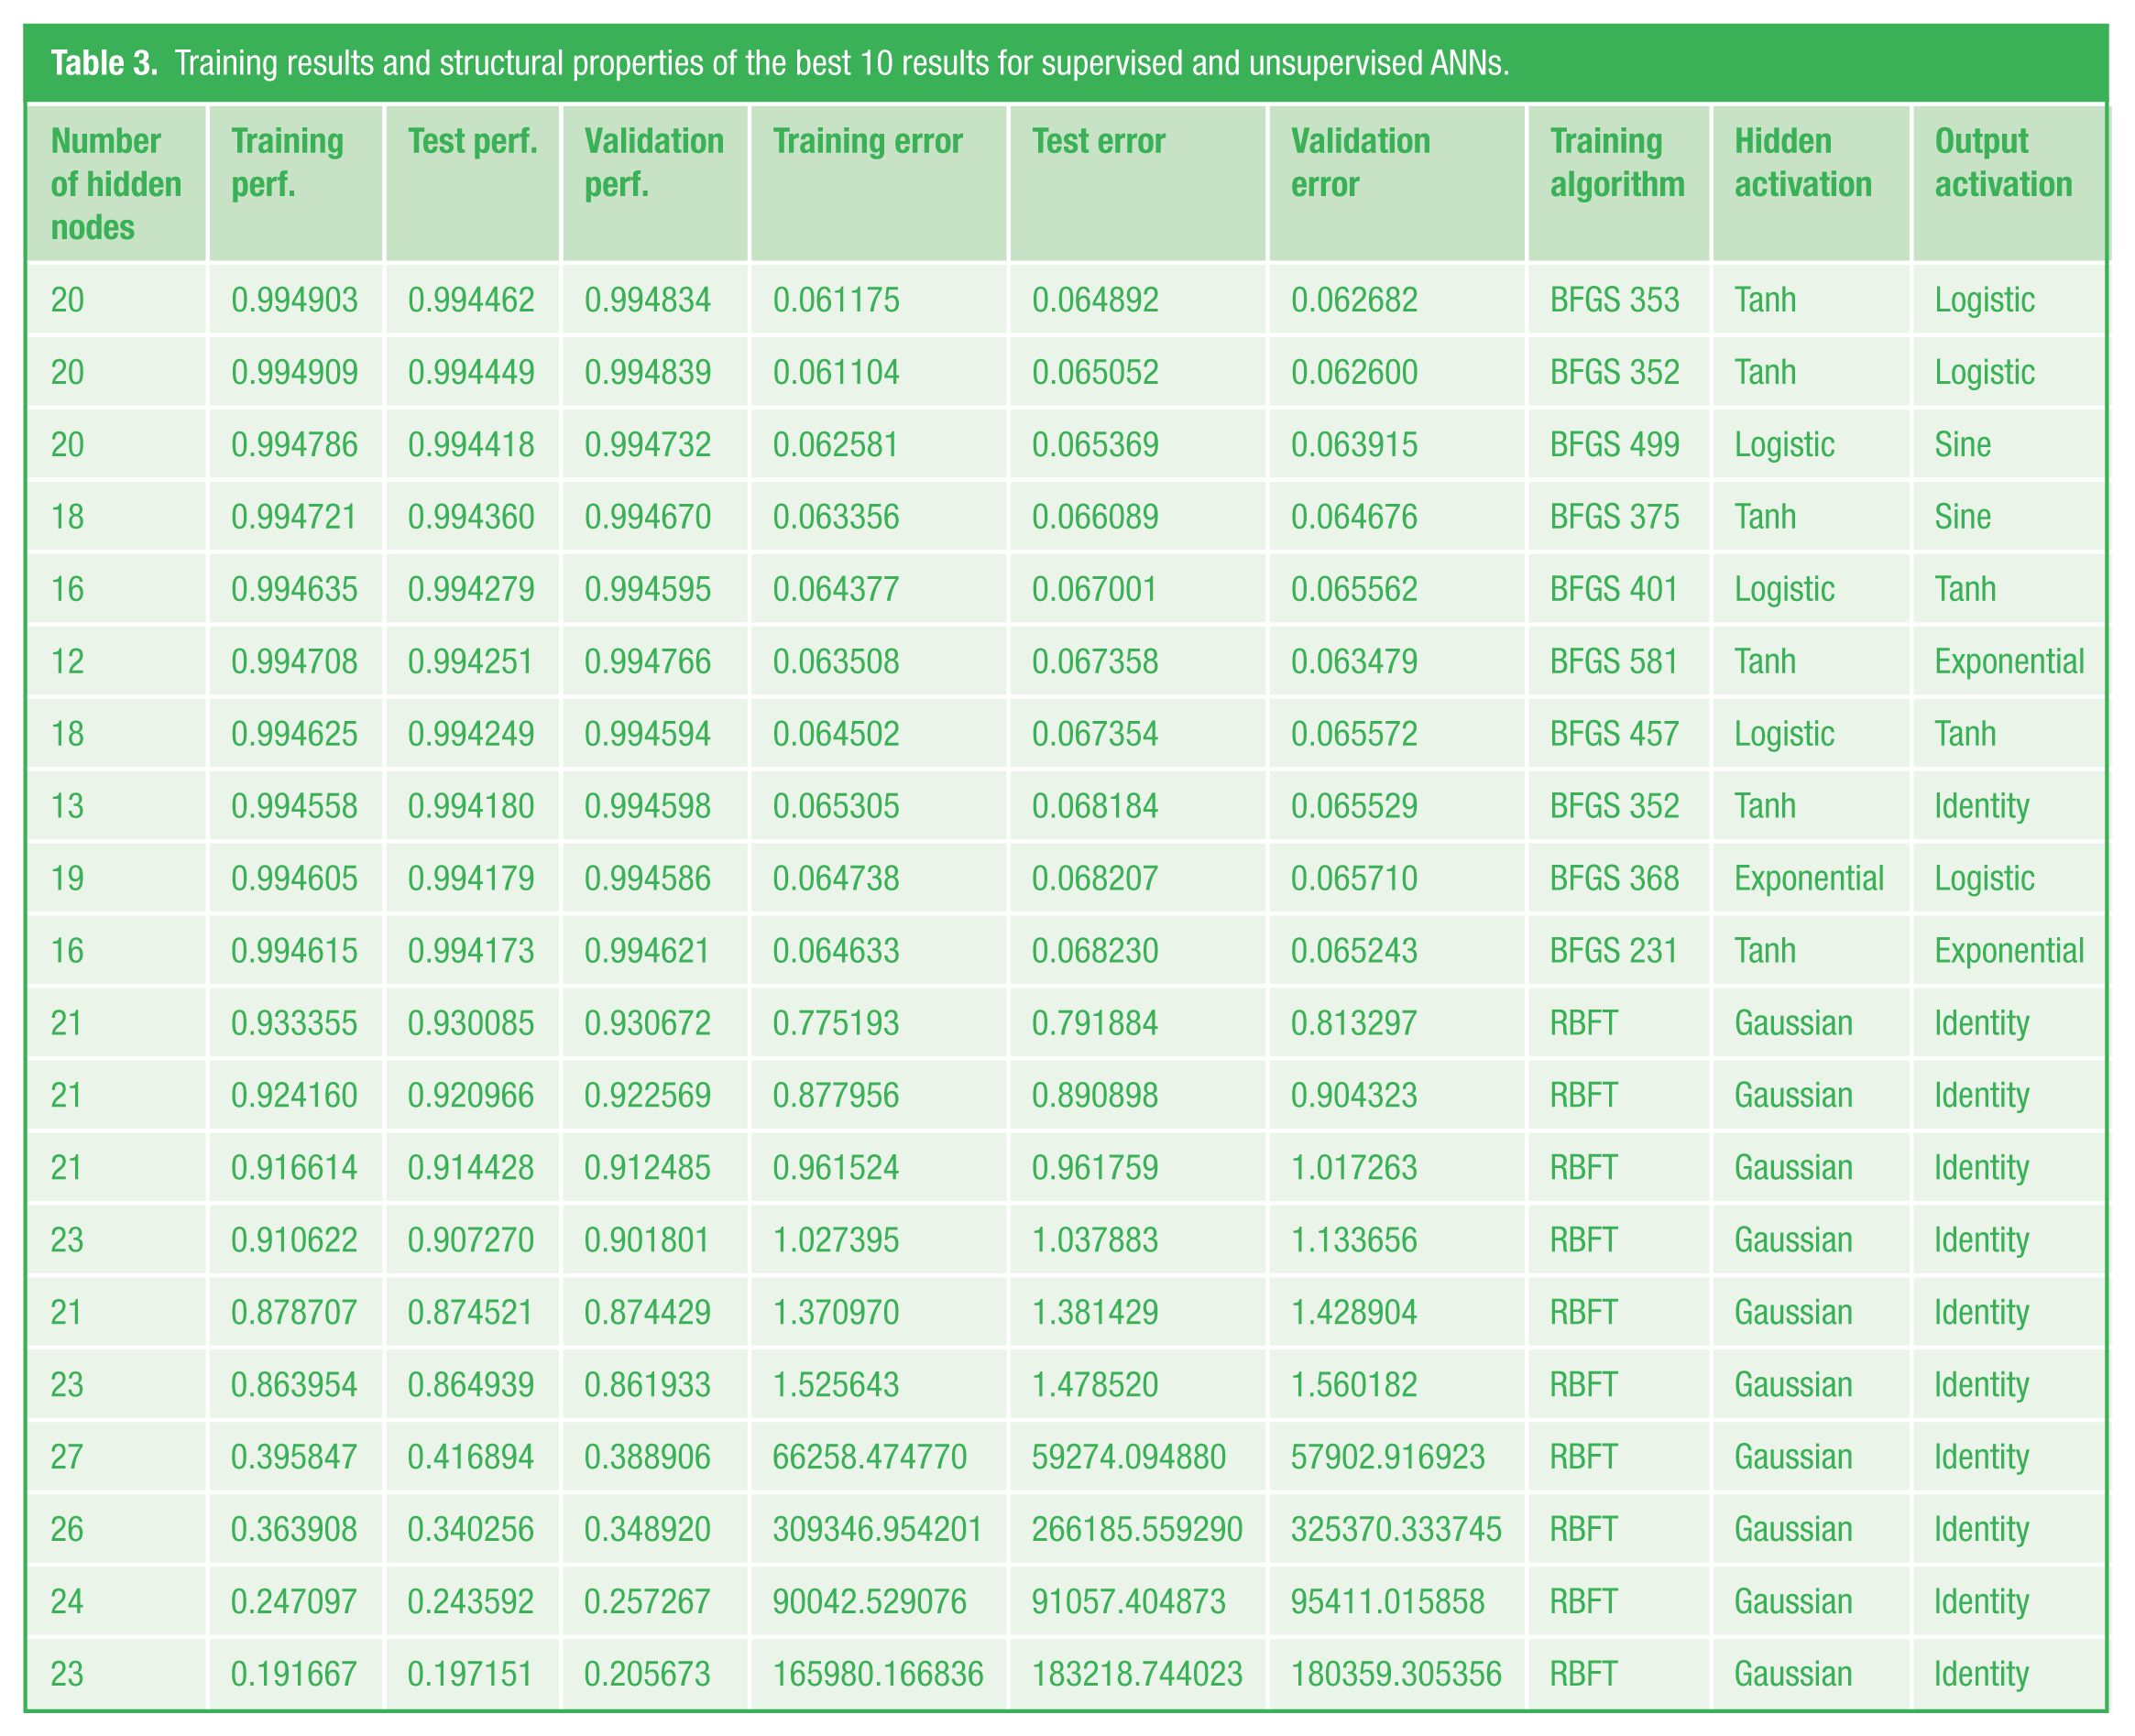
Sum of squares method has been used as error function for all ANNs used in the evaluation. While the number of hidden nodes for MLP networks has been selected between 3 and 20, RBF node has been used for RBF between 21 and 30.
On analyzing Table 3 , it can be seen that MLP is the most successful and stable network structure for modeling of wind speed. It is seen that successful results have generally been obtained for MLP structure with the use of tangent hyperbolic as the activation function. As output function, logistic and exponential activation functions stand out. However, there is no significant difference in success between these functions.
Performance graph for each of the two network structures can be seen in Figure 4 . Accordingly, it can be seen that the networks formed according to MLP method can be trained in a stable way and very successful test results are obtained.
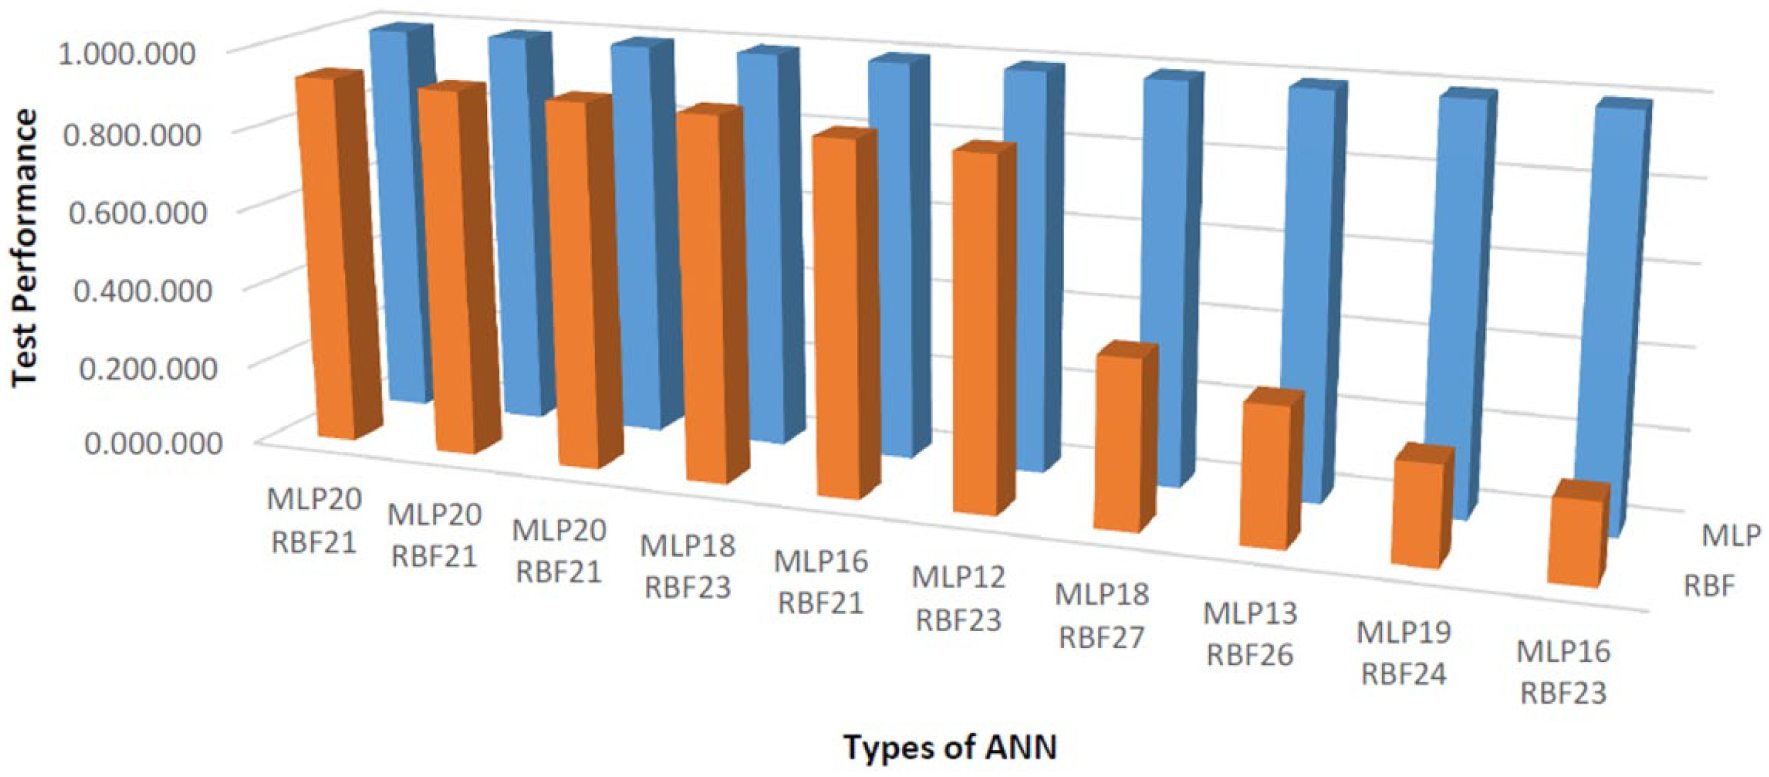
Test performance evaluation for MLP and RBF networks
When the obtained results are analyzed, it can be seen that the wind speed at 61 m can be calculated with 99% accuracy using ANN. Residual distribution of obtained models is suitable for normal distribution. The comparison of estimated wind speeds obtained using trained ANNs and measured wind speeds is given in Figure 5 .
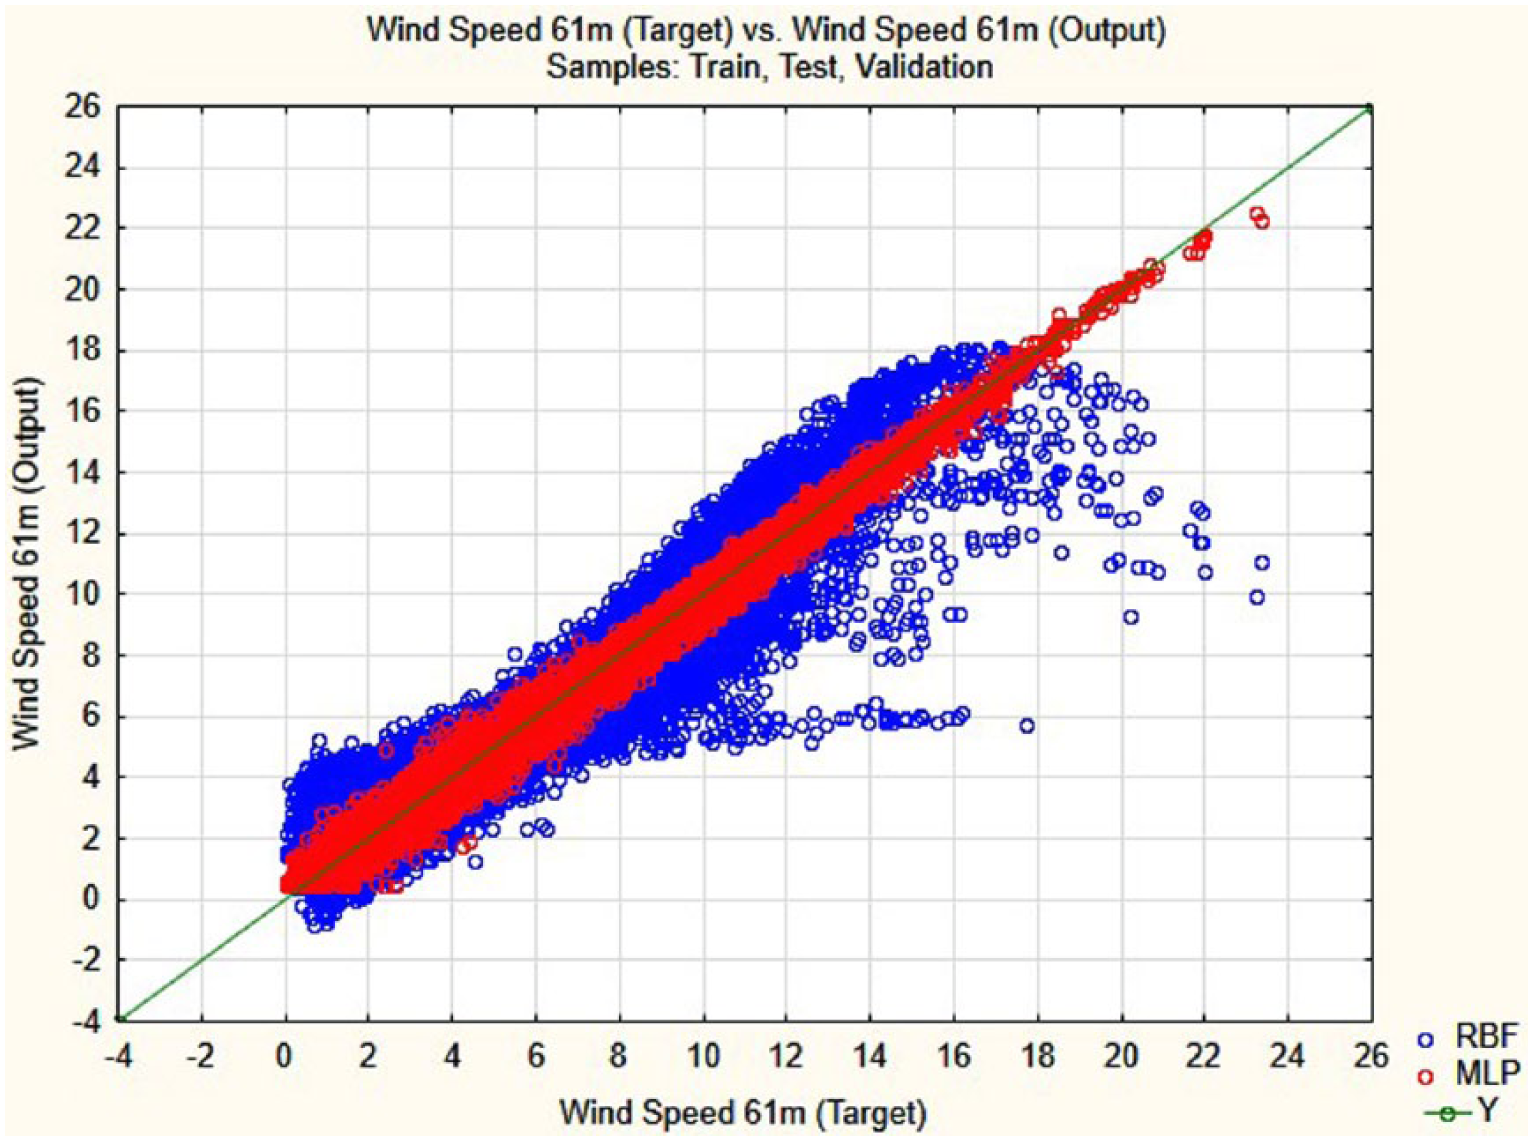
Wind speed at 61 m target and output comparison for the best RBF and MLP networks
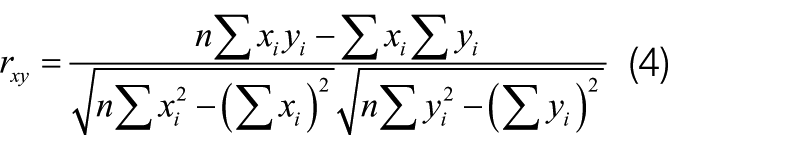
Pearson correlation coefficient value (r) for RBF and MLP test values is calculated as 0.44585 using Equation (4)
When Figure 5 is analyzed, it is more clearly seen that MLP models are more successful than RBF models for 61 m wind speed output.
V. Conclusion
With this study, the most accurate modeling of the wind speed which will affect the wind tribune planned to be placed at 61 m height is assured using meteorological data such as wind direction, temperature, pressure and wind speed at 31 m. For this purpose, two different methodologies—supervised and unsupervised—have been used. In this context, a total of 100 ANNs have been created and these networks have been trained and tested using total 25,777 real value data. Five different activation and output functions have been used along with hidden nodes between 3 and 20 for total 50 networks formed by MLP method. Test performance of the 10 most successful MLP networks is 99% and above. Hidden nodes between the numbers of 21 and 30 have been used for total 50 ANNs formed by RBF method; Gaussian function has been preferred as activation function, and identity function has been preferred as output function. When performance test results are compared, it is determined that the test success values of the networks which use MLP approach are more successful than ANNs which use RBF approach. As a result of the study, it can be seen that a parameter such as wind speed which is highly variable and difficult to estimate can be successfully modeled using ANNs and reliable estimations can be made for the short term. Thus, it is shown that when basic meteorological data such as temperature, pressure and wind direction are known, wind speed at desired altitude can be estimated using ANNs.
Footnotes
Acknowledgements
The authors thank project coordinator Prof. Dr Serdar Salman who provided insight and expertise that greatly assisted the research.
Funding
This research was supported by West Mediterranean Development Agency (BAKA, Project Number: TR61/13/DFD/036) and Mehmet Akif Ersoy University Scientific Research Projects Commission (Project Number: 0212-Gudumlu-13).