
Abstract
The measurement of the static position of rails in overhead industrial cranes is crucial to prevent failures and reduce undesired wearing effects due to wheels’ contact. The traditional procedure used to verify the rail alignment is based on manual operations, which can be overcome with the automatic methodology described in this paper. Through the design and building of a motorized trolley, the optical target point identifying the rail position is able to move automatically under remote wireless control. The measurement procedure is carried out considering one rail at a time and the data acquired on the two rails are then analyzed together by a specific software. Additional sensors embedded in the trolley allow to provide different parameters about the rail positioning and about the conditions of its surface. The system can be integrated in a laser tracking total station and can be controlled by the operator from the ground assuring a time reduction during installation and maintenance operations and greater safety for the operator.
I. Introduction
The selection and installation of rails for overhead cranes are influenced by some typical parameters such as loading, number of cycles, capacity of the supporting structure, material properties of rails and wheels, and geometry of rails and wheels. The strong interaction between rails and wheels must be carefully considered in the design to prevent accelerated damaging processes. Furthermore, the installation of rails is critical and must respect stringent tolerances to provide the proper functioning of the system; the rails’ mounting depends primarily on the typology of the crane to be supported, the typology of foundation, and the lifetime requested. About the last point, the accurate installation of rails is the main requirement to provide the desired lifetime of the system. From the operative viewpoint, the proper installation of rails imposes to verify the geometrical tolerances during the mounting process using suitable measurement instruments. 1 The tolerances to be respected are in the millimeter range, which are particularly restrictive by considering that typical plants reach lengths of several tens of meters. Additionally, the rail is supported by a base made with continuous concrete, which is intrinsically affected by geometrical irregularities.
The normal procedure used to measure the positioning of rails during the installation, or in periodic maintenance operations, is based on optical detection systems. An optical detector is placed on the ground of the factory. First, all the obstacles present on the visual path between the optical device and the rails must be removed; this operation may cause logistic complications or stops of production process, proportionally to the rails’ length. Some reference points are then defined along the two rails, where optical targets are placed and detected with the device placed on the ground. Each target must be placed manually by the operator at some meters height depending to the position of the rail, and then acquired by the optical receiver. The time required for the positioning and detection of each optical target is about 10–15 min, and one target every 5 m at least is normally required for reasonable evaluation of rail geometry. The detection is based on the triangulation system, which are well known in the literature 2 and have been applied in several industrial fields.3,4 A variant of this methodology includes the presence of many optical stations on the ground, aligned together using intersection points of the optical paths between the receivers and the targets.5–8 The described methodology is affected by two strong limitations: first, the time required to measure the positioning of the two rails of the system is extremely long (many hours may be required for the plants with larger dimensions); second, only the spatial position of the rail centerline can be measured. This means that the detection process produces the generation of a virtual line in three-dimensional space corresponding to the geometrical center of the rail. The position errors of the rail from the nominal position cannot be attributed to lateral misalignments, vertical misalignments, or rail tilting. Additionally, for maintenance detections, the surface condition of the rail on both upper and lateral sides is completely neglected by this measurement approach. The surface condition is extremely relevant because the wheel–rail contact forces are altered by worn rail surfaces, even if the rail is installed with perfect alignment. 9 Some studies have been focused on the simulation of the detection system to find the optimal configuration and number of optical stations and target points. 10
This paper introduces a different procedure and the relative tools for detecting the position of rails, with respect to those already described in the literature. The approach implemented is based on the automatic translation of the target point along the rail in combination with a static laser tracker station. For this purpose, a motorized trolley able to move along each rail separately has been designed and built. 11 The trolley is wireless controlled in remote by the operator; the optical target reference for the measurement is installed on boards, together with some other sensors which are able to provide highly detailed information about the position and the surface condition of the rail. Finally, using the innovative measurement system and the associated procedure, some test campaigns have been conducted to evaluate the performances of the method with very promising results in terms of precision, amount of data, and time saving.
II. Problems of Installation and Verification of Overhead Crane Rails
The field of overhead cranes has experienced significant developments, thanks to structural optimization and automation improvements by means of advanced computation methodologies and onboard feedback sensors able to precisely control the movements. However, despite the innovations, many reliability issues are still unsolved especially about the problem of wheel–rail contact and the associated accelerated wear phenomena. The lifetime of wheels and rails has tremendous impact on the operative costs of the plant, and for this reason the investigation of strategies to reduce the mechanical damaging is attracting the industrial attention. More in detail, the premature failure of the rotating components results in expensive and time-consuming repairs, which are complicated by the inaccessibility of plants, the consequent downtime, and the high cost of materials and processes needed to build spare parts.
Normally, the primary cause of wheels’ damage is due to the relative motion between the truck and the runways which, in case of incorrect installation of rails or unexpected loads’ distribution, causes abnormal sliding of wheels. The proper installation of rails is then crucial to preserve the integrity of wheels for their entire lifetime, as well as the adoption of reliable procedures to verify the rails’ positioning before the plant delivery.
The rails’ positioning is complex due to the geometrical irregularities of the supporting architectural elements made in concrete; the tolerances of these elements are usually much larger than the requirements for rails’ alignment and leveling. Different mounting systems are used to connect the rail with the concrete basement: the best performances are obtained with continuous steel plate bases (which allows the local vertical adjustment) or with the addition of continuous elastomeric elements below the rail. The horizontal adjustment of the rail can be obtained with metallic clips welded to the lower steel plate and used to grip the rails on its side. Additional rubber nosings can be applied to that clips to increase the anchorage resilience and to allow axial and lateral expansion and contraction. The bolts used for holding the rail are normally set into the concrete; clips and steel base plate are usually assembled before the installation and galvanized together to provide long-term corrosion protection. The base plate is leveled vertically by means of some nuts; the final horizontal alignment of the rail is made before the final tightening. The typical errors affecting rails’ installation are represented in Figure 1 and can be divided into (a) parallelism errors and (b) leveling errors. In the first case, lateral forces transferred between wheel and rail are largely amplified, along with the generation of unexpected friction phenomena at the wheel side. In the second case, the profile of the rolling surface is subjected to abnormal distributions of load, by causing localized wear processes. Other typologies of rails’ positioning errors affect their (c) straightness, with respect to the horizontal plane, and their (d) elevation, with respect to the vertical plane. This last type of errors is associated with the single rail and can be measured independently by the other rail. The effect of the mentioned installation errors on the mechanical components damaging is then increased by the irregular and unpredictable nature of forces acting on the wheels; in fact, these implants are used to lift asymmetric loads and may be subjected to repeated cycles, long inactive periods, and peak workloads. The rails’ installation is than complicated by the length of plants (on average from 60 to 200 m) and width of plants (on average from 15 to 35 m). Additionally, the very small tolerances required for the correct operation of the overhead crane are regulated in Italy by the CNR 10021 standard; it prescribes values in the range of 3–8 mm in parallelism and height variations not larger than 10 mm every 10 m. In addition, on process plants with heavy-duty cycles, it is recommended to keep smaller tolerances.12,13
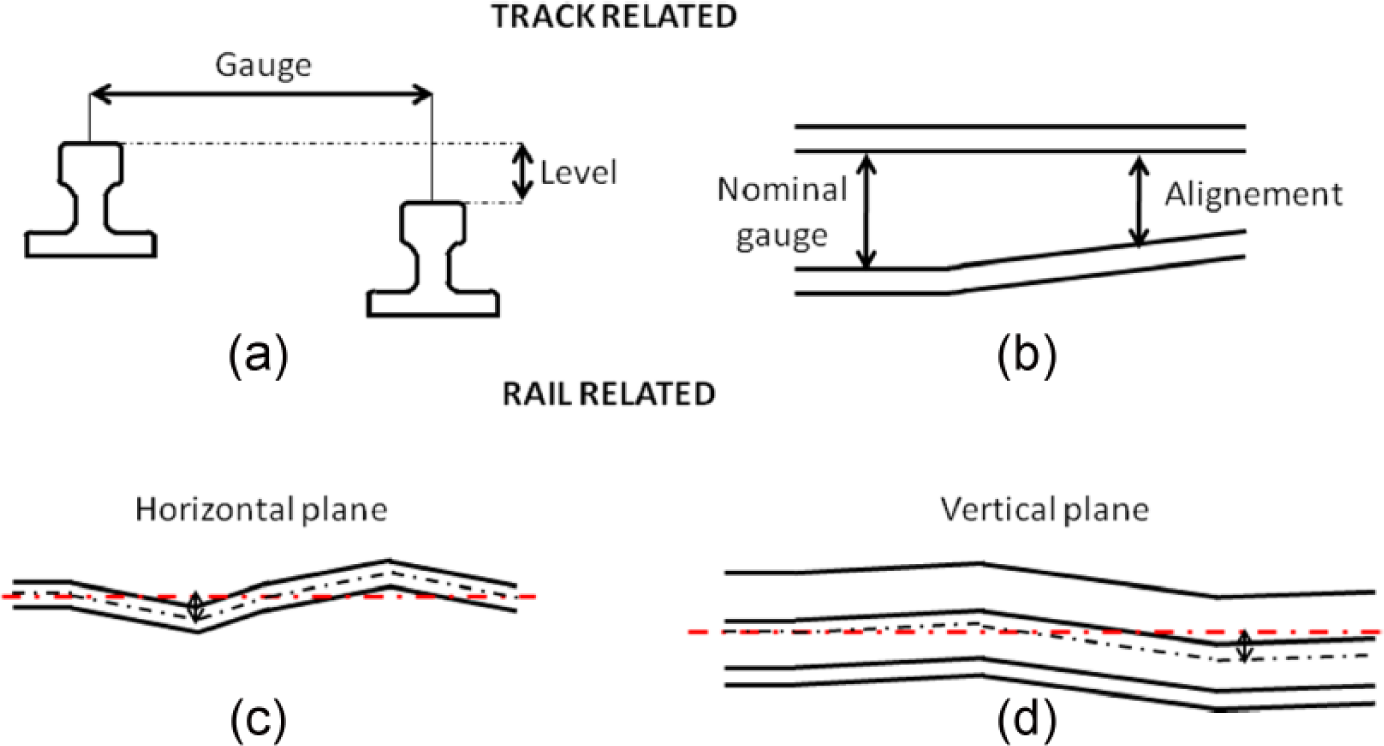
Typologies of rails’ positioning errors: (a) parallelism and (b) leveling between the couple of rails, and (c) straightness and (d) elevation of the single rail
Practically, some typical strategies have been adopted up to now to detect the positioning errors of rails during installation. First, in order to correct small misalignments, the rails’ foundations are equipped with floating fastening systems, like those represented in Figure 2(b) . In the last years, some systems or devices have been developed to control the positioning of the rails after installation using independent motion or kinematic mechanisms; some of these are shown in Cheng et al. 14 and Matsuda et al., 15 but they are not fully effective for the specifications required by industrial context since they are able to check only the rail straightness and do not provide information about the rails’ relative position and the local irregularities. In the field of the dimensional verification of overhead cranes and their runways, different strategies associated with different systems have been adopted in the past. One of the strategies is the online triangulation, based on three stations and a processing software, 4 following the well-known principles of this technique. 2 An alternative strategy has been introduced using independent measurement stations that do not require the online triangulation to define the absolute position. This is possible, for example, using a single measuring point in motion along the axis of the shed according to an absolute reference system, providing six to eight fixed points identified as Kyrinovič and Kopáčik. 12 Similar approaches have been adopted in many industrial applications in the last 50 years.5–7
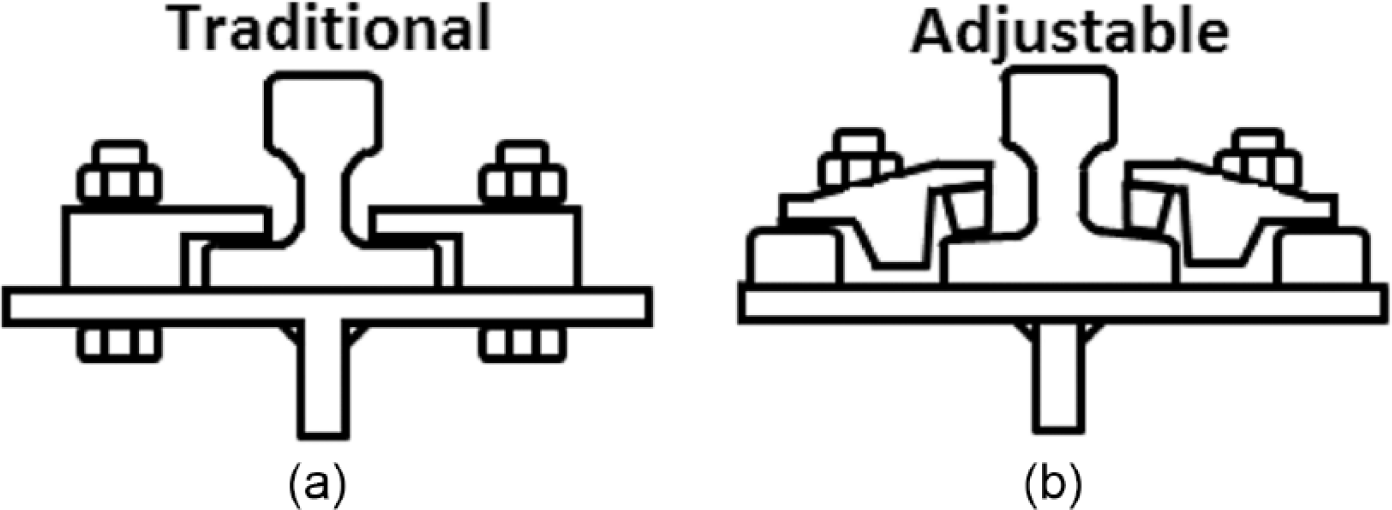
(a) Traditional and (b) adjustable rail clips
The procedures for checking the proper rails’ installation include the use of fixed target points for calibrating the position of measurement station and mobile markers situated along the path. The elements present on the markers allow the measurement of the longitudinal position of the centerline of the track and its height with respect to the ground. The markers are usually positioned at few meters distance along the rail in order to reconstruct its shape with sufficient detail. The procedure described, which is the most commonly used, is affected by strong limitations including the timing, the accuracy, and practicality. Some mandatory operations are as follows: the positioning of the target points, the identification of the instrument positions taking into account fixed obstacles, the positioning of movable markers along the rails, and the measuring of instrument height from the ground after each new positioning.
Some additional problems often make the measurements even more complicated, such as the presence of fixed obstacles which reduces the number of actual measurements by increasing the probability of error, the low brightness in the sheds that prevents the proper identification of target points and markers at greater distances, environmental temperature variations caused by air conditioning systems involving accidental errors on the readings, and the extra steps required by the displacement of the markers on the tracks if these are not available in sufficient numbers. Usually, the measurements performed are treated by means of a software that evaluates the absolute position of the measuring points and its uncertainties. By considering a 300-m-long runway, it is estimated that the total number of positions and detections of the measuring instrument is about 150, corresponding to about 1400 measurements. In Figure 3 , there are some examples of damages on the wheel profile obtained during wear tests on a roller-rig. 16
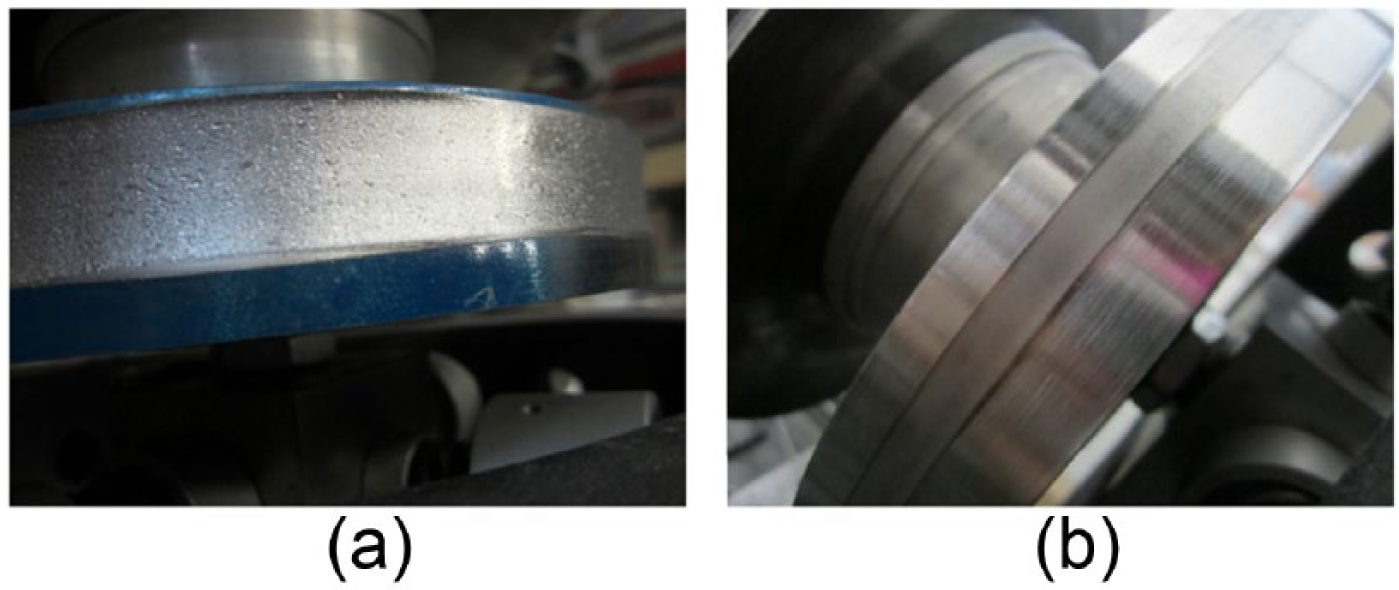
(a) Damaged surface of the rolling profile of a wheel in iron cast and (b) detail of the damaged surface in correspondence to the rail–wheel contact of a C45 steel wheel
From the point of view of recovery of overhead cranes with worn wheels, considerable complications are due to inaccessibility of the installations, localized to several tens of meters in height and the difficulty in handling large and heavy components. Also, maintenance operations require the alteration of production cycles, with subsequent economic losses. It is believed that these reasons causing the manufacturing companies to adopt systems aimed at reducing the problem of wear of the wheels; such strategies are mainly (a) the improvement of the rails’ positioning, (b) the adoption of new materials, and (c) the development of traction control systems. Incorrect positioning of the rails is one of the main causes of the deterioration of the wheels of the crane, because of anomalies produced on the contact profiles and related abnormal sliding and accelerated wear.
III. Description of the Trolley
The measuring system proposed in this paper is a controlled trolley able to run on overhead crane rails that, in combination with a laser tracker station placed on the ground, provides the rail position and alignments. The system has been developed in collaboration with industrial partners and it is shown schematically in Figure 4 . The trolley, which is wireless controlled by the operator, includes an optical target reference and several sensors. The target allows the laser tracker to acquire the trolley position, while the sensors measure different types of rail irregularities. In addition to the optical reference (1), the trolley is equipped with a biaxial inclinometer (2) and a position sensor (linear variable differential transformer (LVDT)) (3), that allow the detection of the rail condition. The trolley is equipped with a direct current (DC) motor (4) and a gear unit (5) for the movement and a second motor for the alignment of the optical tower (6). The device is powered by rechargeable lithium batteries (8) and includes a camera (7) for visual analysis of the wear condition of the rail. The control of the trolley is made through remote operation by the operator from the ground. The design of the mechanical parts was conducted by considering a weight constraint which is compatible with the application (the mass of the mechanical parts is 18.5 kg).
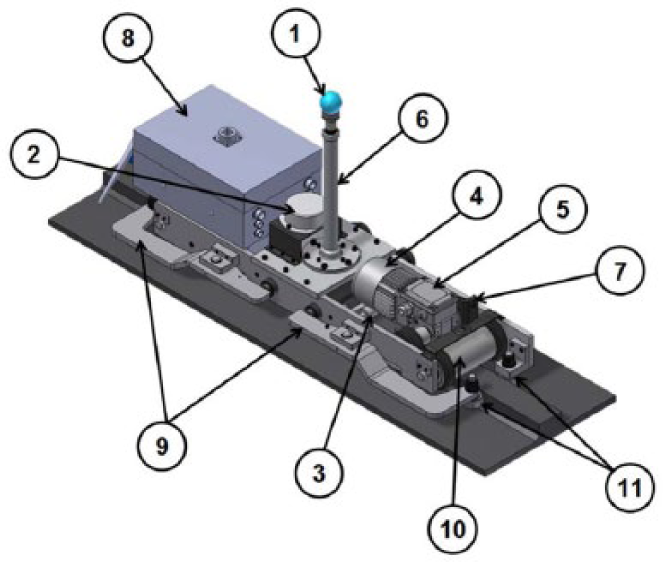
Trolley with evidence of the main components
The design was supported by multibody modeling tools.17,18 In particular, a monorail trolley model was developed in order to evaluate the contact forces, to evaluate the dimension of the drive system, and to evaluate the stability in function of the positioning of the stabilizing leverages (9).
The trolley designed and built during the research activity has been patented by the project partners as measurement system device. 11 Currently, in industrial contexts, overhead cranes with large variety of load capacities are used, but the range is usually from 500 kg to 30 tons (for the most common applications). As regards the type of rail, the more used are the square bars, the Vignole and the Burbach, each of which is available in different sizes.
For this reason, the trolley has been designed with the possibility to adapt to rails with a width within the range 55–75 mm. The dimensions of the trolley are 760 × 275 × 400 mm and it can be easily installed on the rail by the operator. The measure is performed considering one rail at a time and the data acquired on the two rails are then analyzed together by a specific software. The device is composed of a rigid frame and supported by two independently steel rollers (10) that are in contact with the rail.
The driving roller is powered by a DC motor through a friction transmission, while the other roller is trailed. Two leverage arms (9) are installed on the same side of the trolley in order to stabilize the trolley while it is running. Each arm can rotate around the vertical axis with respect to a pivot shown in Figure 5(a) and it is kept in contact with the rail side by means of a preloaded spring acting at one end of the arm. The other end of the leverage holds a ball bearing (11) which is in contact with the rail. The contact force between these elements can be regulated acting on the spring preload. An identical roller bearing (11) is installed on the other side with respect to the floating arm and it is rigidly connected to the trolley frame, as shown in Figure 5(b) .
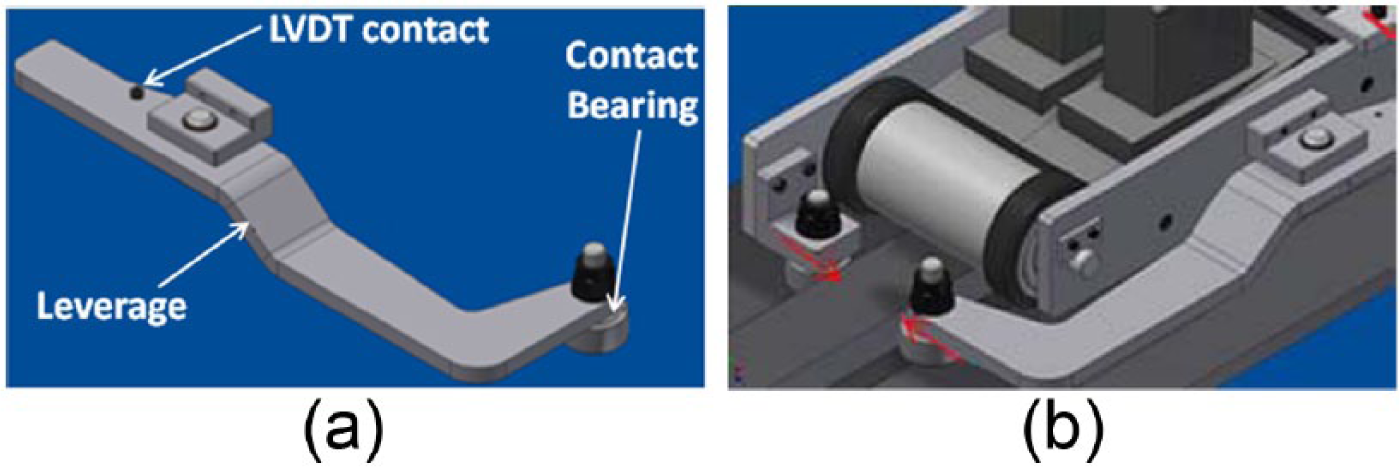
(a) Detail of stabilizing arm and (b) strategy used for the vehicle stabilization
The leverages not only have the function to provide the trolley stabilization but also they are used to measure the rail lateral irregularities.
The lateral position of the end of the leverage nearest to the spring is measured with an LVDT and, knowing the position of the pivot, it is possible to calculate the amplitude of the rail lateral irregularities.
The trolley includes a motorized tower which supports the optical reference used by the laser tracker station to detect the target position while it is moving. The tower can rotate around its own axis by means of a DC motor in order to keep aligned the reference and the laser tracker. The maximum angle allowed between the instrument and the target is 90°; therefore, they must be progressively aligned during the motion of the trolley. The structure of the rotating tower and the optical reference are shown in Figure 6 . The trolley also includes an inclinometer which is used to measure the pitch and roll angles that are used together with the data acquired by the laser tracker for the calculation of the rail position.
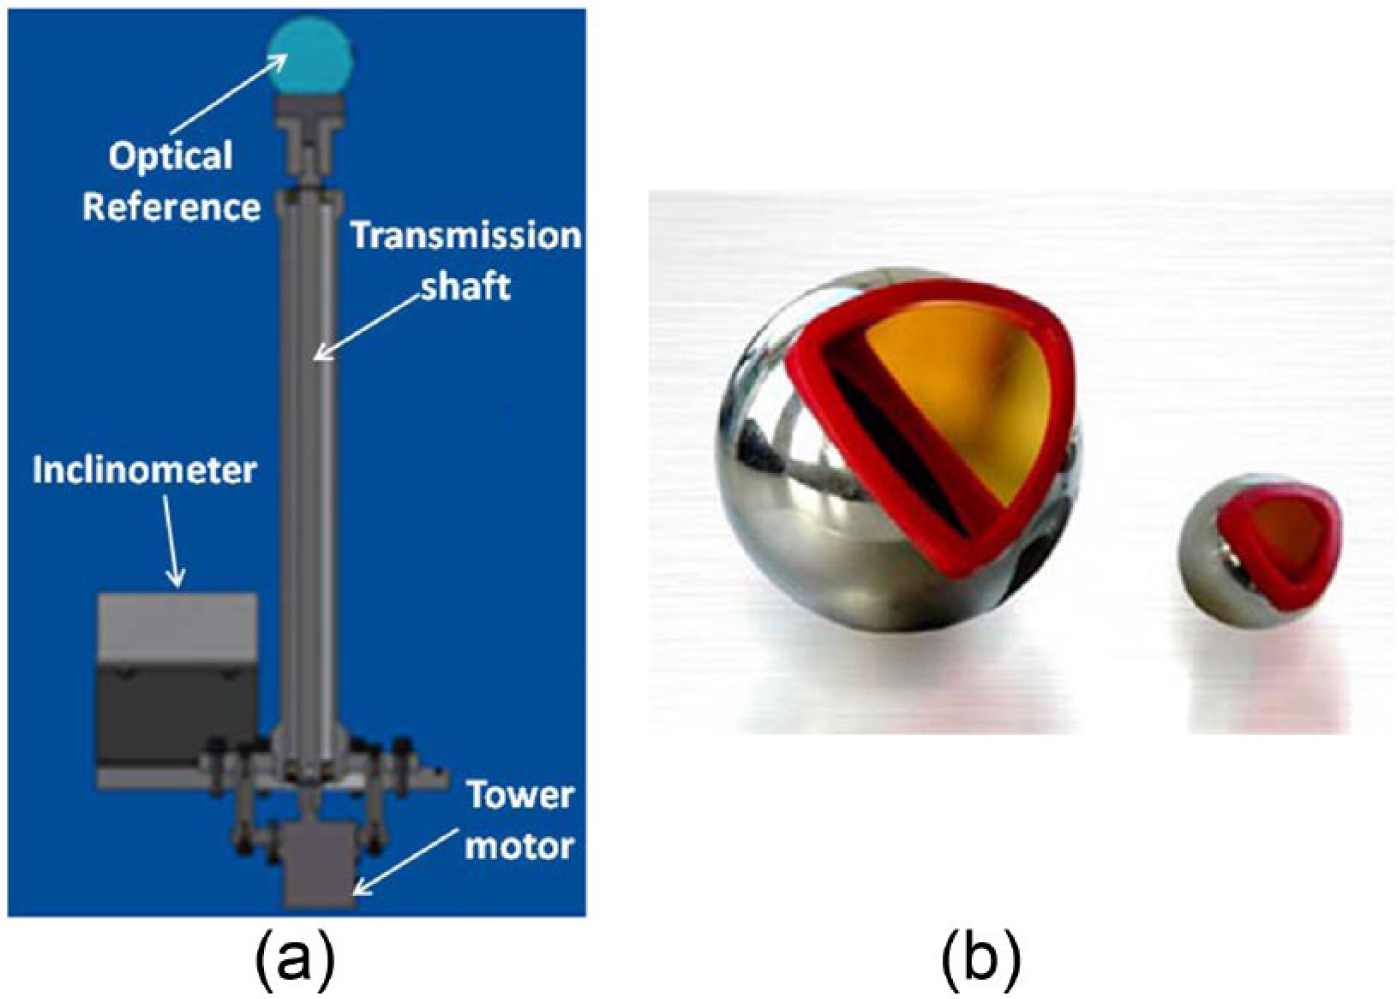
(a) Motorized tower with optical reference and (b) reflecting sphere representing the optical reference for the theodolite
The main DC motor is supplied at 24 V with a nominal current of 2.5 A and it is able to provide a nominal torque of 2 N m. The motor characteristic of the current versus the motor angular speed is shown in Figure 7(a) . The speed reducer, used to transfer the motion from the motor to the wheel, has been chosen in order to ensure an adequate speed to the trolley. A secondary DC motor is used to rotate the tower and it is supplied at 12 V with a nominal current of 30 mA. Since the rotation speed of the tower must be very slow in order to reduce the vibrations induced on the optical reference, a planetary speed reducer is used to connect the tower and the motor.
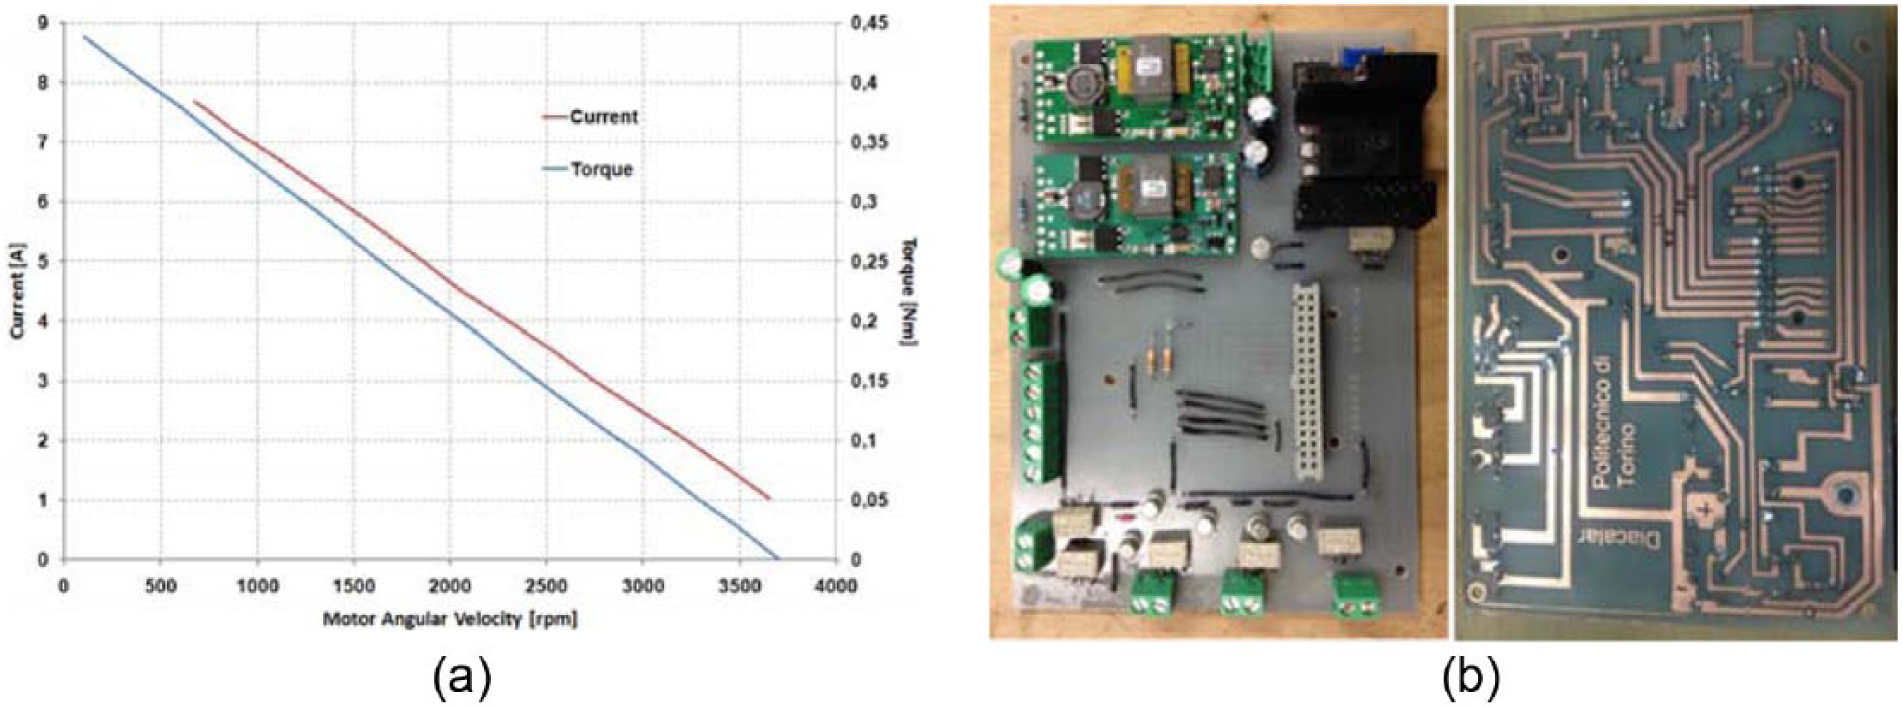
(a) Characteristic of the main motor and (b) dedicated motor control board
The control system has been completely embedded on the trolley and it performs the power supply for the motors and sensors, motors’ control, signal conditioning, and data acquisition (DAQ) and transmission. The system is powered by rechargeable lithium batteries that provide the power supply to the system for the time necessary to perform the complete measure on the overhead crane. A scheme of the control/acquisition system of the trolley is shown in Figure 8 , where the following components are indicated:
One embedded PC with Intel dual-core 1.8 GHz/1 MB L2 cache, 1 GB DDR3 SDRAM, 12 V supply voltage, 1.68 A current, which runs the trolley control/acquisition program;
One WiFi router with dual-band connectivity at 2.4 GHz/5 GHz, wireless connection with standard 802.11n, 12 V supply voltage, 1 A current consumption, used for the data Transmission Control Protocol (TCP)/Internet Protocol (IP) transmission between the trolley and the laser tracker;
One DAQ board (NI 6008 USB OEM) with 8 analog inputs, 2 analog outputs, 12 digital input-to-output (I/O) channels, 10 kS/s maximum sample rate, 5 V supply voltage, 100 mA current consumption (DAQ I/O), used for the acquisition of the sensors and the motor control;
One motor control board (see Figure 7(b) ) used to manage the power supply of the different components and to interface with the acquisition board, the router, and the embedded PC;
One rechargeable lithium ion batteries with 14.8 V nominal voltage and 5.8 Ah capacity;
One power adapter board for power supply and battery charging.
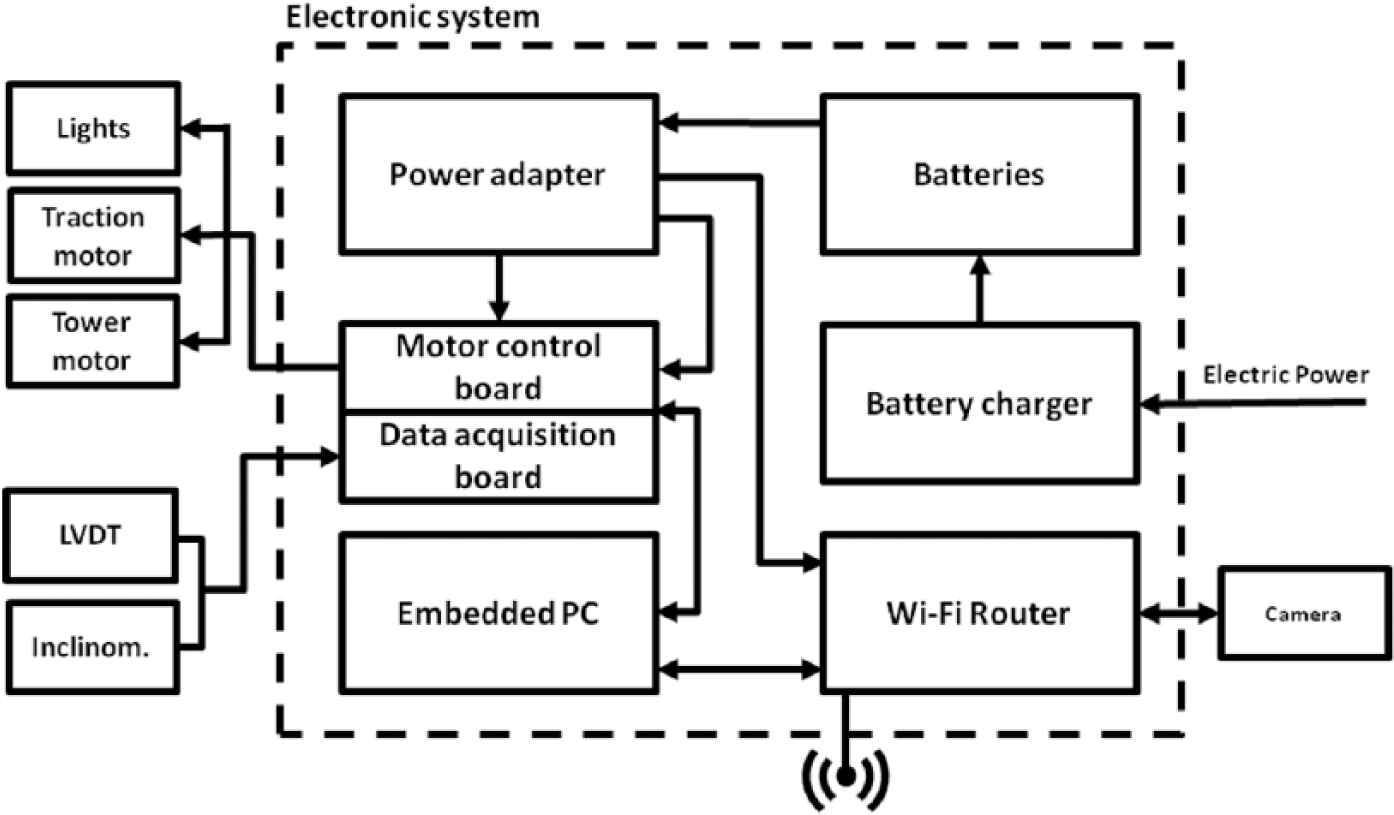
Schematic of the control/acquisition circuit of the trolley
As previously mentioned, the trolley has several sensors to detect the irregularities of the rails:
One biaxial inclinometer: range ±15°, accuracy 0.2°, resolution 0.001°;
One LVDT: range 10 mm, output linearity <0.2%, repeatability <0.15 µm;
One digital camera: focal length of 5.01 mm, minimum illumination 1 lux, 4× digital zoom that is used to check the rail status and to verify the presence of any obstacles on the rail.
The embedded controller executes the control/acquisition program, which communicates with the PC used by the operator from the ground and with the laser tracker, using a WiFi connection with the TCP-IP protocol. The PC is also connected via USB to the DAQ board which allows to control the two motors and to acquire the signals of the LVDT and the voltage of the two batteries in order to check the charge condition. The digital outputs of the DAQ act on solid state relays to enable/disable the traction motor, the motor of the tower, the power supply of the LVDT, the inclinometer, and the lights. Other two digital outputs are used to control the direction of rotation of the two motors.
An operational amplifier is used to control the acceleration/deceleration ramp of the traction motor according to the analog output signal generated on the output channel of the USB board 6008.
The inclinometer communicates with the embedded PC through an RS232 serial connection that allows to control the sensor status and to acquire the trolley pitch and roll angles. The power board of the system (power adapter) is composed of two high-efficiency step-down DC–DC converters that convert the battery voltage (variable from 16 to 12 V) into the stabilized values required by the trolley components. The core of the system is the relay/motor board that is responsible for supplying power to all units of the trolley on the basis of the signals received from the DAQ USB 6008 board.
The control strategy of the trolley has been realized in order to move the device in steps of predefined length (default is 1 m) and the movement is controlled by acceleration/deceleration ramps, as shown in Figure 9 . After each step, the trolley automatically stops in order to allow the measurement of its spatial location using the laser tracker placed on the ground. The displacement cycles of the trolley are remotely controlled by the operator from the ground. The operator is able to start a cycle and to stop the trolley also before the cycle is completed. If the cycle is not stopped by the operator, the trolley completes the cycle by moving the predefined distance. The position of the trolley along the track is acquired in real-time by the laser tracker placed on the ground. This measure can be performed when the trolley is stopped on the rail or even continuously while the trolley is moving. In the first case, the measure is performed at the end of each displacement cycle, when the trolley is stopped. In the second case, the trolley position is acquired while it is moving, but with lower resolution.
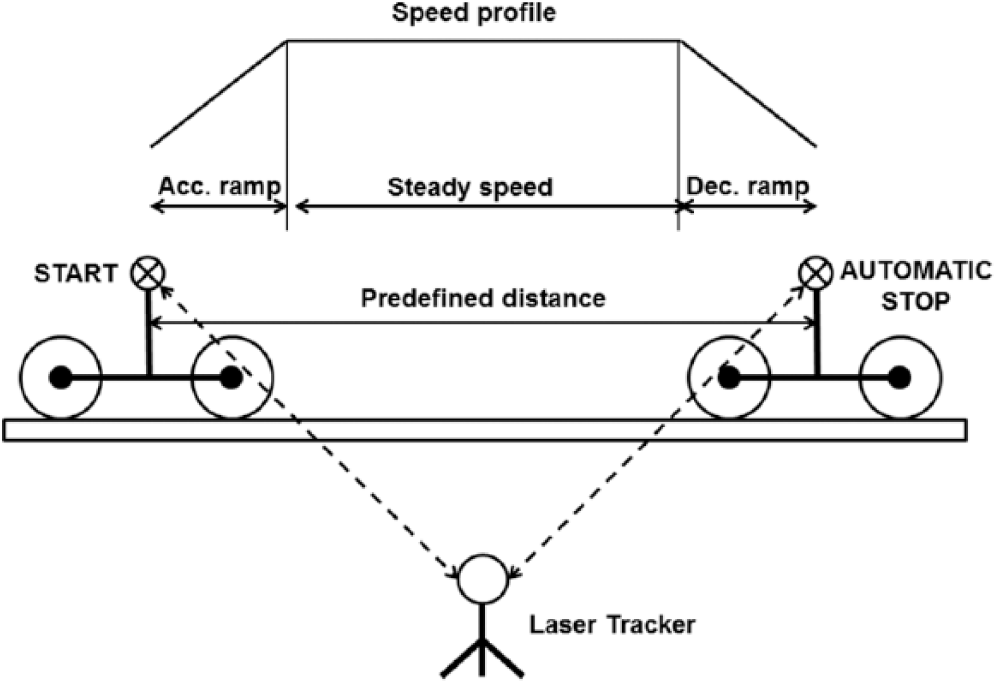
Measurement of the trolley position with the laser tracker after the predefined displacement (trolley stopped)
The data measured by the inclinometer and the LVDT sensors are instead measured continuously, also when the trolley is moving. These data are sent via WiFi to the operator PC and automatically combined with the data measured by the laser tracker station in order to evaluate the rails’ leveling, alignment, and irregularities.
IV. Numerical Modeling and Stability Analysis
The analysis of the trolley stability was conducted using the multibody software ADAMS. A detailed numerical model of the trolley has been developed in order to analyze different scenarios: (a) the trolley is not able to stay on the rail (overturning), (b) the trolley is stable on the rail but running with inclined position with respect the vertical axis, and (c) the trolley runs on the rail with vertical aligned position (normal running condition). The first two situations are represented in Figure 10(a) and (b) , respectively.
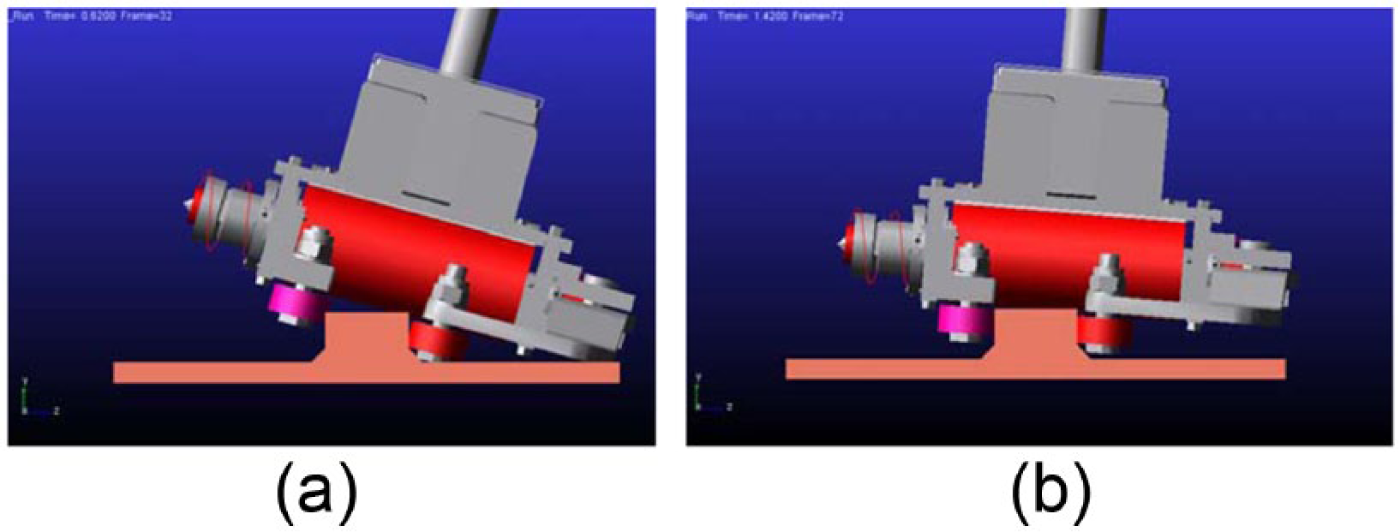
(a) Condition of overturning and (b) running inclined with respect to the rail
The trolley has been designed to work on tracks with variable width, within predefined ranges. Then, the center of gravity of the trolley will be shifted with respect to the center of the rail depending on the specific situation; as shown in Figure 11 , this misalignment generates a tilting moment that must be carefully evaluated in order to prevent the overturning of the trolley. Two different solutions have been adopted to avoid this condition: (a) design of two mobile lateral leverages able to produce a tightening force with respect to the rail side and (b) distribution of the auxiliary trolley components (motor, batteries, etc.) in order to make the overall center of gravity closer to the rail center. The preload force of the lateral arms must be sufficient to oppose the overturning moment, but not excessively high to hinder the vehicle motion.
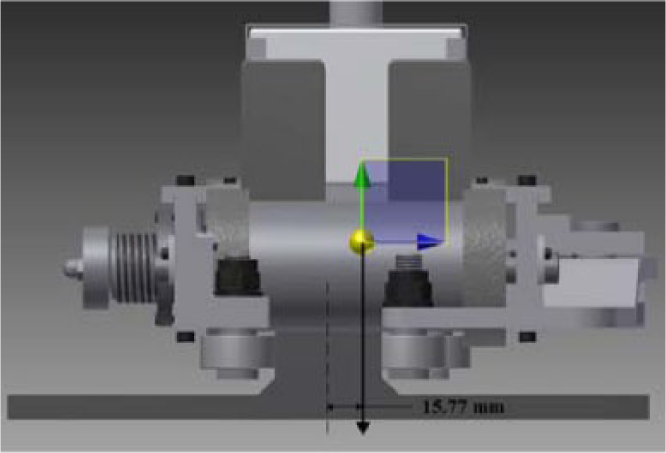
Example of misalignment of the center of gravity from the center of the rail
The multibody model considers nine rigid bodies: the trolley frame, two rollers, four contact ball bearings, and two stabilizing arms. Each roller is connected to the trolley frame by means of a revolute joint that allows the rotation of this element with respect to its own axis. The two stabilizing arms are also connected to a revolute joint with respect to the trolley frame, but in this case the joint allows the rotation of this body around the vertical axis. The same type of joint is used to connect the contact bearings to the leverages and to the trolley frame. This last body has all the 6 degrees of freedom with respect to the main reference system. The rail, where the trolley runs, is jointed to the main reference system by means of a 0-degree-of-freedom joint. The interaction between the trolley rollers and the bearings with the rail has been realized creating elastic contact elements. These elements also take into account the tangential actions due to the friction necessary to simulate the trolley traction effort. Two spring force elements between the trolley frame and the stabilizing arms have been used to simulate the effect of the helical springs used to maintain the correct contact pressure between the rail and the bearings.
The simulation results shows that, in order to have stable vertical alignment, the distance between the trolley center of gravity and the center of the rail must be less than 11% of the rail width, when 55-mm width rails are considered. Instead, when rails with width of 75 mm are adopted, the maximum allowed distance has to be less than 4% of the rail width. These two conditions can be seen in Figure 12(a) and (b) , respectively. Therefore, the final trolley design assures a maximum distance between its center of mass and the rail middle plane included in the above indicated ranges.
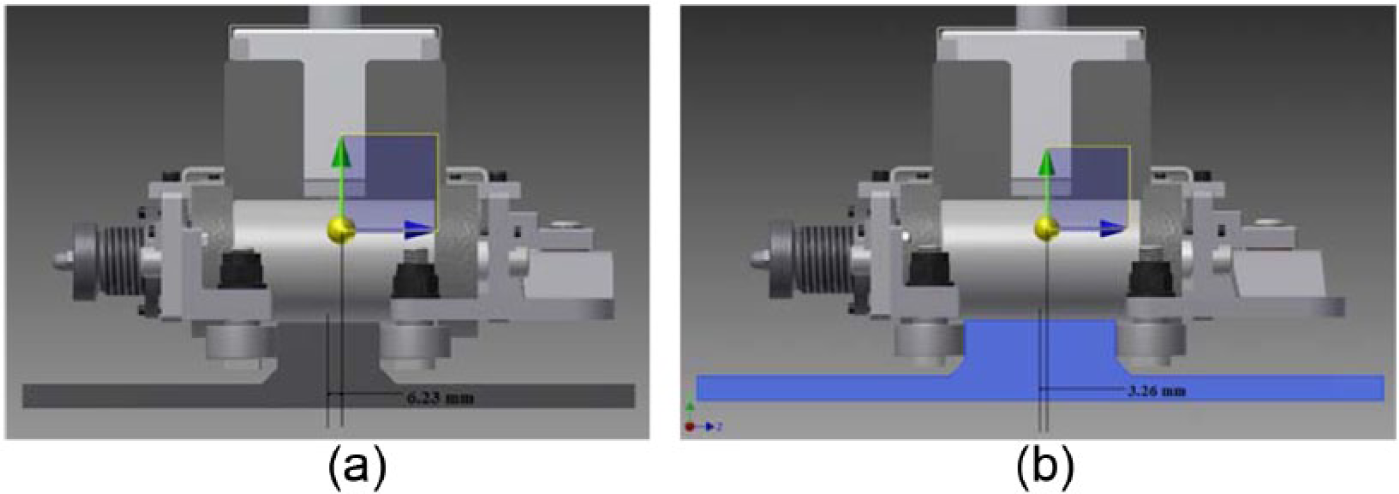
Maximum misalignment of the center of gravity from the center of the rail when considering rails with width of (a) 55 mm and (b) 75 mm
V. Control of Actuation and Measuring Systems
The program for acquisition/control of the trolley is divided in two parts: the first one, called target, is run on the embedded PC installed on board, and the second one, called host, is run on the operator PC on the ground. The target program is used to control the trolley and communicates with the host program by means of shared variables. This program includes the user graphical interface providing the input commands and stores the data acquired on a solid state disk. Figure 13 shows the layout of the host program for the control of all the trolley subsystems. Both host and target programs have been developed in LabVIEW using “shared variables” for TCP/IP communication. A watchdog has been implemented in the target program, with the function of power off the traction motor when a connection time out is detected. This system is used to stop the trolley in case of WiFi connection problems and/or hardware faults are detected.
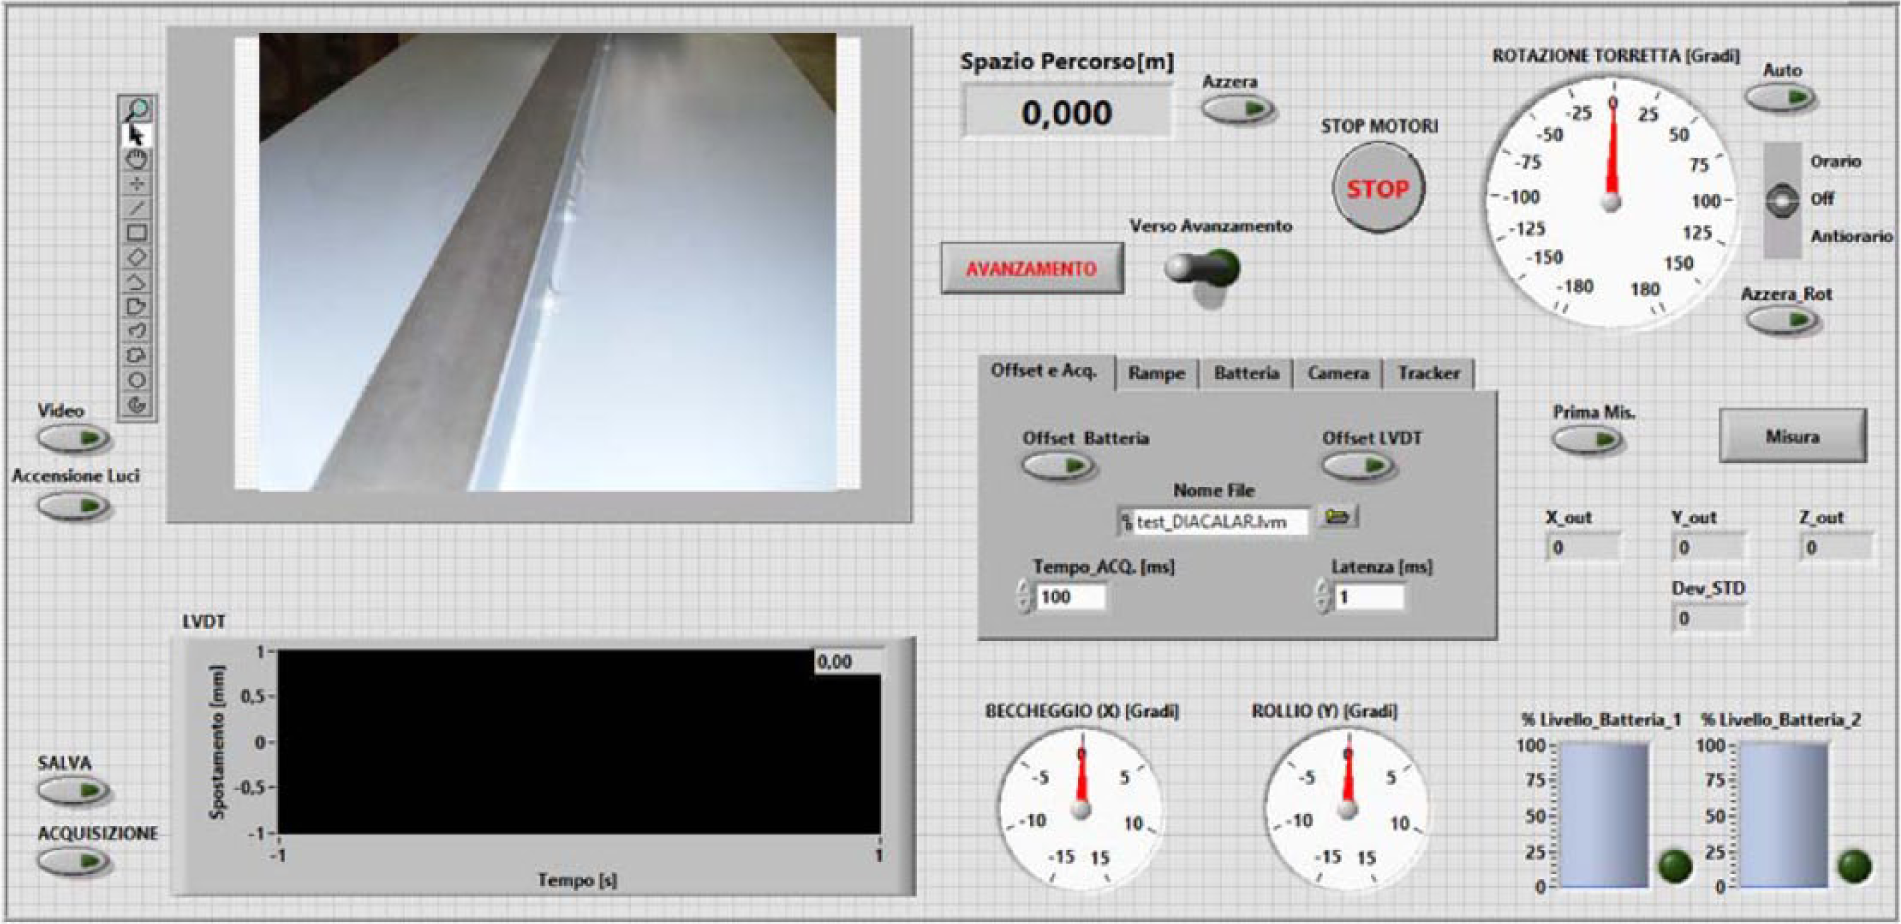
Host program for the remote control of the trolley from the ground
The host program provides information about the status of the batteries and displays in real-time the signals acquired by the inclinometer and the LVDT. In addition, this program communicates, always using the TCP/IP protocol, with the laser tracker station in order to control the instrument and automatically acquires the trolley position. The data acquired from the trolley and the laser tracker are saved in a specific format used by an ad hoc program that combining these data evaluates the status of the rails. The preliminary tests have been performed on two rails that have been installed on the ground in order to simulate specific alignment and leveling errors, which can be detected with the trolley. This experimental arrangement allows to verify all the capabilities of the measuring system and to easily verify whether the measured values are correct. The experimental tests have been performed running the trolley on both the rails several times and acquiring the trolley position every 1 m, while it was stopped. The rail irregularities and the roll and pitch angles have been acquired continuously. Figure 14(a) and (b) shows the trolley during the experimental tests, while Figure 14(c) shows the laser tracker station while acquiring the trolley position.
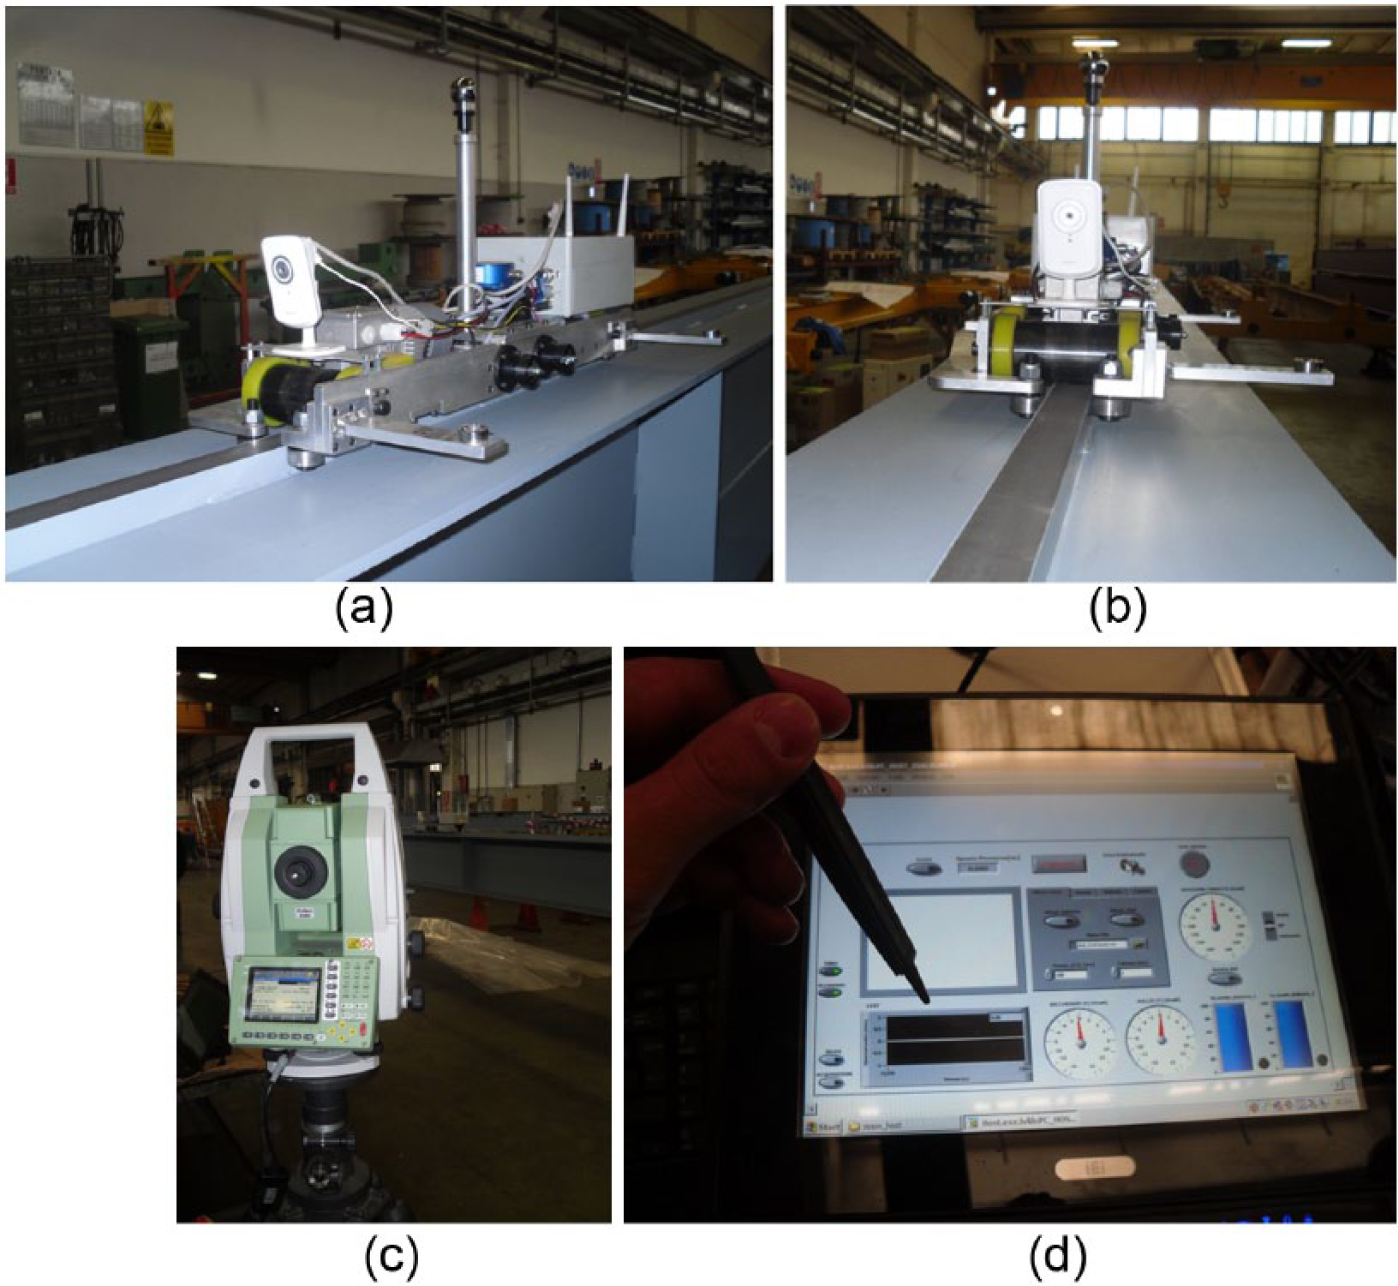
Functional tests of the sensing trolley: (a, b) the trolley while running on the rails, (c) the laser tracker station, and (d) the panel PC used by the operator to control the trolley
A specific software allows to automatically transpose the measured point from the optical reference to the top of the rail, combining the data acquired by the laser tracker and the trolley inclinometer.
The software is also able to plot the two rail profiles in order to show the leveling and alignment errors (see Figure 15 ). This program has been expressly developed for this application and it is able to read directly the file generated from the host program, containing both the information measured on the trolley and the laser tracker station. Finally, in order to verify the WiFi coverage of the application, the trolley has been tested on a rail of an overhead bridge crane which is actually in use (see Figure 16 ). Several tests show that no particular problems occurred during the trolley operation.
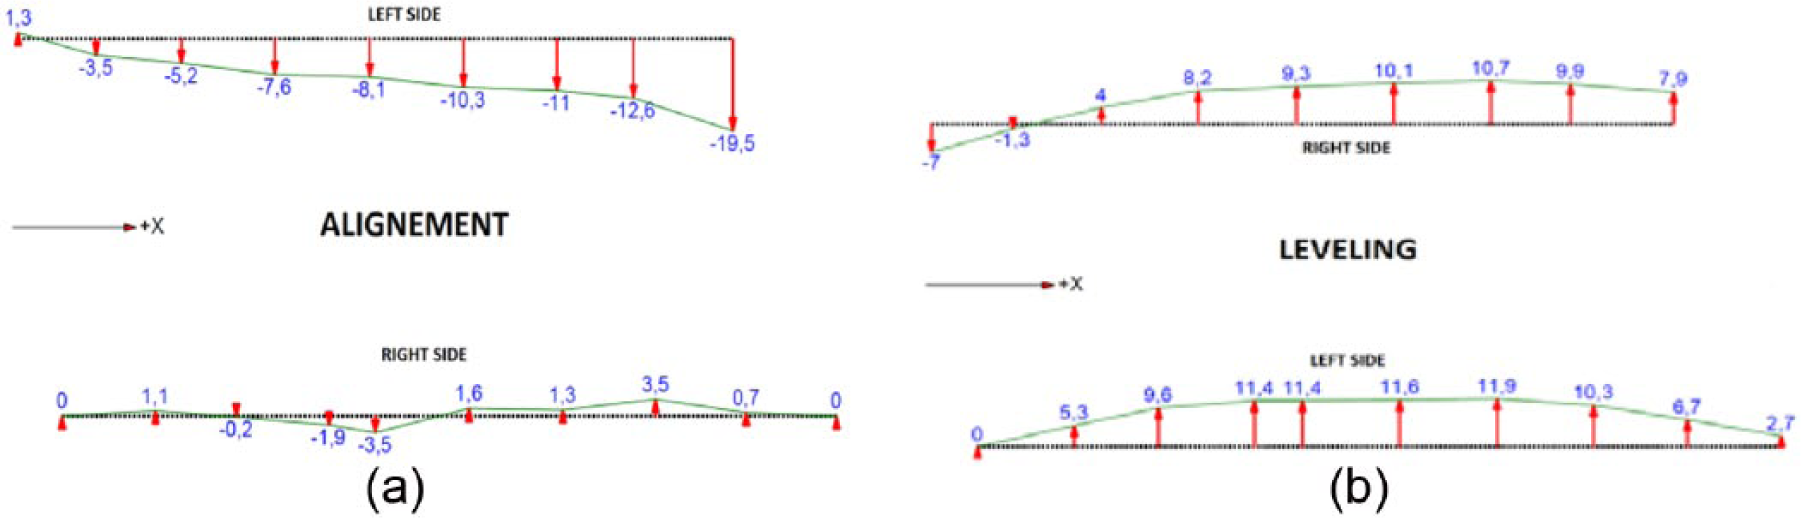
(a) Alignment and (b) leveling errors in millimeters acquired on the rails during the experimental tests
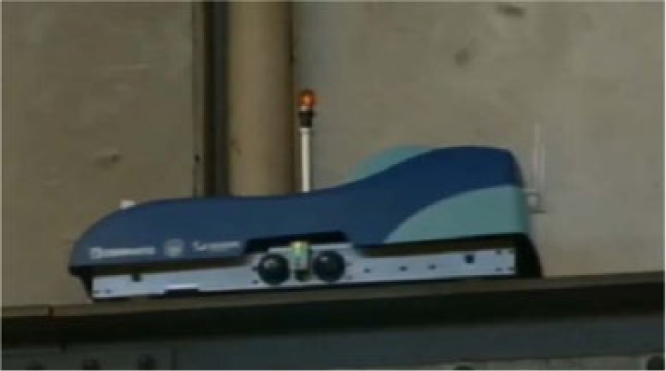
Trolley during operation on a rail of an overhead bridge crane
VI. Conclusion
The paper shows the design of a controlled trolley suitable for measures during the installation and functional testing of rails for industrial overhead cranes. The trolley, able to run on the rails, can be controlled by the operator from the ground and integrated, as a patented measurement device, in a tracking laser station. The trolley includes several onboard sensors and an optical sensor that allows to measure the trolley position by means of a laser tracker station placed on the ground. The data measured from the laser tracker and the onboard sensors allow to evaluate the rail conditions in terms of leveling, alignment, and lateral irregularities. A specific software in fact allows to immediately analyze the acquired data in order to plot the rails’ position and the misalignments from the nominal position. In comparison with traditional operations, where visual inspections and manual measurement of the rail at fixed distances are required, the system shown in this work allows a time reduction, during installation and maintenance operations, ensuring greater safety for the operators. The system in fact can be completely controlled from the ground, thanks to a wireless connection, and the only operation required to the operator is to place the trolley on the rail.
Footnotes
Funding
The author(s) received no financial support for the research, authorship, and/or publication of this article.