
Abstract
This study involves a circuit which is made in order to prevent traffic accidents caused by tiredness of the driver and sleepiness. Infrared light emitting diode and infrared phototransistor are used to track driver’s body values during vehicle driving. The pulse value, which can increase or decrease directly proportional to the heart rate, can be controlled with the help of this infrared light emitting diode and infrared phototransistor. Peripheral interface controller is used in the construction of the system. The blood pressure was transformed to an electronic signal with infrared receiver and infrared transmitter by checking the heartbeats. This electronic signal was processed with peripheral interface controller and the system was constructed. In application, the pulse rate of the driver is continuously measured, and these values are shown on a small display permanently. It is installed on a portable steering wheel which can be used in the automotive industry. The process of waking the driver up can be made by raising the voice of music and with the vibration of the seat.
I. Introduction
Many research works show that sleepiness occurs due to alcohol in both single and multiple motor vehicle accidents. Lots of them have focused on driver state/behavior because of the vehicle accidents. 1 If the driver’s state can be detected, then the driver–vehicle system will warn the driver. 2 These kinds of works are called as a next-generation driver assistance system. 3 There are many works existing to monitor the driver behavior. The best way to understand whether a person is sleepy or not, is to control pulse and cardiac rhythm values The mentioned values are so deterministic for this study. Cardiac rhythm and pulse rate values change clearly when people are asleep. Camera-based surveillance system can be designed for checking the driver behavior. For the first time, it was thought but cannot provide an effective result; therefore, study is made concerning pulse values and cardiac rhythm.
Some of the traffic accidents due to driver’s diminished vigilance level have become a serious problem for the society. 4 The statistics show that between 10% and 20% of all traffic accidents in Europe are due to drivers’ diminished fatigue level. Actually, this is the main cause of other vehicle crashes such as heavy truck. 5 The US National Highway Traffic Safety Administration (NHTSA) study shows that falling asleep while driving is responsible for at least 100,000 automobile crashes annually. Also, there are 40,000 non-fatal injuries annually, and about 1550 fatalities resulted from these crashes. According to the study, the vehicle had a single driver and these crashes occur between midnight and 6 a.m. 6 It is hazardous if the driver takes a trip alone during that time. The people’s body fatigue and level of sleepiness increase quickly during that time, which is the main reason why so much accidents occur. These statistics show the true level of the involvement of sluggishness because they do not include alcohol usage, passengers, and daytime hours.
Heart rate is used to measure the driver’s level of stress and vigilance 7 and driver’s workload.8–10 The heart rate and its variability are also used to determine the driver’s physiological state. If the average pulse rate is below the determined threshold level, then this situation is called a risk border, or the driver falls asleep. Under this condition, there should be a system that can warn and wake up the driver. There are lots of works which measure the pulse rate or pulse rate variability. Knight and friends used a microphone and pressure bulb which are strapped around the wrist and then measured the heart rate. The designed work is intrusive. 11 Kaniusas developed a novel model for blood pressure. A sensor is used for determining heart rate around the neck over the throat artery. However, the sensor causes discomfort to the driver. 12 Cuadras and Casas designed a high-resolution temperature measurement system to measure the temperature fluctuations of the human skin.13,14 Jovanov and friends designed a thermistor-based breathing sensor to measure the amplitude of breath, breathing frequency, and breathing interval. The sensor is enclosed in the nose, which causes high disruption. 15 A non-contact respiratory monitoring system is developed by Sato and Nakajima. The system employs two charge-coupled devices. The developed system has to be practiced for verifying. 16
In this study, we implement a system which is connected to the steering wheel. With the help of this, the driver’s average pulse rate is taken permanently. Values which are taken from the system are compared with the threshold value. The threshold value of the pulse rate is taken using the designed electronic circuit during the device’s first run. The first taken value is a reference one which is used to warn the driver that the results used for comparison and the receiving values are very different. The paper is organized as follows. Section II describes the general system structure. In Section III, microcontroller software system and architecture of the designed electronic circuits are determined. Also, the results of the designed circuits are defined. Conclusion part of the study is given in Section IV. The experimental results show that the real-time warning system works well under the condition that is determined for the asleep position.
II. General Structure of the System
In this study, the control of the state of sleep and falling asleep of the driver was overseen. The known average pulse rate of a person is between 60 and 80 per minute. If this rate decreases 10%, the health of the driver could be at the risk border or the driver is going to sleep. Under this condition, the designed system is provided to wake up the driver. In this study, the reformed circuit is made in order to prevent traffic accidents caused by tiredness of the driver and sleepiness. Infrared (IR) light emitting diode (LED) and IR phototransistor are used in order to track driver’s body values during vehicle driving. 17 Pulse value, which can increase or decrease directly proportional to the heart rate, can be controlled with the help of this IR LED and IR phototransistor.
This circuit is added onto the steering wheel so that it does not require an external system to obtain pulse values when the driver enters the vehicle. Devices such as watches, seat belt, and rings which are extensively used in the market are not taken into consideration because when the driver enters the vehicle it is not sure whether the driver has those devices or not. For example, most of the drivers do not use seat belt when driving. But steering wheel has to be used every time when driving which is the main reason why it was chosen for this study. With the system we use, the person is obliged to give this information to the system because the driver will make contact with the steering wheel in order to use the vehicle. For the installment part of the circuit on a steering wheel which is taken into consideration of the standard steering wheel usage form that is a quarter past nine.
This usage form is the only one which we can steer the steering wheel in emergency situations on both sides in equal degrees. The prepared system gets the values when the driver uses the vehicle and touches the steering wheel. During every heartbeat, blood which is pumped to the body increases and the density in blood vessels decreases. IR LED and IR phototransistor sensor which are put near the finger and other side crossly, make use of those increasing and decreasing values which our designed system development. Blood is pumped by the heart and then the blood proportion in the veins increases; this variation in the vein causes less light to pass to the transistor. And when the blood level decreases, more light passes to the transistor. LM358-based circuit senses the difference between these two values and brings it to a level so that Peripheral Interface Controller (PIC) integration can sense it. 18
The out of the Analog circuit with LM358 is connected to PIC integration’s RB0 numbered leg.19,20 The aim of this is to count the pulses which come through to PIC RB0 numbered for 10 s. During this measurement, it calculates the driver’s pulse rate, multiplying the obtained value with 6. At the same time, it shows the obtained value on the LCD (Liquid Crystal Display) which is connected to the B port in real time. 21 The designed circuit saves the first value coming from the driver as a reference value and compares other obtained values to this value. The system gives out when the compared values are less than 10% of the first value. There should be 10% difference between reference and obtained values. The output of the system is shown on the steering wheel, and also other outputs such as reducing the speed of the vehicle, vibrating driver seat, or increasing the volume of the vehicle’s media player when the person is on the verge of sleeping can be produced.
A. Block schema of the application
In Figure 1 , the block scheme of the system is shown. The system consists of an IR sensor–transmitter, electronic filter and amplifier circuit, PIC microcontroller, and LCD which are installed on the vehicle’s steering wheel. Heartbeats cause blood to move to the veins. As a result of this movement, with every heartbeat, volume of the blood vessels changes. It is possible to feel this volume change in various parts of the body. For example, changes in wrists can be easily felt just by putting the finger on the wrist. Increase in blood volume in fingers or ear points can be measured with sensors which can be put on the finger or on the ear point.
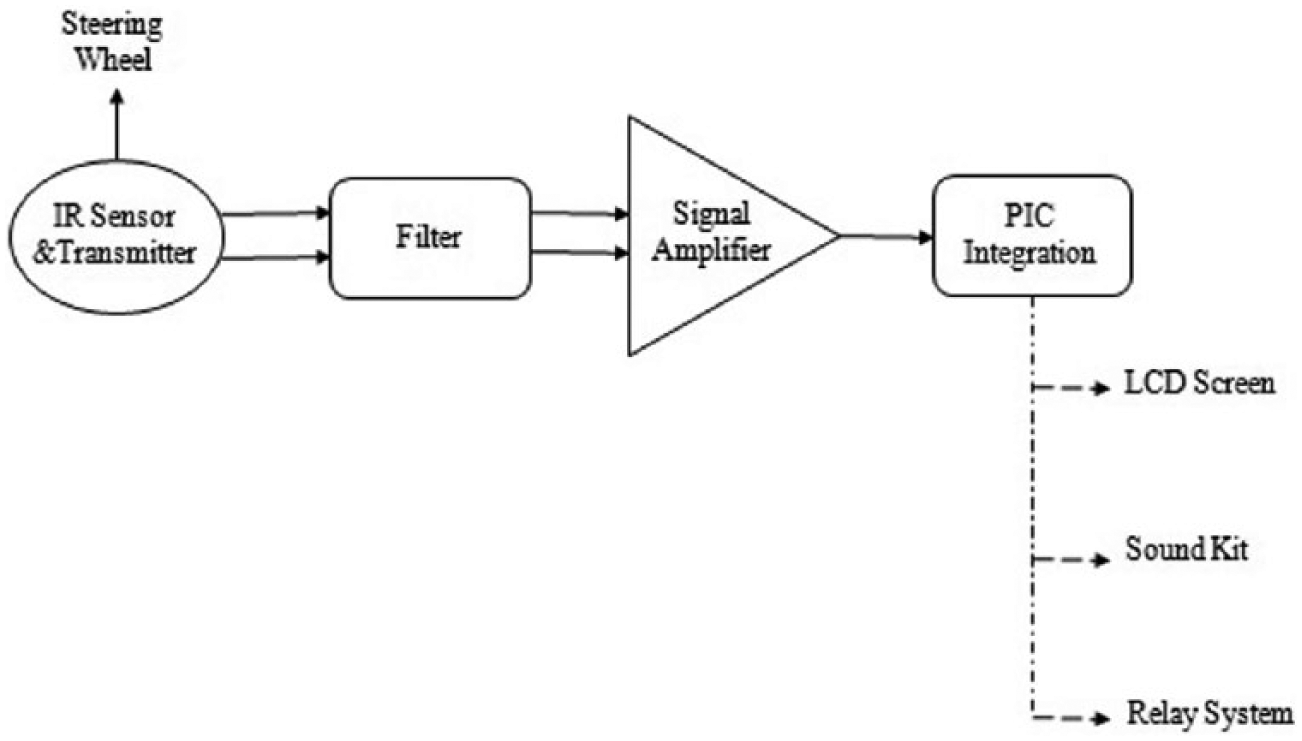
Block schema of the system
III. System Architectural Design
In this part of the study, the designed system on steering wheel and electronic circuits is defined deeply. The microcontroller software flow chart is described and the designed system working scheme is given.
A. Model of the designed steering wheel
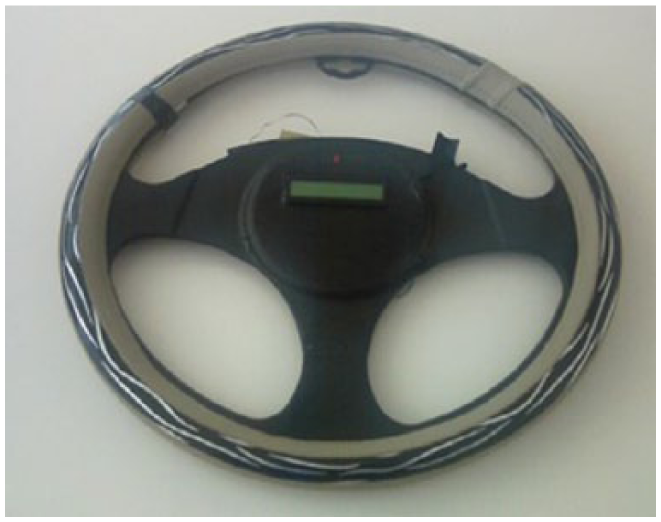
The volume of the blood passing through the finger changes the amount of light coming to the IR sensor, and this change is sensed by the IR sensor. Then this signal intensity increases; in order to reduce electrical noise, it is passed through the filter network and given to the microcontroller. The heartbeat rate in the measured minute is shown on the LCD. In Figure 2 , the designed sample model of the steering wheel is shown. In the middle of the system, the designed electronic card is given under the wheel.
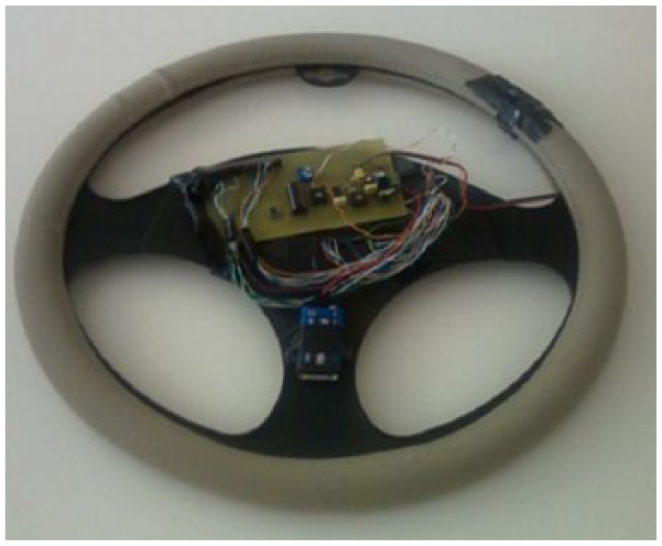
A sample model of steering wheel
In Figure 3 , IR LED and IR phototransistor are shown. They are combined near the wheel. The driver’s pulse rate is taken when using the vehicle. The way of holding the steering wheel is similar to quarter past nine. Pulse rate is taken from the driver’s finger when steering wheel is held by him permanently.
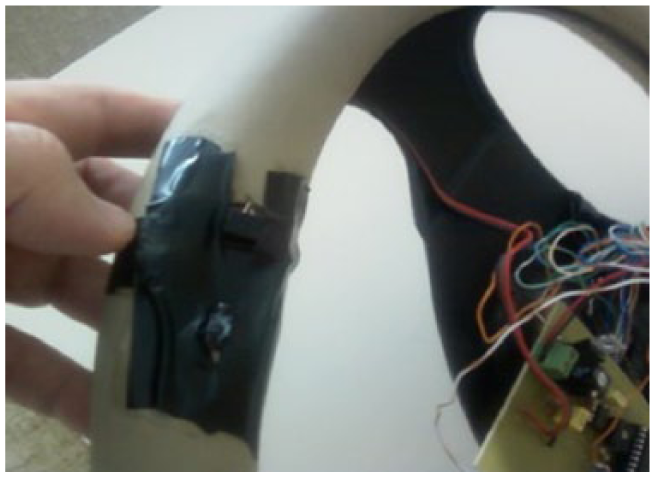
IR LED and IR phototransistor
Amplifier and filter network
Amplifier and filter network increases the signal level which is perceived by IR, and it also reduces the possible electrical noise from passing this signal through filter network. The diode is working with the help of a resistance with little value, in IR diode circuit. It is connected to an operational amplifier at the end of the phototransistor outside. In circuit, an LM358 model operational amplifier is used which has two amplifiers inside. Another model amplifier other than LM358 also is used. Both layers of the amplifier are used. The first layer amplifier gain is approximately 100, and that of the second layer is about 550. At the same time, amplifiers do not let little frequencies pass with the help of low-volume capacitors. Filter network reduces the signal powers which are above approximately 2 Hz. Signal’s density can be adjusted via the potentiometers on the circuit. An LED diode is used on circuit output. This LED diode flashes on and off in compliance with heartbeats. Amplifier and filter network output is connected to a PIC16F628 model microcontroller. Also, an LCD which allows us to see pulse number is tied to the ports of microcontroller. 21 In Figure 4 , the designed circuit system is shown clearly.
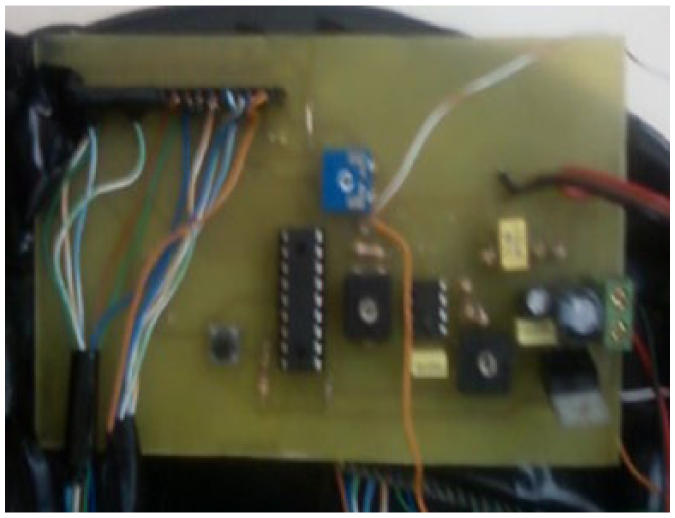
Designed circuit of the system
Supply layer
On circuit 9-V signal taken from 7805 layer battery or DC signal which will be given is reduced with the help of 7805. Integrated circuit and LCD feed from the obtained voltage of 5 V.
Analog data sensation and processing layer
The LM358 series is manufactured with the NPN silicon phototransistors. They have been molded in blue tinted epoxy packages. Their narrow receiving angle property provides excellent on-axis coupling. The LM358 is tested using IR light with 100% production. Their operational amplifiers are formed high gain, two independent internally frequency compensated. They were designed specifically for operation from a single power supply with a wide range of adjustable voltages. Split power supplies could be used for operation. The low power supply current drain is independent from the magnitude of the power supply voltage. The LM358 has a wide range of application areas like DC gain blocks, transducer amplifiers, and all the conventional opamp circuits. The opamp circuits are easily implemented in single power supply systems. For example, it can be directly operated with the standard +5 V power supply voltage. This voltage is used in a wide range of digital systems. It will easily provide the required interface electronics without requiring the additional ±15 V power supplies. 22 There are some features that belong to IR LED and IR phototransistor.22,23 Some of them are given below:
Available in 8-bump micro surface-mount device (SMD) chip-sized package and internal frequency; compensated for unity gain. DC voltage gain is about 100 dB and very large and wide bandwidth is about 1 MHz (temperature compensated);
Wide power supply range—for single supply: 3–32 V; dual supplies: ±1.5–16 V;
The supply current drain is about 500 µA and the input offset voltage is very low of about 2 mV;
Input common-mode voltage range includes ground and differential input voltage range.
In Figure 5 , IR LED and IR phototransistor test circuit is shown. The scheme is also about the switching time. The circuit is a test one and its test conditions are as follows: light source is pulsed LED with tr and tf ≤500 ns. And the If current is adjusted when the Vout = 1 Volt.
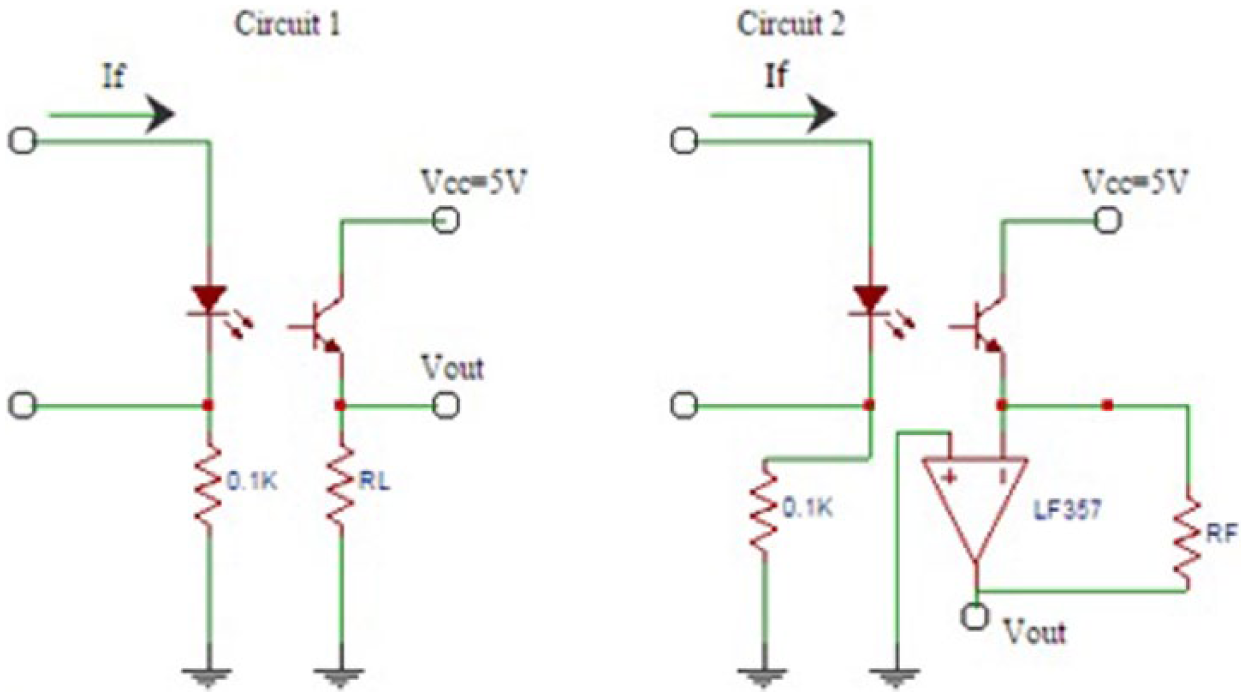
Pulse signal coming from IR sensor and transmitter is filtered in analog data sensation and processing section. Therefore, the signal becomes suitable for the input of PIC integration.
PIC and LCD layer
Figure 6 shows the designed LCD on circuit system on a steering wheel. Signal coming from analog section in PIC and LCD layer is sensed and counted for 10 s. Value counted during this period is multiplied with 6 and person’s pulse value in the minute is calculated. It is shown on the LCD.
Designed LCD on the circuit system
B. Microcontroller software system architecture
The microcontroller software is prepared before the system design. The prepared software codes are compiled to hex codes; then the hex code is installed to PIC16F628. The PIC16F628 is used in this project to develop microcontroller software. MicroC program has a large number of libraries unlike other programs. It uses standard C commands in MicroC and is easy to use. It is a flexible, real-time multitasking kernel.24,25 Its certificate belongs to Federal Aviation Administration for use in commercial. 26
Source code is written in standard C which makes code portable for different processor architectures. There are a lot of services offered by MicroC such as communication semaphores and message queues. It can manage up to 64 tasks. Microcontroller software flow chart is given in Figure 7 .
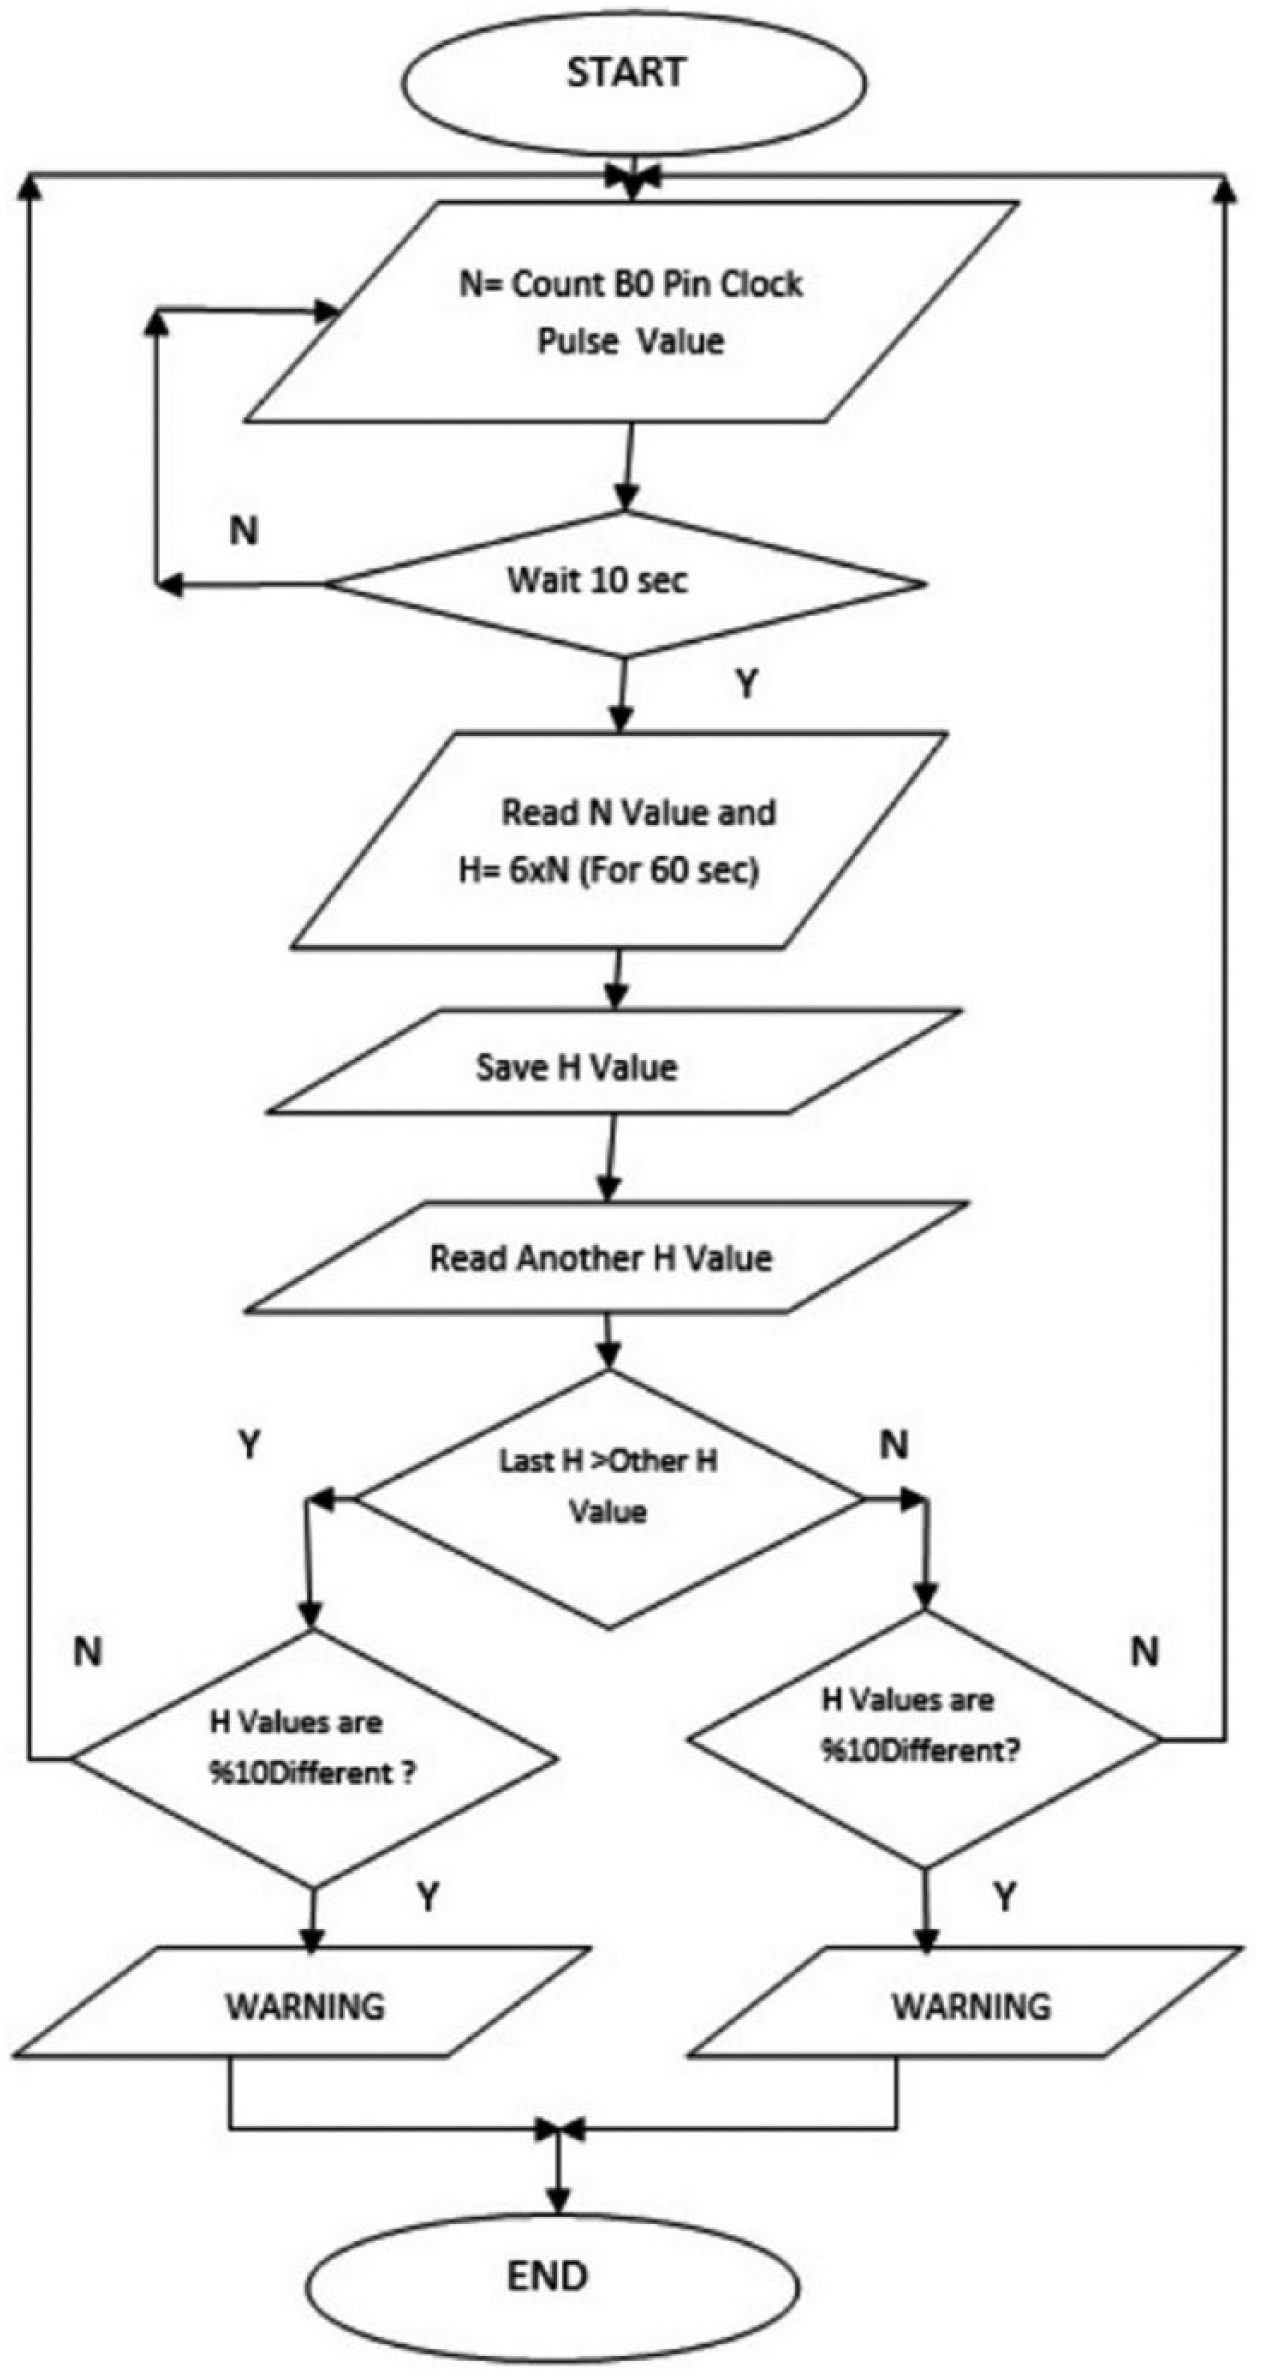
Microcontroller software flow chart
IV. Discussion
This study designed a new objective approach on driver’s behavior for safe driving. This is to prevent the vehicle and driver from accidents, making driver awake when in hazardous circumstances, and remaining vigilant when taking long and monotonous journeys. Specialists called this situation as alertness. So this is the term which is so effective in causing an accident. There are so many research works on this topic, some of them about sleep 27 and the others about wakefulness. 28 There is an experiment which was performed face to face with a truck driver during a long journey. It is shown that most of the truck drivers fall asleep during long journey. According to a previous study, 47.1% of the truck drivers had fallen asleep at least one time, and 25.7% of the truck drivers had fallen asleep during the last 1 year in a long journey. 29 These values show that the term of sleepiness is crucial for traffic accident.
In this study, we take into account the drowsiness term. The level of sleepiness is derived from the driver’s body in real time. This is the most reliable and literal way to understand the driver status. So we choose measuring the pulse rate to understand the driver’s ability to fall asleep. For this work, we measured the pulse rate from the driver’s finger. Actually, there are two ways to measure people’s pulse rate. One of them is on the neck, just near the throat artery veins with the help of three fingers. This would be hard and impossible during the journey. Another way is to take the values from the driver’s finger, which is our study goal. For this work, the easy and more reliable way is the second one. To learn the stage of sleepiness is so important and the driver’s job has to be unaffected.The process of the work does not distract the driver.
Figure 8 shows the general diagram of the instrument process. There are two parts for this job: one of them is human which is called as an object and the other one is the crucial part which is called as an instrument device (system).
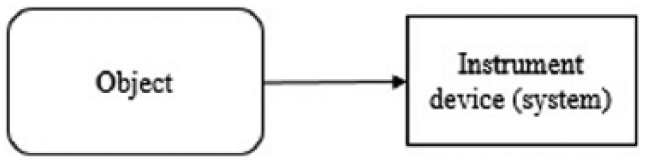
The simple portable system
So our designed system is so simple to understand and obtain values from human body in real time. And the main goal of the study is to make a portable and real-time measurement device for detecting the driver’s sleepiness. Our system shows that this designed circuit might be used as an instrument device for taking pulse rate values from the driver. Also, this could be used as an emergency alert or warning system for ensuring that the driver is awake.
V. Conclusion
Traffic accidents experienced by the increasing number of people who use vehicles and number of vehicles attracted attention for the development of the automotive sector. Traffic accidents are experienced more in developing countries. When it is considered that Turkey is a developing country, automotive sector directed R&D studies toward vehicle security more than vehicle comfort. As understood from the notifications annually made by Turkish Republic Ministry of Transport General Directorate for Highways, human factor (including driver, pedestrian, and passenger) has a big fault rate of 99.78% and first degree responsibility.
Blood movement in veins occurs because of heartbeats. This study is made in order to dispose the possibility of the happening of traffic accidents caused by sleepiness and tiredness of the driver. The system consists of an IR sensor–transmitter, electronic filter and amplifier circuit, PIC microcontroller, and LCD which are installed on the vehicle’s steering wheel. In the developed system, IR sensor and transmitter installed to the steering wheel fit to driver’s one finger considering the holding of the steering wheel on standard conditions (quarter past nine). By this means, driver’s pulse values are calculated by any oscillation occurring in the finger blood vessels with every heartbeat being sensed, and this oscillation is transferred to microcontroller.
The first calculated value from the system, which is a pulse value of the person, is accepted as person’s normal pulse and all other calculations are made by comparing with this value. A warning on LCD screen is seen every time whenever the difference reaches 10% between the calculated and actual values. For further studies, instead of the warning occurring on the screen, a relay mechanism can be added to cut vehicle’s acceleration and stop the vehicle or increase the volume of the music so that the driver wakes up.
Footnotes
Funding
The author(s) received no financial support for the research, authorship, and/or publication of this article.