
Abstract
Batteries are used in a wide area, from mobile phones to electric vehicles. Batteries are used in electric cars, satellites and space systems, communications systems, defense systems, renewable energy sources, and many different application areas. Condition monitoring of batteries and storing measurement data are very important issues. Manufacturers, researchers, maintenance services, and so on use special software and database for viewing and saving measurement data. It is important to measure the data with high accuracy, view with graphs, and save these data systematically. In this study, software is developed and a database is designed to monitor the battery conditions online. This software is developed in C# programming language, and SQL Server is used as database. Current, voltage, resistance, power, temperature of the battery, and ambient temperature are measurement values. Some battery experiments take very long time and someone should wait near the test system to prevent dangers such as explosion and fire. A wide variety of electrical battery experiments can be done without waiting next to the test system with the proposed software and database.
I. Introduction
Batteries are devices that are capable of converting electrical energy to electrochemical energy and storing this energy. At any time, this stored energy is given as electrical energy. Batteries have a wide usage area: mobile phones, radios, notebooks, and some other electronic devices. There are many studies on monitoring the conditions of batteries. These studies are done to diagnose failures and determine the state of charge (SOC), state of health (SOH), state of energy, and efficiency of the batteries. Monitoring the condition of the battery provides information about the current status of the battery, extends the lifetime of battery, and achieves financial gain.
Batteries are nonlinear equipment, and the parameters such as SOC and SOH cannot be measured directly with a sensor. 1 For example, there are many factors like ambient temperature, variability of the load, SOH of battery, and cycle number of battery which affects the charge status of battery. By monitoring the electrical conditions of batteries, many analyses can be performed. Battery models similar to actual applications can be developed and run in a software environment. A well-designed test rig and a robust database are necessary to analyze the information such as SOC, SOH, efficiency, and state of energy about the batteries. There are lots of test rigs and software for using in battery tests in the literature. In electrical tests, researchers generally monitor the discharging and charging conditions of battery. Sensors are used to measure voltage, current, power, temperature, internal resistance of the battery, and environmental conditions such as ambient temperature. Condition monitoring can be done with computers or embedded systems.
Online real-time monitoring voltage, current, temperature, internal resistance of UPS battery, hardware, and software are designed in Kim’s study. 2 With this system, the battery can be monitored by remote control, and if a failure occurs, the system makes a report to the police. Condition monitoring of lithium-ion (Li-Ion) batteries for electric and hybrid electric vehicles was done in Wang and his friend’s study. 3 They focused on the monitoring of safety-relevant system parameters like cell voltage, system temperature, and head space pressure and their significance on the battery’s SOH and possible cell failures. An intelligent battery controller for lead acid (Pb) battery is developed in Alzieu et al. 4 A management system card is developed. The main properties of this system are monitoring the fast and normal charge process, saving data, monitoring SOC of battery, and assisting in maintenance. The importance of single-cell battery management system is highlighted in Gotaas. 5 The battery cannot be stronger than the weakest cell in the battery because if a single cell fails the battery will fail. The single-cell battery management system provides temperature and voltage information to user and helps prevent high charge. It is important to obtain high efficiency under different operating conditions from nickel metal hydride (NiMH) batteries used in electric vehicles. 6 A battery management system is developed to optimize battery system and condition monitoring. A modular battery management system is developed to control and balance battery in Stuart and his friend’s study. 7 They used a circuit to measure voltage and gained high accuracy. Usable capacity of Pb battery is calculated under different discharge currents in Shen et al. 8 Temperature and aging effect are also taken into account. The performance of the mathematical model of the system is compared with experimental results and the reliability of the model is verified. Okoshi and his friends carried out a study on condition monitoring of lead batteries. They used direct current resistance parameter to calculate SOC of battery and made a look-up table. They generated a formula between SOC and direct current resistance and obtained high accuracy. 9 In Zhou et al., 10 estimation of the behavior of battery and battery running situations is done on the battery that is used in hybrid solar and wind energy generation system. A mathematical Li-Ion model is generated and a number of factors such as C rate, charge efficiency, and discharge rate are taken into account; the average voltage is estimated with high accuracy. Wang et al. 11 estimated SOC of Li-Ion battery that is used in electric vehicles with a mathematical model. This algorithm includes differential equations. In Xiong et al., 12 charge and discharge current parameters are used to estimate SOC and maximum power of Li-Ion battery used in hybrid electric vehicles. Huria and his friends generated the electrical model of Li-Ion in MATLAB/Simulink environment. Temperature parameter is also taken into account. The model is tested with New European Drive Cycle, and high accuracy is obtained. 13 In Zhu and Yang, 14 an intelligent battery management system is developed for lithium batteries used in electric vehicles. Charge balance control is done. SOC of battery is estimated using the discharge current parameter of battery. Grasberger and his friends developed an open-source high-performance battery management system. All cells are connected to the battery control card. Cell balance is done by monitoring voltages of cells. Voltage, internal resistance, and current parameters are monitored for each battery. SOC of battery is estimated using the coulomb counting method. 15 In Zhang and Li, 16 a dynamic programming is done for optimal energy management of batteries used in wind turbines. SOC of battery is also estimated with that software. Zhang and Li 17 estimated SOC of battery while discharging battery using Kalman filter and fuzzy logic methods. In Lin et al., 18 electrical characteristics of battery are monitored during its life while charging and discharging, and these characteristics are used to estimate SOH of battery. Probabilistic neural network method is used in estimation. Lee et al. 19 estimated SOC of battery that is used in electric scooters using learning controllers, fuzzy neural networks, and cerebellar-model-articulation-controller networks during discharging battery. Automated online condition monitoring is very important in dynamic analysis of electrical equipment.20,21
As seen in the literature, the measurement parameters vary in studies. Many parameters can be measured when carrying out electrical battery tests. Coulomb counting, impedance spectroscopy, current, voltage, resistance, temperature, and power are widely used measuring parameters in electrical battery tests. Measurements were carried out in constant current or variable current during charging or discharging the battery. The measurement data were used to determine conditions of batteries via different analyzing methods.
This study is an electrical study of the condition monitoring of batteries. We use current, voltage, temperature, and power parameters to monitor the condition of rechargeable batteries. It takes long time to perform battery tests, and someone has to wait near the test setup to prevent possible dangers. User has to save the data manually after all experiments. In this study, during the experiments the battery is controlled if limit values of voltage, current, and temperature are achieved. If one of these values is achieved, the software closes the system automatically. Because of the protection of software, battery can be inserted into the charge–discharge loop safely. The rest periods between charging and discharging are adjustable. Because of these properties nobody has to wait near the test rig. User can monitor the test values from anywhere through remote connection to the test computer. With the reporting property, all measurements can be shown with tables and charts.
II. Experimental Setup
In electrical battery test setups, the experimental setup is shaped according to the measuring parameters. Sensors are chosen according to measurement parameters and measurement range. Charger is used to charge the battery and a load is used to discharge the battery. The collected data can be processed by computer or embedded systems. Successful battery models can be obtained with collected data from electrical measurements. In this study, open circuit voltage, current, power, load, ambient temperature, and battery temperature are all measured during charging and discharging of the batteries.
The measurement setup schema of this study is given in Figure 1 . To charge the battery, Imax B8+ charge equipment (circuit power: max. 150 W, charge current range: 0.1–7.0 A, discharge current range: 0.1–5.0 A, current drain for balancing Li-Po: 300 mA/cell, NiCd/NiMH battery cell count: 1–27 cells, lithium battery cell count: 1–8 cells, Pb battery voltage: 2–36 V) and to discharge the battery Array 3711A programmable DC load (one input, DC input voltage: 0–360 V, DC input current: 0–30 A, input power: 0–300 W, voltage accuracy: 0.2%, current accuracy: 0.2%, voltage: 1 mV, current: 1 mA minimum resolution, 0–50 °C, 80% relative humidity (RH) operating environment) equipment are used. A circuit is designed to choose the charger or load from software. LTS25-NP current sensor (±80 A measuring range, ±0.2% accuracy), LV25P (±14 mA measuring range, ±0.9% accuracy), voltage transducer, and LM35 temperature sensor (−55 to 150 °C range, 0.5 °C accuracy) are also located on this circuit. Three batteries can be connected to this circuit and the experiment battery can be chosen from the software. There are also contacts to control buttons of the charger on this circuit. The contacts on this circuit are controlled by digital I/O on Advantech USB-4716 data acquisition (DAQ) card (supports USB 2.0 Portable, Bus-powered, 16 analog input channels,16-bit resolution AI, sampling rate up to 200 kS/s, 8-ch DI/8-ch DO, 2-ch AO, and one 32-bit counter). While discharging the battery, the current, voltage, load, and power parameters are taken from the load equipment, and while charging the battery, current and voltage parameters are measured with sensors and transferred to computer via DAQ card. While charging, the battery load and power parameters are calculated using voltage and current data. There is also a supply voltage for K109-TC temperature transmitter on this circuit. The output of K-type thermocouple is connected to digital I/O of DAQ card through the circuit. The supply voltage of the temperature transmitter is +24 V DC. DC power sources are used to obtain +12, −12, and +24 V DC supply voltages. The charger is connected to +18 V DC power source. The programmable DC load is connected to the PC via Array 3312 Seri-USB port converter. Square codes are glued to all batteries that define their identity. Perkon Spider SP400 square code reader is used to read codes. This equipment is connected to computer via a USB port. A web camera is used to watch the experimental setup, and this equipment is also connected to the USB port of the computer. A picture of experimental setup is given in Figure 2 .
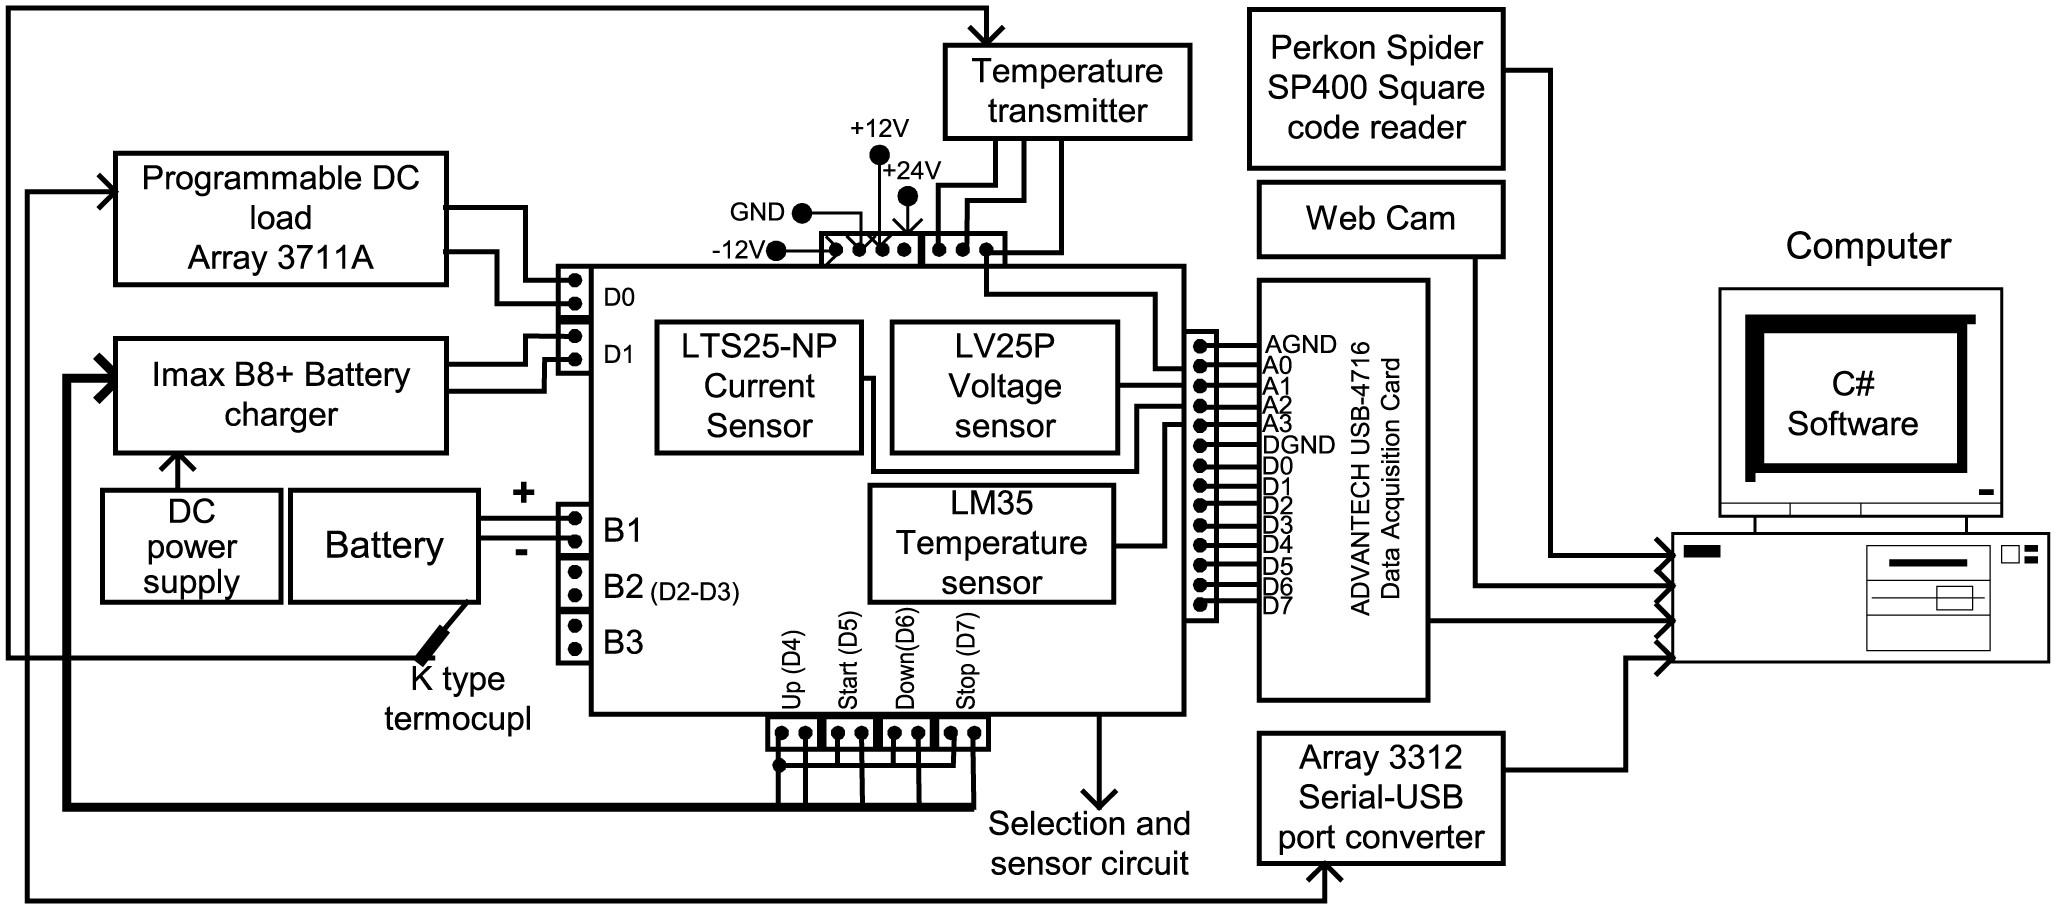
Block diagram of battery test rig
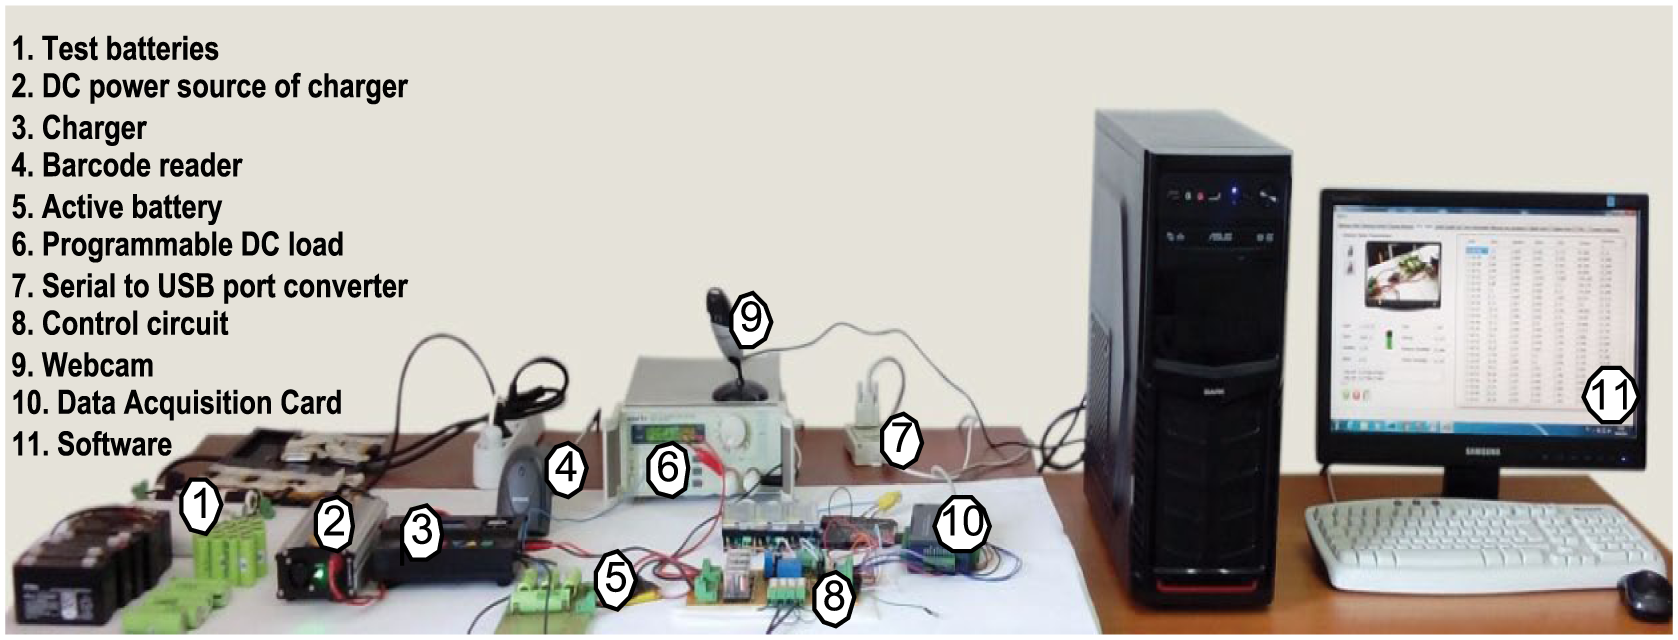
Experimental setup
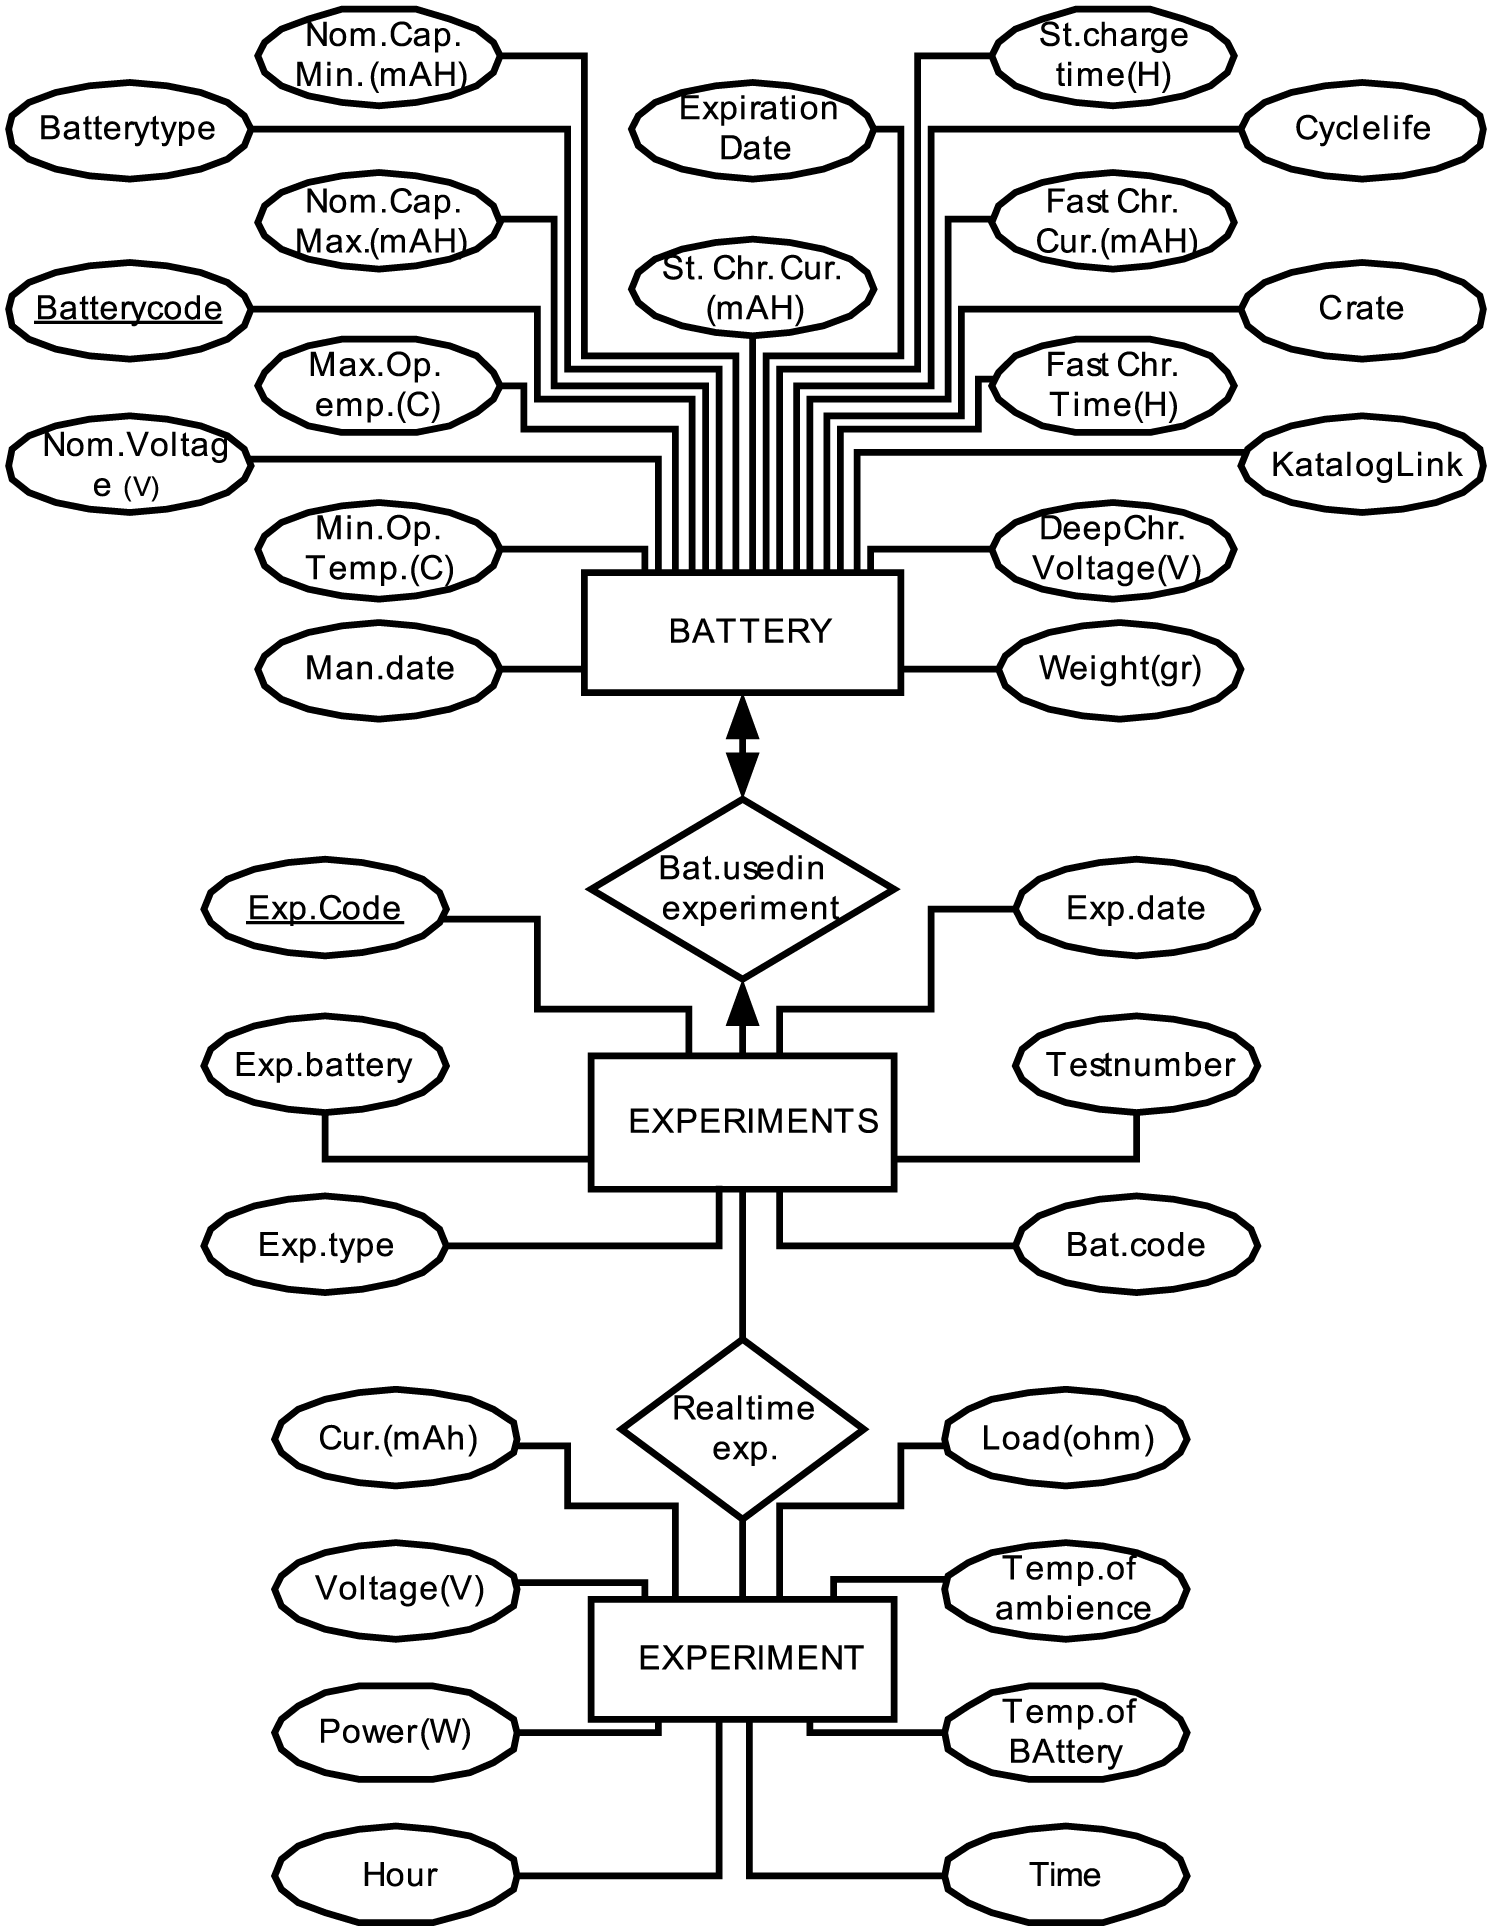
This study is verified with Li-Ion, lithium polymer (Li-Po), Pb, nickel cadmium (NiCd), and NiMH rechargeable batteries. The technical information of these batteries is given in Table 1 . The percentage of maximum difference with average Wh value is 4.15%. The capacities of the batteries are very similar. These values are saved to database while adding a new battery to the system. During experiment time, these values are compared to measurement values and it is controlled if the values reached critical limit values.
Technical properties of batteries used in experiments
Lithium-ion: Li-Ion; Li-Po: lithium polymer; Pb: lead acid; NiCd: nickel cadmium; NiMH: nickel metal hydride.
A. Database design
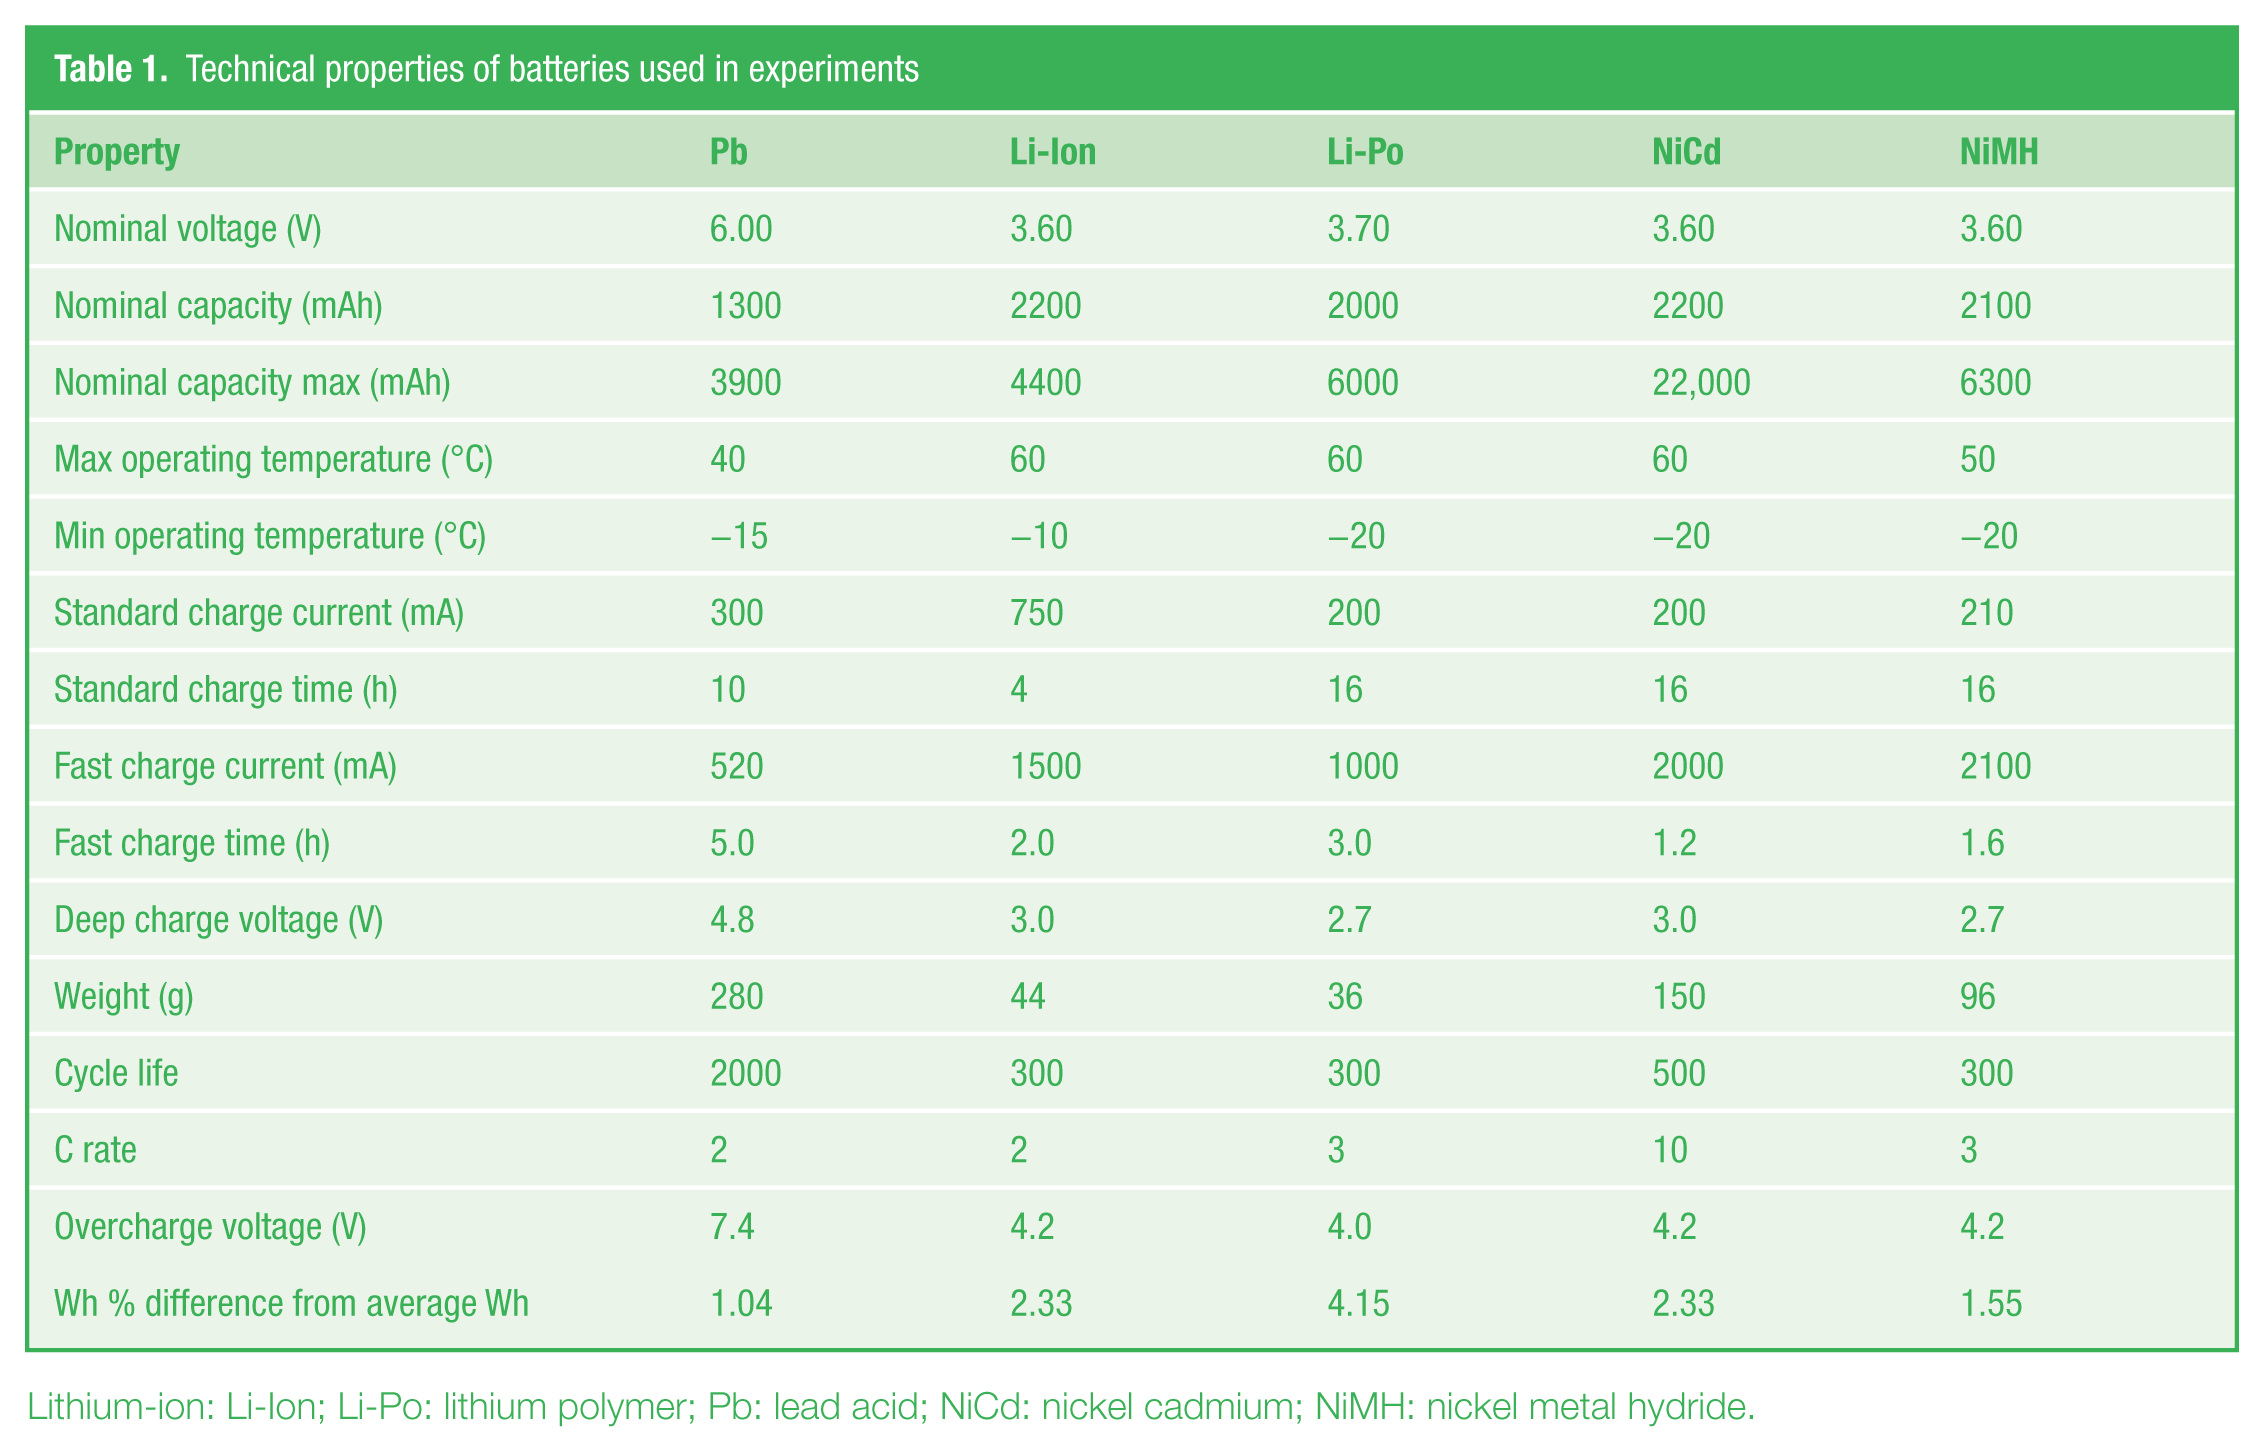
The data collected in experiments are saved to SQL Server database. There are three types of tables that are related to each other. The first table is called “batteries” and it includes datasheet information of each battery. In “batteries” table, there are battery code, battery type, nominal voltage (V), nominal capacity minimum (mAh), nominal capacity maximum (mAh), maximum operating temperature (°C), minimum operating temperature (°C), date of manufacture, expiration date, standard charge current (mAh), standard charge time (h), fast charge current (mAh), fast charge time (h), deep charge voltage (V), weight (g), service life (cycle number), C rate, and catalog link information. When a new battery is added to the system, a battery code is created. The second one is called “experiments” and it includes experiment date, experiment type, battery code, experiment code, experiment date, and experiment number information. The third type is collected data tables from real-time experiments. For each experiment, an experiment code (battery-code_experiment-type_date_experiment-number) is created. This code includes battery code, date, experiment type, and experiment number for that date. This code is also used as experiment table, and for each experiment a new table is created at database. The real-time measurement values are saved to these tables. The entity relationship of database is shown in Figure 3 . There is one-to-one relationship between “battery” and “experiments” tables, and there is one-to-many relationship between “experiments” and “experiment” table.
Entity relationship of database
B. User interface of battery data acquisition software
A software is developed using C# programming language to monitor conditions of batteries in real time and to save the measured data to database. The user interface of software has the following windows in tab format:
Add New Battery;
Battery List;
Experimental Adjustments;
Collect Data;
Real Time Graph;
View Data;
View Data Graphs;
About Software.
In Figure 4 , the tab to add new battery to the system is shown. In this tab, user enters the datasheet information of battery. Automatic battery code is created after choosing the battery type. After entering all data information, the data are saved to batteries table by pressing the Save icon. A square code is generated automatically. This code is glued to the battery and it includes battery code information. This makes it easier to determine the battery when too many batteries are used in experiments. Battery List tab is given in Figure 5 . In this tab, the batteries saved to database are listed. There is an Excel button in this tab, and if the user presses it, this table can be viewed in Excel.
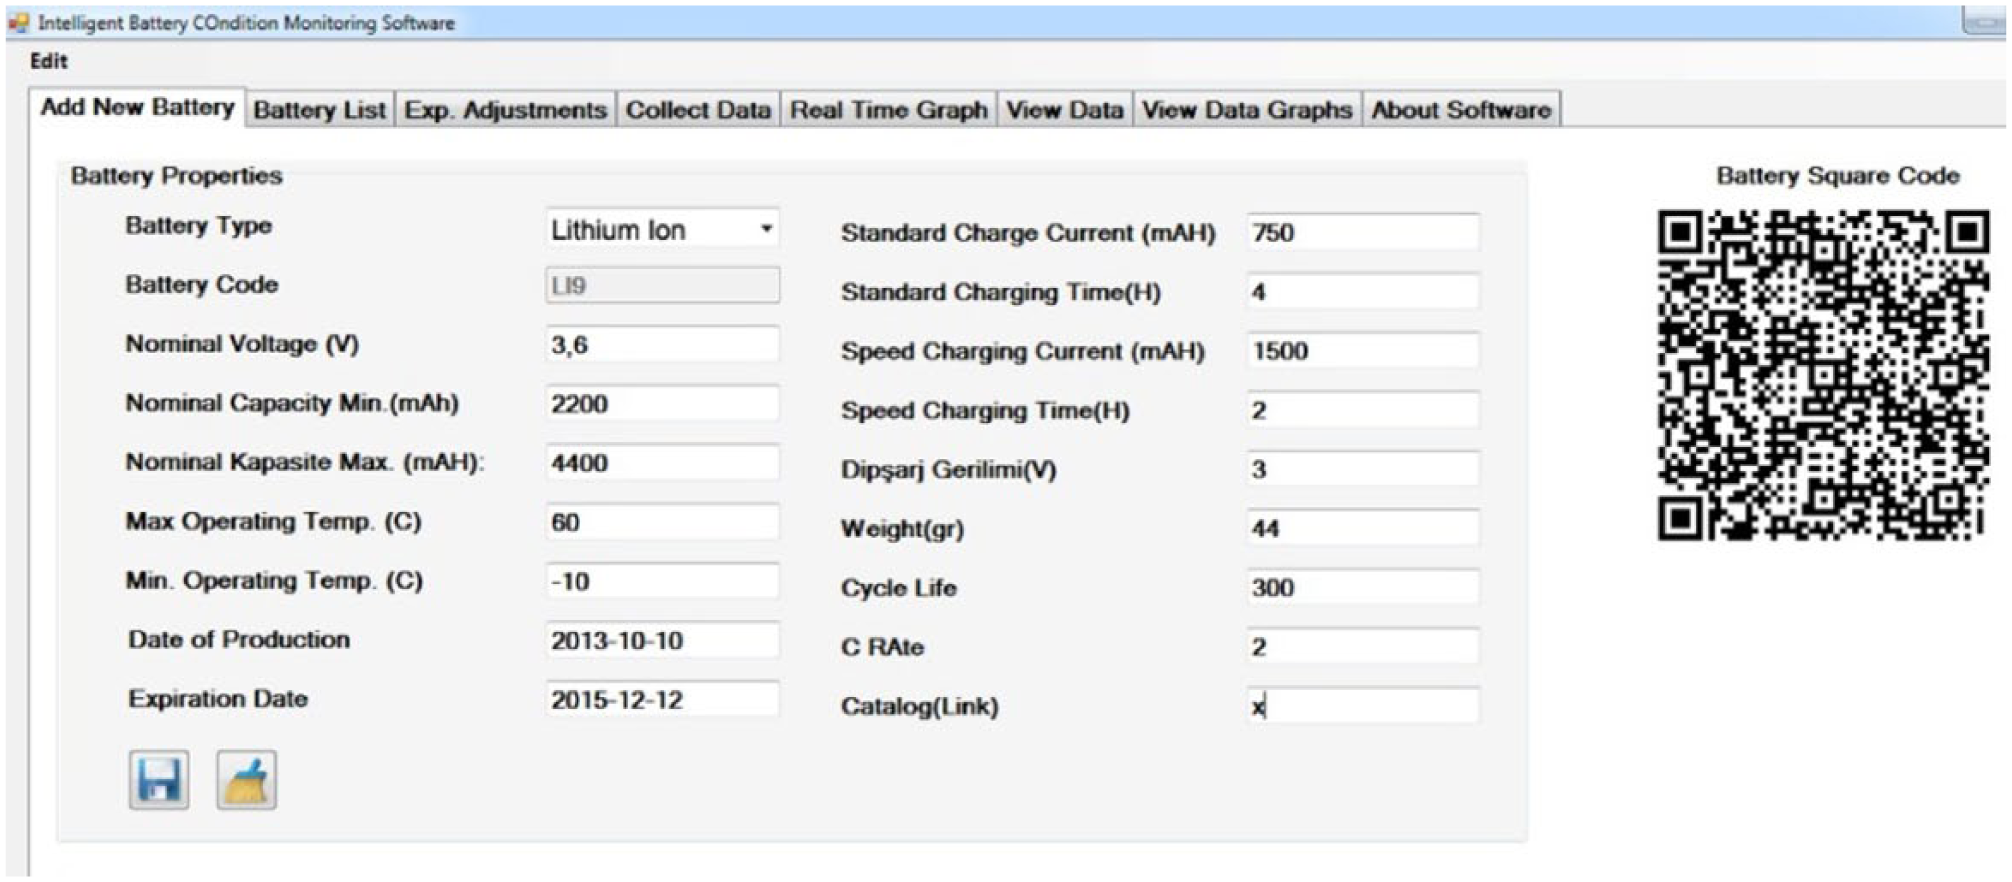
Add New Battery tab
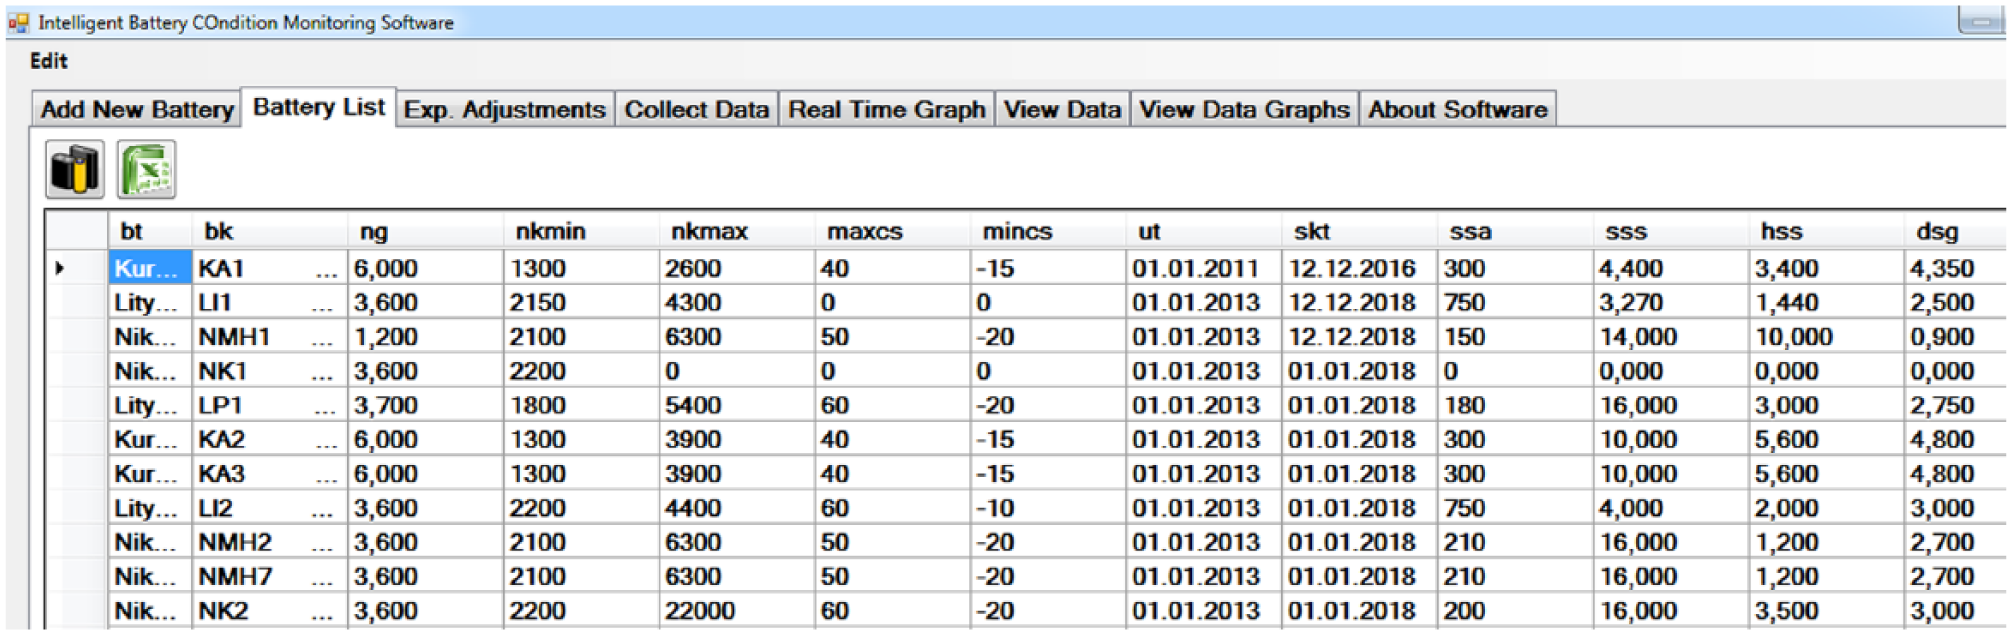
Battery List tab
In Figure 6 , Experimental Adjustments tab is shown. This page is very important for experiments. The tab is divided into three parts. In the first part, the battery that will be used in experiment is chosen. This can be done by reading the code of battery with square code reader or by manually typing. After determining the test battery, the battery the datasheet information is automatically generated and listed. Port of battery is determined manually according to the sensor and routing card. Sample time, that is, experiment time, is selected in this part. “Test No” is an automatic number and it represents the number of experiments of the test battery for that day. It automatically increments by 1 in each experiment. For a new day, it starts from 0 again. In the second part of this tab, user chooses the experiment type. User can select battery charge or battery discharge experiment. In the second part, user makes adjustment for a charge or discharge experiment. This experiment is carried out till the experiment time or till the battery reaches its limit values. If the user chose discharging battery, discharging method (constant current, constant load, constant power) and the discharge value are chosen. If the user chose charging battery, he adjusts the charger part. If this is a variable load experiment function of discharging current, load or power is selected. Ramp, sinus, step, and square wave are discharging functions. With the third part, the adjustments of charge–discharge loops are done. If the user wants to charge and discharge the battery for a number of times, he chooses the automatically charge and discharge selection and makes some adjustments to it. Automatically charge–discharge can be done from full charge to full discharge or it can be done for desired times, for example, it is possible to generate a cycle that charges the battery for x minutes and discharges the battery for y minutes. The discharge value can be adjustable. When all the adjustments are completed in the Experimental Adjustments tab and user presses the confirm button, an experiment code is generated automatically. A table containing the code is generated in the database, and the measurement data are saved to this table.
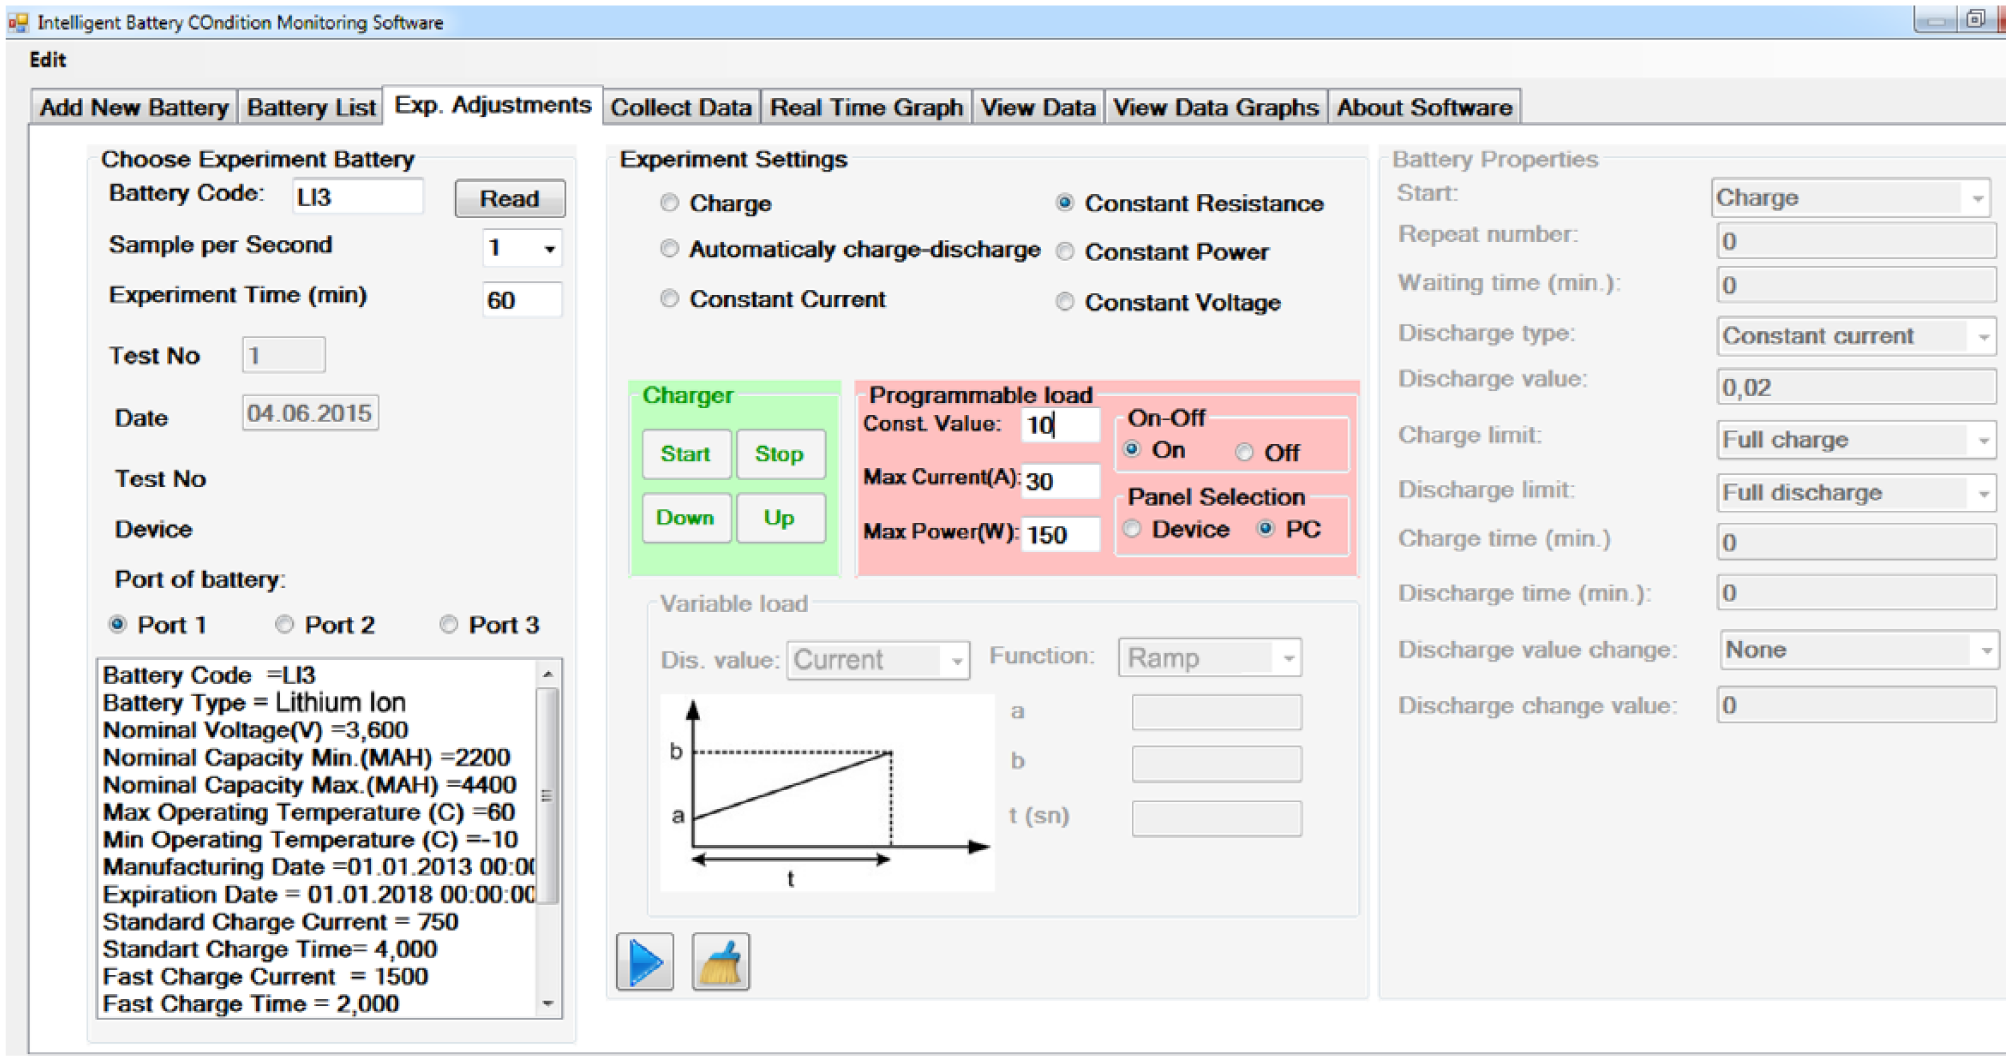
Experimental Adjustments tab
Data Collection tab is used to start the experiment after setting the experimental adjustments. This tab is shown in Figure 7 . The experiment starts by pressing the button and finishes if the experiment time ends, if the OFF button is pressed, or if the battery reaches its limit values. The condition of battery is shown in this window. The real-time measurement values and datasheet values are compared to determine the condition and capacity test of battery. The datasheet values are taken from database. Normal values, over-voltage, over-current, over-temperature, under-operating-temperature, and over-loaded conditions are shown. During experimental real time, battery values are shown and saved. These values are system clock, experiment time (s), voltage (V), current (A), power (W), load (Ω), battery temperature (°C), and environment temperature (°C). Excel button is used to view data in Excel page. User can view real-time curves of parameters via the tab named “Real Time Graph.” This tab is shown in Figure 8 . User can select parameters to graph separately or on the same and save the figures as image.
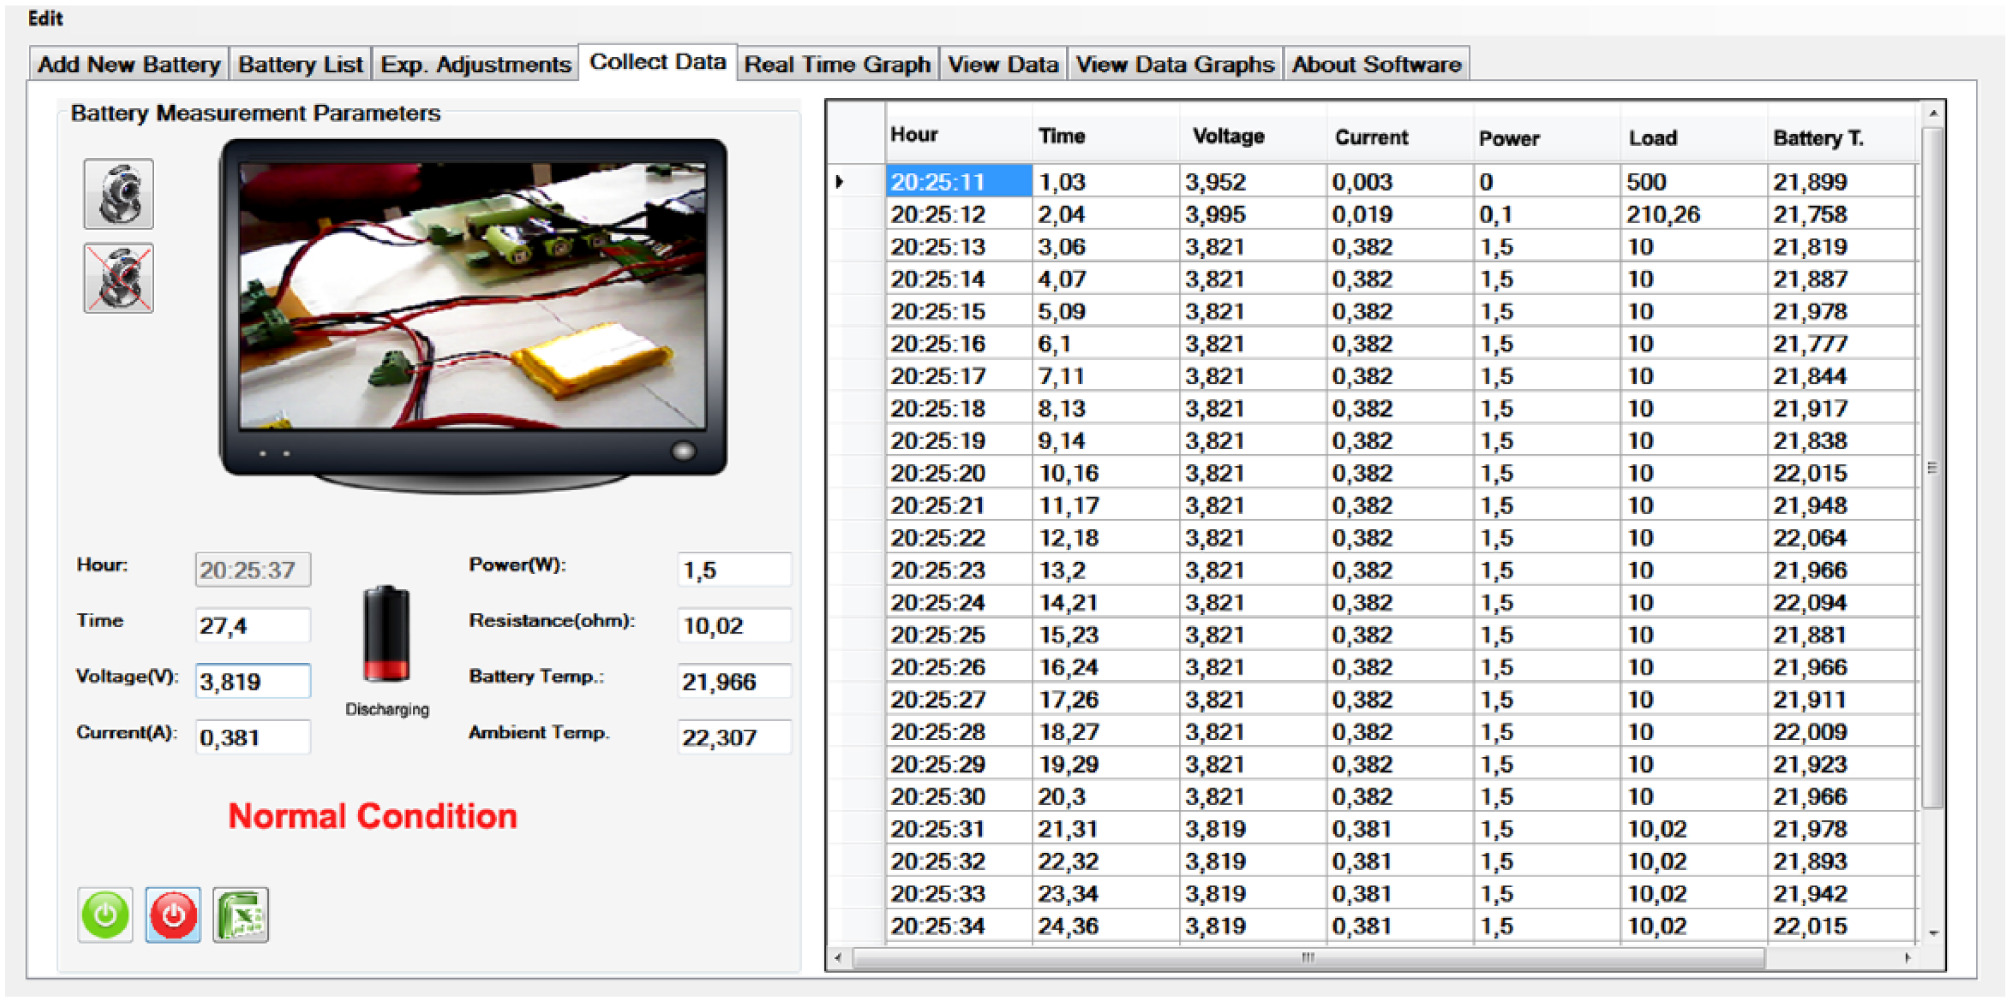
Collect Data tab
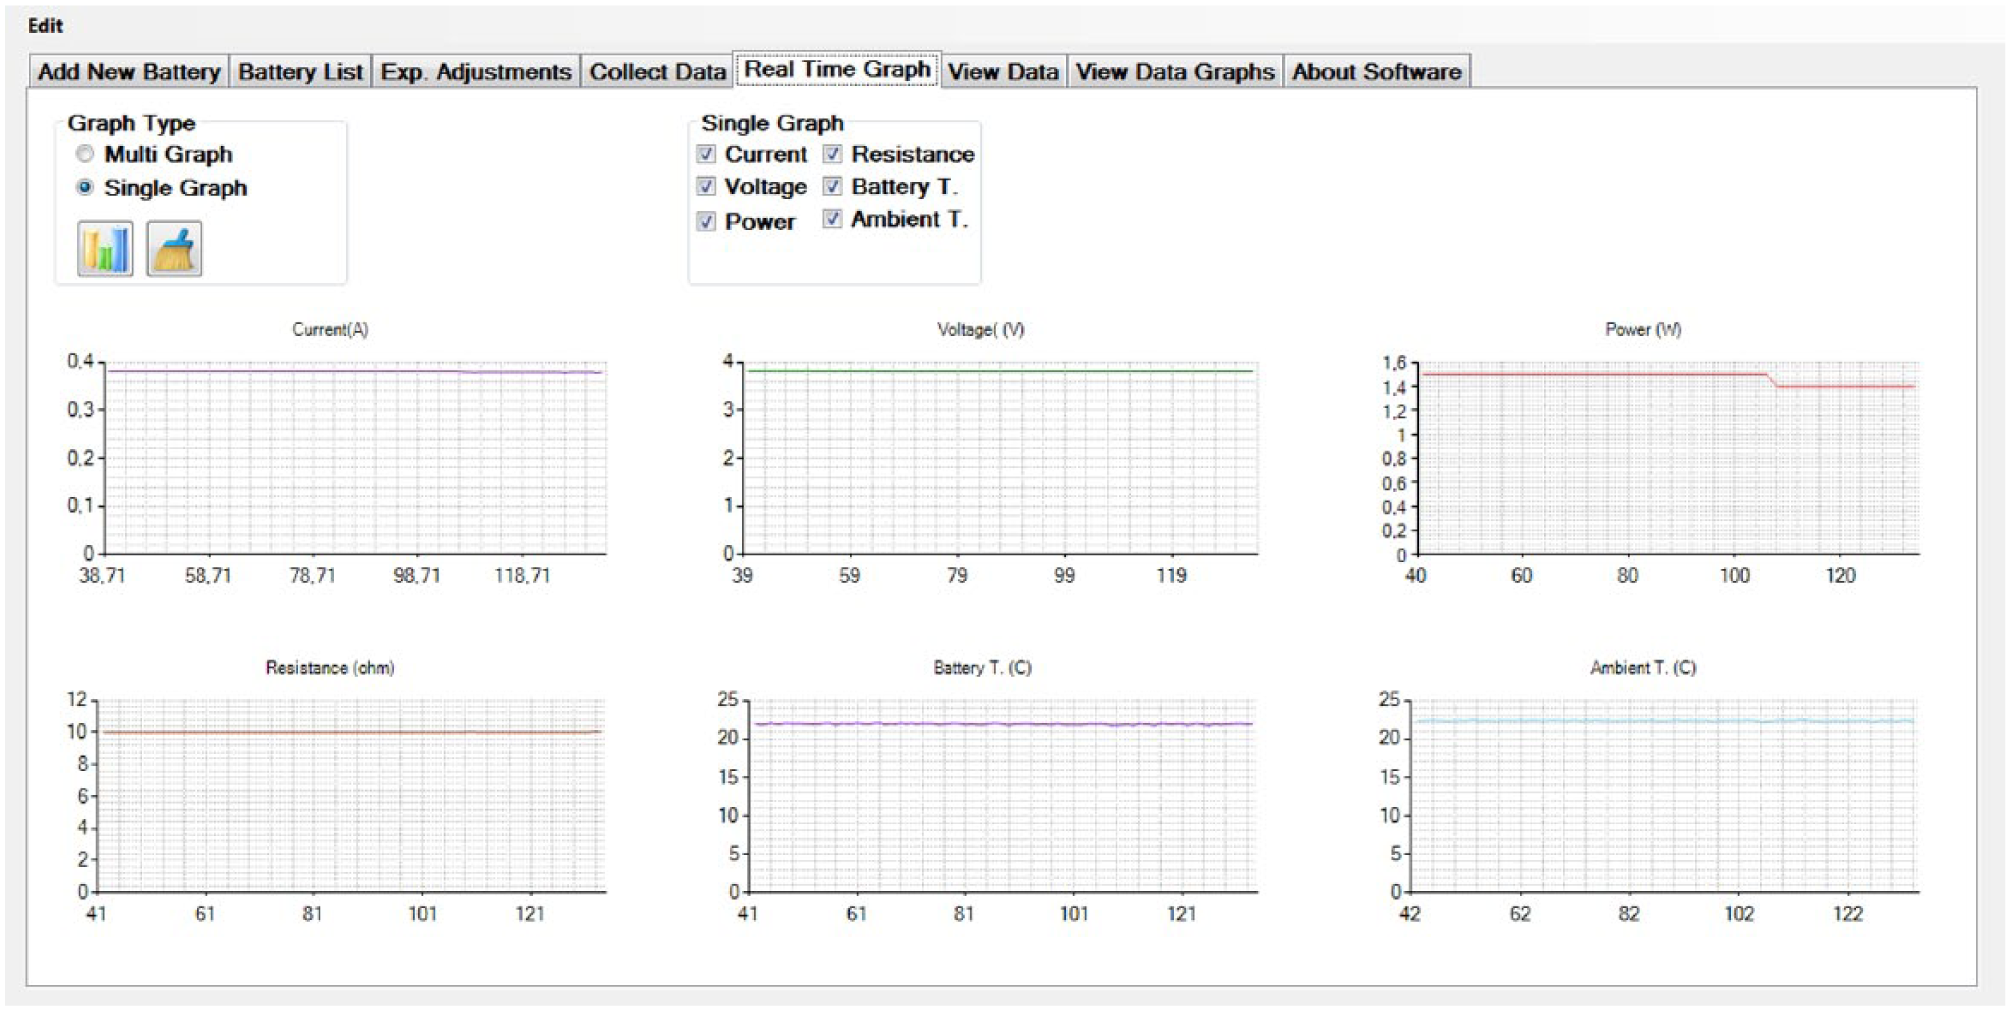
Real Time Graph tab
View Data tab is used to show saved data in database ( Figure 9 ). To view data, battery code, experiment type, experiment date, and test number are chosen and experiment code is generated to find the experiment in database. After confirming the experiment, data come to a table. The curves of these data can be drawn again in a tab named “View Data Graphs” ( Figure 10 ). The usage of this tab is the same as Figure 8 .
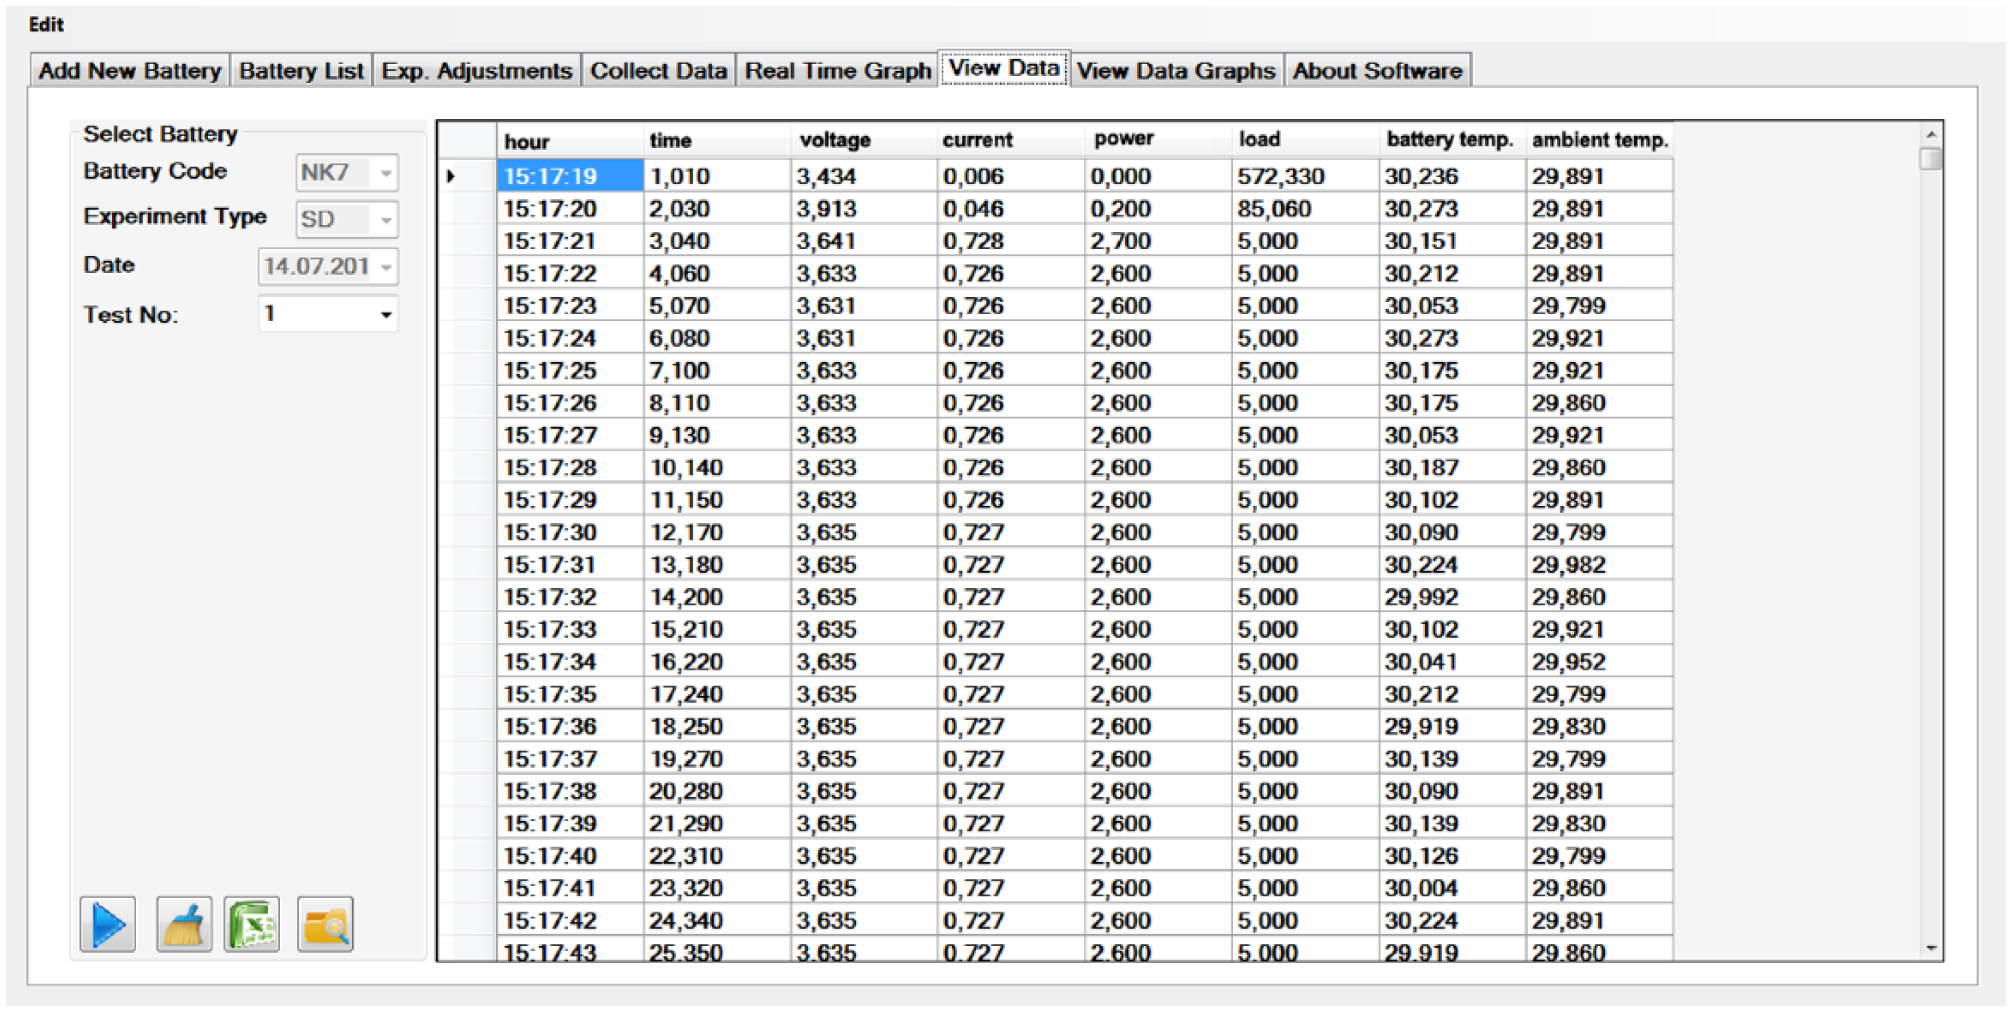
View Data tab
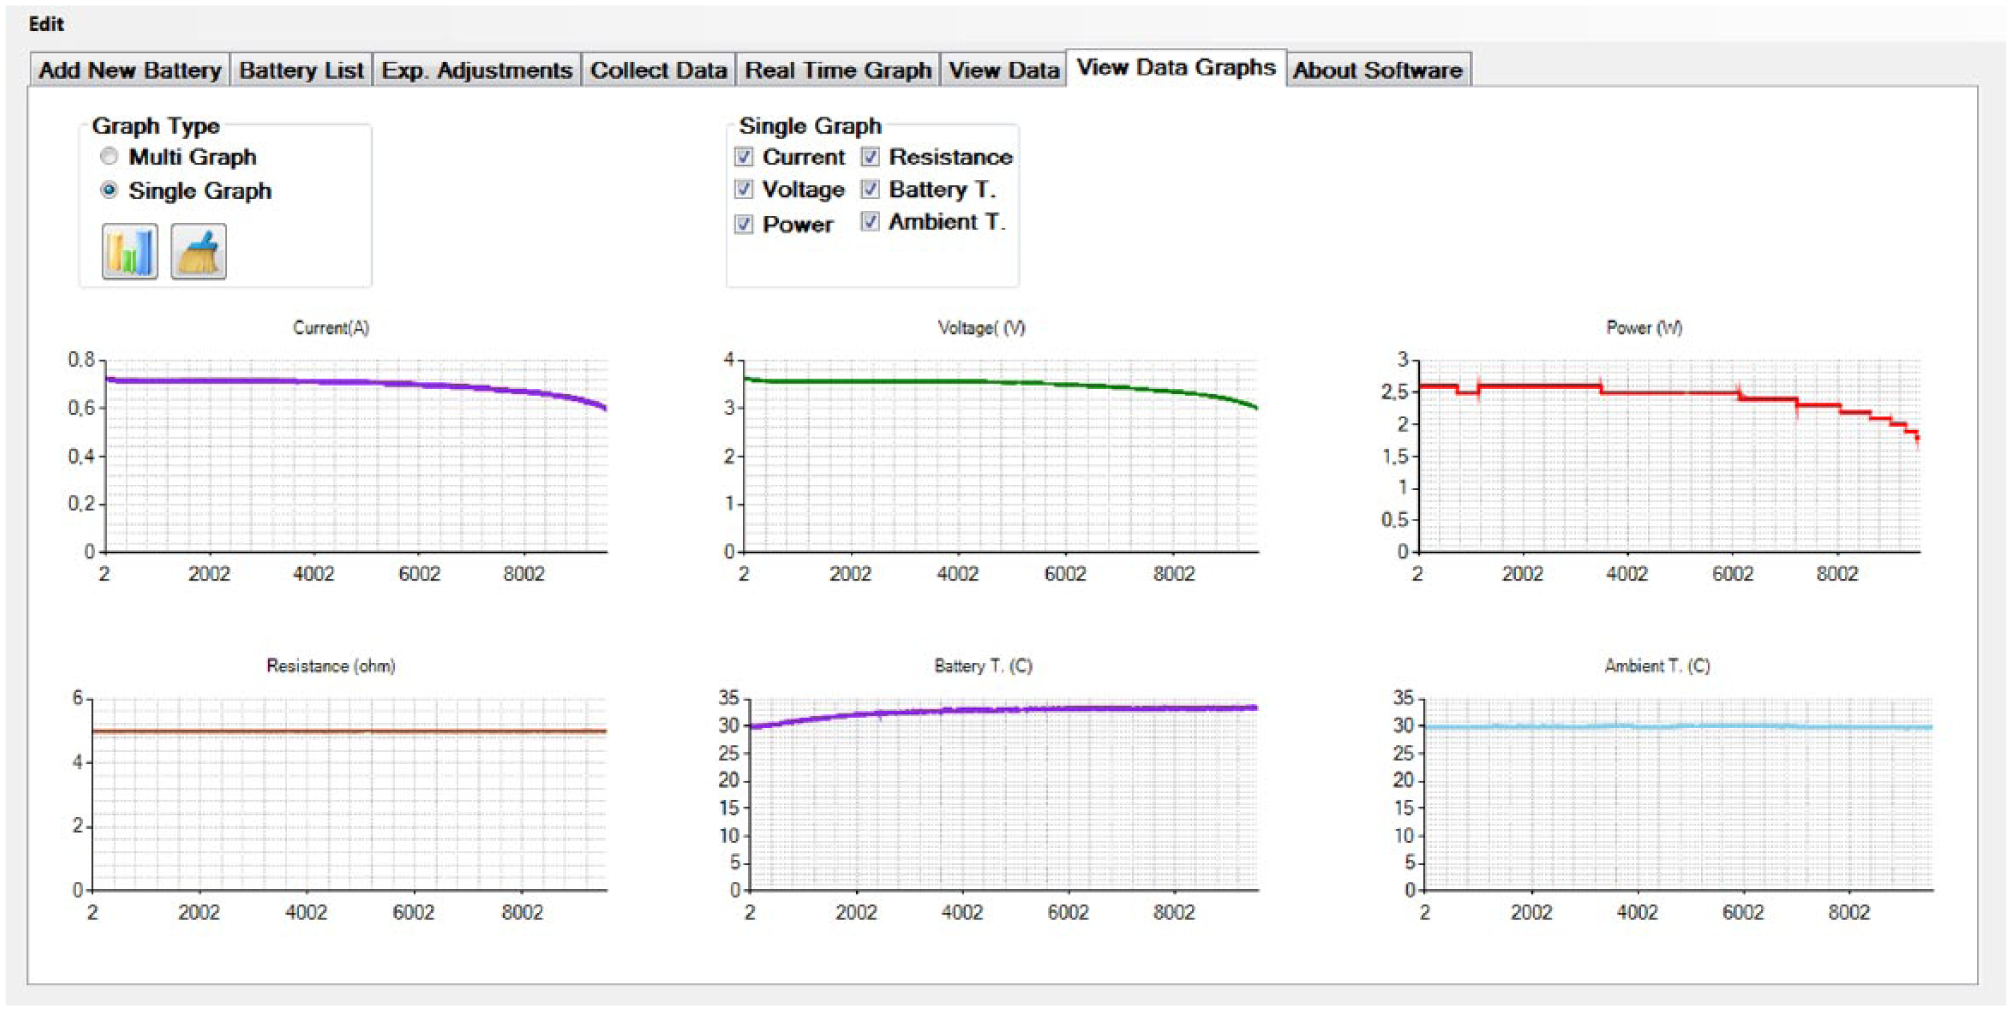
View Data Graphs tab
In Figure 10 , the graphs of discharge test for NiCd battery are given. This is a 5-Ω constant load discharge test. Time-dependent current, voltage, power, load, battery temperature, and ambient temperature are shown. The test is complete when the battery reaches the discharge voltage value.
III. Conclusion
In this study, we are monitoring the conditions of the batteries during charging and discharging under different electrical conditions via a special software designed by us. The measured data are saved to the database. Over-voltage, over-current, over-temperature, under-operating-temperature, and over-loaded errors can be diagnosed in real time. The software is compatible with all kinds of rechargeable batteries whose nominal voltage is within 0–10 V and discharge current is between 0 and 30 A. The software is suitable to develop. The database of system can be used to determine the SOC and SOH of battery and determine the best charging and discharging type. The software and the database design of this study can be a model for researchers who might perform electrical experiments on batteries.
The main properties of this study are listed below:
The current, voltage, power, temperature of battery load, and ambient temperature parameters can be monitored online.
Measurements are shown in tables and charts in real time.
All measurement data are systematically saved to database.
Past measurements can be listed and their graphics can be drawn.
Sample time of test and duration of test are adjustable.
Battery discharge can be done with constant load, constant current, or constant power with adjusted value. In addition to constant discharge, ramp, sinusoidal, step, or square wave discharge functions can be used.
All measurements are shown in tables and charts.
Battery can be automatically charged through smart battery charger.
Battery can be inserted into charge–discharge loop safely because during the experiments the battery is controlled if it achieves critical limit values of voltage, current, and temperature. If one of these values is achieved, the software closes the system automatically and generates alarms. The rest periods between charging and discharging are adjustable.
This system can be converted to a prototype system using embedded equipment.
Footnotes
Funding
This study was supported by Karabük University within the scope of Scientific Research Projects with KBÜ-BAP-13/1-DR-005 code.