
Abstract
In the health monitoring of large metal structure, the traditional strain measurement systems with wired and bulky instruments face the challenges of harsh environment, changing network topology and limited energy supply. To meet these requirements and improve the efficiency, a portable wireless strain monitoring system combined with wireless sensor network technology and portable design has been developed in this paper. Consisting of handheld coordinator, router and sensor, this novel system takes miniaturization, portability and low-power design as core capabilities in both software and hardware design. With tests in laboratory environment, its time domain response and power consumption have been analyzed to verify its performance and efficiency. Additionally, after calibration on an equal strength cantilever, comparative tests on quayside cranes have been explored to show that this system has an equivalent accuracy compared with the traditional measurement system. However, it improves the work efficiency and can meet the serious challenges within health monitoring of large metal structure.
I. Introduction
Since the large metal structures (LMS) are common and assume significant security responsibility, their safety and reliability are highly valued in the entire service period. With high accuracy and stability, the traditional wired strain measurement systems with gage can monitor the distribution and expansion of stress on LMS and can prevent the occurrence of devastating structural damage. 1 However, restricted by bulky instrument, burdensome wiring work and harsh working environment, this testing method requires much resource to get sufficient measuring points and stable connection. Therefore, it becomes a heavy economic burden and cannot meet with the growing demands of enterprises to improve process efficiencies and achieve financial objectives in today’s competitive industry marketplace. 2
The wireless sensor network (WSN) technology has been employed in the structural health monitoring.2 –4 The major advantages lie in low-cost, intelligent-networking and high scalability. So far, a lot of work have been focused on the research and practice of WSN monitoring dedicated structure.5 –7 However, the ever-changing testing requirements caused by dynamic topology, harsh environment and limited energy supply still make the long-term stable operation of WSN for structural health monitoring a big challenge. 2 There are some studies focused on these problems. First, manufacturing low-power sensor, designing energy efficient network algorithms and using energy harvesting technology are the main ways to maximize the life cycle of WSN.8 –12 Second, standard wireless communication technology has made great progress, such as IEEE.802.15.4/ZigBee protocol and Bluetooth protocol.13,14 Using these standardized wireless communication protocols, the development effort and cycle of wireless structural health monitoring system can be greatly reduced.
However, the problems in structural health monitoring of LMS still have not been settled. In this paper, some new strategies have been explored in the design and implementation of wireless health monitoring system for LMS. A portable wireless strain monitoring system (PWSMS) taking miniaturization, portability and low-power design as core capabilities has been developed. Based on ZigBee protocol, which has excellent low-power performance, self-organizing feature, affordable network coverage and large node capacity, it can solve the problem of large-scale deployment and dynamic topology. Compared with previous work in wireless strain monitoring systems,7,15,16 this system sheds lights on the issue of accuracy and portability. Additionally, it provides excellent low-power and high-efficiency performances from both software and hardware design.
II. Overview of PWSMS
In PWSMS, a sensor consists of a strain conditioning circuit (SCC), a power supply circuit (PSC) and a ZigBee wireless communication module. 17 Compared with sensor, the router has no SCC. Both the router and the sensor are controlled by CC2530. Handheld coordinator, controlled by MSP430F149, comprises ZigBee wireless communication module, PSC, universal asynchronous receiver/transmitter (UART), electrically erasable programmable read-only memory (EEPROM) and liquid crystal display (LCD). Three modules use the same ZigBee module based on CC2530. The block diagram of PWSMS is shown in Figure 1 .
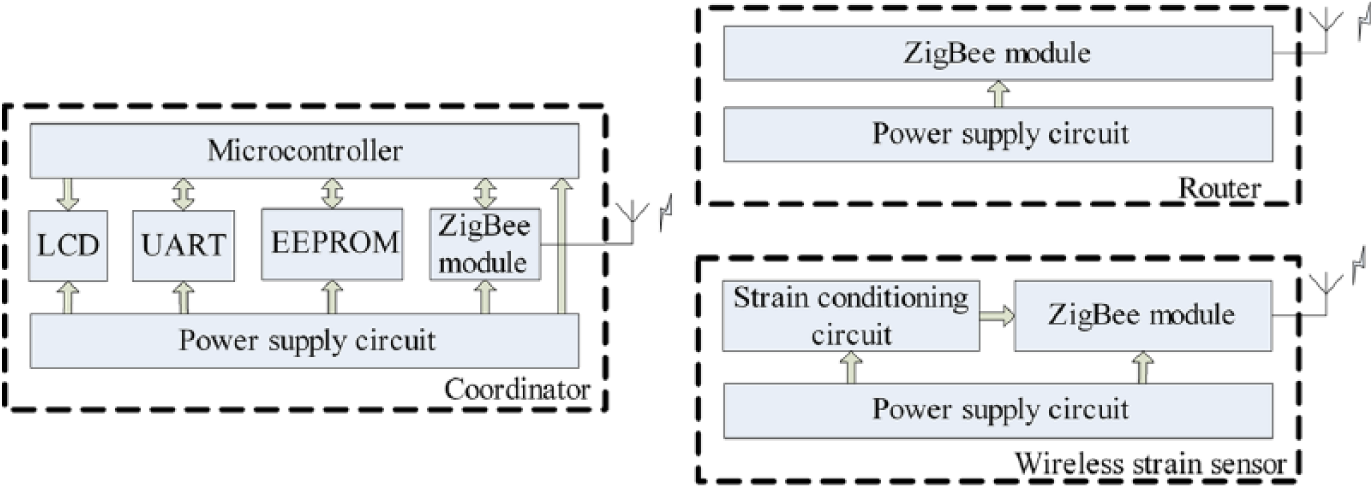
Block diagram of PWSMS (coordinator, router and wireless strain sensor)
The mass of coordinator, router and sensor is 255, 245 and 250 g, respectively. The dimension of sensor is L64 mm × W64 mm × H60 mm. The shell of handheld coordinator is made of plastic and that of router and sensor is made of aluminum alloy with good structural strength and electromechanical impedance (EMI) protection. Router and sensor can be installed on the work surface by magnet or screw. All PWSMS modules are powered by rechargeable battery, which avoids frequent battery replacement and is environment friendly. The physical implement of PWSMS is shown in Figure 2 .
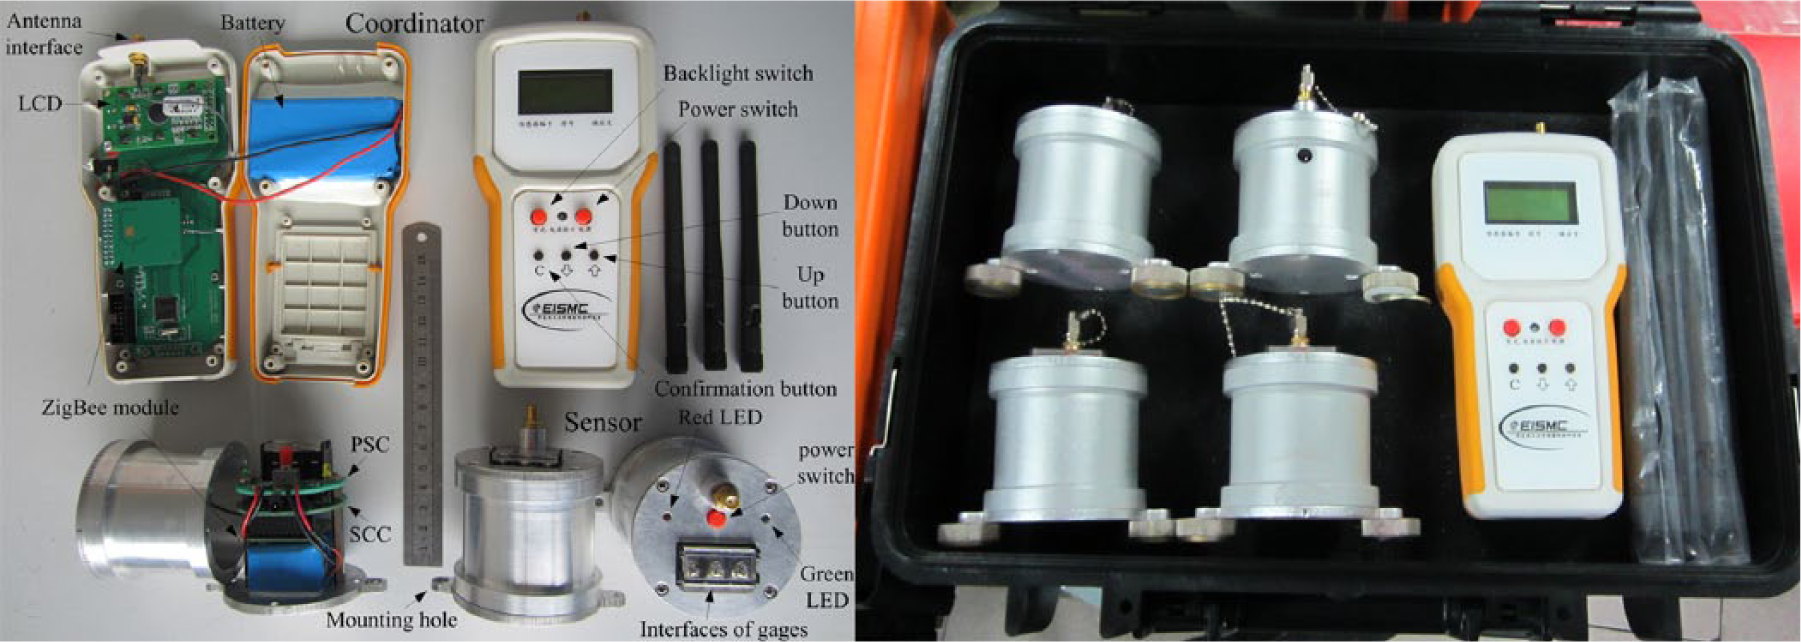
Physical implement of PWSMS
III. Design and Implementation of PWSMS
This section presents the design strategies of PWSMS and analyzes its performance comprehensively. Since the sensor and the router have the same PSC and ZigBee module, the design and implementation of router are not presented here.
A. Wireless strain sensor
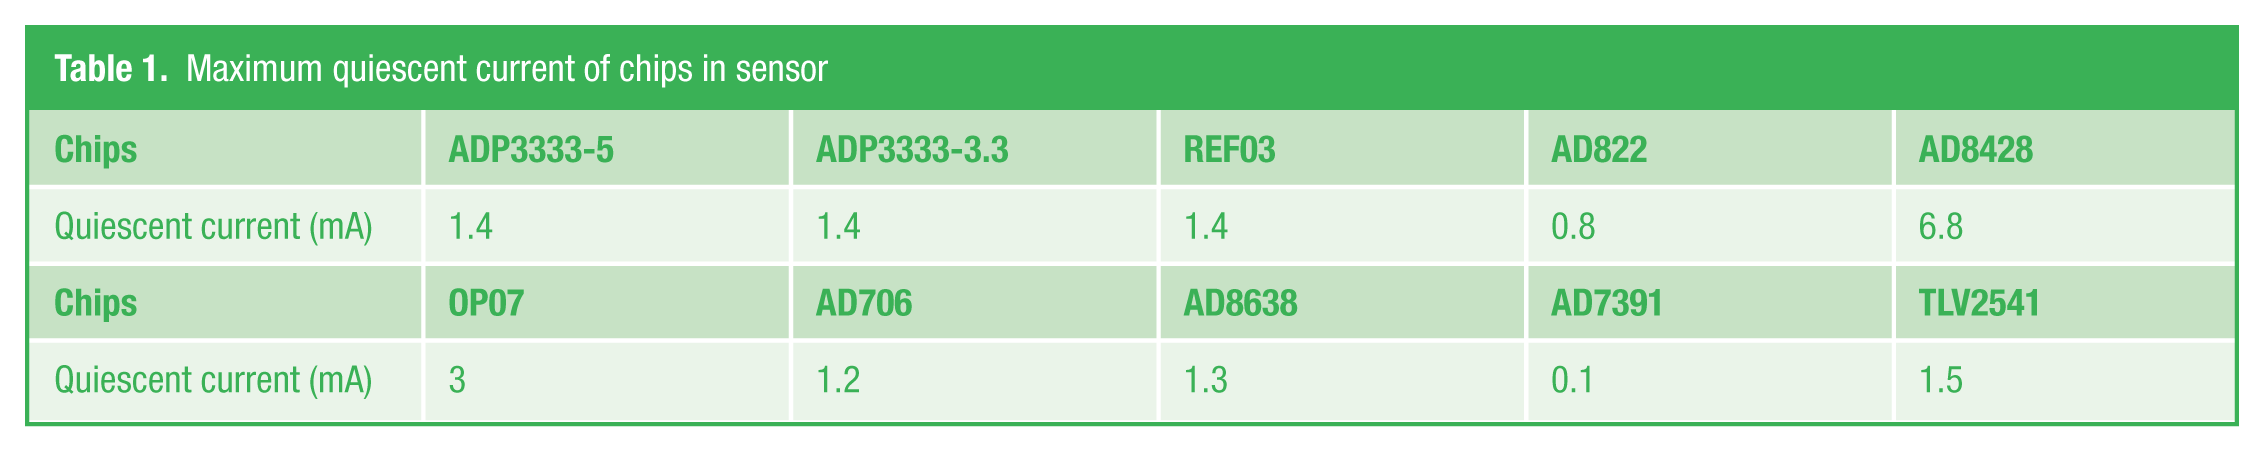
The sensor is responsible for the processing, collection and uploading of strain signal. It has the largest amount in PWSMS and is the biggest energy-consuming module. 18 The ZigBee wireless communication module controls the power supply for SCC through a MOSFET switch. With the premise of excellent accuracy and stability, low-power chips are employed in sensor, and their maximum quiescent currents are shown in Table 1 .
Maximum quiescent current of chips in sensor
SCC
The SCC provides power supply uAC for a Wheatstone bridge, amplifies and adjusts the differential signal uBD of the bridge output, and outputs the final signal to the analog to digital converter TLV2541 (see Figure 3 ). Two external strain gages Ra and Rb and two built-in resistors Rc and Rd, with the same resistance R, constitute the Wheatstone bridge. By buffering the precision reference voltage of REF03, AD822 provides precision reference voltages ±2.5 V for the bridge, which makes the common-mode voltage in uB and uD close to 0 V. As a result, SCC has lower common-mode noise compared with single power supply.7,15,16 R1 and R16 introduce a constant current source for the bridge. R2 and R15 are used to adjust the bridge current. To reduce the initial bridge bias and drift, the accuracy of all above-mentioned built-in resistors is 0.1%, and their temperature drift is 5 ppm. The sensitivity factor of two strain gauges, one sensing strain and another compensating temperature drift, is K. When strain value is ε, the change resistance of strain gauge is ΔR, and uBD = uAC[(R/2R) − (R/(2R + ΔR))]. Furthermore, ΔR/R = Kε. Therefore, uBD = uAC[1/((4/Kε) + 2)].
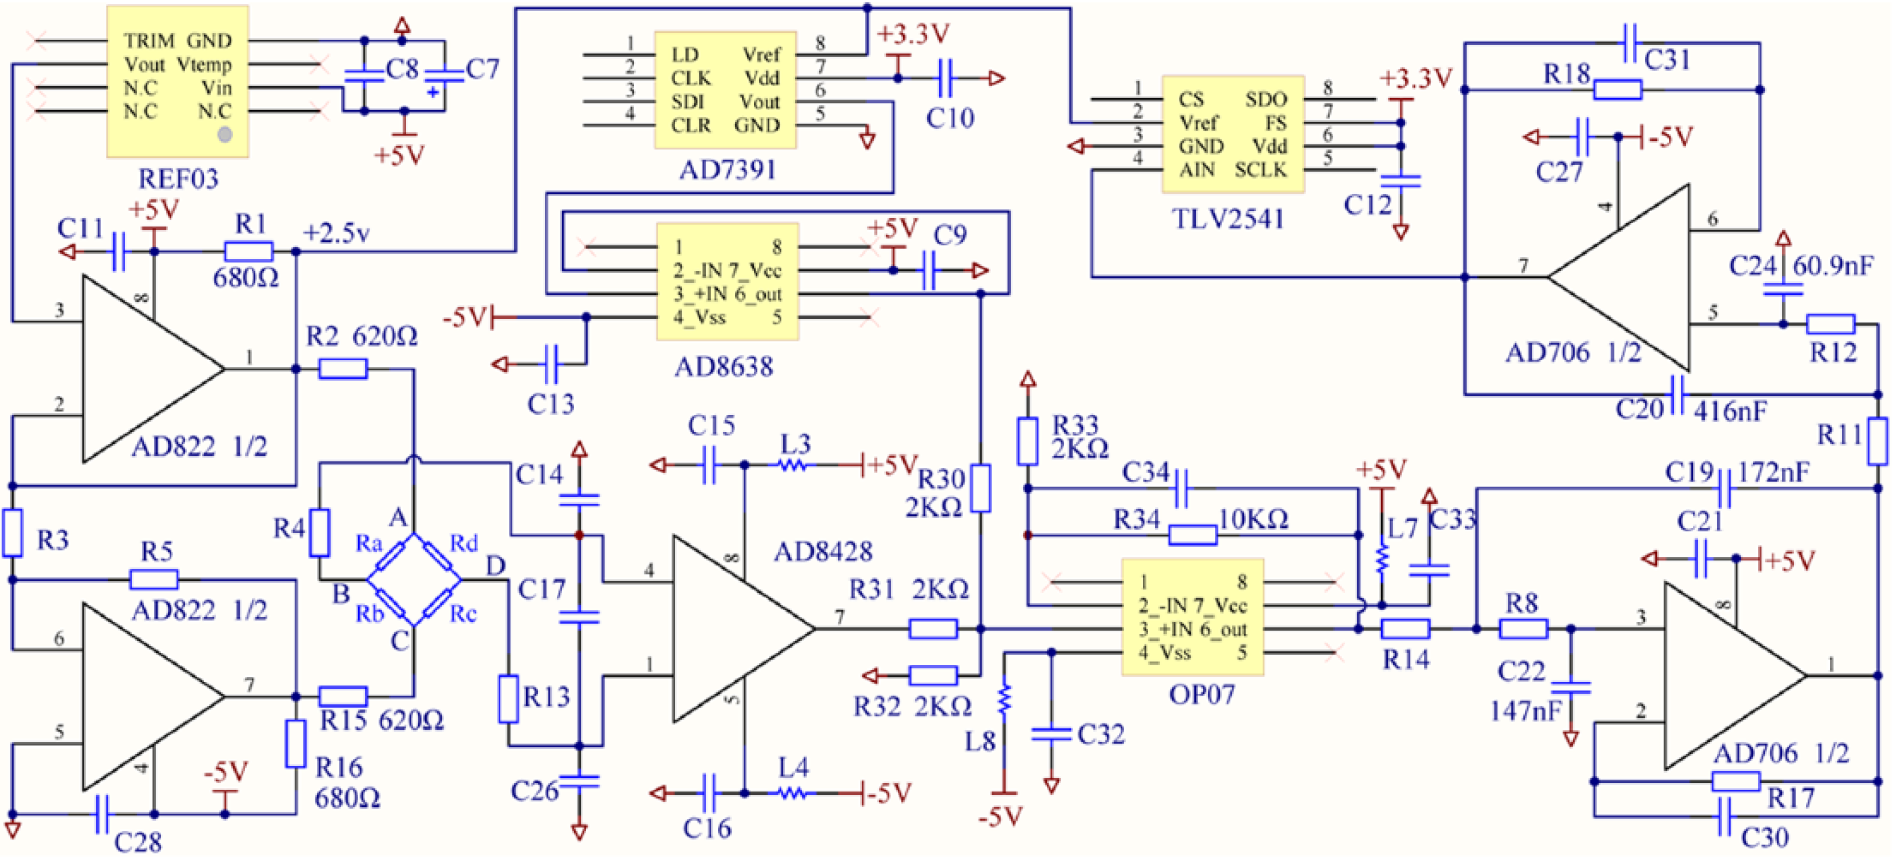
Strain conditioning circuit
With excellent DC performance, AD8428 amplifies the difference between uB and uD and gets GuBD. G, fixed to 2000, is the differential amplification factor of AD8428. The aluminum shell can shield the radio frequency interference (RFI) in the test environment, but the external wire of gauges can still introduces RFI, and AD8428 has no CMR capability within the radio frequency (RF) band. To effectively filter RFI, a RFI filter, composed of R4, R13, C14, C17 and C26, is designed in the front of AD8428. 19
The auto-zero capability can greatly improve the efficiency of test. First, the reference voltage of TLV2541 is 2.5 V. To make good use of the effective range of TLV2541, the theoretical output zero of SCC is adjusted to half of the TLV2541 reference voltage (see Figure 4 ). Buffered by AD8638, AD7391 outputs 0 V before the start of zeroing process to avoid impact on SCC initial deviation, and ti will be detailed in Section V.
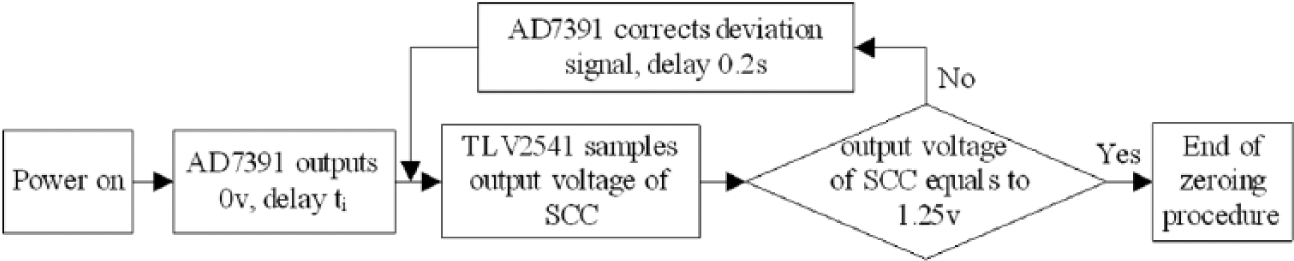
Flow chart of zeroing process
After zeroing process, the output signal of OP07 contains lots of noise, particularly ranging from 0 Hz to 1 kHz, where the maximum noise amplitude is 60 mVpp (see Figure 5(a) ). A low-pass filter, consisting of AD706, precision resistors and capacitors, has been designed to inhibit the noise (see Figure 3 ). R8, R11, R12 and R14 have the same resistance Rf. Analyzed by a digital signal analyzer, the cutoff frequency of the filter is 9.8, 19 and 50 Hz, respectively, when the resistance of Rf is 100, 50 and 20 kΩ correspondingly. Considering the time domain response of SCC, which will be detailed in Section V, Rf = 50 kΩ has been selected. As a result, the SCC noise is reduced to 2 mVpp avoiding the effects of complex filtering algorithms to sensor response (see Figure 5(b) ). 15
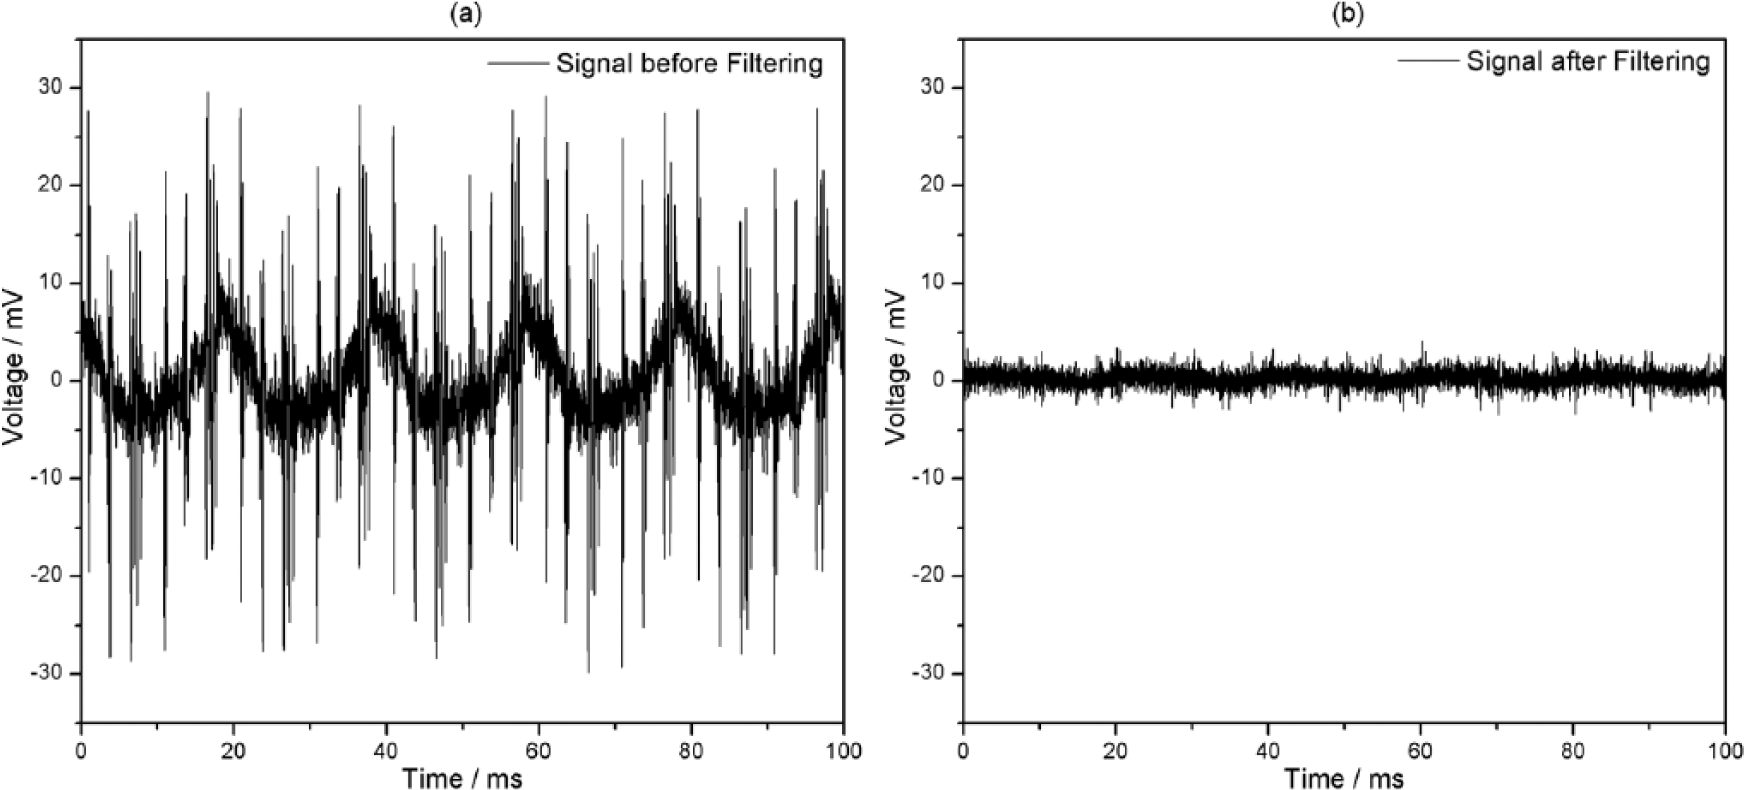
(a) Output noise of SCC before filtering. (b) Output noise of SCC after filtering
Design strategies of PSC
The sensor is powered by two lithium batteries, which can supply SCC with positive and negative voltage swing. It was found that the battery, providing positive voltage, had much more power consumption. Therefore, CC2530 monitors its voltage every 5 s. When the battery capacity is below 30%, CC2530 will close green light emitting diode (LED) and lit red LED to prompt user to charge the sensor. The current consumption of CC2530 is about 40 mA in radio transmitting and receiving state, but it is only 1–2 µA in sleep mode. Therefore, the power supply voltage will fluctuate when switching between the two work modes. When the sensor uploads data to coordinator in a frequency of 1.3 Hz, the fluctuation of power supply is shown in Figure 6(a) . With the introduction of effective filtering and energy storage capacitors, the noise drops to 10 mVpp or less (see Figure 6(b) ). To further inhibit noise conducted from PSC, chips with excellent power supply noise rejection are chosen, and LC filters, composed by inductances and capacitors, have been designed on the power supply pin of chips.
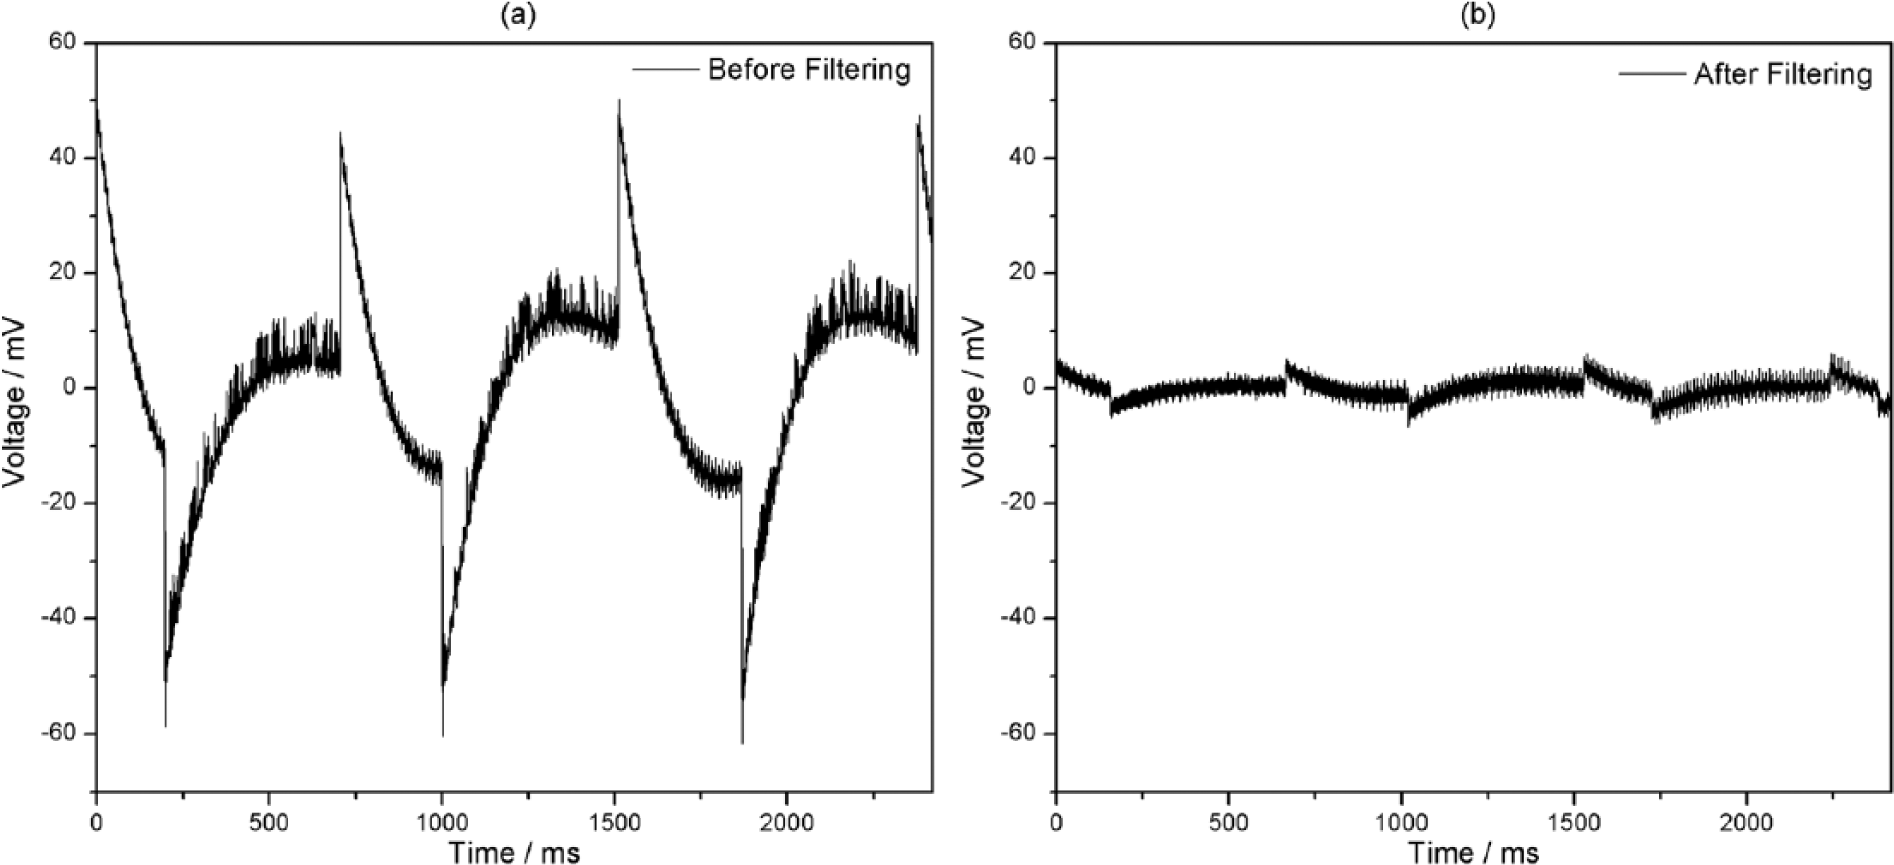
(a) The fluctuation of power supply before filtering. (b) The fluctuation of power supply after filtering
ZigBee wireless communication module
The design and manufacture of ZigBee module are completed based on the information provided by Texas Instruments. 20 In order to stabilize supply voltage when working alternately in sleep and activity mode, independent linear regulator ADP3333-3.3 and energy storage capacitor are involved in the module. Besides, to prevent RFI from ZigBee module, a copper cover for electromagnetic shield is designed. After testing, the stable communication radius of this module in open areas can reach 100 m.
B. Coordinator
In the handheld coordinator, three multi-function buttons are connected with MSP430F149, and their functions are shown in Table 2 . MSP430F149 and CC2530 are connected with their four general-purpose ports. External EEPROM is Microchip 25AA1024. The coordinator employs two self-locking switches: a power switch and a LCD backlight switch for testing in dark environment.
Menu of buttons
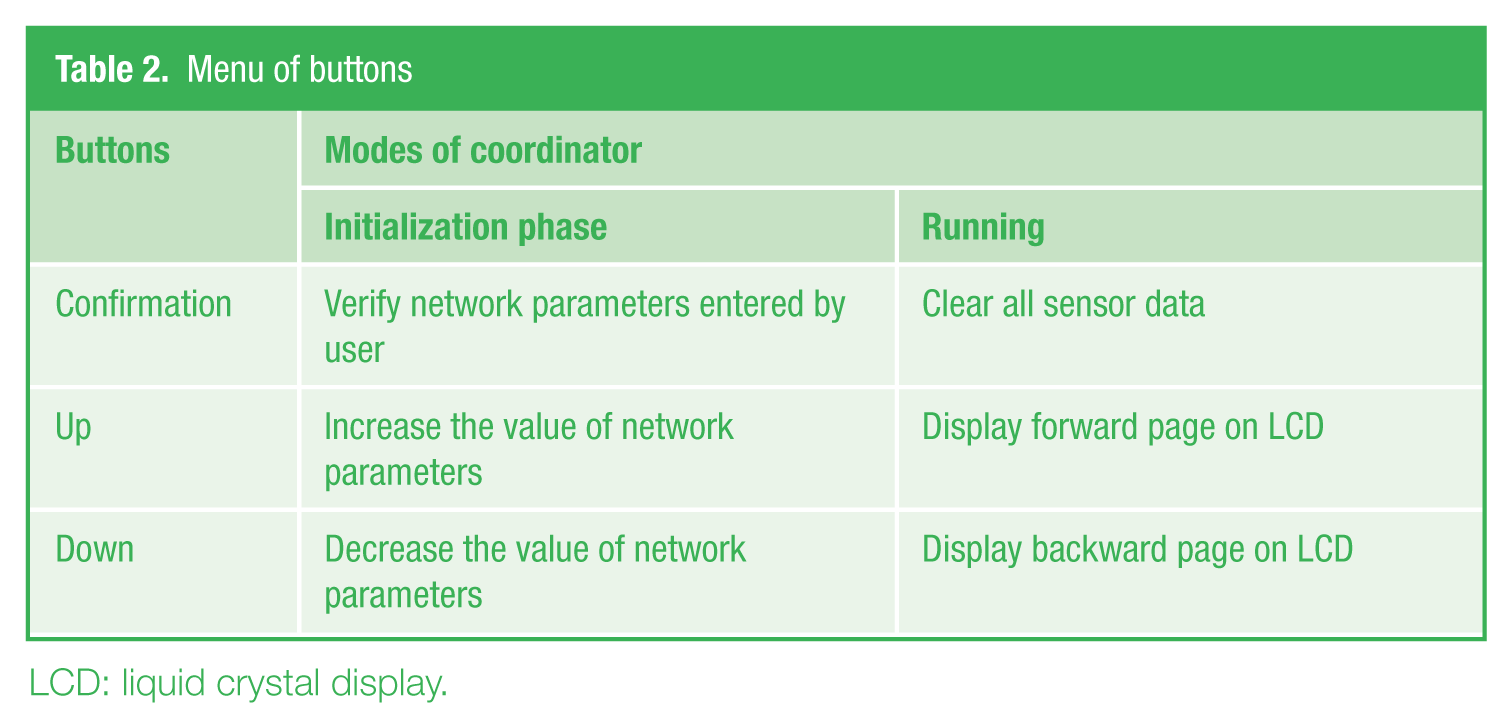
LCD: liquid crystal display.
IV. Network Architecture
In the PWSMS, coordinator, routers and sensors form a mesh topology. The coordinator is responsible for the establishment and operation of the network. As the relay of communication, the router ensures the quality of communication and expands network coverage. After joining a ZigBee network, the sensor begins signal acquisition and transmission according to the network parameters translated from coordinator. The coordinator is unique, and the number of routers and sensors is determined by measuring points and test environment. Valid communication path has the lowest energy cost, which is calculated by link quality indicator (LQI). Previous work shows that communication distance, changing air humidity, RFI and obstruction impact LQI21,22 and result in unreliable wireless connection. Therefore, the network topology in test environment is not constant.
The flow chart of coordinator is shown in Figure 7(a) . In parameter initialization phase, besides initializing parameter, coordinator also checks command from UART to upload data within EEPROM. Stored sequentially in the queue, the sensor information including sensor number and strain information is 8 bytes long. According to the storage space within MSP430F149, one network can simultaneously accommodate 100 sensors.
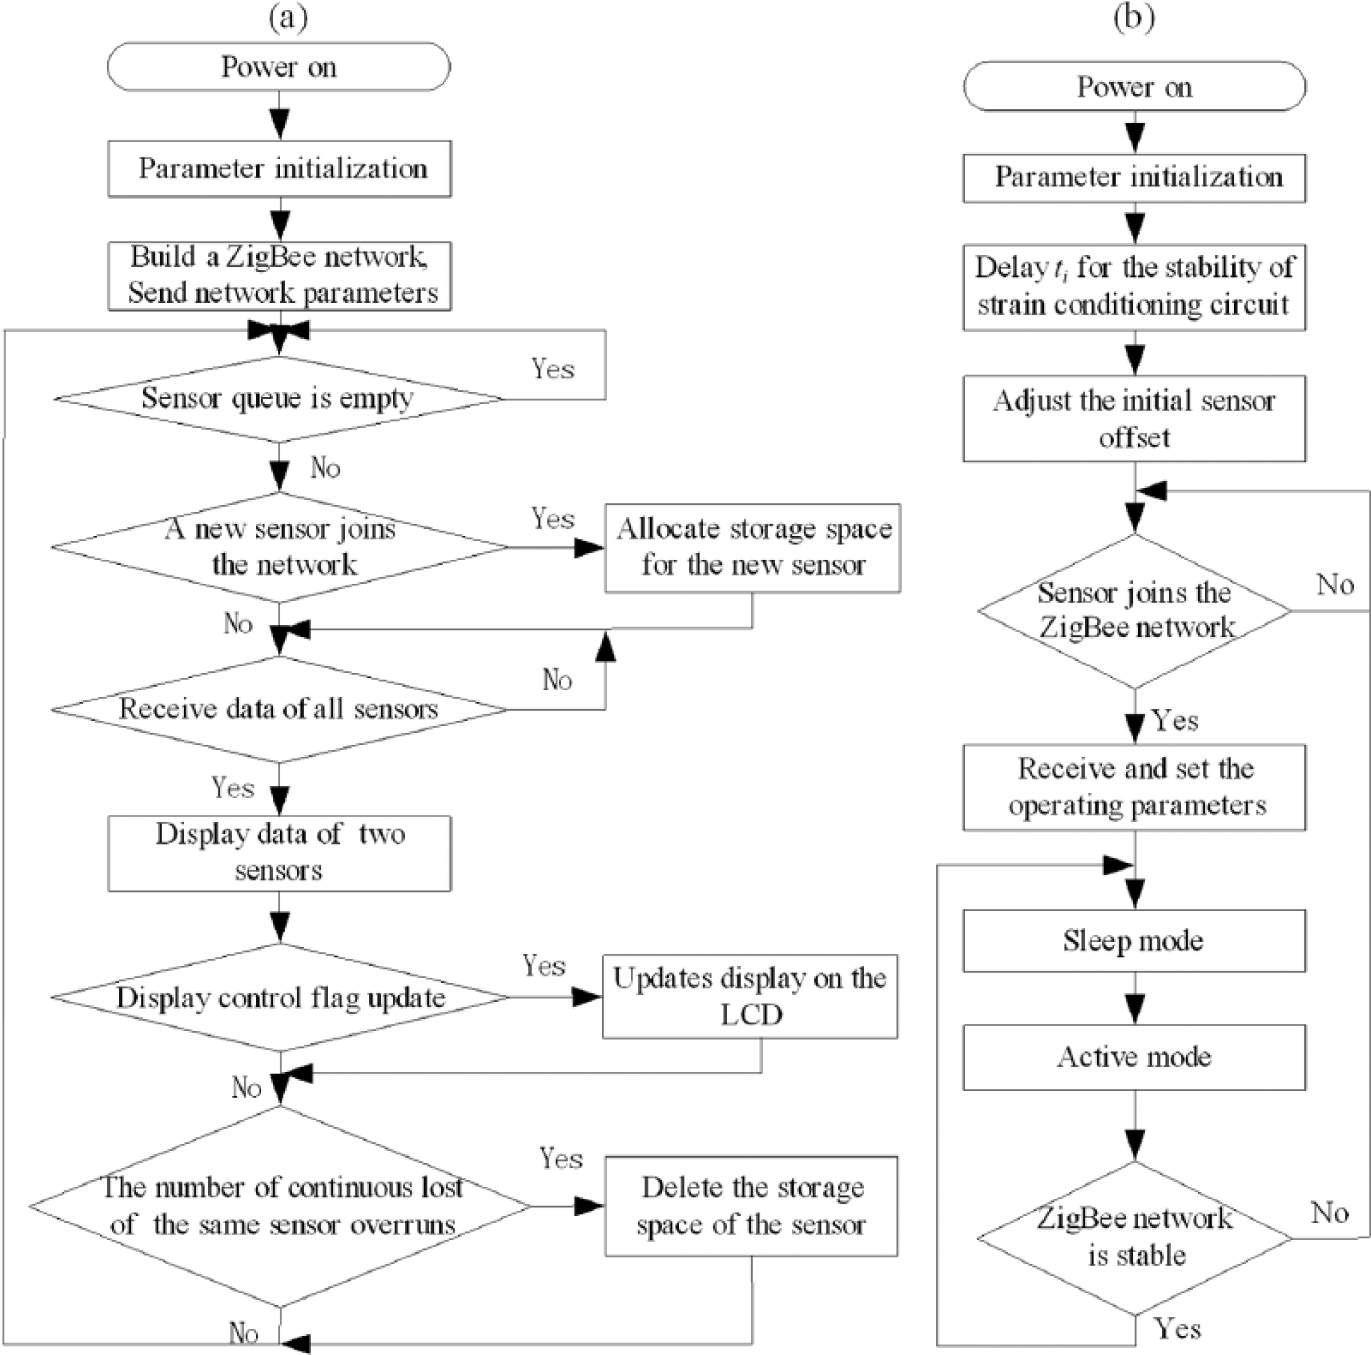
(a) Flow chart of coordinator. (b) Flow chart of sensor node
The flow chart of sensor is shown in Figure 7(b) . After initialization, ti should be delayed before zeroing process to make SCC reach steady state. Duration of ti depends on the stable set-up time of RF circuit and SCC. To reduce power consumption, the duty cycle of sensor has two operation modes: sleep and activity (see Figure 8 ). In sleep mode, SCC is powered down, and CC2530 is in low-power mode. In active mode, all modules of the sensor are powered on and stable within tw1 period. After that, tw2 period collecting strain signal and tw3 period transmitting strain data are determined by the parameters of hardware and network.
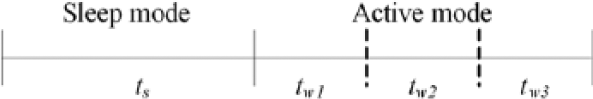
Two operating modes of the sensor node
The router is always in active state. After joining a ZigBee network, the router will always wait for relay task and search the routing table for a valid path to send data or command to destination module.
V. Experimental Analysis
A. Time domain response of SCC
When the sensor alternately works in active and sleep mode, the time domain response and energy consumption are affected by energy fluctuation. First, sensor should delay ti before zeroing process to wait for circuit reaching steady state. It was found that the main factor affecting ti is the step response time of SCC. During the zeroing process, the time interval between adjacent voltage adjustments must be long enough to ensure voltage stability. Second, the settling time tw1 is necessary when converting from sleep mode to active mode. As shown in Figure 9 , when the value of Rf is 20, 50 and 100 kΩ, respectively, the duration of tw1 is 50, 100 and 200 ms correspondingly. This is because high resistance reduces the cutoff frequency of filter and increases the stable time required for step signal response. During tw1, the sensor cannot do any effective work, and the energy consumption is wasteful. The tw1 can be shortened by higher cutoff frequency of the filter, whereas the inhibition effect on high frequency noise is reduced. Considering these two conflicting factors, Rf is selected as 50 kΩ. Then, tw1 equals to 100 ms, duration of ti and self-zeroing process interval, with doubled time redundancy, equal to 200 ms.
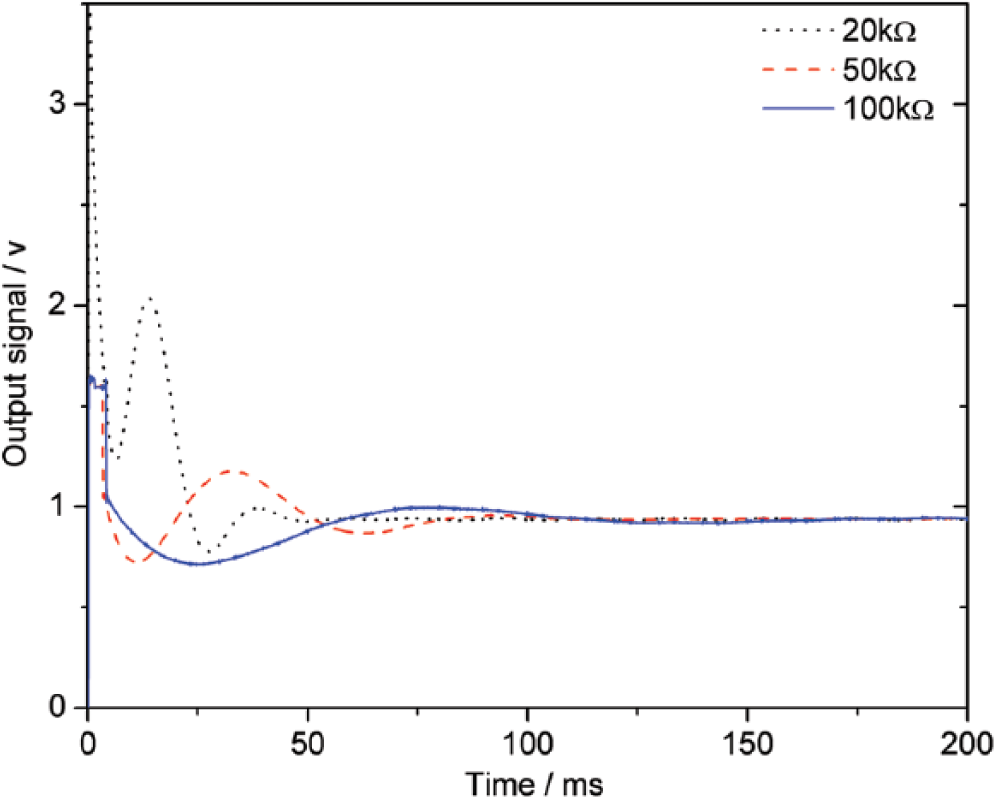
Time domain response of SCC when converting from sleep mode to active mode
B. Low-power strategy
Powered by single battery, the coordinator and the router have no SCC and consume less power than the sensor. Therefore, low-power design of sensor is critical. Besides choosing low-power chips, the sensor alternately works in active and sleep mode during duty cycle, whose frequency is described as fw. When the parameter of SCC is determined, the duration of active mode is constant. Therefore, the low-power strategy is to adjust the sleep mode duration ts according to fw. In sleep mode, the current consumption of sensor is only 2 mA to maintain power indicator and CC2530 low-power mode. During active mode, the current consumption is 36 mA within the tw1 and tw2 stage, and it increases to 71 mA within tw3 stage. Duration of tw1, tw2 and tw3 is 100 ms, 142 µs and 500 µs, respectively, with Rf = 50 kΩ. Therefore, the power consumption during period tw1 occupies a major part of sensor power consumption. In the presence of sleep mode, the bandwidth of sensor can be expressed as fd = 1/(tw1 + tw2 + tw3). But when sleep mode within duty cycle no longer exists, namely, sensors operating at frequencies greater than fd, tw1 would not exist. In this case, the sensor will always be in active mode. Based on the two cases, average current consumption ip of sensor is detailed in Equation (1) (in units of mA)
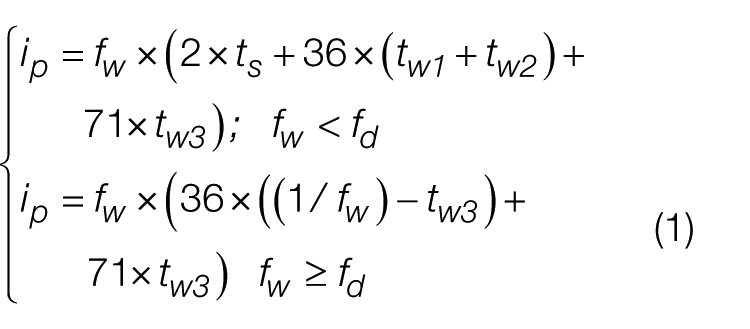
With two 1 Ah capacity lithium batteries, the service life of sensor after each charge is: TL = 1000/ip (in hours). The calculation parameters of sensor service life under three different circuit parameters are listed in Table 3 .
Calculation parameters of sensor service life
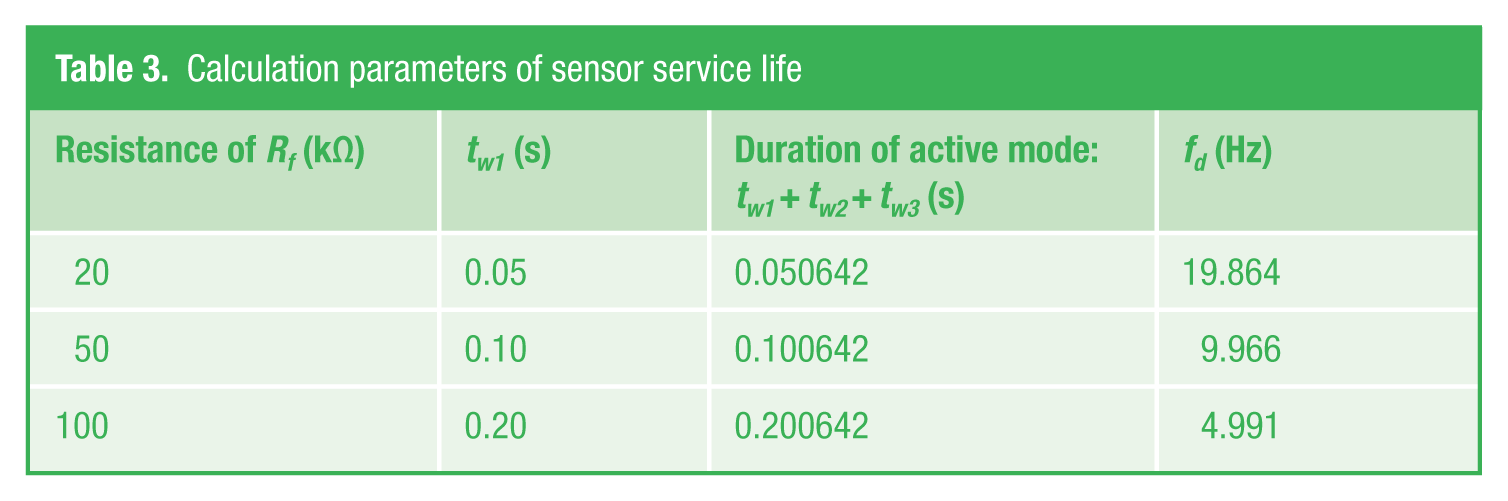
In the case of fw ≥ fd, the time domain response of SCC does not affect the power consumption of sensor. Therefore, when fw < fd, according to Equation (1) and Table 3 , the relationship between the sensor service life and the resistance of filter resistors is analyzed (see Figure 10 ). With the increasing resistance of filter resistor, TL is decreasing with the same fw. Compared with previous work, 16 PWSMS has a longer service life at the same battery capacity and frequency of data collection.
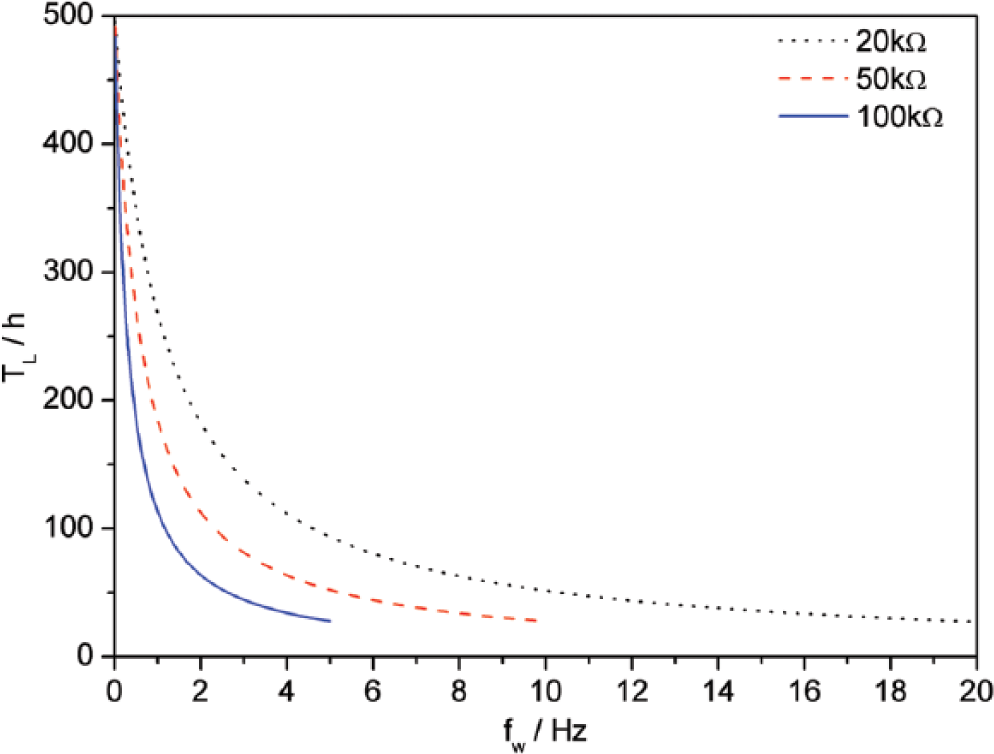
Relationship between fw and TL with different parameters of SCC
C. Calibration of PWSMS
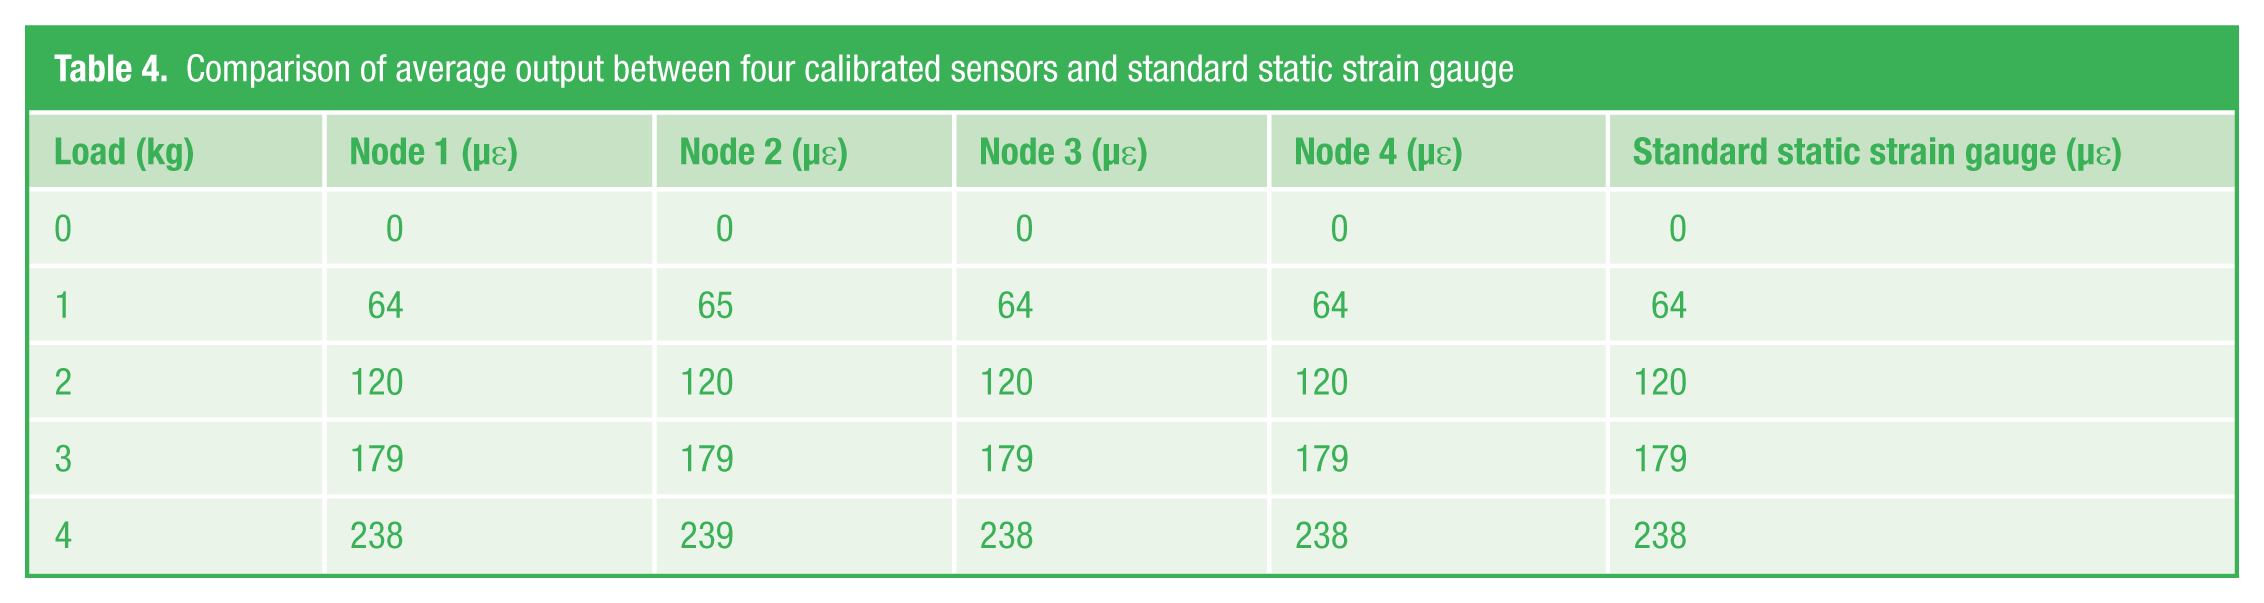
Each sensor node is calibrated by a standard static strain gage. Two strain gauges (120 Ω, 0.1% accuracy) are installed on an equal strength cantilever. One piece compensating the temperature drift is pasted on the bracket of cantilever. The other piece measuring strain is pasted on the middle of cantilever. The standard static strain gauge and sensors to be calibrated have the same connection with the two strain gauges, and their output values, under changing load, are recorded (see Figure 11 ). According to the loading curve fitted from the experimental results, the sensors can be calibrated. After calibration, the output comparison with different loads between four calibrated sensors and the standard static strain gauge is shown in Table 4 . A total of 20 tests are repeated to remove the effect of random factors.
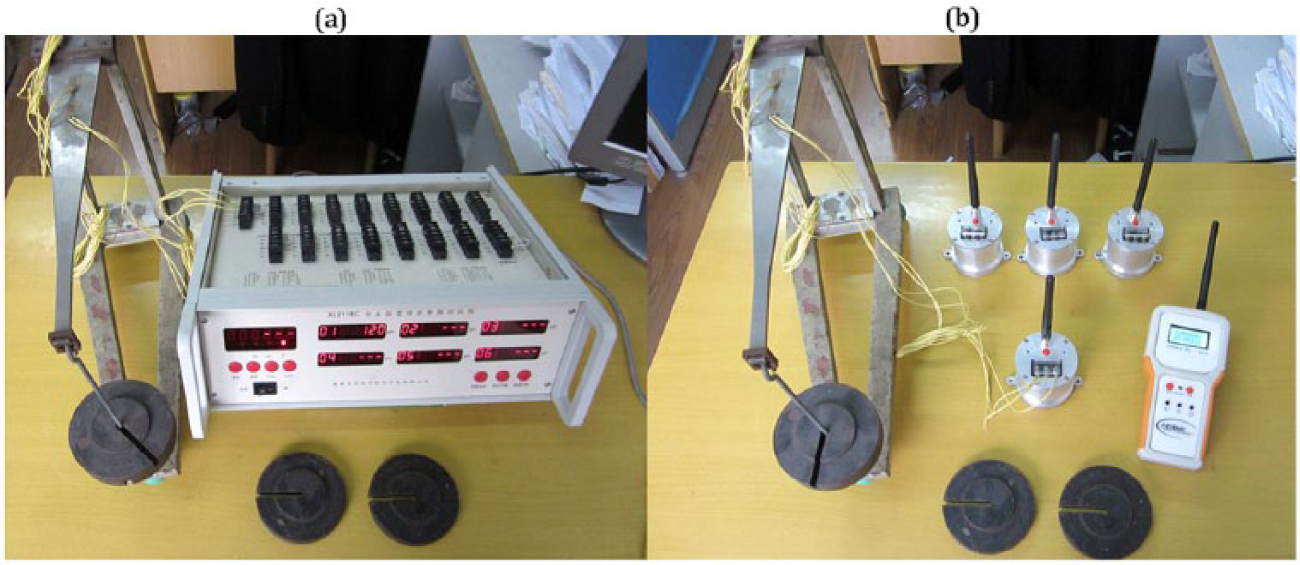
(a) Strain measurement tests with standard static strain gauge. (b) Strain measurement tests with calibrated sensors
Comparison of average output between four calibrated sensors and standard static strain gauge
D. Comparative tests on quayside cranes
To further validate the accuracy of PWSMS, comparative tests on quayside cranes between the calibrated PWSMS and wired standard static strain gauge have been analyzed (see Figure 12 ). Oblique rods undertake significant load in quayside cranes, whose degree of symmetry must be ensured in the manufacturing stage. To measure the degree of symmetry in oblique rods, front beam of quayside crane should be in a horizontal state at first. At this moment, oblique rods are in the maximum load state, strain detection equipments should be cleared and the recorded strain data are zero. Then, front beam will be raised to 15° by the loading cable, and oblique rods are in a relaxed state. Finally, the degree of symmetry in oblique rods will be calculated by the recorded strain data at this moment, which are minimum and negative. In this paper, two quayside cranes, with two parallel oblique rods for each, are tested with both PWSMS and wired standard static strain gage. The position of measuring point in oblique rod is 1 m above the hinged position to avoid stress mutant. A total of three tests are repeated for each quayside crane to remove the effect of random factors when it is monitored by PWSMS.
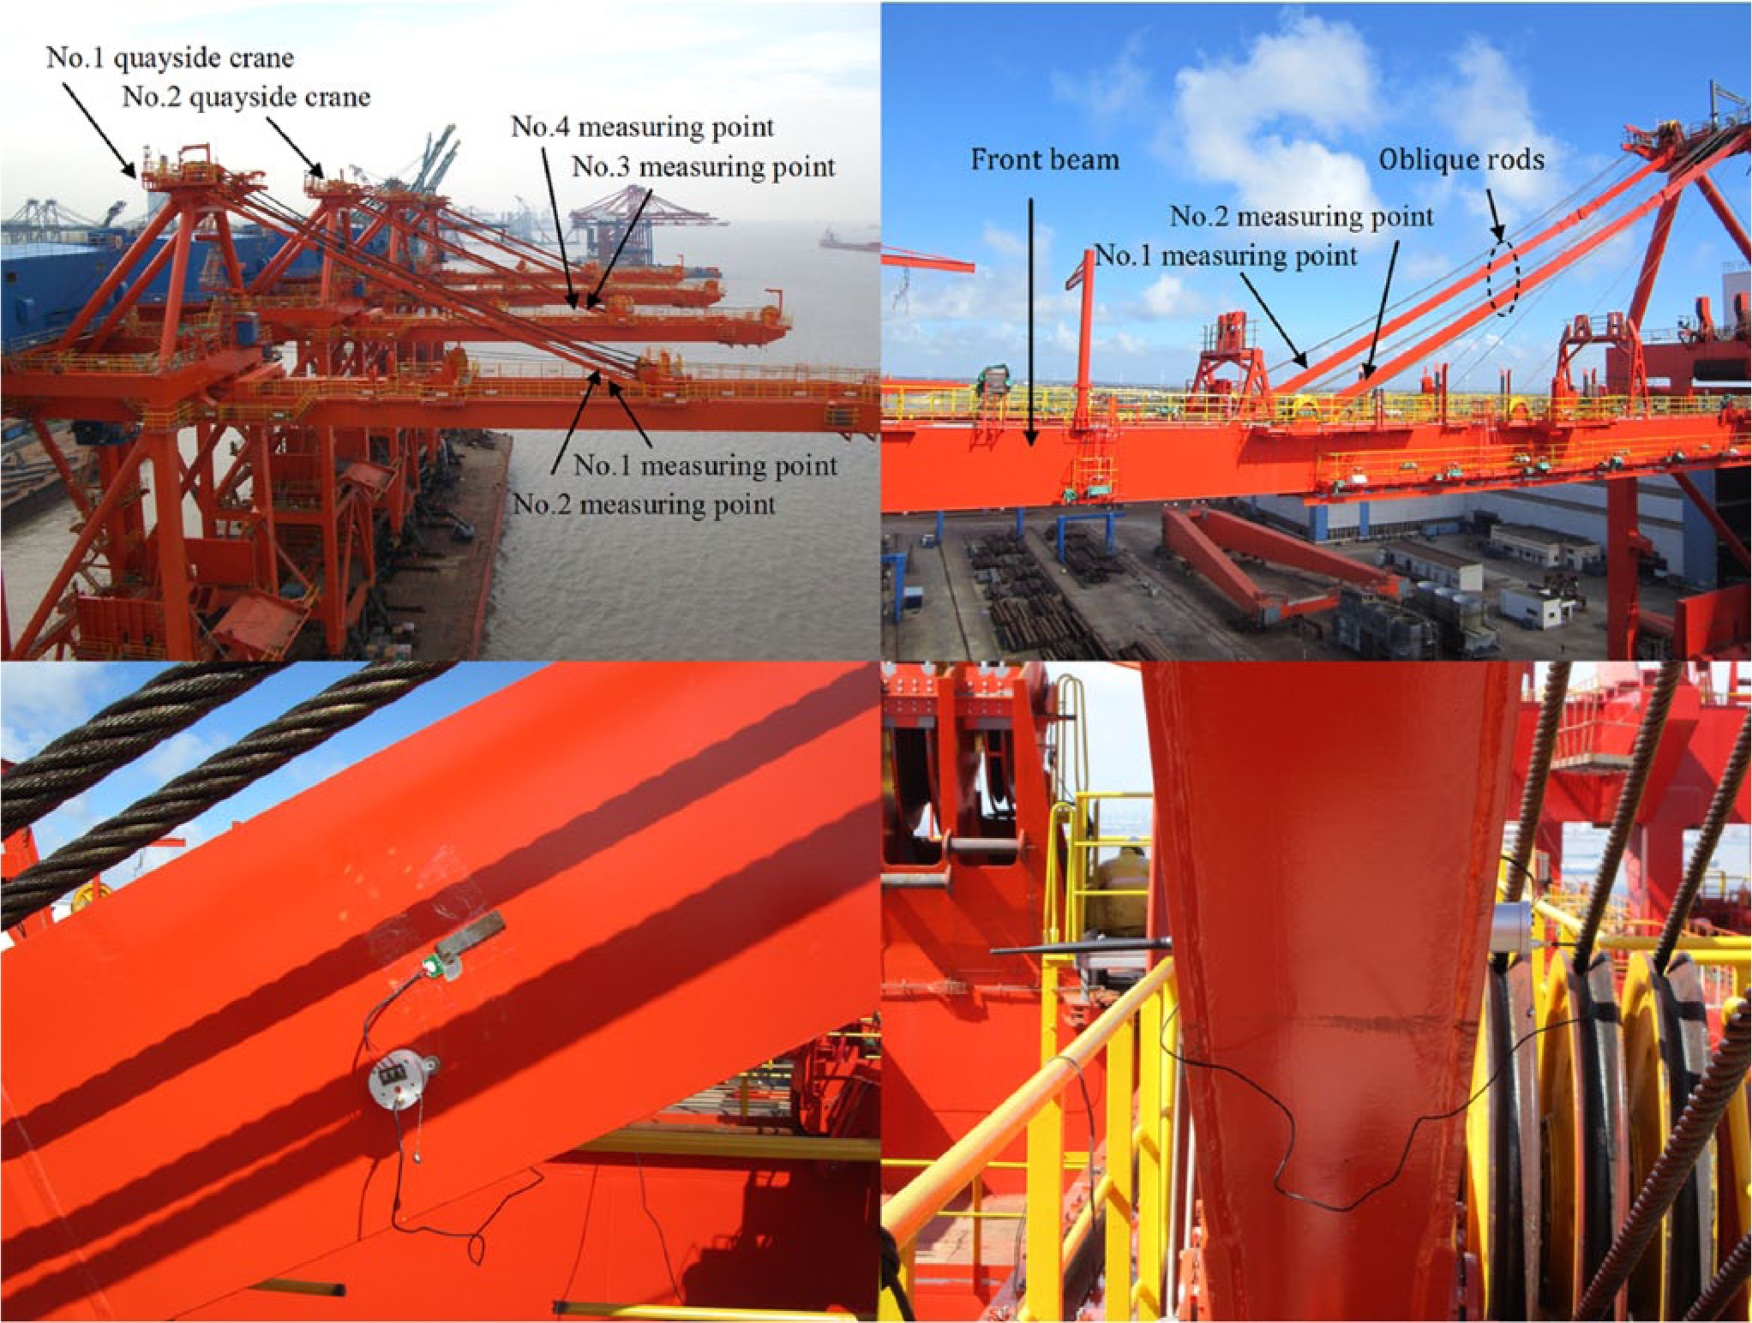
Comparative tests on quayside cranes
The absolute value of strain data of two quayside cranes in a continuous loading process is shown in Figure 13 . It can be found that the strain proportion of oblique rods in two quayside cranes estimated by PWSMS is similar to that obtained by wired standard static strain gage (see Table 5 ). As a result, PWSMS has an excellent performance for strain measurement.
Strain tests of oblique rods of quayside cranes
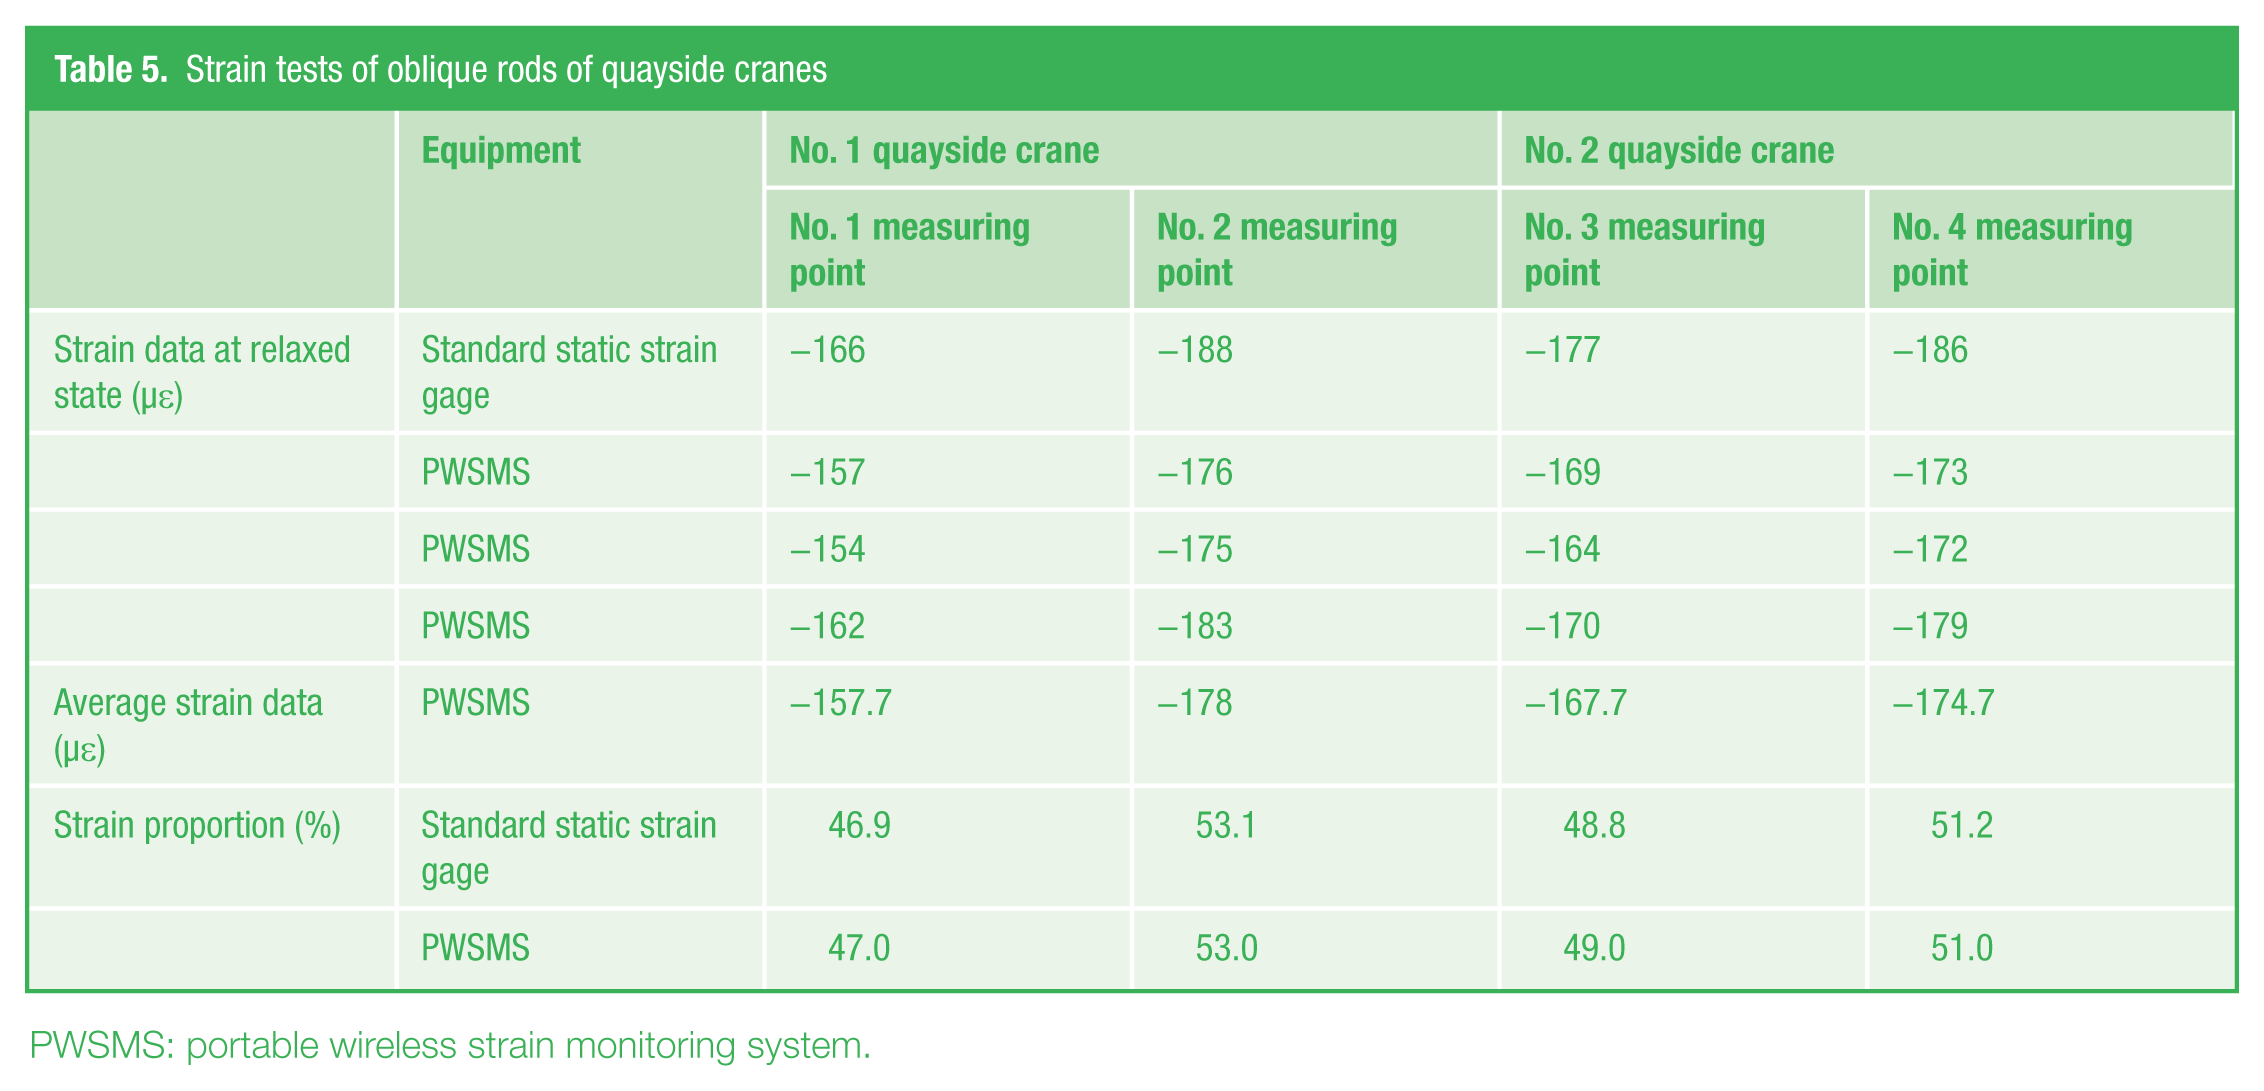
PWSMS: portable wireless strain monitoring system.
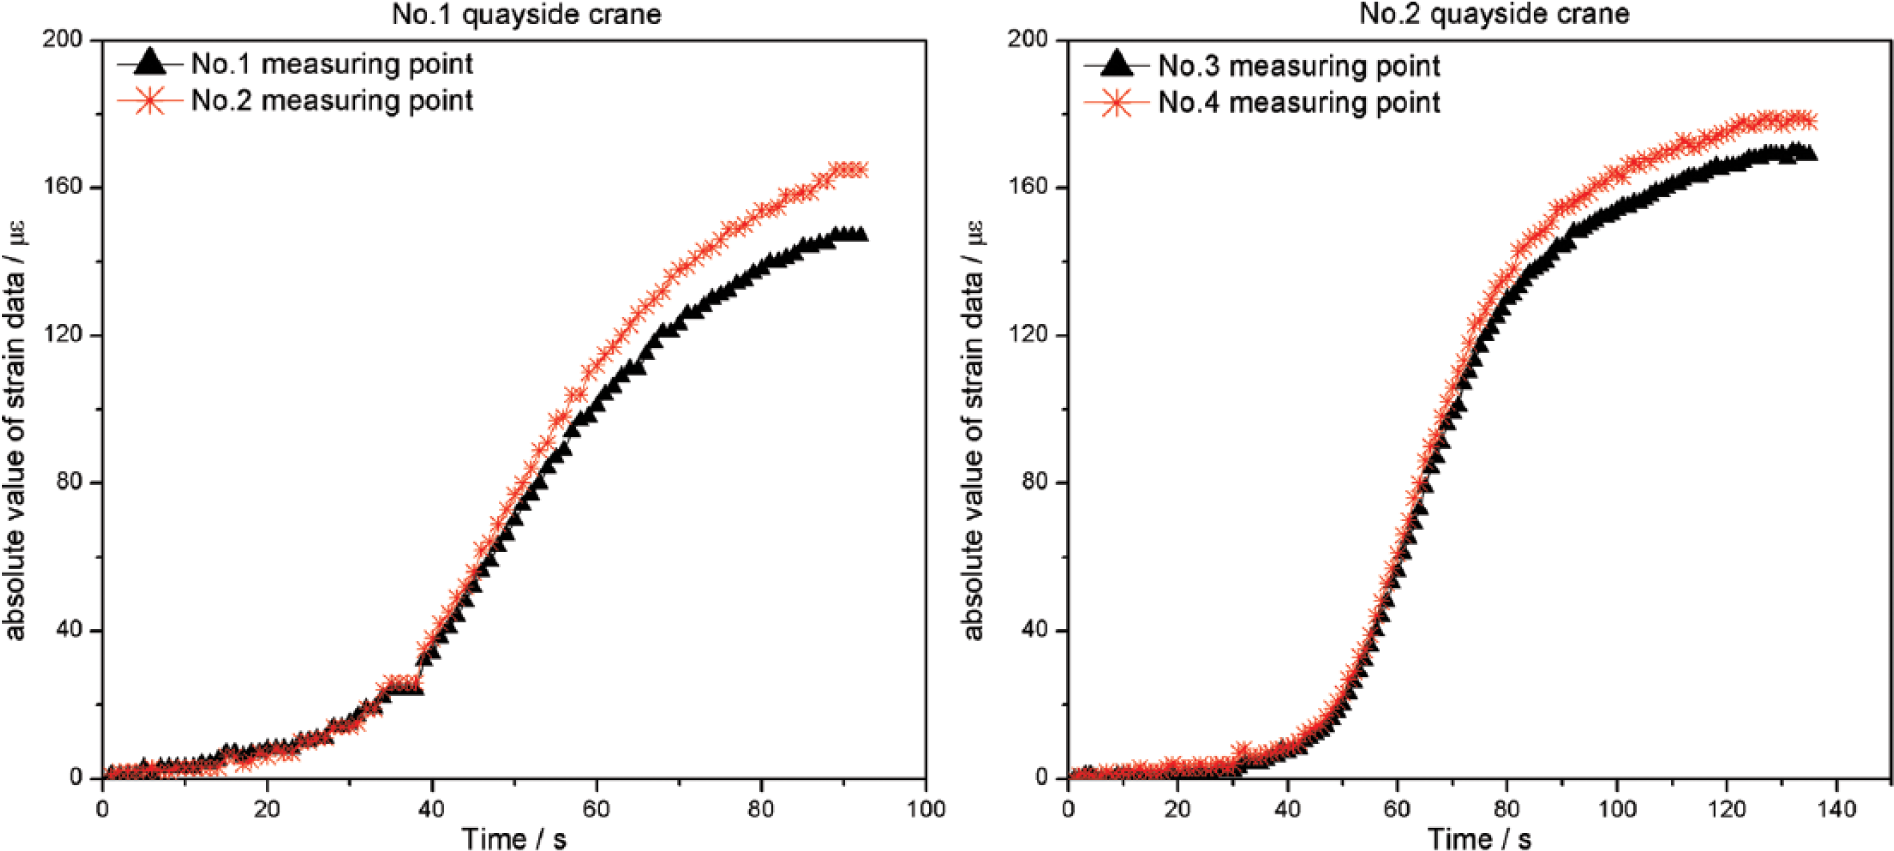
Absolute valve of strain data of two quayside cranes in a continuous loading process
VI. Summary and Conclusion
In this paper, a PWSMS for health monitoring of large metal structural has been designed and verified. It provided a comprehensive perspective of the effects of three main capabilities that influencing the work efficiency: (a) miniaturization, (b) portability and (c) low-power design. This paper introduces the design and implementation process of the system from hardware design strategies and software framework. Time domain response, power consumption analysis and comparative measurement experiments have been explored to verify its excellent performance. Additionally, it extends the accessible range of industrial applications. For the future work, to cope with the much more complex issues when facing large-scale monitoring tasks, health monitoring of LMS with WSN should employ the technology of data fusion and joint diagnosis of multi-sensor information.
Footnotes
Funding
The author(s) received no financial support for the research, authorship and/or publication of this article.