
Abstract
This paper presents a machine vision–based precise tool positioning and verification system that may be used with milling and lathe machines, and so on. For many industrial applications, the accuracy required in machining operations is of the order of microns. The developed machine vision–based tool position verification process involves pixel calibration to compute and measure real-world minute dimensions. These measurements are based on two-dimensional spatial correlation of sequential images captured from the movement of the tool with a resolution of 250 µm. The captured sequential images are thresholded using a new bio-inspired technique named Negative Selection Algorithm, a model of Artificial Immune System. The developed system extracts the difference between the actual and target positions of the tool from the captured images through image processing and calculates the error. To compensate for the positional error, alignment commands are fed to the two-axis high precision motor. The maximum error observed was ±206 µm for 14.99999 mm movement.
I. Introduction
In many mechanical engineering applications, cutting tool positioning is of prime concern in terms of precision and accuracy. With the continuous miniaturization of mechanical and optical products, demand for highly accurate dimensional measurements of micro-parts is ever increasing. Ultra-precise tool positioning and its measurement is an essential activity involved in the development of micro-machines. Traditionally, tool position measurement and its verification were done using linear encoders,1,2 laser interferometers,3–5 actuators, 6 coordinate measuring machine (CMM),7,8 atomic force microscope (AFM), scanning electron microscope (SEM), 9 and so on. Linear encoder is a sensor which is available as incremental or absolute reader and encompasses various detection techniques, namely, mechanical, optical, magnetic, and capacitive types. Laser interferometer is an instrument used for the most precise distance measurement using optical interference fringes. 10 The advancement of technology in the field of micro- and nano-technology has opened up new applications in assembling and manipulating components; hence, verification of motion in micro/nano-range is as important as its actuation and measurement. 11
For micro- and nano-scale measurement and verification, machine vision–based solutions have been widely explored 9 as they provide rich knowledge about the spatial arrangements (i.e. geometry and topology) of objects to be manipulated in an inexpensive and effective way. 12 A general machine vision system comprises a lens to accumulate and focus light, a camera to capture the image, a uniform illumination source to improvise the imaging, and an interface to send the data to the processor. Vision-based manipulation processes generally include the tasks such as acquisition of images, image processing, image analysis and extraction of features, and feedback for control of motion actuator(s).12,13 Machine vision–based tool positioning and verification is a significant topic of research as it has variety of applications in mechanical, 14 aerospace, 15 medical, 16 and manufacturing processes. 17 Many researchers have contributed significantly in this field. For example, Lai and Fang 18 have proposed a hybrid image alignment system, known as the Fast Localization with Advanced Search Hierarchy (FLASH) algorithm, which makes use of image comparison to detect deviations in pattern localization. Kim et al. 19 derived a two-step automatic alignment algorithm from inspection data and geometric relations on machine coordinates for detecting deviations from standard positions. Golnabi and Asadpour 20 describe the design and applications of industrial machine vision systems. Nian and Tarng 21 developed a new algorithm for a three-axis auto-alignment system using vision inspection which relates the input with output feedback system. Some authors have used schemes like Horn Schunck Algorithm, 22 Embedded System for Real-Time Human Motion Detection, 23 and CMM 24 to detect the movement.
In this work, focus is on developing a simplified and user-friendly technique for vision-based tool positioning and its verification. Tool positioning along with feedback for error compensation was done from the captured images of tool before and after its movement. Similarly, determination of unknown distance traveled by the tool was done from the captured images. Tool movement was calculated by utilizing Euclidean distance method 25 along with white pixel sorting technique, in pixel units that was later converted into real-world units. The vision-based calculated distance in real-world units (millimeter or micron) was verified by the Physique Instruments (PI) micro-positioning system (C-880 multi-axis automation controller for the F-130/F-131) to calculate the error. Compensation of error was then done by a feedback system. Maximum error was limited to ±206 µm for 14.99999 mm movement.
The paper is organized as follows: In section II, the Operational Setup part is explained. The “Methodology” section explains pixel calibration and algorithms to calculate the dimension of one pixel in real-world unit besides measurement of known and unknown movements of tool. Results and discussions are presented in section III, followed by conclusion in section IV.
II. Operational Setup
The complete experimental setup consists of a vibration isolation table (Thorlabs, PBG52510), P-IV personal computer (PC), monochrome charge coupled device (CCD) camera (1.3 mega pixel, Allied Vision Technology (AVT) Stingray), lens (Edmund Optics (EO) stock no. P68-681), Boom stand, IEEE 1394b card, two Motion cards (PI C-843 card, E-760 NanoCube® Piezo Controller Card), advanced illumination light emitting diode (LED) backlight (EO part no. NT66-840), and a lathe tool as shown in Figure 1 .
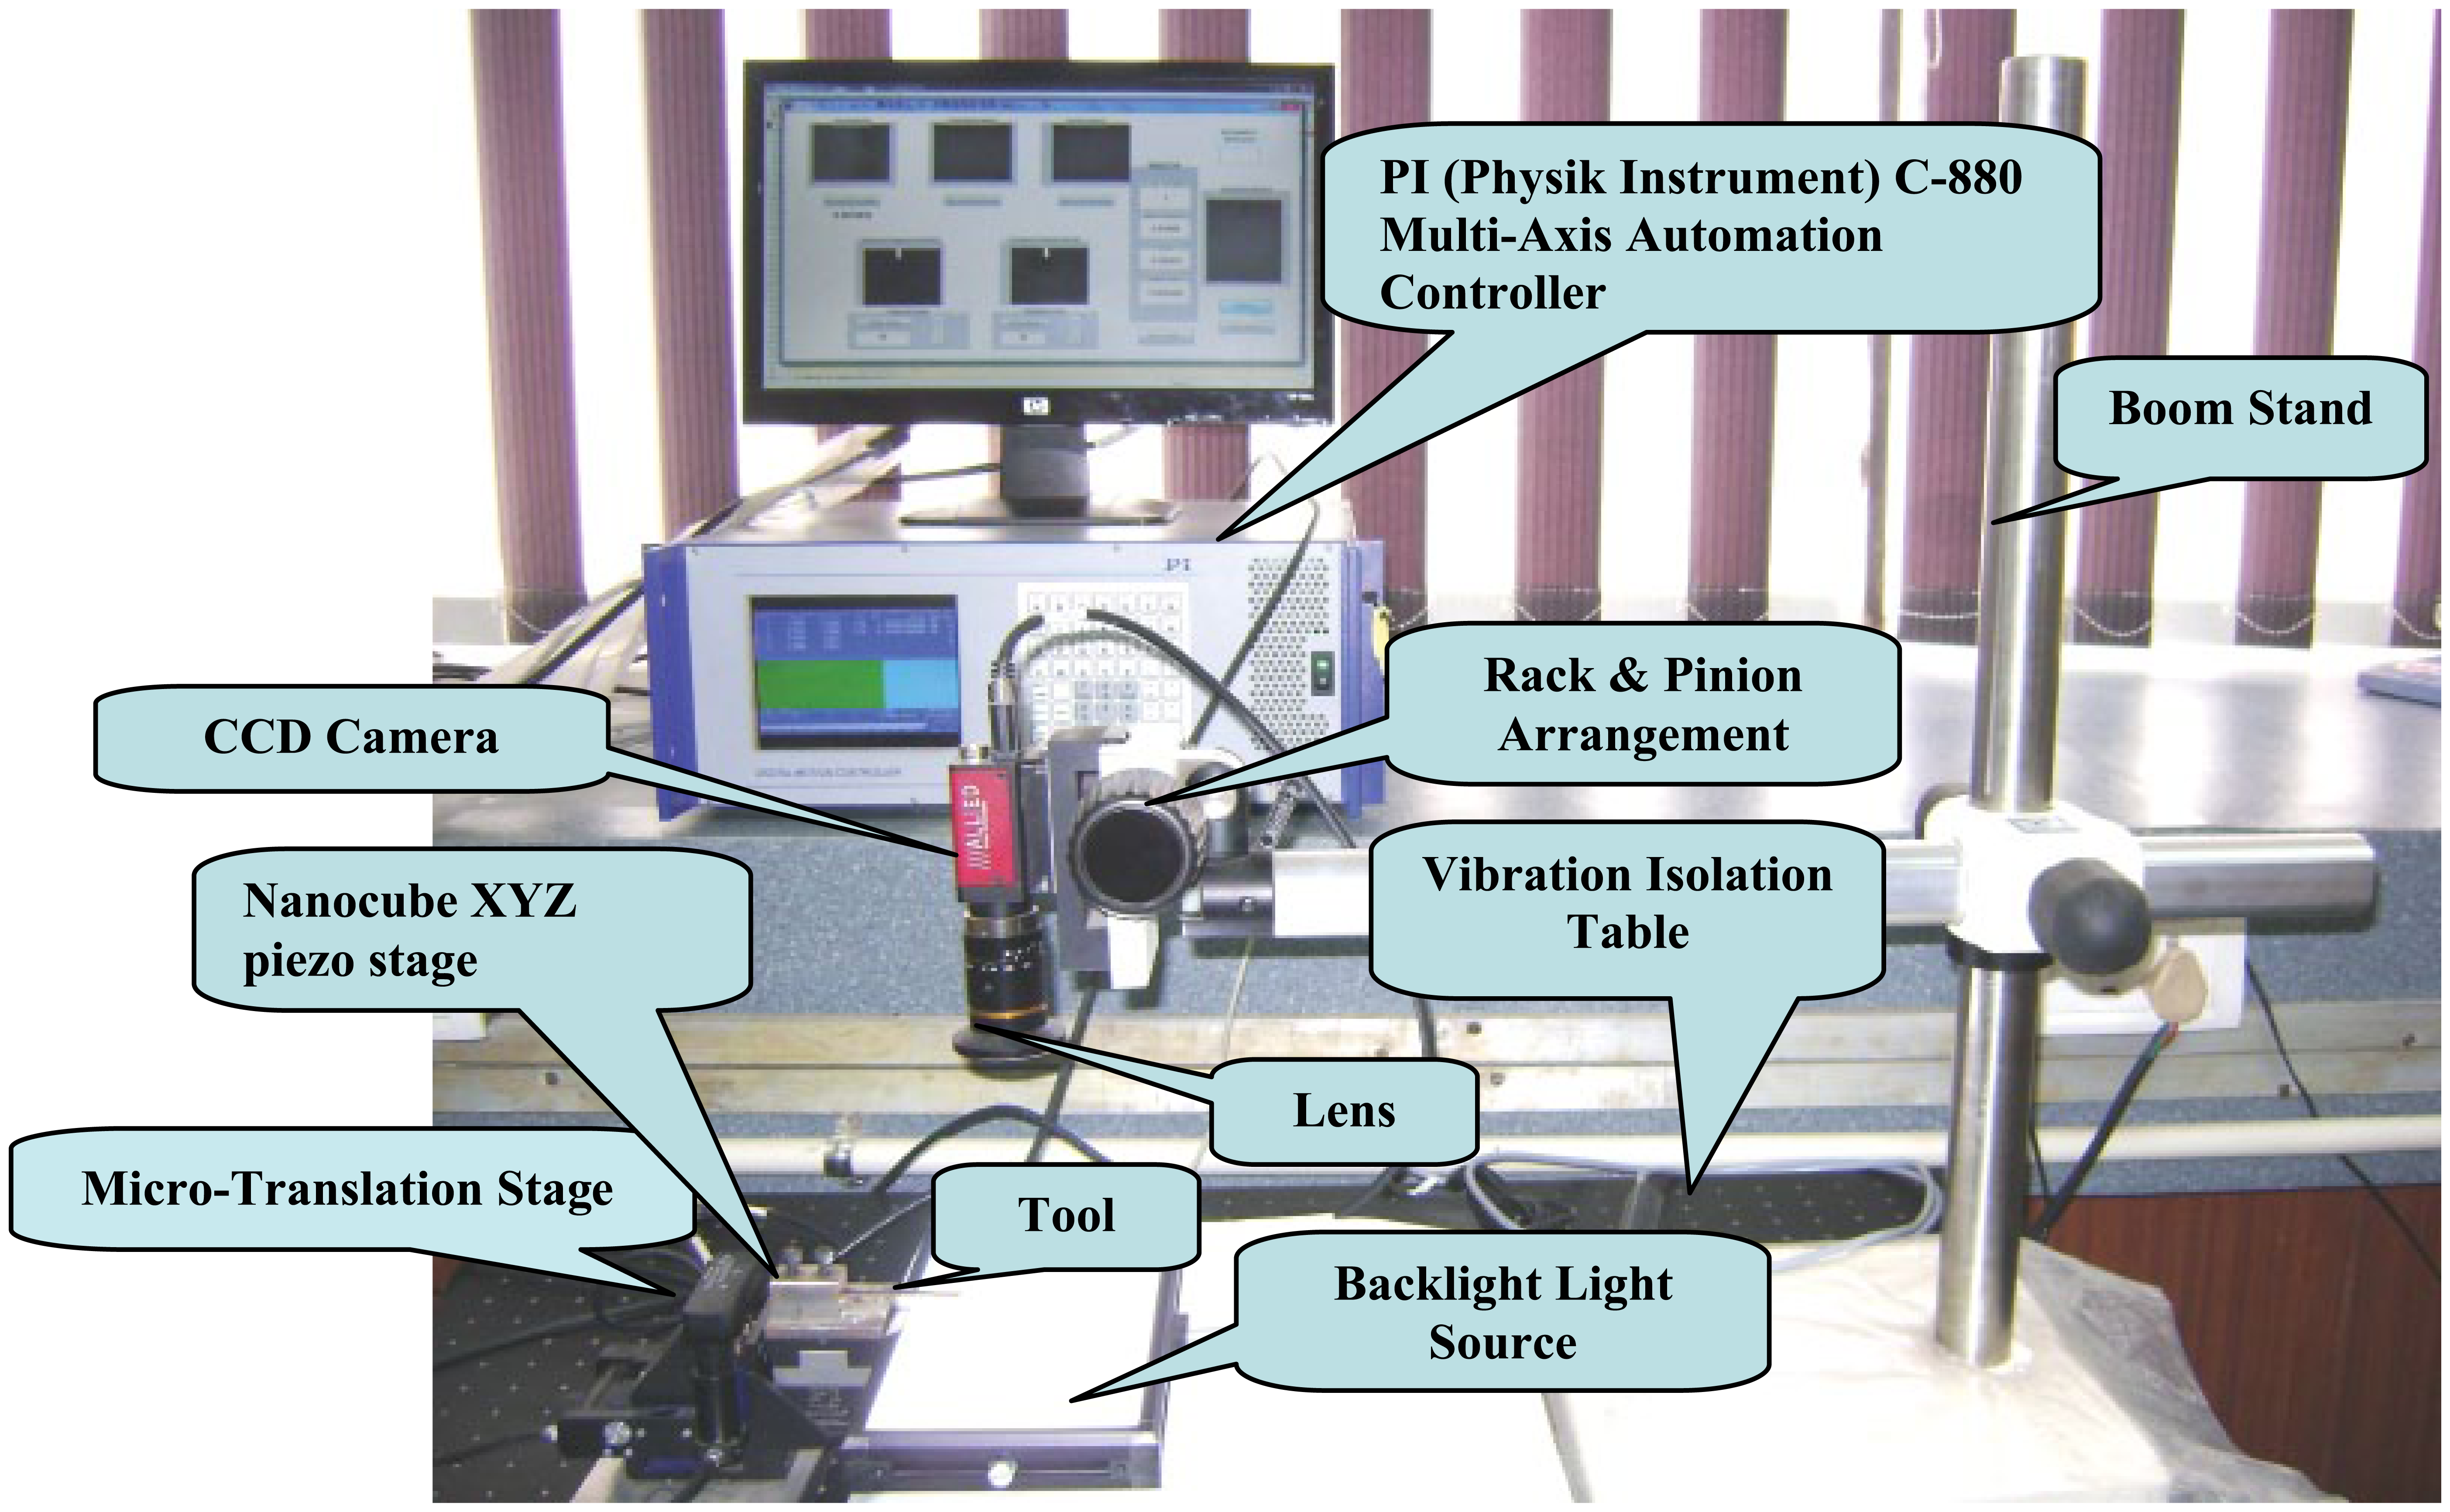
Complete experimental setup
The camera is fitted to an adjustable mounting plate that is attached to the arm of boom stand. Peripheral component interconnect (PCI) express slot–based IEEE 1394b card is installed inside PC for interfacing the CCD camera with the PC. Two motion cards are installed inside PC: one for interfacing micro-translation stages with direct current (DC) motor gearheads (three units, stacked upon one another to achieve XYZ stage) for coarse movement (mm/micrometer) having millimetric resolution and other for interfacing Nanocube XYZ piezo-stage for fine movement (micro/nanometer) having nanometric resolution with X-, Y-, and Z-axis movement. LED backlight is placed beneath the tool. Graphical user interface (GUI) and software algorithm were developed in MATLAB® for image processing. To enhance the precision of accuracy, the whole experimental setup is positioned on a vibration isolation table. The camera can be moved steadily along the X and Y directions, and movement along the Z-axis adjusts the focus of the image with the help of rack and pinion arrangement of the mounting plate.
The light projected onto the tool is captured through the lens by the sensors of the CCD, which translate it into electrical signals according to its intensity. These electrical signals stored in the Frame Grabber constitute basic image information. The analog signals are finally converted into a digital image and transferred to central processing unit (CPU).
The main function of the motion control mechanism is to perform the motion and compensate for positional difference of the tool as calculated by the algorithm developed using MATLAB® software. The moving stage system consists of an ultra-high resolution micro-translation stage, a Nanocube XYZ Piezo Stage, a capacitive and strain gauge (SGS) position sensor, a data acquisition (DAQ) interface, and a control PC.
III. Methodology
In order to find out the appropriate components/sub-system of the machine vision setup, the following activities have been carried out.
A. Pixel calibration
The pixel calibration is a vital process in any image processing–related application. Pixel calibration is a process of extracting the real-world dimension (millimeter or micron) of a pixel from pixel-world (pixels) by applying sobel edge detection 26 on reference grid image. For precise pixel calibration, its constituents (reference grid, illumination and three different parameters (area, length, and mean)) have been analyzed in this paper.
Selection of reference grid
The three different reference grids or test targets studied were AutoCAD grid, National Instruments (NI) grid, and EO grid. The AutoCAD grid is a man-made square grid using AutoCAD software having dimensions 5 × 5 cm. NI grid is available from NI website having blobs of 20 × 20 numbers, each of 10 mm diameter. EO grid (Color Scanner Test Target, NT58-197) is a square grid of size 25 mm made up of 30 lines. Considering the aspect ratio of images in each grid, EO grid was found to be most suitable and was finally selected for appropriate pixel calibration.
Selection of illumination environment
It is quite essential to conduct pixel calibration in appropriate illumination environment as it significantly affects the thresholding process. For the selection of optimum illumination environment, experiments were conducted on three illumination sources, namely, ambient light, Navitar optical fiber light (Model No.: MO 150AC230), and advanced illumination LED backlight. The illumination sources were analyzed using the histogram of an image that depicts frequency distribution of gray level in the image. Histograms of the images captured in LED backlight environment were deep in valley, narrow, and symmetrical peaks, which indicates good thresholding. By inspecting the peaks in the histogram, the LED backlight came out to be most appropriate illumination system as it helps in robust thresholding of an image using negative selection algorithm (NSA).
Calibration technique
Different calibration techniques, namely, area, length, and mean techniques, were applied to the EO grid in selected environment for selecting the best technique. After analyzing all the techniques, mean technique came out to be most suitable as it provided consistent results. In this technique, length of all the lines was calculated in pixels from the captured image of the EO grid from horizontal (h1, h2, h3, h4) and vertical (v1, v2, v3, v4) coordinates, respectively, using Euclidean distance formula in equations (1) and (2). The mean of all the horizontal and vertical lengths were calculated separately using equations (3) and (4) for calculating the real-world dimension of a pixel by equations (5) and (6). In mathematical representation, h1–h4 represent the pixel coordinates of horizontal line and v1–v4 represent the pixel coordinates of vertical line as shown in Figure 2
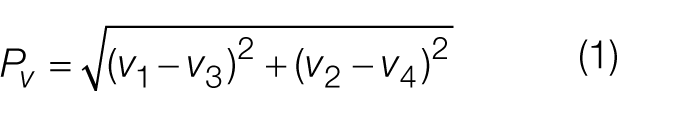
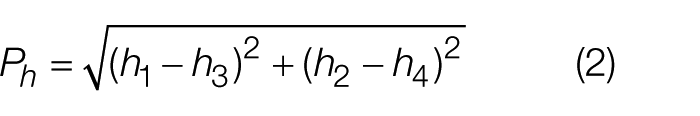
where Pv and Ph are number of pixels in vertical and horizontal lines, respectively, which vary from 1 to 30 in a grid
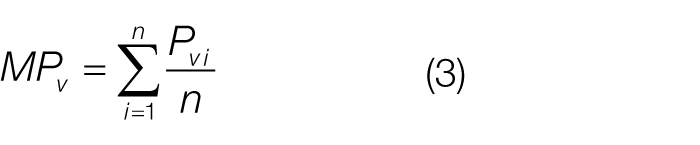
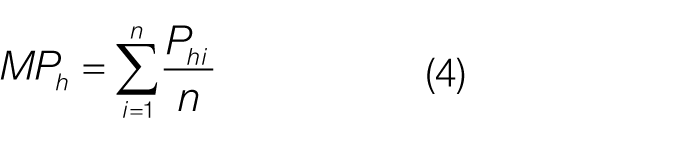
where Mv and Mh are the vertical and horizontal means of pixels Pv and Ph, respectively, and n = number of horizontal/vertical lines up to 30.
If Lv and Lh are the real-world pixel dimensions of a pixel in vertical and horizontal directions, respectively, then
where L is the actual length of a grid in horizontal and vertical directions (25 mm). Then, one pixel dimension in real-world unit = 0.084949 mm.
Pixel representation of EO grid
B. Tool position verification
Algorithm was applied to the images of initial and shifted positions of the tool using two approaches. The first one is vision-based distance calculation from the images of known distance tool movement and the second one is the determination of unknown distance traveled by the tool. These are explained in detail as follows.
Algorithm for determination of known position of tool and error feedback
After completing the pixel calibration, the other important task was to precisely determine the distance traversed by the tool in terms of pixels. Euclidean distance algorithm ( Figure 3 ) was used to determine both horizontal and vertical distance as pixel dimension traversed by the tool using PI system.
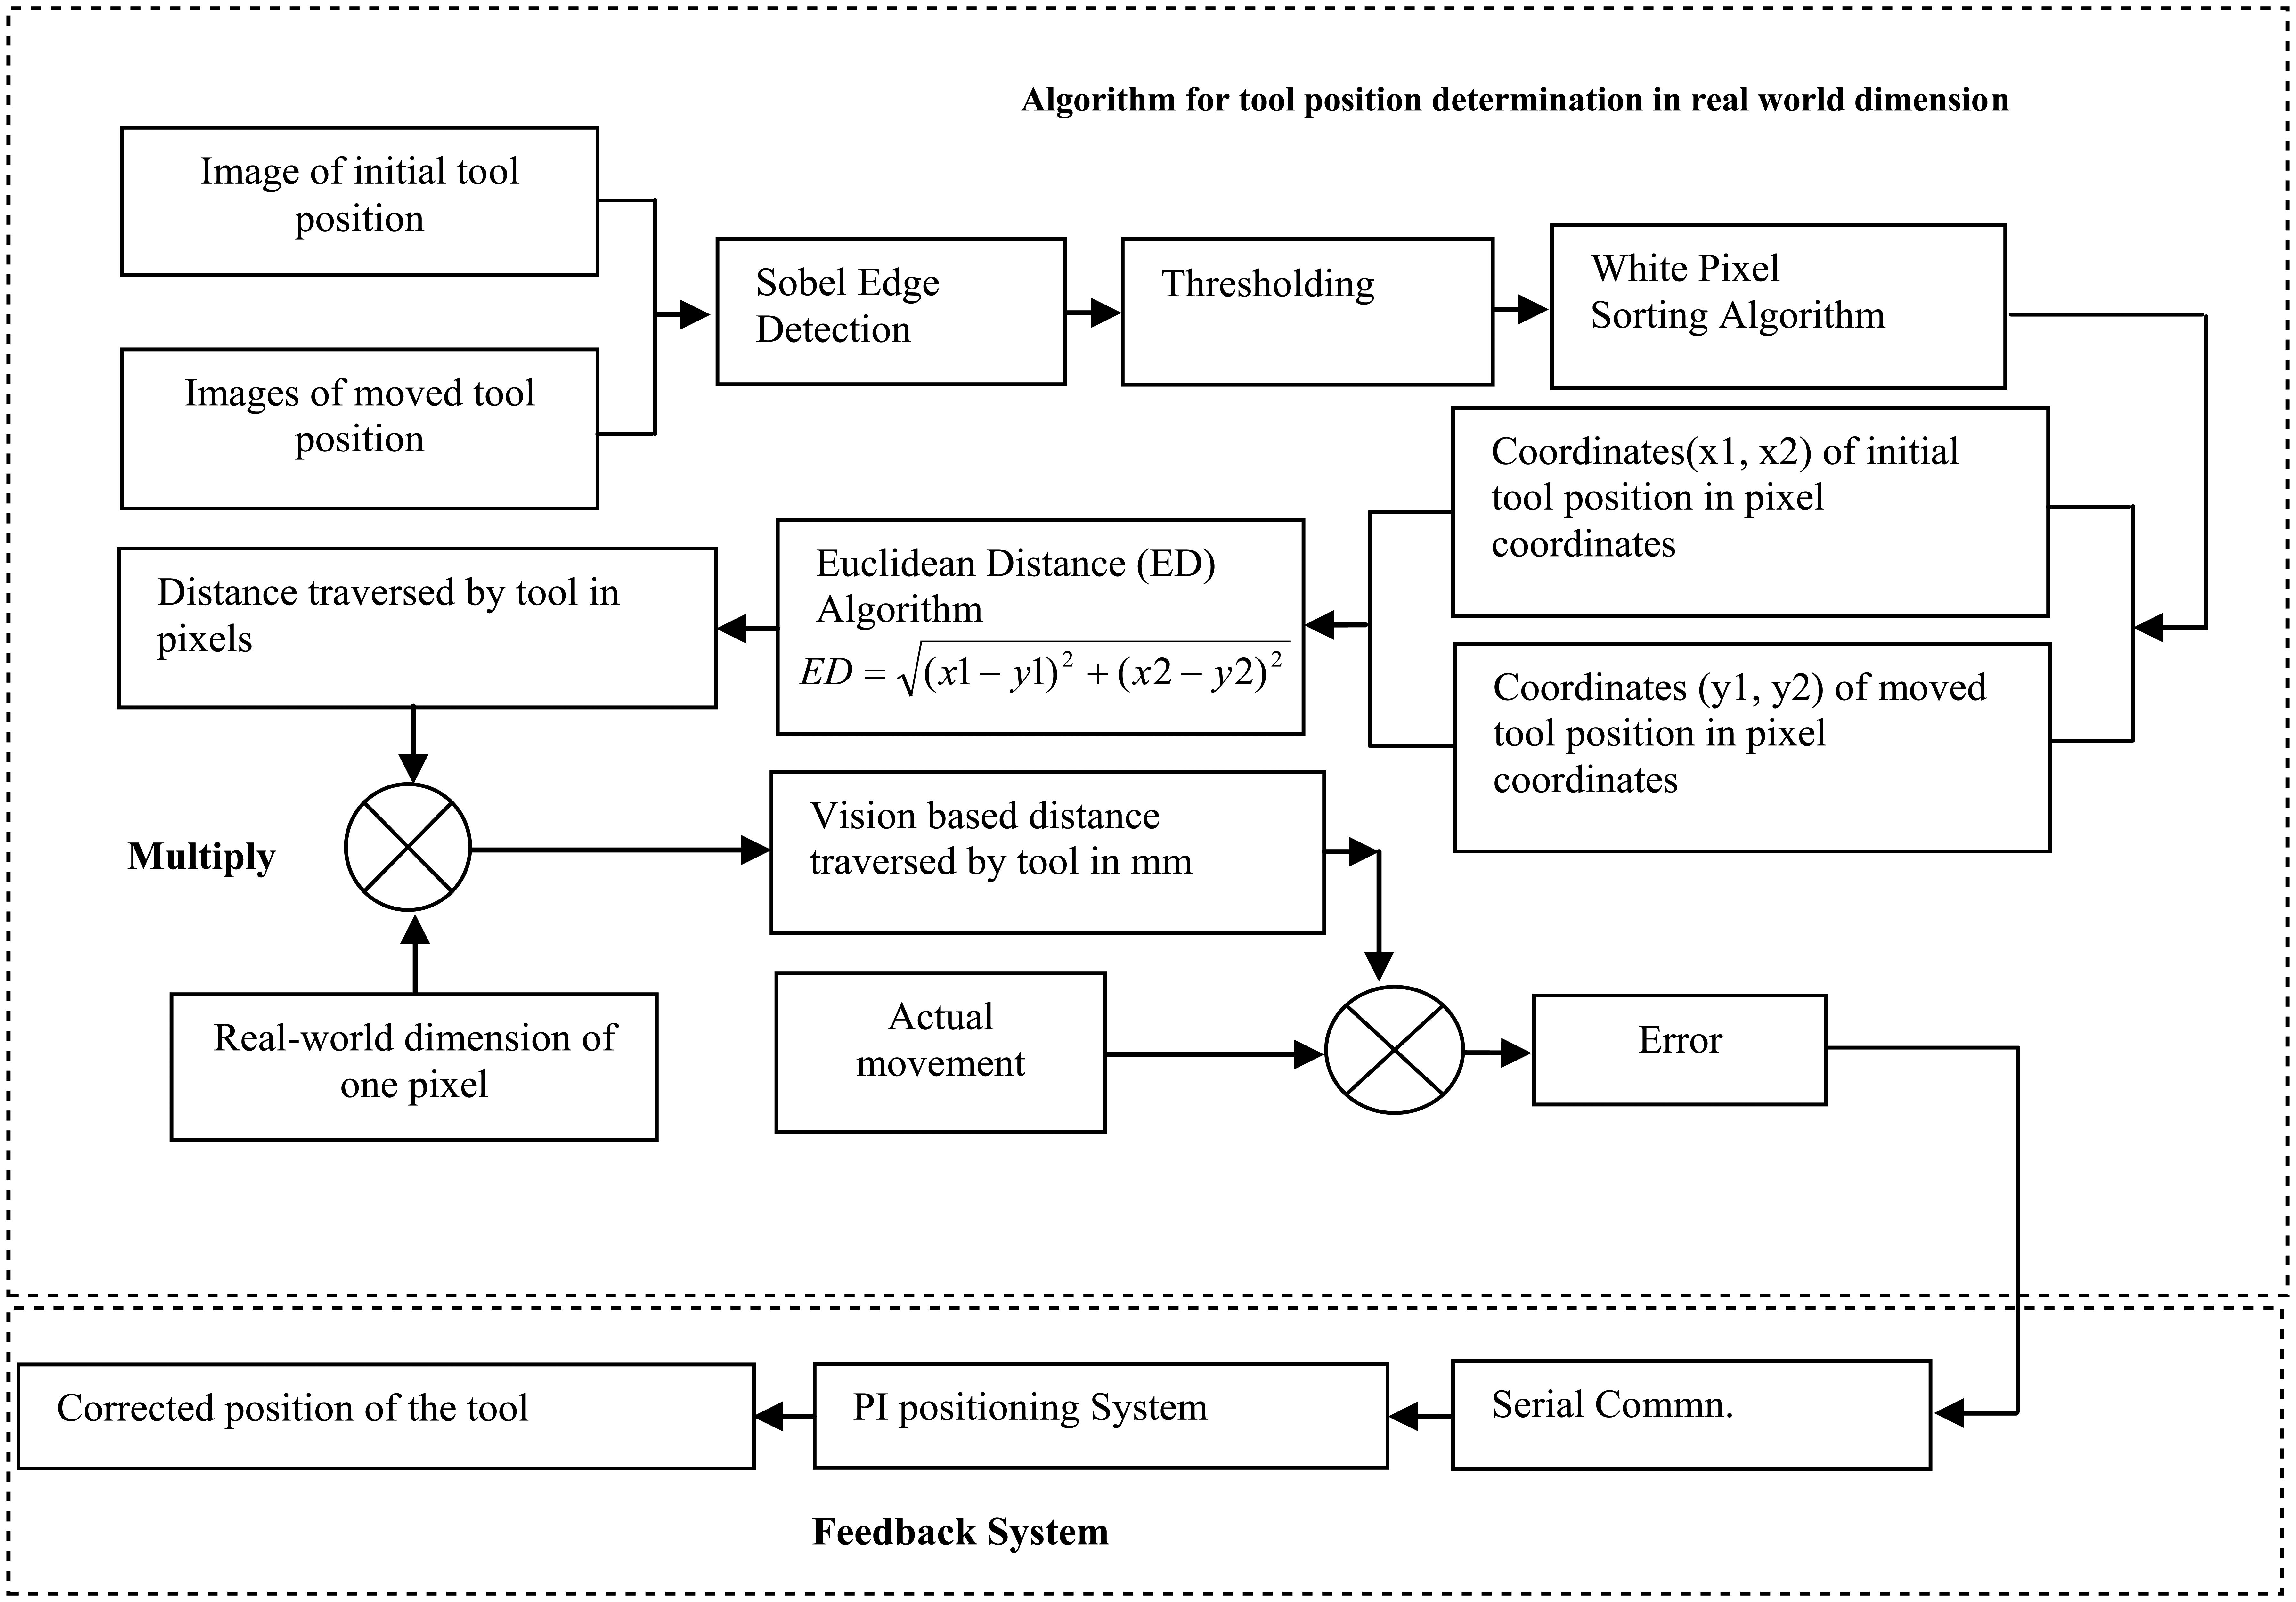
Block diagram of machine vision–based tool position verification system
Initially, images of both the reference (initial position) and traversed positions of tool were captured using the AVT stingray firewire camera. These images were then enhanced and segmented using sobel edge detection and NSA-based thresholding. 27
NSA is a bio-inspired technique used for thresholding process derived from Artificial Immune System (AIS). The process of thresholding based on NSA is explained as follows.
The set of strings from the captured image is initialized. The obtained strings in the form of 0 and 1 are stored in the variable “p.” The histogram is computed from the initialized strings. The maximum information entropy (MIE) technique is applied on the strings to binarize the image. 28 The binarized strings are stored in the separate variable “n.” The global thresholding (OTSU) process is applied on the initialized strings. The location value of the output obtained from both the processes is matched.
If the values are properly matched, such as p = n, that is, 0 to 0 and 1 to 1, those strings are taken as self while the strings that are not matched, like (p ≠ n) 0 to 1 and 1 to 0, are taken as non-self. The process of distinguishing self from the non-self is shown in Figure 4 .
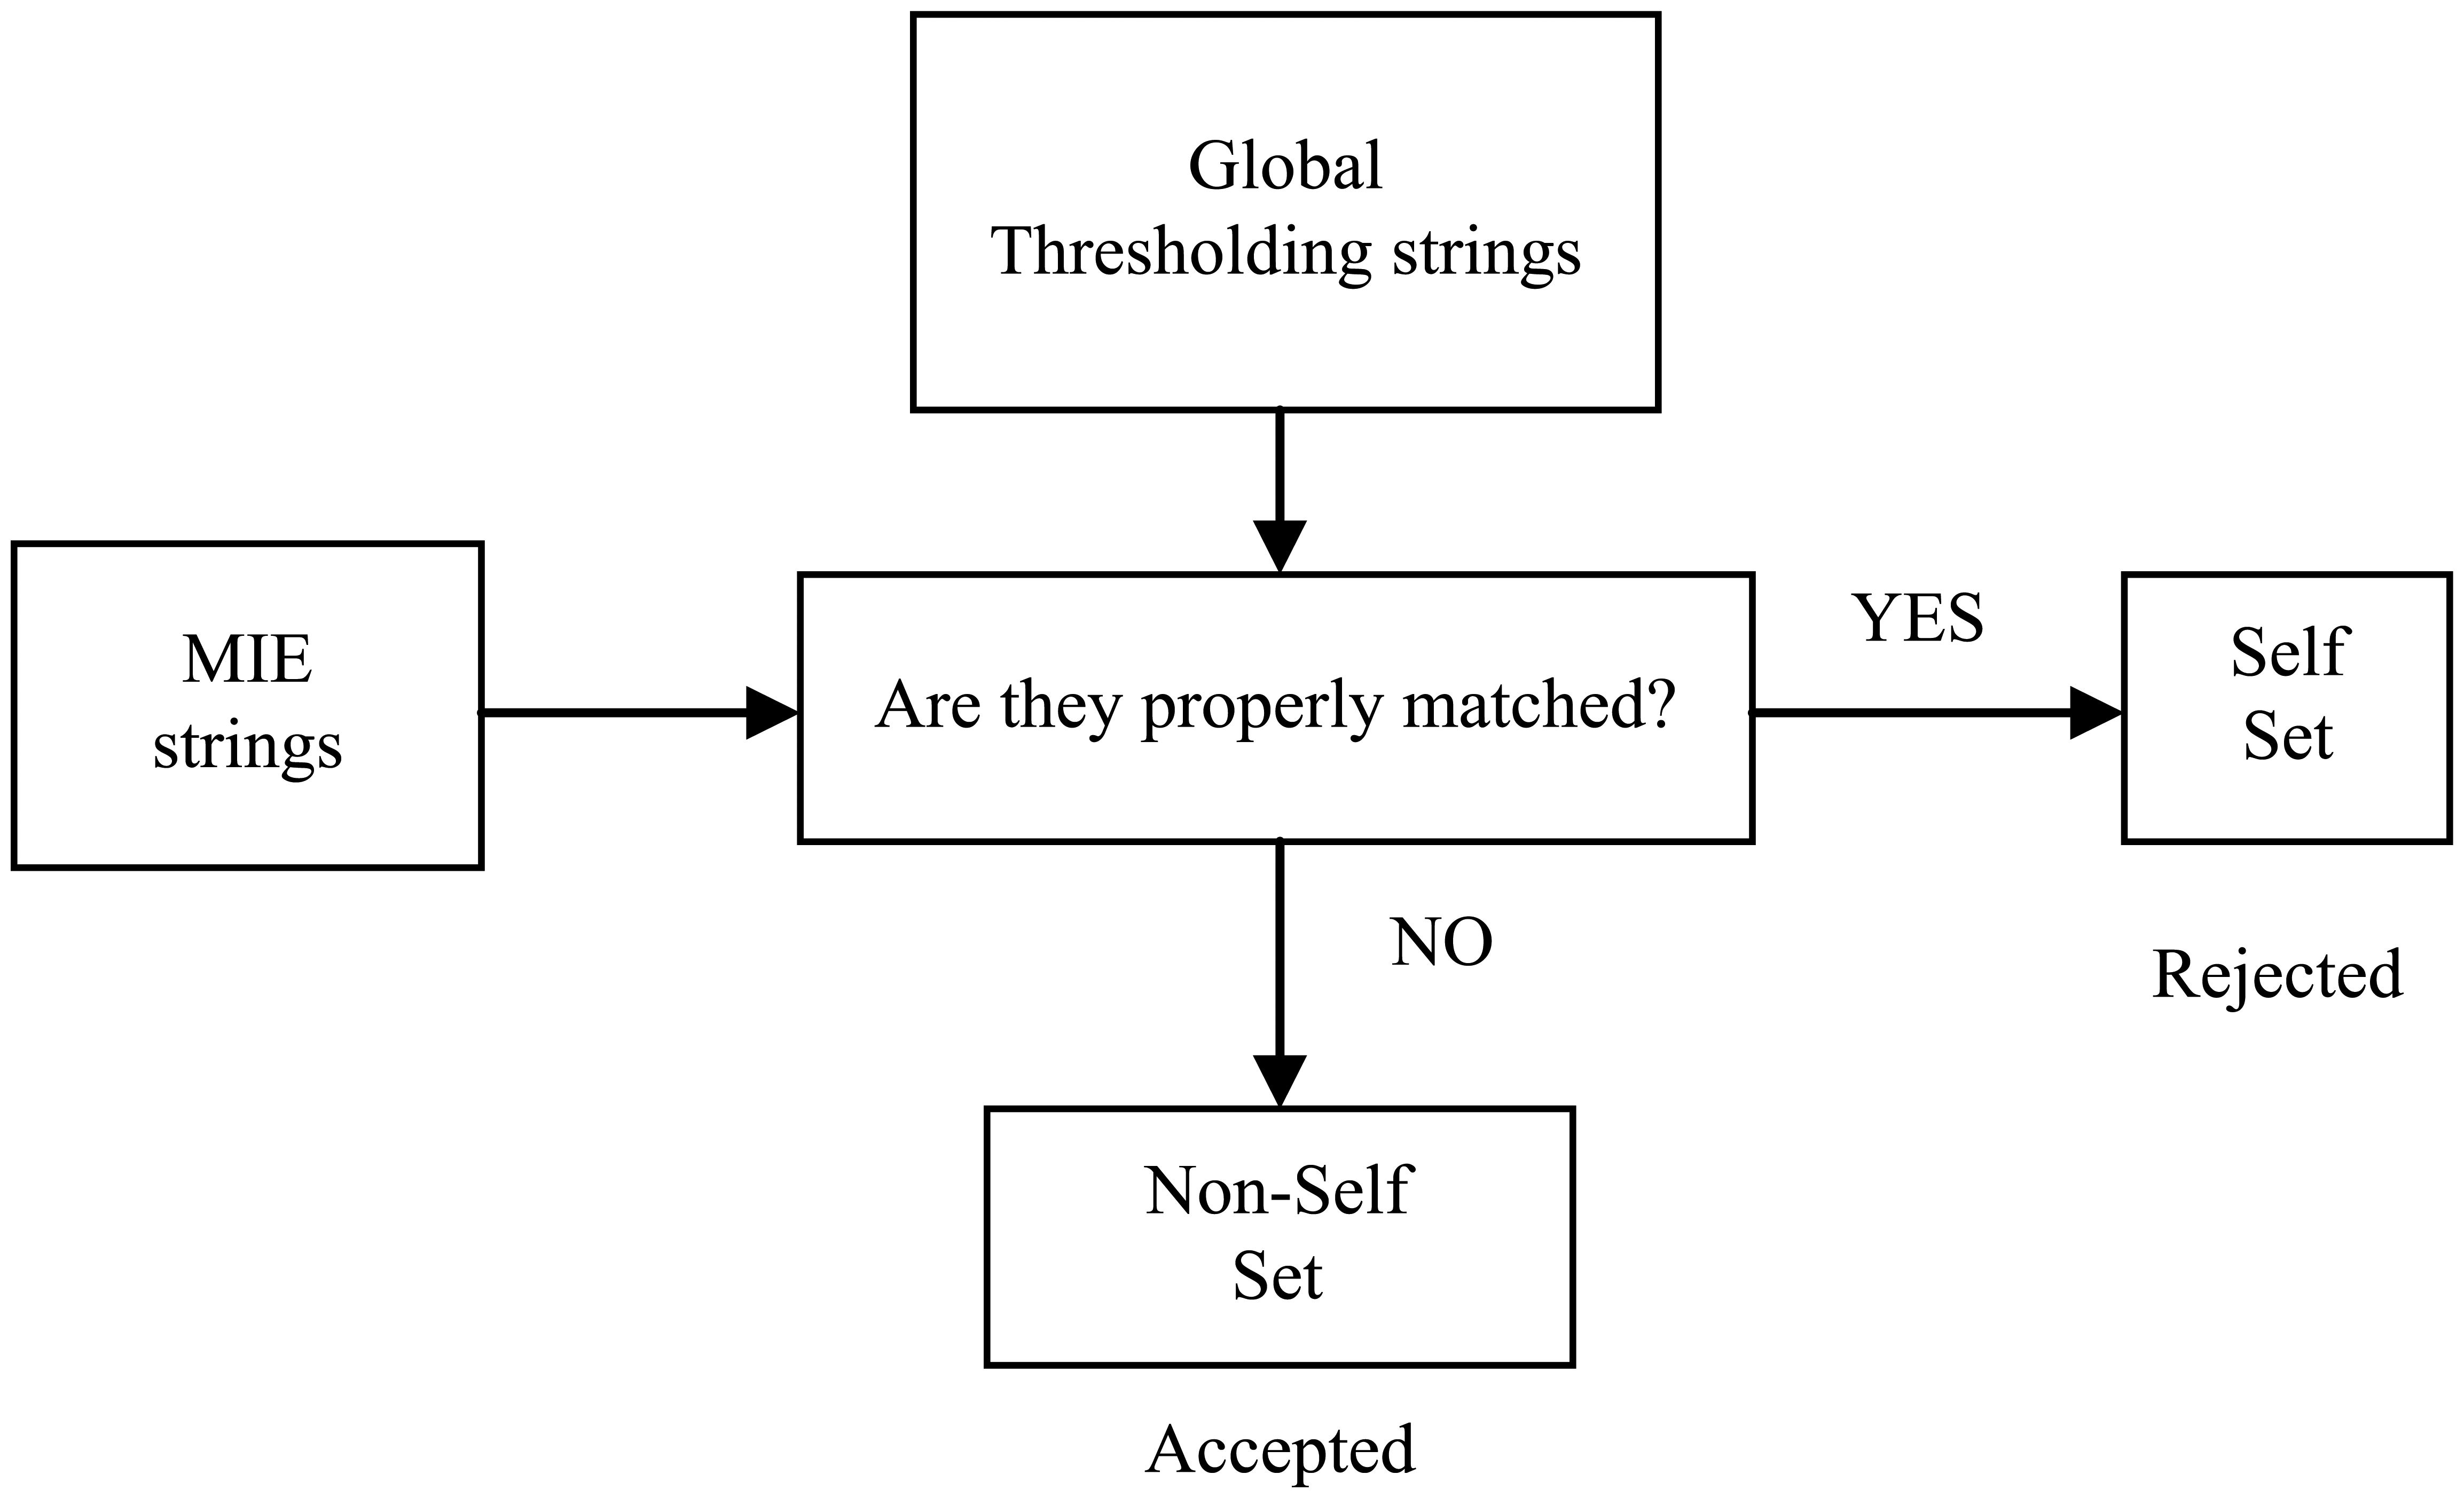
Process of discrimination of self from non-self
The generated non-self strings are stored in the detector set “d,” and the location value having same positions of the self string is stored in the variable “m.” The location value of the strings in the detector set is mutated according to the gray scale value of the original image. Histogram peak analysis is done to select the proper threshold value. Once the threshold value is selected, the location value of the detector set corresponding to gray scale value of the strings is mutated. The strings close to 0 (black) change into 0, while those close to 255 (white) change to 1. The location values of the mutated strings in the detector set after the mutation are stored in the variable “m” initialized earlier. The process of mutation is explained in Table 1 .
Mutation of non-self strings
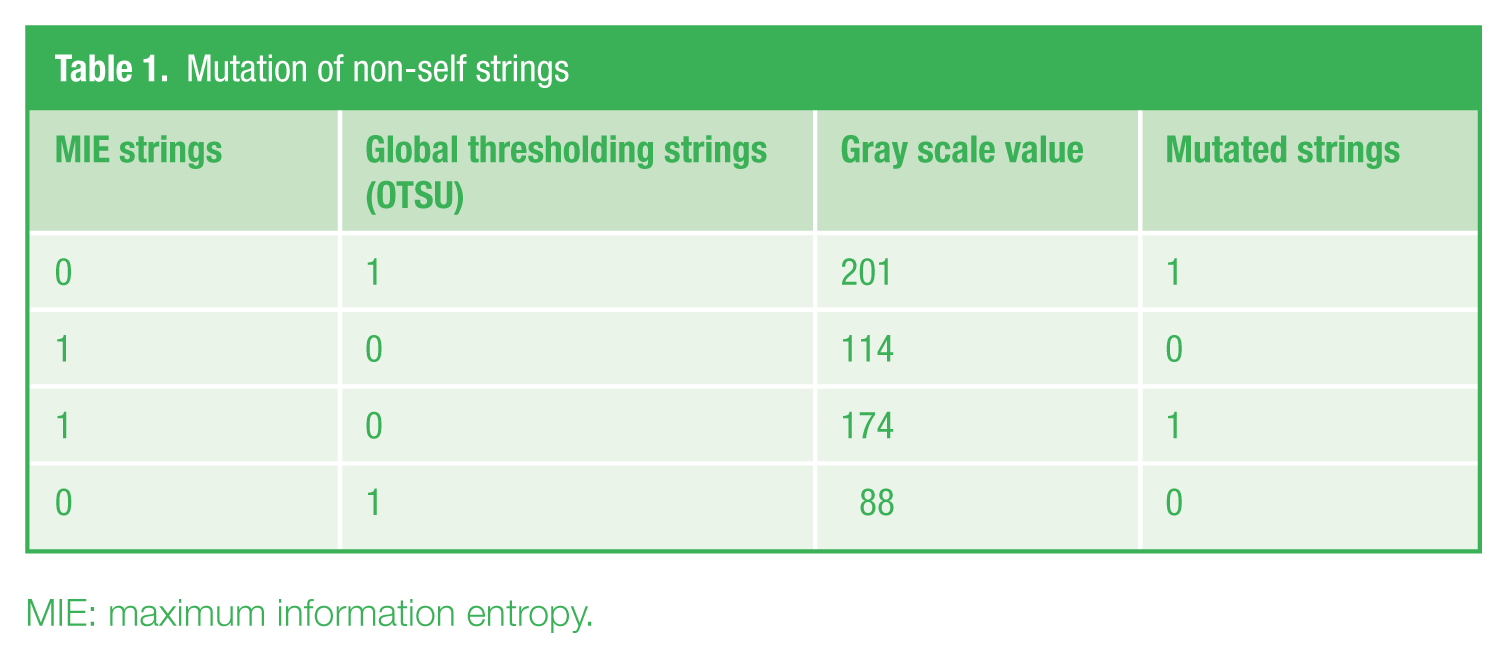
MIE: maximum information entropy.
The improved threshold reference and traversed images of the tool are further processed by applying the white pixel sorting method to determine the pixel coordinates. The distance traversed by the tool in pixels was calculated using the Euclidean distance technique from the extracted pixel coordinates. Finally, the distance in pixels was converted into real-world units by computing the product of one pixel dimension in real-world unit and the number of pixels traversed by the tool. The feedback system was implemented to compensate any error generated by comparing the actual distance and distance traversed by the tool.
Unknown tool position calculation
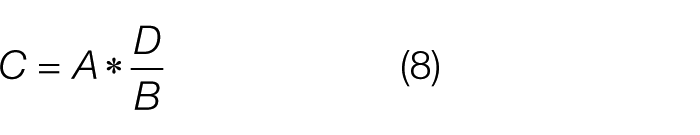
The determination of the unknown movement of tool using vision system is the main aim of this paper. Initially, the whole setup is calibrated. After moving the tool for a known distance, the distance traveled by tool and the error are calculated from the images. It was observed that there was a constant repeatability in the error. Using error repeatability, minimum vision-based movement of the tool, and minimum observed error, probable error is computed. Probable error may be positive or negative and is a deciding factor for calculating the unknown movement of the tool that is added or subtracted with image-based movement. The mathematical formulations for determining the unknown movements are as follows:
If
A = Image-based movement of tool (in mm) calculated from reference and moved image
B = Minimum vision-based distance traveled by tool, that is, 0.2548 mm in this case
D = Minimum observed error in B, that is, (Minimum vision-based distance traveled by tool − Actual distance to be traveled by the tool i.e. 0.25 mm in this case)
C = Probable observed error in mm
then
or


C. GUI
GUI of the verification system has been built using the available GUI builder in MATLAB software package that makes the whole system interactive and user friendly. Figure 5 shows the developed GUI layout design. The developed GUI shows processes like calibration value, thresholding, feedback system, and all the results.
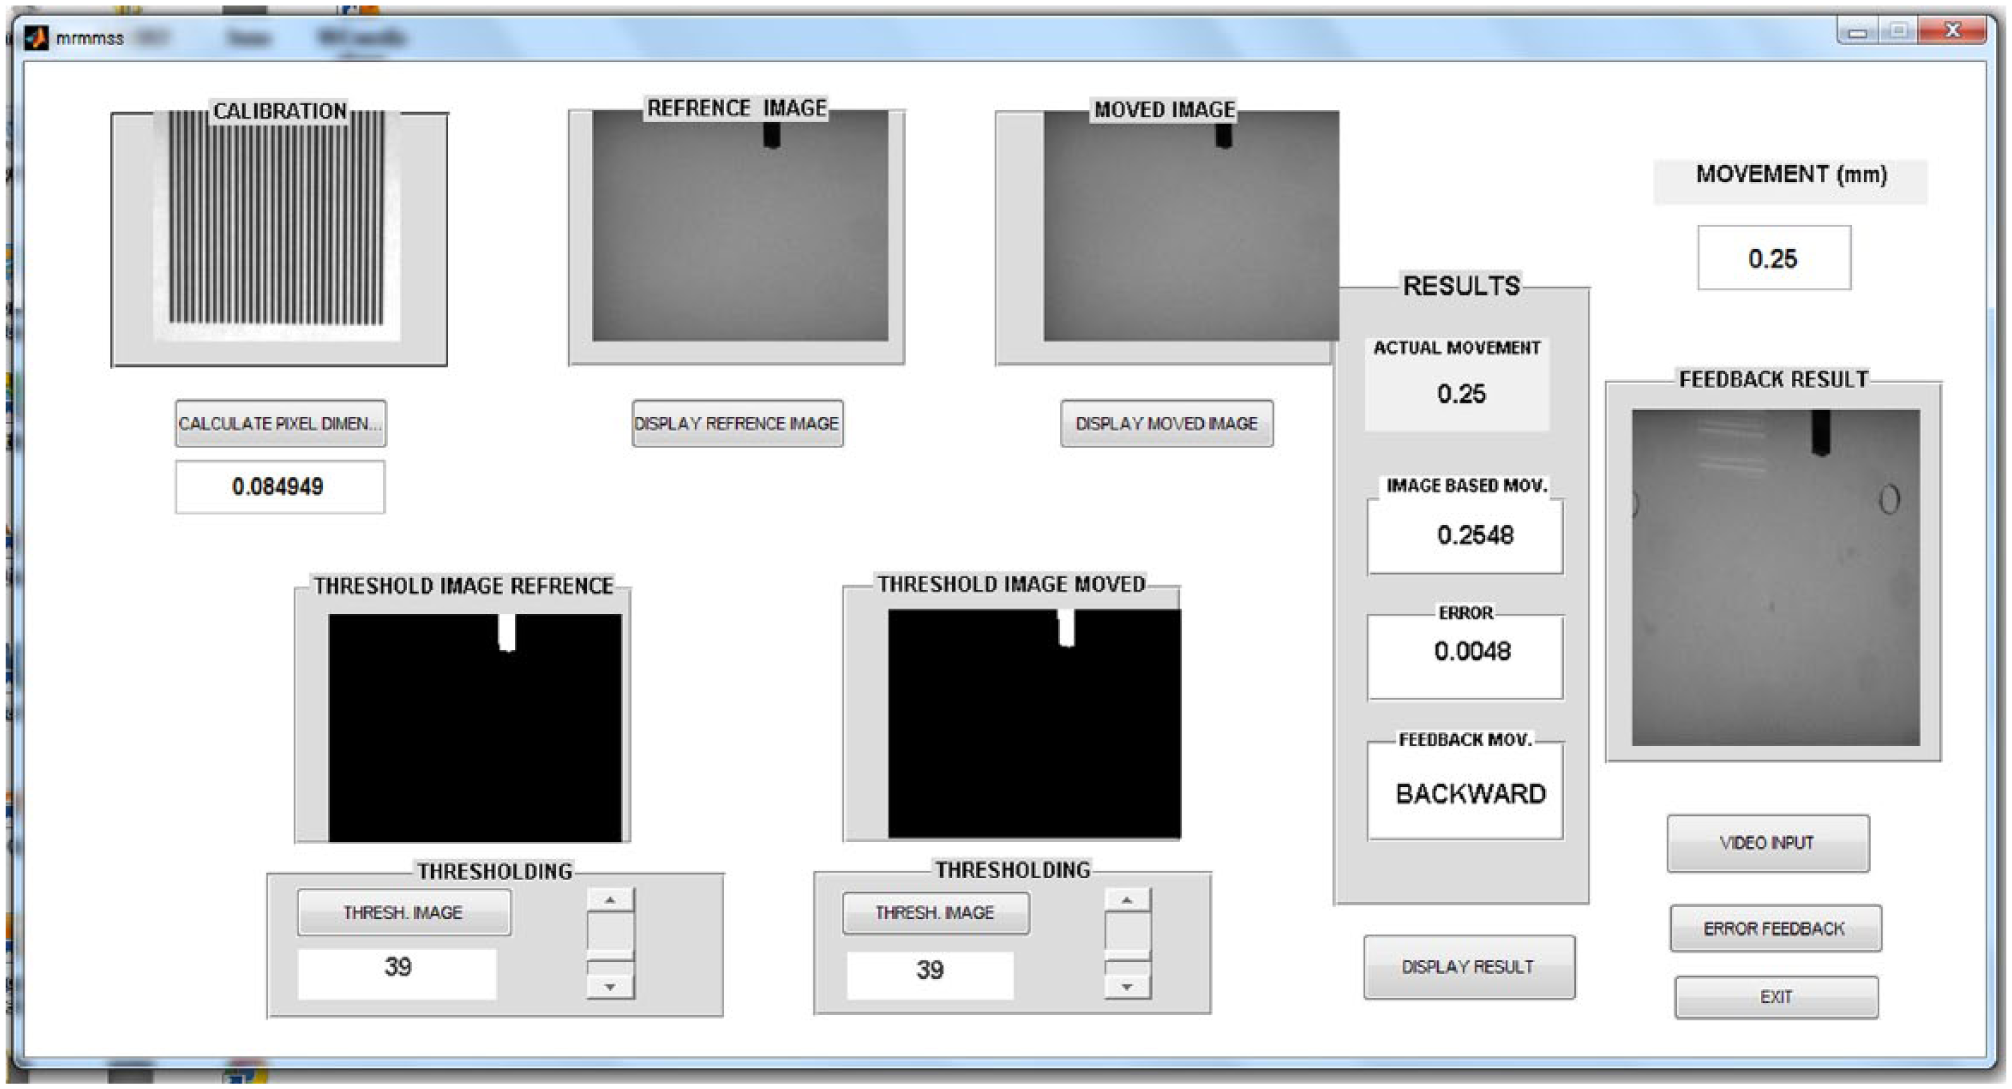
GUI layout design
First, the GUI initializes with “Calculate pixel dimension” push button switch for selecting the EO reference grid image stored in the computer hard disk drive. This displays the calibrated pixel dimension in millimeter (mm) in a static text window. Two other push buttons are used for selecting images from hard drive—one reference and the other is the image of the moved tool. Automatic threshold selection along with sliders is provided for customizing threshold value selection. This shows the real-time changes in the thresholded images in the image windows. There are five static and one edit text window for displaying the values. Static text windows are used to display calculated pixel dimension, actual movement, image-based movement, error, and feedback for movement of tool. Edit text windows are used for feeding the actual movement value. Two separate push buttons are provided, one (Error feedback) for sending the feedback command to the PI micro-positioning system for error compensation and another (Video input) to show the live video stream of tool movement. The error is calculated by subtracting the actual movement from the image-based movement. If the error is negative, it means tool has to move forward, and if it is positive, then tool has to move backward. An additional exit push button was also created to terminate the whole process.
IV. Results and Discussions
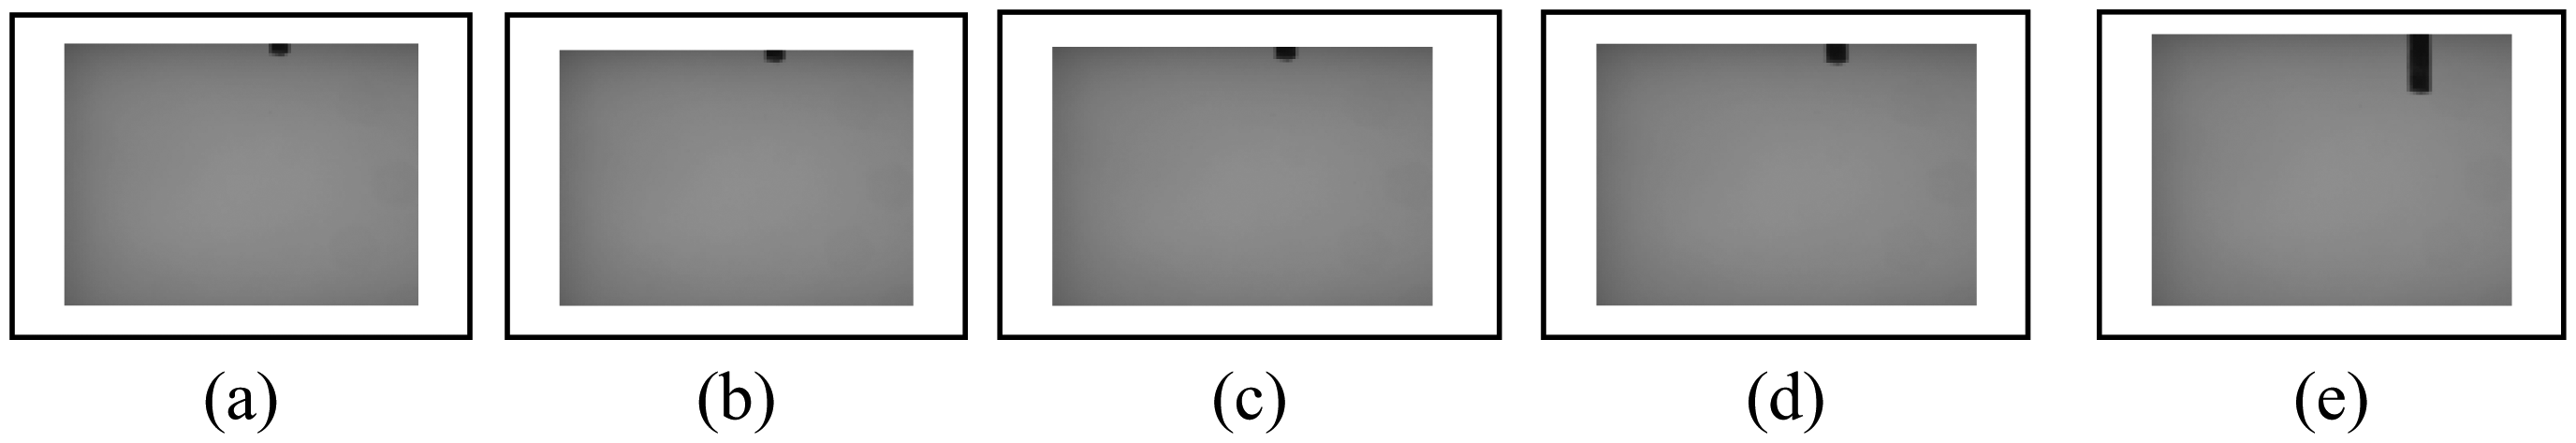
The results obtained from experimental setup on a lathe tool correlate well with those obtained using conventional techniques like sensors and laser interferometer. Both theoretical deductions and experimental trials have proved that the novel vision-aided tool positioning system is robust and feasible for achieving precision upto micrometer. There were several experiments performed on the lathe tool. Images were captured with a resolution of 0.25 mm movement in horizontal, vertical, and both directions from 0.25 to 14.99999 mm to detect the error ( Figures 6 – 8 ) with same LED backlight light conditions. Because of large number of images, only a few typical images are shown here.
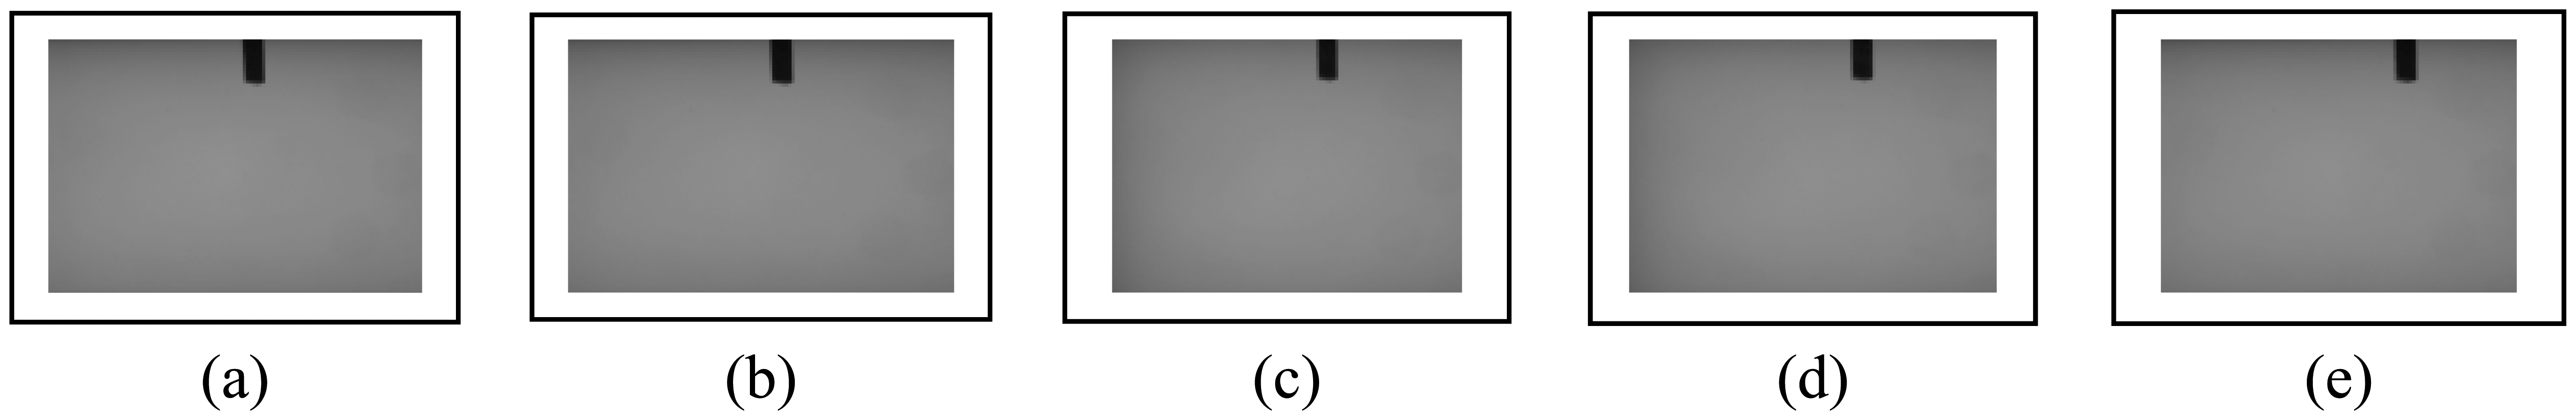
(a) The reference image and (b)–(e) the images of tool positions traveled in horizontal direction from 0.25 to 14.99999 mm in steps of 0.25 mm
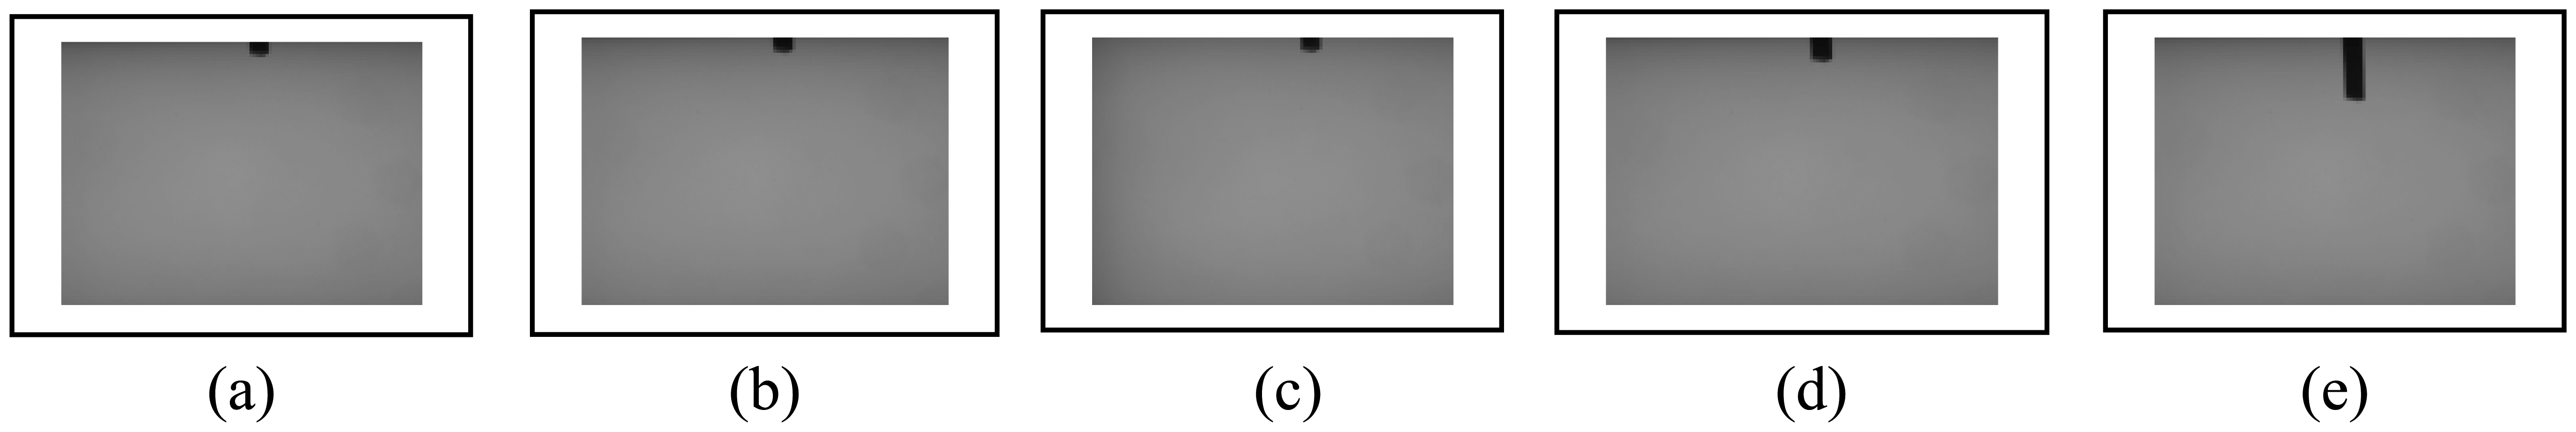
(a) The reference image and (b)–(e) the images of tool positions traveled in vertical direction from 0.25 to 14.99999 mm in steps of 0.25 mm
(a) The reference image and (b)–(e) the images of tool positions traveled in vertical as well as horizontal directions from 0.25 to 14.99999 mm in steps of 0.25 mm
From the experiments, it was verified that the error repeatability for 0.25 mm movement is 0.0048 mm, which is same for different experiments as shown in Tables 2 – 4 .
Conversion of pixels into real-world dimension for the tool movement in horizontal direction
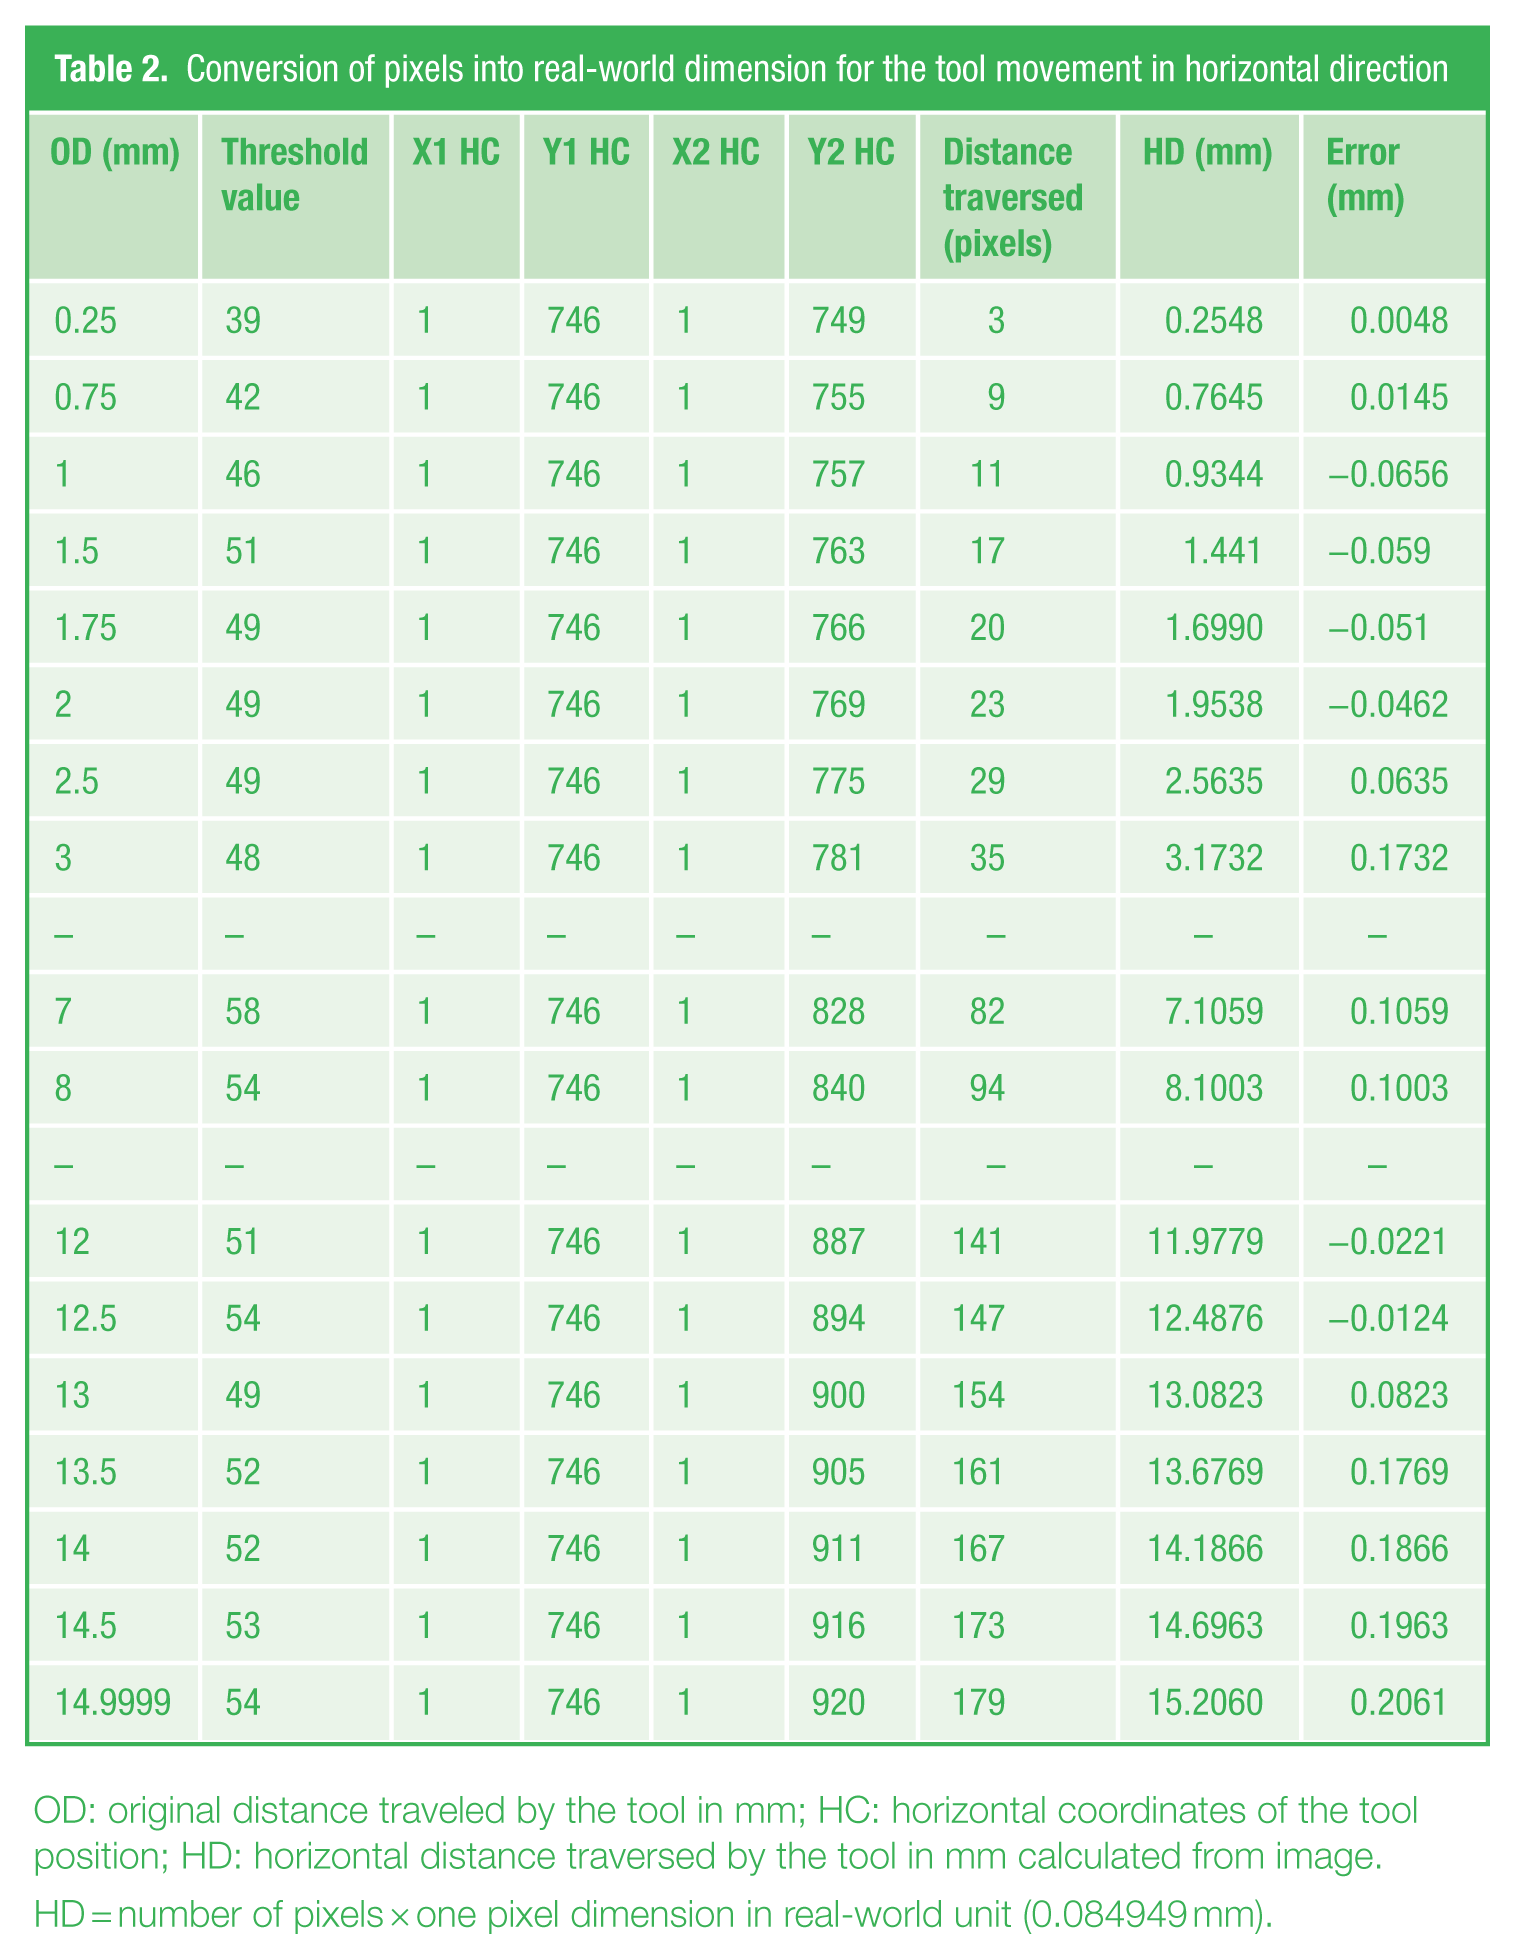
OD: original distance traveled by the tool in mm; HC: horizontal coordinates of the tool position; HD: horizontal distance traversed by the tool in mm calculated from image.
HD = number of pixels × one pixel dimension in real-world unit (0.084949 mm).
Conversion of pixels into real-world dimension for the tool movement in vertical direction
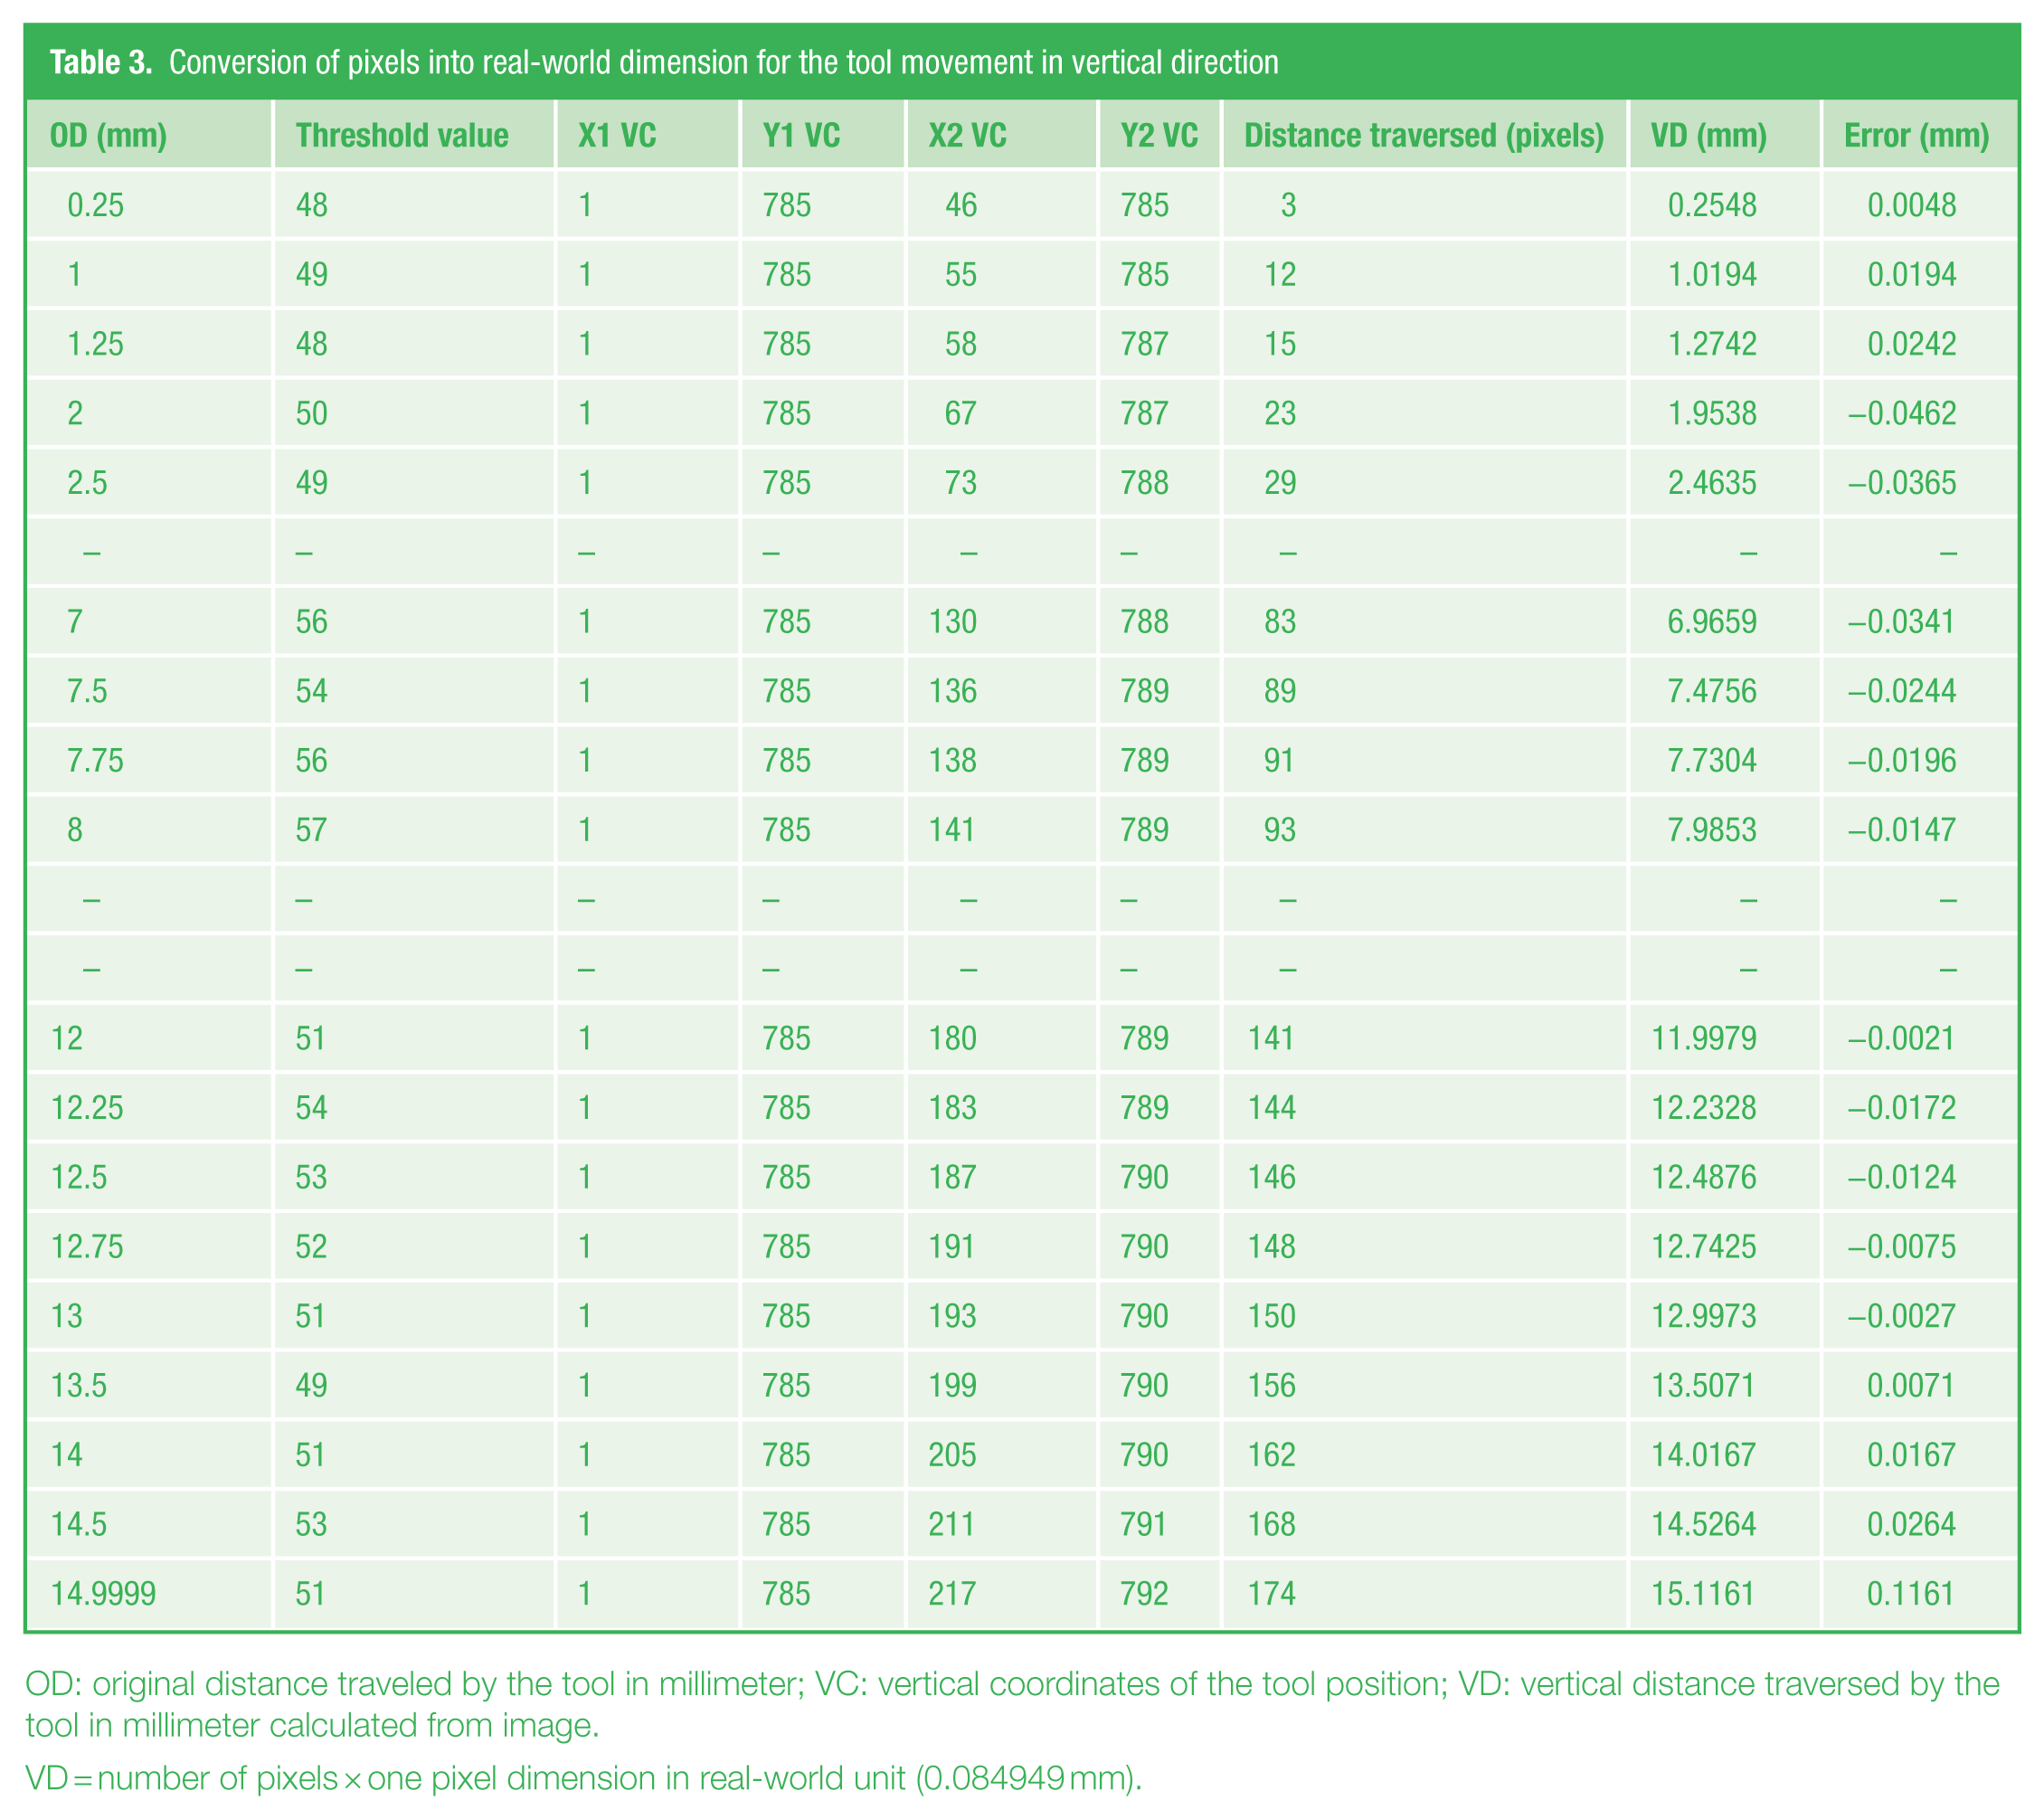
OD: original distance traveled by the tool in millimeter; VC: vertical coordinates of the tool position; VD: vertical distance traversed by the tool in millimeter calculated from image.
VD = number of pixels × one pixel dimension in real-world unit (0.084949 mm).
Conversion of pixels into real-world dimension for the tool movement in horizontal and vertical directions
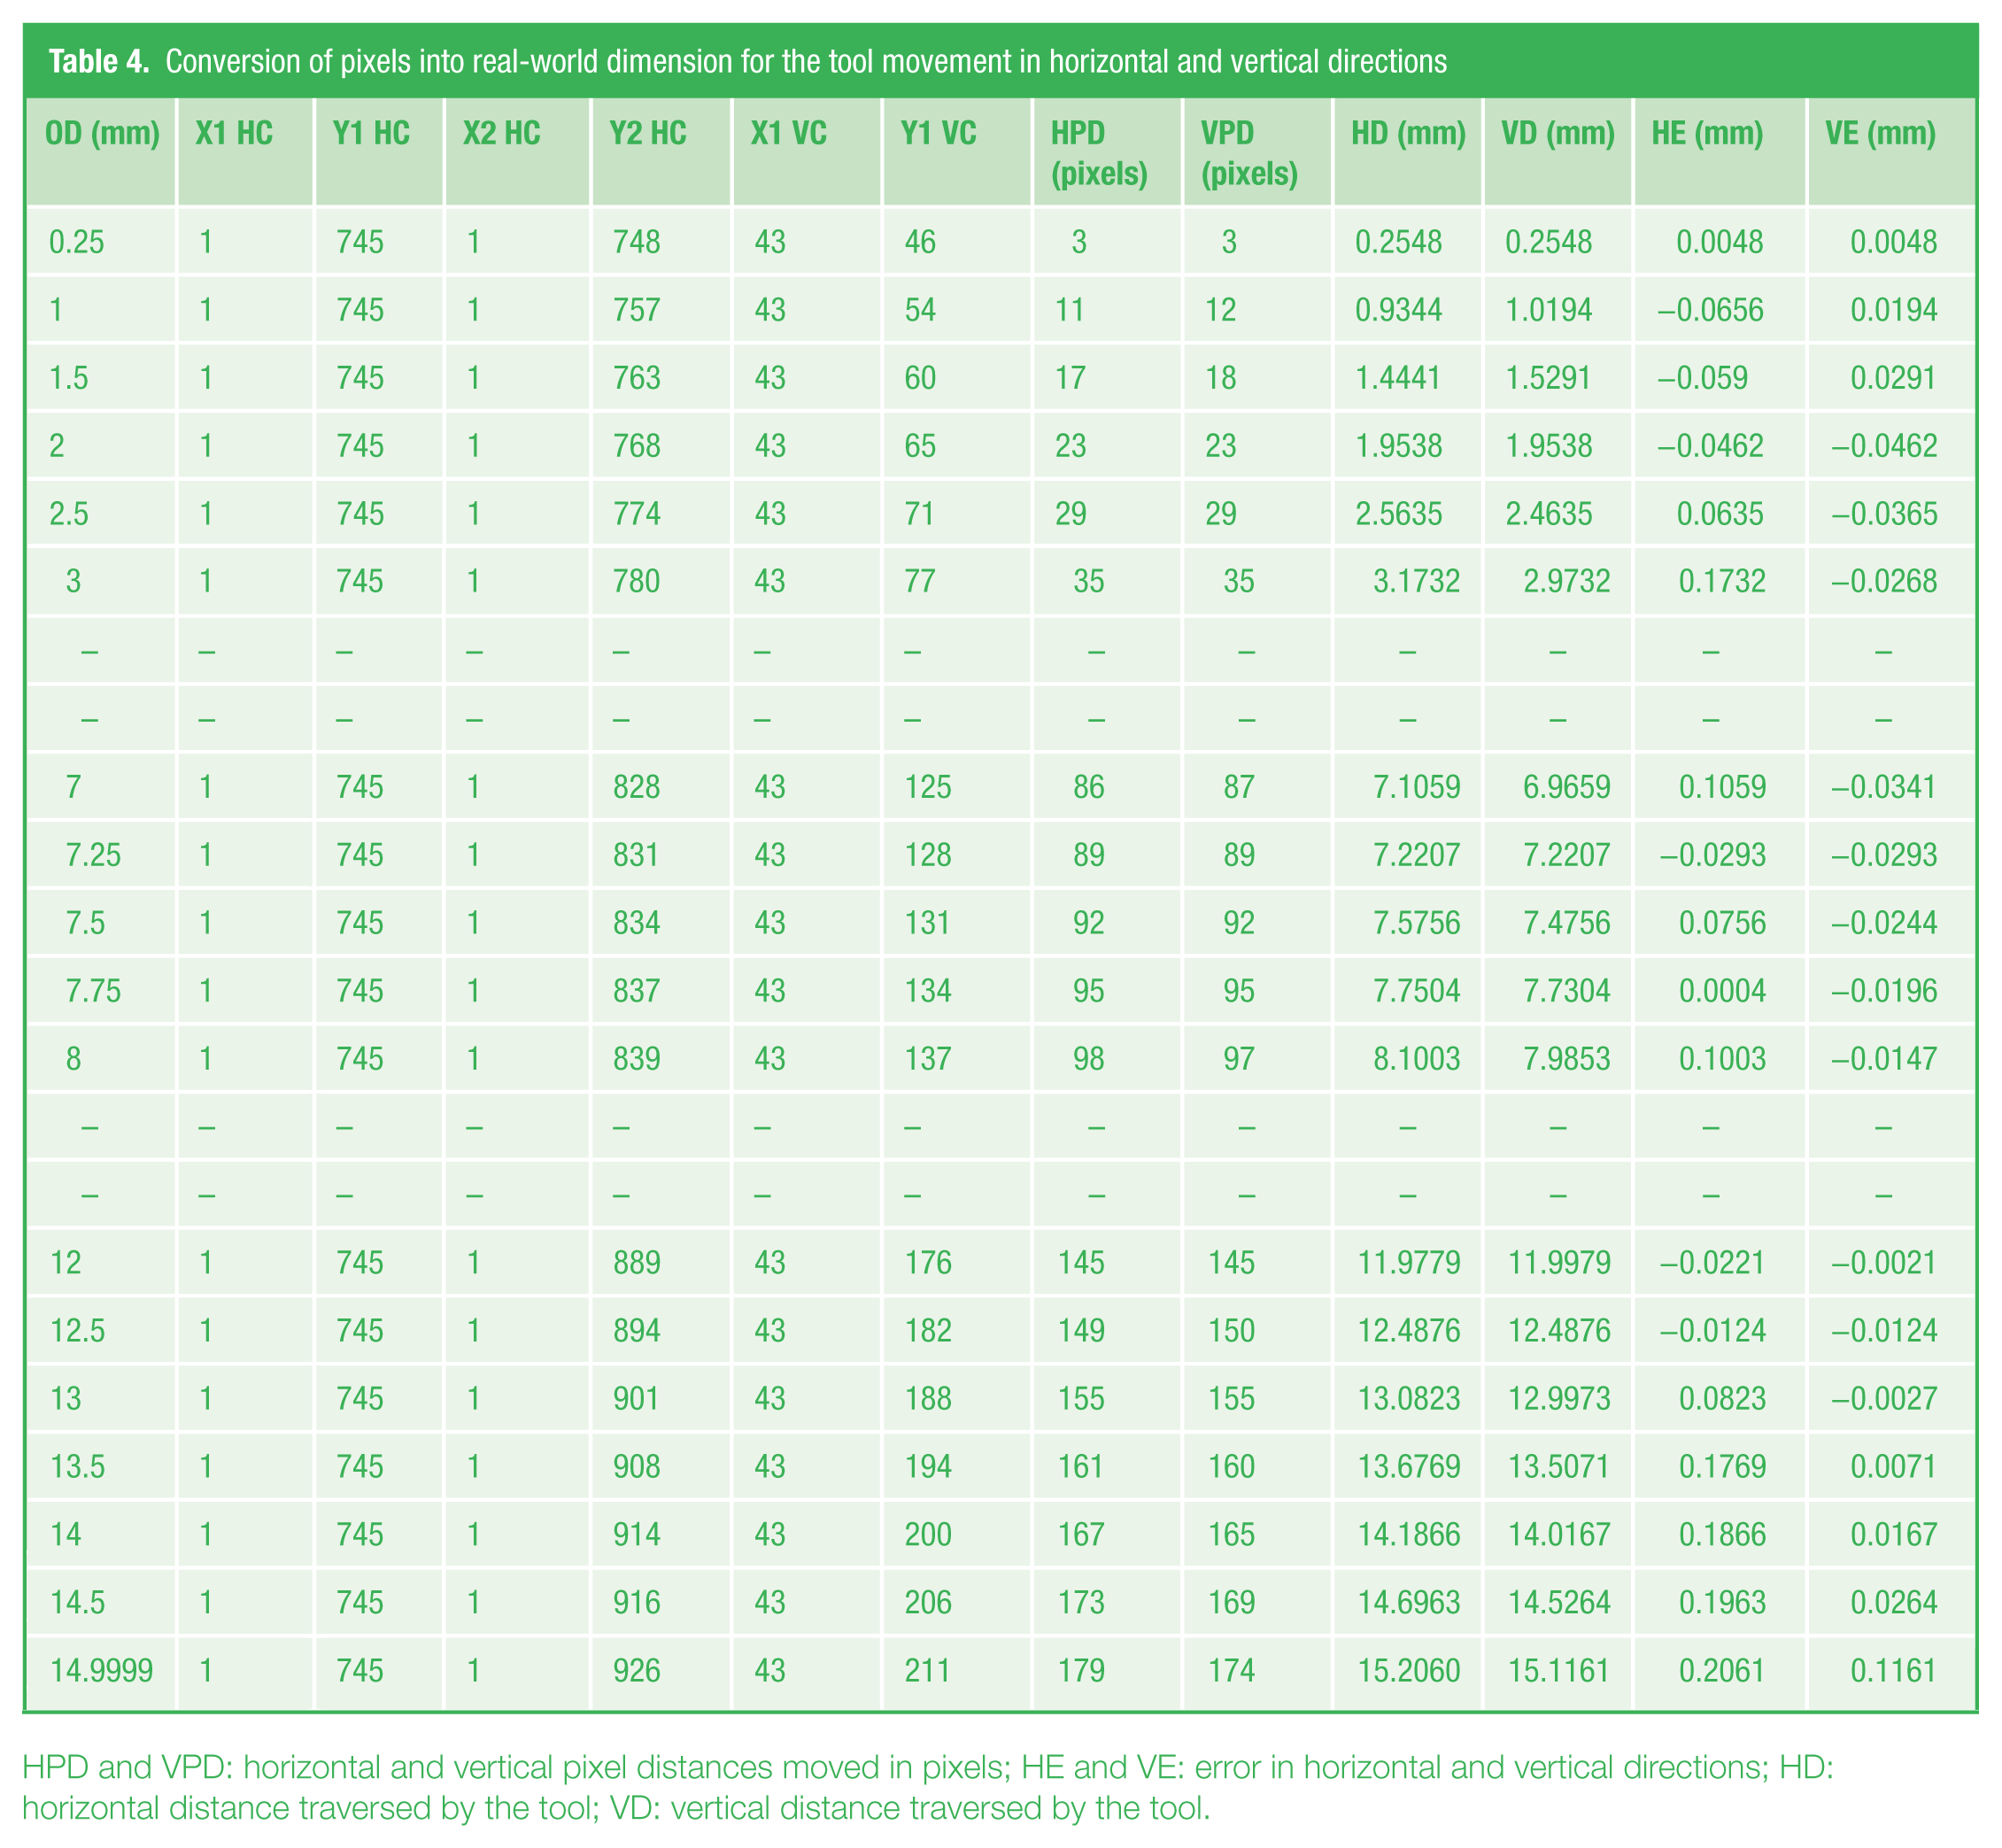
HPD and VPD: horizontal and vertical pixel distances moved in pixels; HE and VE: error in horizontal and vertical directions; HD: horizontal distance traversed by the tool; VD: vertical distance traversed by the tool.
Using this error value, the unknown distance traveled by the tool is calculated from equations (9) and (10). The graphical representation of actual versus image-based movement of tool for horizontal and vertical directions is as shown in Figures 9 and 10 .
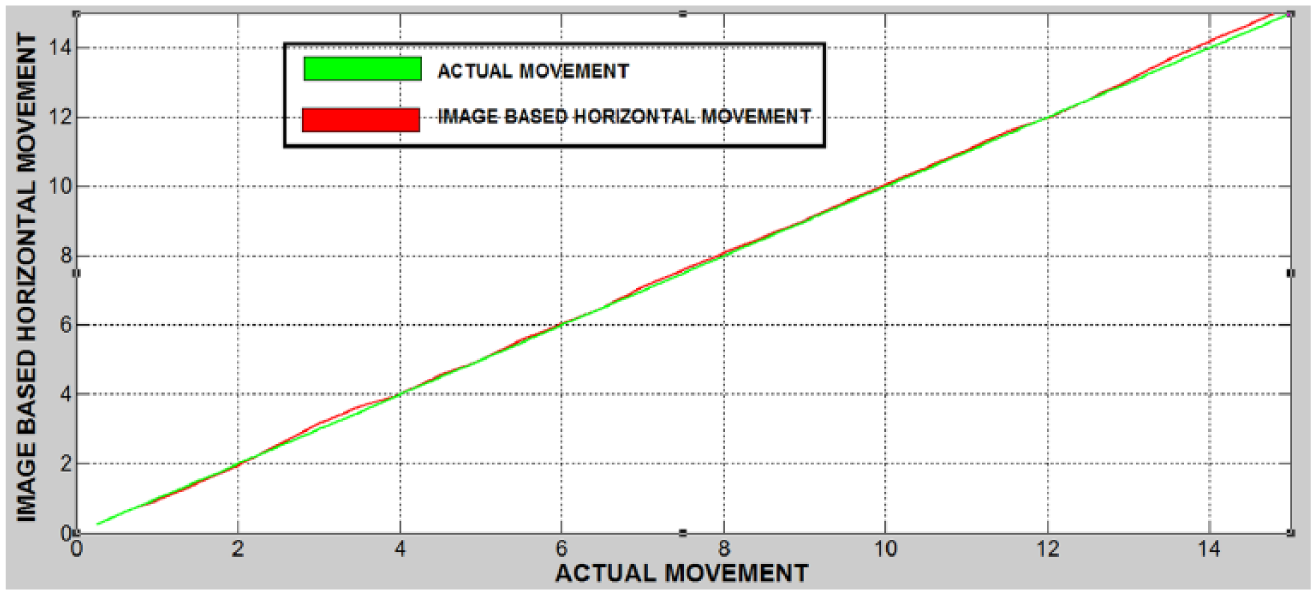
The graph of actual movement versus image-based movement in horizontal direction
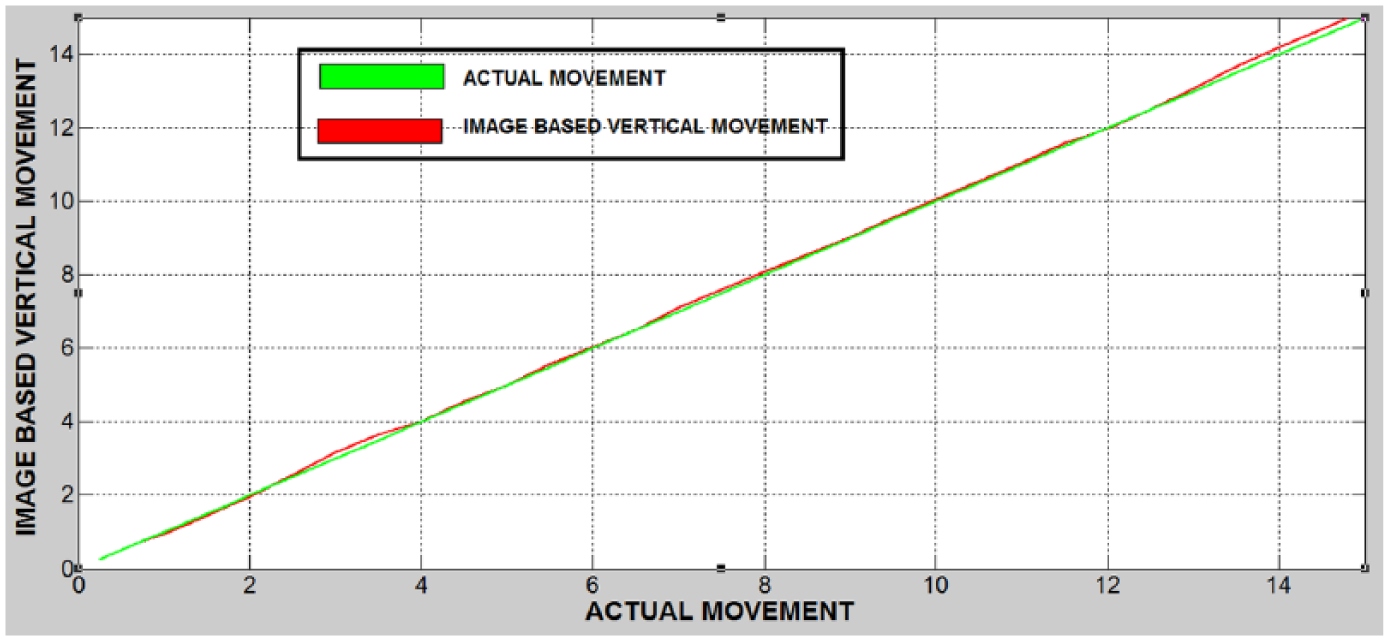
The graph of actual movement versus image-based movement in vertical direction
In addition, to check repeatability and accuracy of the results, standard deviation and average value of different experiments performed in horizontal direction are shown in Table 5 . Experiments were performed on lathe tool for different movements of tool ranging from 0.5 to 14.99999 mm. It may be noticed from Table 5 that the average value of movement in these five experiments is almost constant for different movements.
Standard deviation and the average value of the different experiments performed in horizontal direction

Exp.: experiment.
The standard deviation gives the information about the values of the data set that deviate from the mean value. It was also found that mean squared error (MSE) is 0.018502. The graph for mean value and error is shown in Figure 11 . Similar experiments can also be performed for vertical direction.
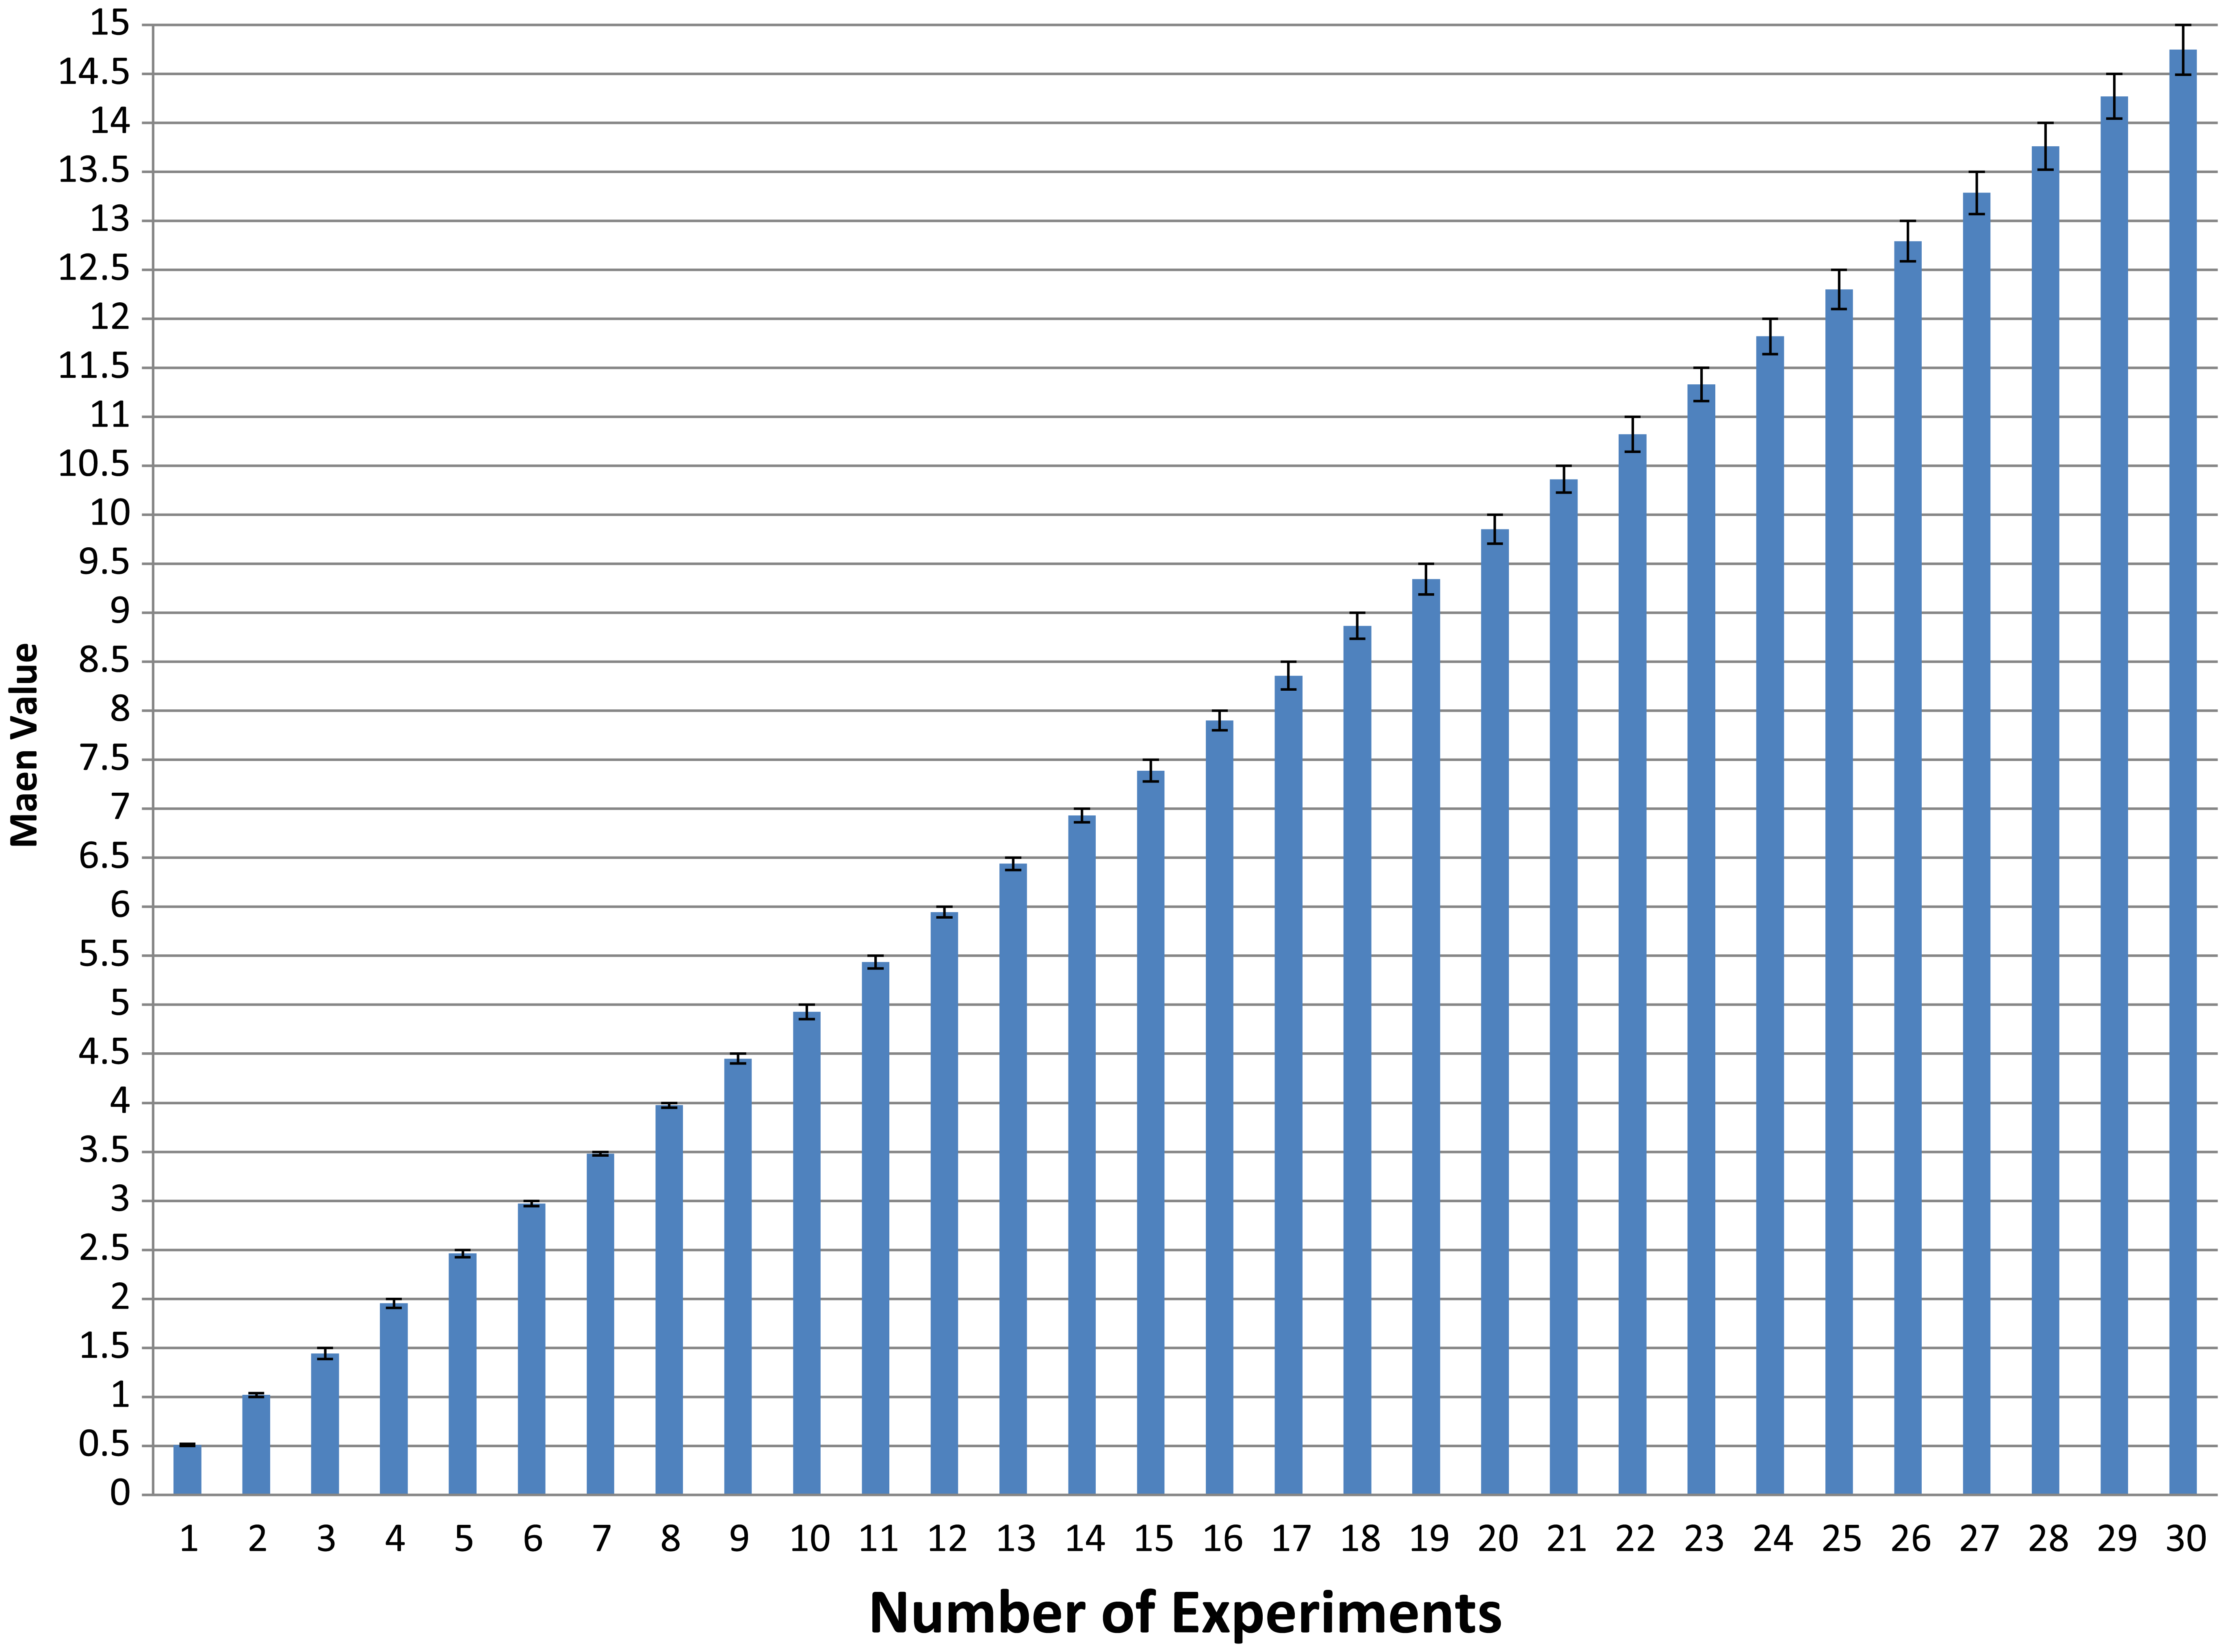
Graph of mean value and error for different tool movement (mm)
V. Conclusion and Future Work
The main aim of this work was to develop a non-contact-based tool position and verification system that can be used for various industrial applications. At the same time, the other motive was to make this precise tool position verification more user friendly and automatic for better results. An experimental machine vision–based tool positioning and verification system having 250 µm resolution has been described. It has been found that the system is robust and comparable to the conventional systems like sensor-based system.
The resolution of the system can be improved by using a higher magnifying lens available from different manufacturers. The errors can be reduced further using different bio-inspired computing techniques and its hybridization such as particle swarm optimization (PSO) and AIS. 29 The algorithms for image thresholding, 27 enhancement, 30 and error optimization may be incorporated in this developed GUI in future for more accurate tool positioning.
Footnotes
Funding
This work is supported by the Council of Scientific and Industrial Research (CSIR, India), New Delhi, under the Network programme (NWP-30) in collaboration with CSIR-CMERI, Durgapur.