
Abstract
Design of an adaptive calibration technique using an optimized artificial neural network for liquid-level measurement is discussed in this paper. The objective of the present work is to design and validate an adaptive calibration technique so as (1) to extend the linearity range of measurement to 100% of full-scale input range and (2) to make the measurement technique adaptive of variations in tank diameter, permittivity of liquid, liquid temperature, and to achieve objectives (1) and (2) using an optimized neural network. An optimized artificial neural network is a network having least possible number of hidden layers to achieve minimum mean square error between outputs and targets by comparing various algorithms, schemes, and transfer functions of neuron. The output of capacitance level sensor is capacitance. A data conversion unit is used to convert it to voltage. A suitable optimized artificial neural network is designed and used in place of conventional calibration circuit. The proposed technique is tested with simulated data and validated with practical data. Results show that proposed technique has fulfilled the set objectives.
I. Introduction
Liquid level in a storage vessel is one of the important variables that are required to be measured and controlled in any process industry. The liquid properties such as buoyancy, pressure at a depth, relative electrical permittivity, electrical conductivity, thermal conductivity, absorption of radiation, and liquid surface reflection of sound or light waves are related with the liquid level. These properties of liquid level are used to design different inferential types of liquid-level transducers such as float, displacer, pressure sensor, capacitance probe, and partially immersed resistance wire probes. Of these, contact type level sensing probes are the most commonly used because of their higher sensitivity, less power dissipation, and ruggedness in design. However, in a capacitance sensor, the problem of offset and high nonlinear response characteristics as well as dependence of output on the permittivity and temperature of liquid has imposed restriction and difficulties in use of such sensors.
Literary survey suggests that in Wen et al., 1 liquid measurement by charge coupled devices is discussed using lookup table programmed on a field-programmable gate array (FPGA). Level measurement using thermal resistance measurement in Lazuardi 2 is discussed with a Fast Library for Approximate Nearest Neighbors (FLANN) algorithm. A method of capacitance level measurement calibrated using lookup table coded on a micro controller is discussed.3–5 Calibration of capacitance level sensor (CLS) is discussed in Terzic et al. 6 using a back propagation algorithm; compensation for effect of temperature is achieved using one redundant sensor. Calibration by fast Fourier transform for level measurement using acoustic wave and radiation sensor is discussed in Jianjun and Xiaobin, 7 Zhi et al., 8 Chen et al., 9 Gerding et al., 10 and Jeffries et al. 11 A radiation method of level measurement is discussed in Hampel et al. 12 and calibrated using artificial neural network (ANN) algorithms. Optical method of level measurement is discussed in Musyev and Karlik 13 and calibration is done using polynomial equation. In Jeffries et al., 14 Doppler method of level measurement is given and calibration is achieved using digital signal processing (DSP) algorithm. In Freeman, 15 linearization of resistance temperature detector (RTD) is discussed using ANN algorithm.
ANNs are broadly used in a wide range of applications such as signal and image processing, pattern recognition, 16 control systems, 17 and recently instrumentation. 18 Because of nonlinear characteristics of ANN, these are very useful in solving complex problems more accurately than linear techniques. So, a method has been proposed in this paper using the concept of ANN. The ANN model is added in cascade to a data conversion circuit which is trained to produce the linear relation between the input liquid level and the output of ANN. It is also made intelligent so as to produce the results adaptive of variation in liquid permittivity and/or liquid temperature and/or tank diameter, all within specified ranges.
This paper is organized as follows: after introduction in section “Introduction,” a brief description on CLS and associated data conversion circuits is given in section “Block diagram of level sensing system.” Section “Problem statement” deals with the problem statement followed by proposed solution in section “Problem solution.” Finally, results and discussion are given in section “Results and analysis,” and conclusion is presented in section “Conclusion.”
II. Block Diagram of Level Sensing System
The block diagram of the available liquid-level measurement system with CLS is discussed in Figure 1 .
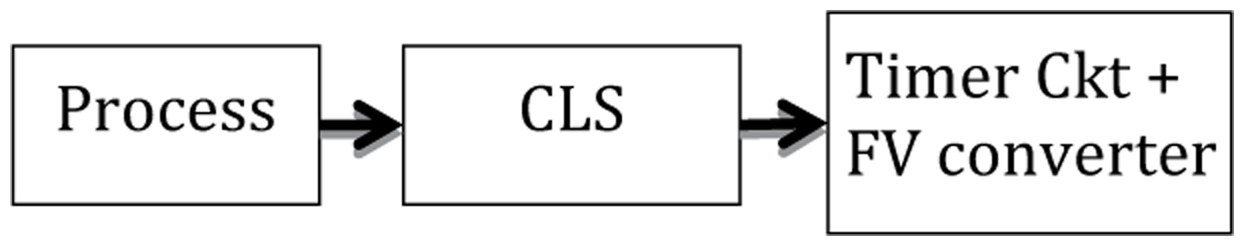
Level measurement system
A. CLS
A level measurement system using CLS is shown in Figure 2 . A capacitor is formed when a level sensing electrode is installed in a vessel. A change in the value of the capacitor takes place because of such change in dielectric between the plates. The capacitance relationship in general is given by the following equation19,20
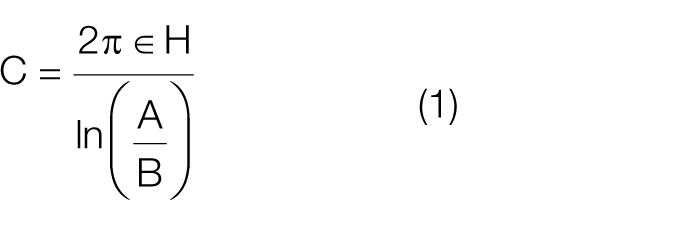
where
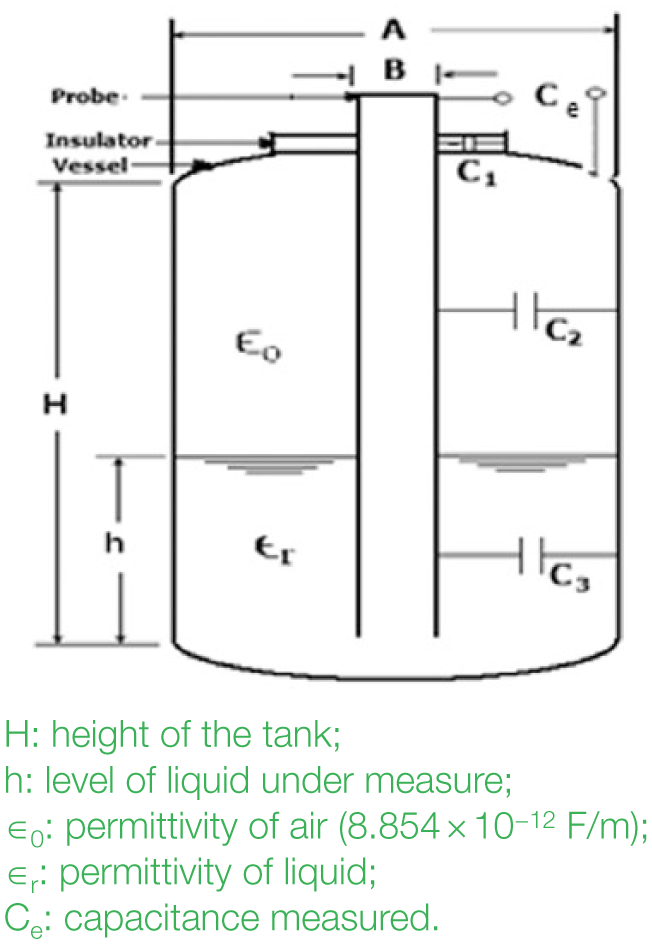
Capacitance level sensor
Now, consider a level measurement system using CLS as shown in Figure 2 .
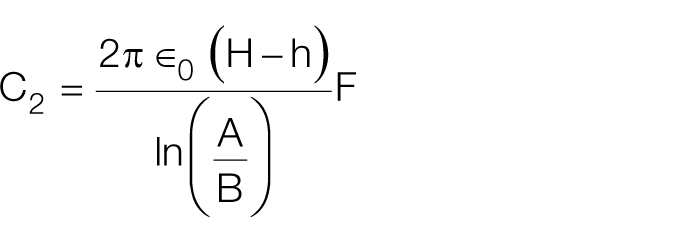
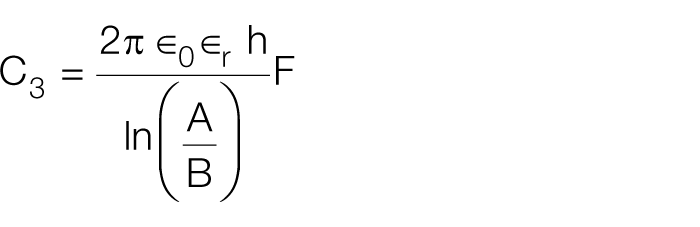
The effective capacitance of level measurement technique using CLS is shown in Figure 3 and its value is given by equation (2)
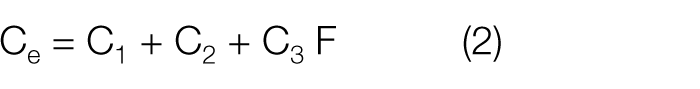
where
Substituting
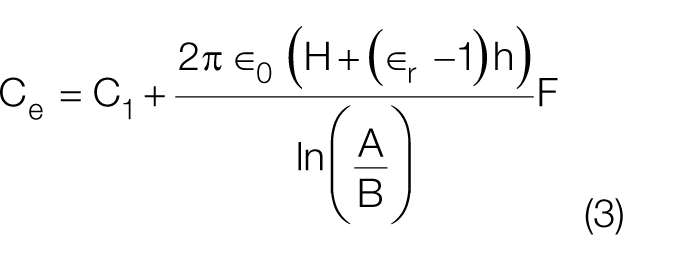
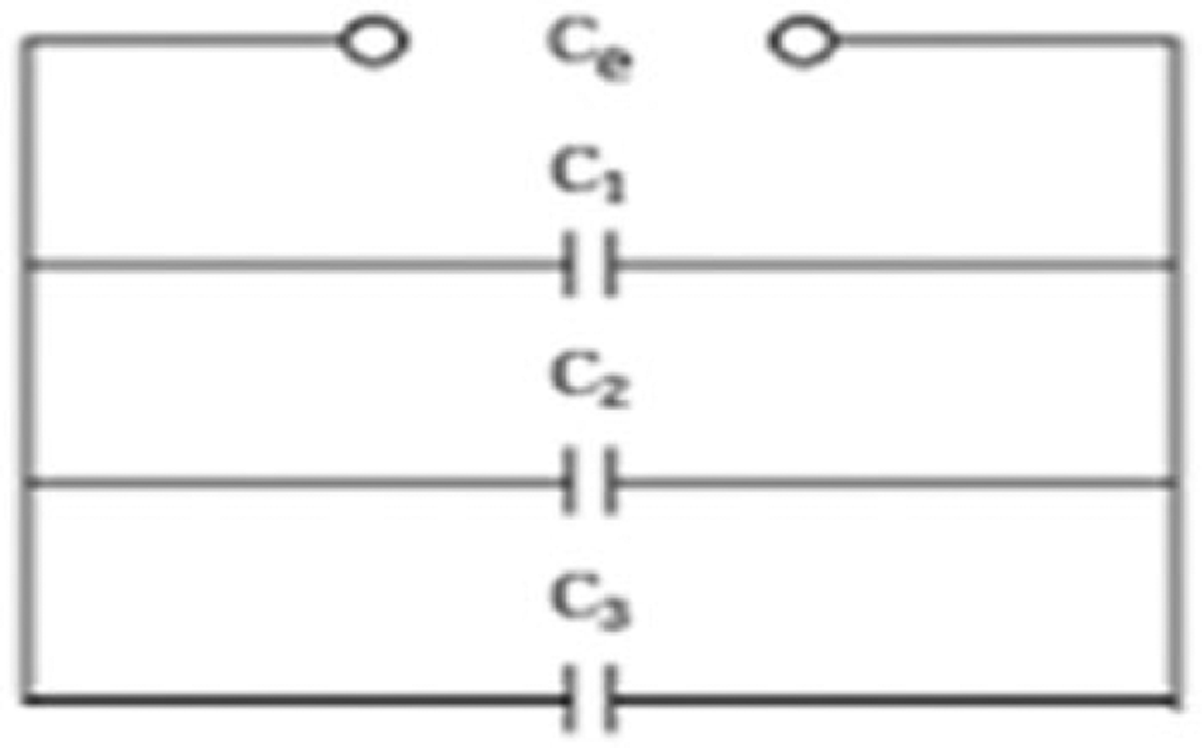
Equivalent capacitance
Capacitance is also a function of temperature, 21 which is shown in equation (4)
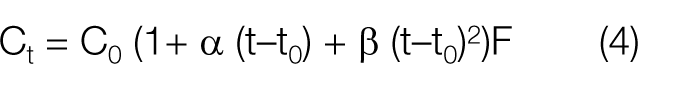
where
B. Timer circuit
An astable multivibrator which produces a “square wave” is shown in
Figure 4
. When capacitor
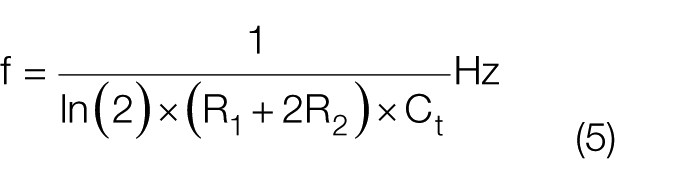
555 as an astable multivibrator
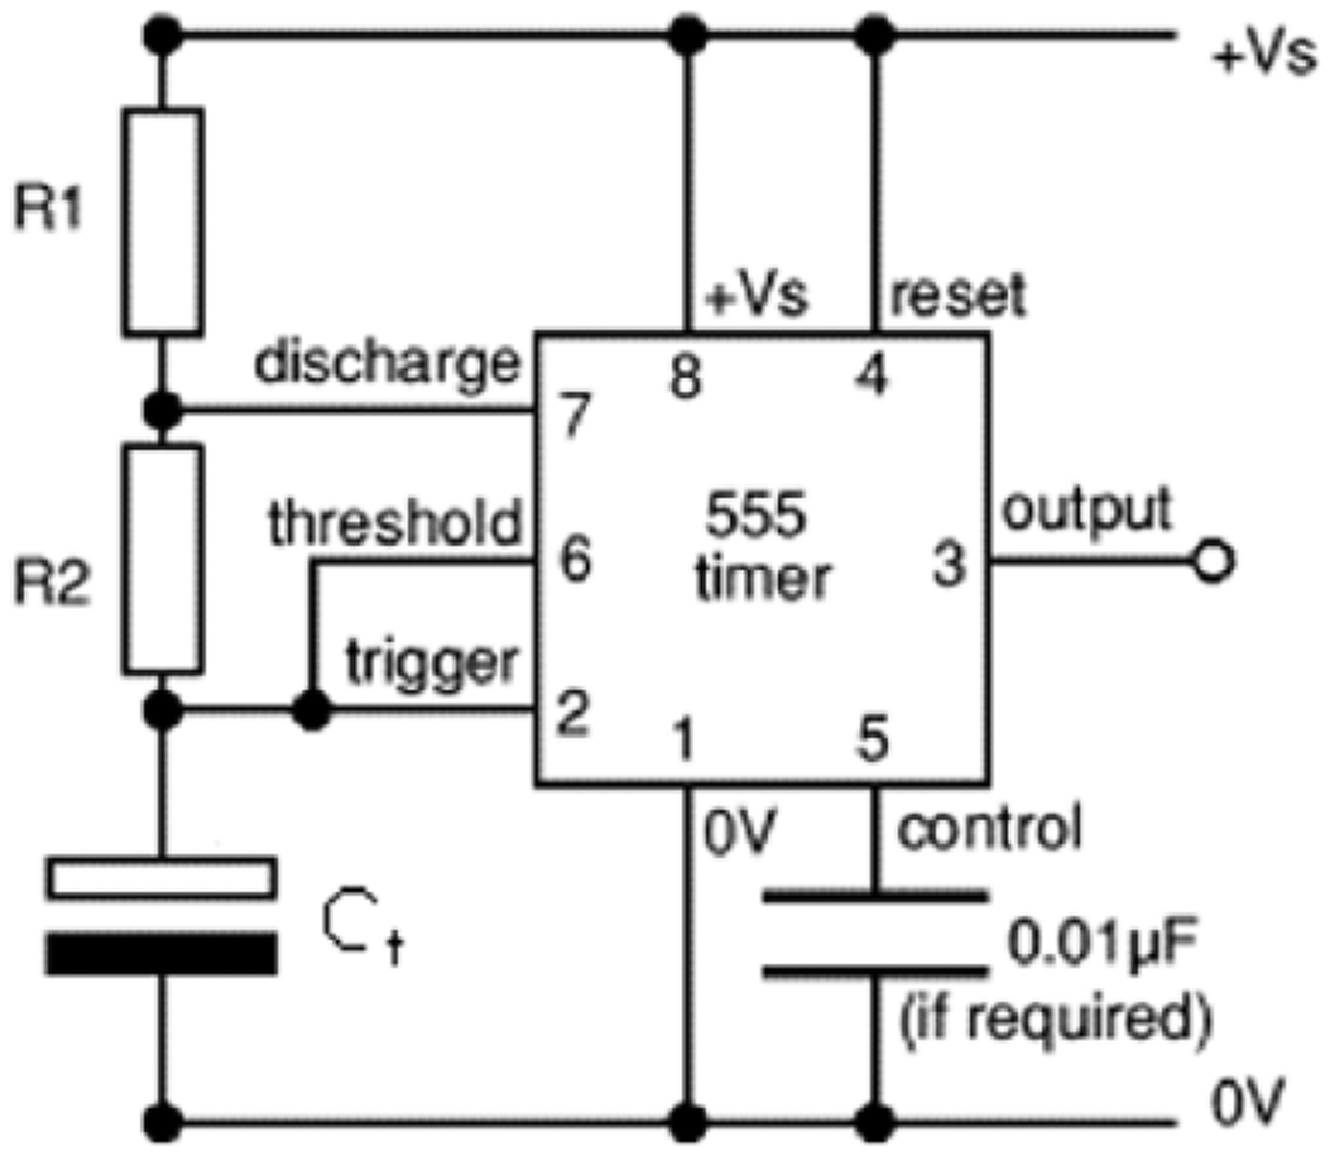
C. Frequency to voltage converter
LM331 is used as the frequency to voltage converter and is shown in
Figure 5
. The frequency to voltage conversion is attained by differentiating input frequency using capacitor
LM331 frequency to voltage converter
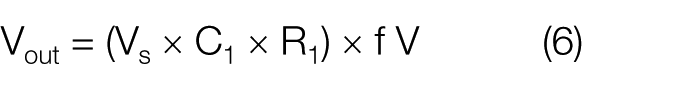
The output voltage is related to input frequency (f) by transfer equation and is shown in equation (6)
III. Problem Statement
The characteristics of CLS for variations in level, tank diameter, liquid permittivity, and temperature of the liquid under measurement are simulated using the MATLAB environment and the following characteristics are found.
Figures 6 – 8 show nonlinear variation of voltage with changes in level, tank diameter, liquid temperature, and permittivity of the liquid.
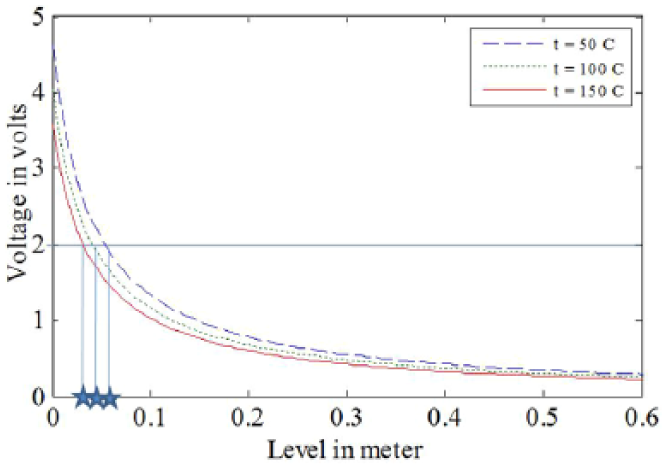
Output voltage of data converter unit for variation of level and temperature, tank diameter = 0.1 m, and permittivity of liquid is 30
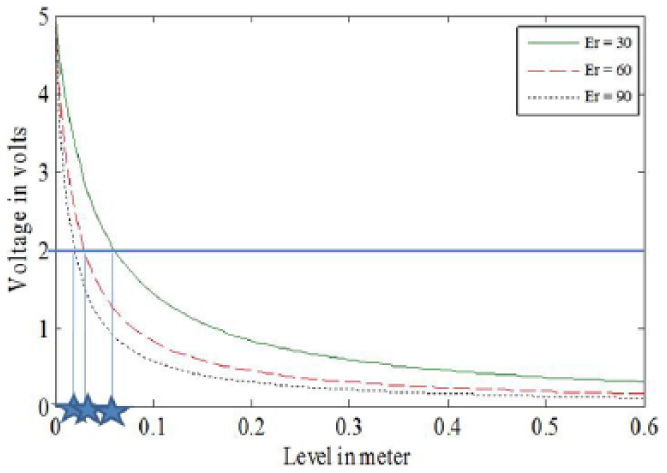
Output voltage of data converter unit for variation of level and permittivity, tank diameter = 0.3 m, and liquid temperature = 25 °C
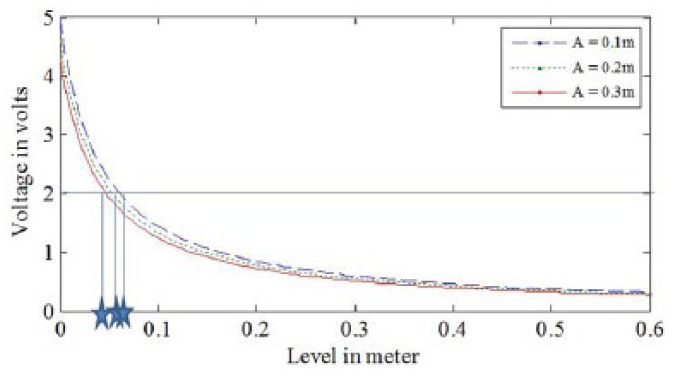
Output voltage of data converter unit for variation of level and tank diameter, at permittivity = 30, and liquid temperature = 25 °C
The datasheet suggests that 10%–60% of full scale is used as the input range, considering linearity. The output voltage also varies with changes in storage tank diameter, temperature, and permittivity of liquid. These are the reasons for designing various calibration techniques using some circuits. These conventional techniques have drawbacks that these are time-consuming and need to be calibrated every time whenever there is a change in the design condition. Such measurement technique is not desirable in industries. So, an improvement technique by making it adaptive of variation in the tank diameter and/or permittivity of liquid and/or temperature of liquid in the measurement is essential. This paper makes an attempt to overcome the above-said drawbacks.
Problem statement
Given an arrangement, consisting of CLS in cascade with timer and frequency to voltage circuit, design an intelligent level measurement technique having the following objectives:
Adaptive of variation in liquid permittivity.
Adaptive of variation in liquid temperature.
Adaptive of variation in tank diameter.
Output bears a linear relation with the input level.
Full scale of input range can be measured.
Validate the proposed technique with practical data.
IV. Problem Solution
The block diagram representation of the proposed technique is given in Figure 9 .
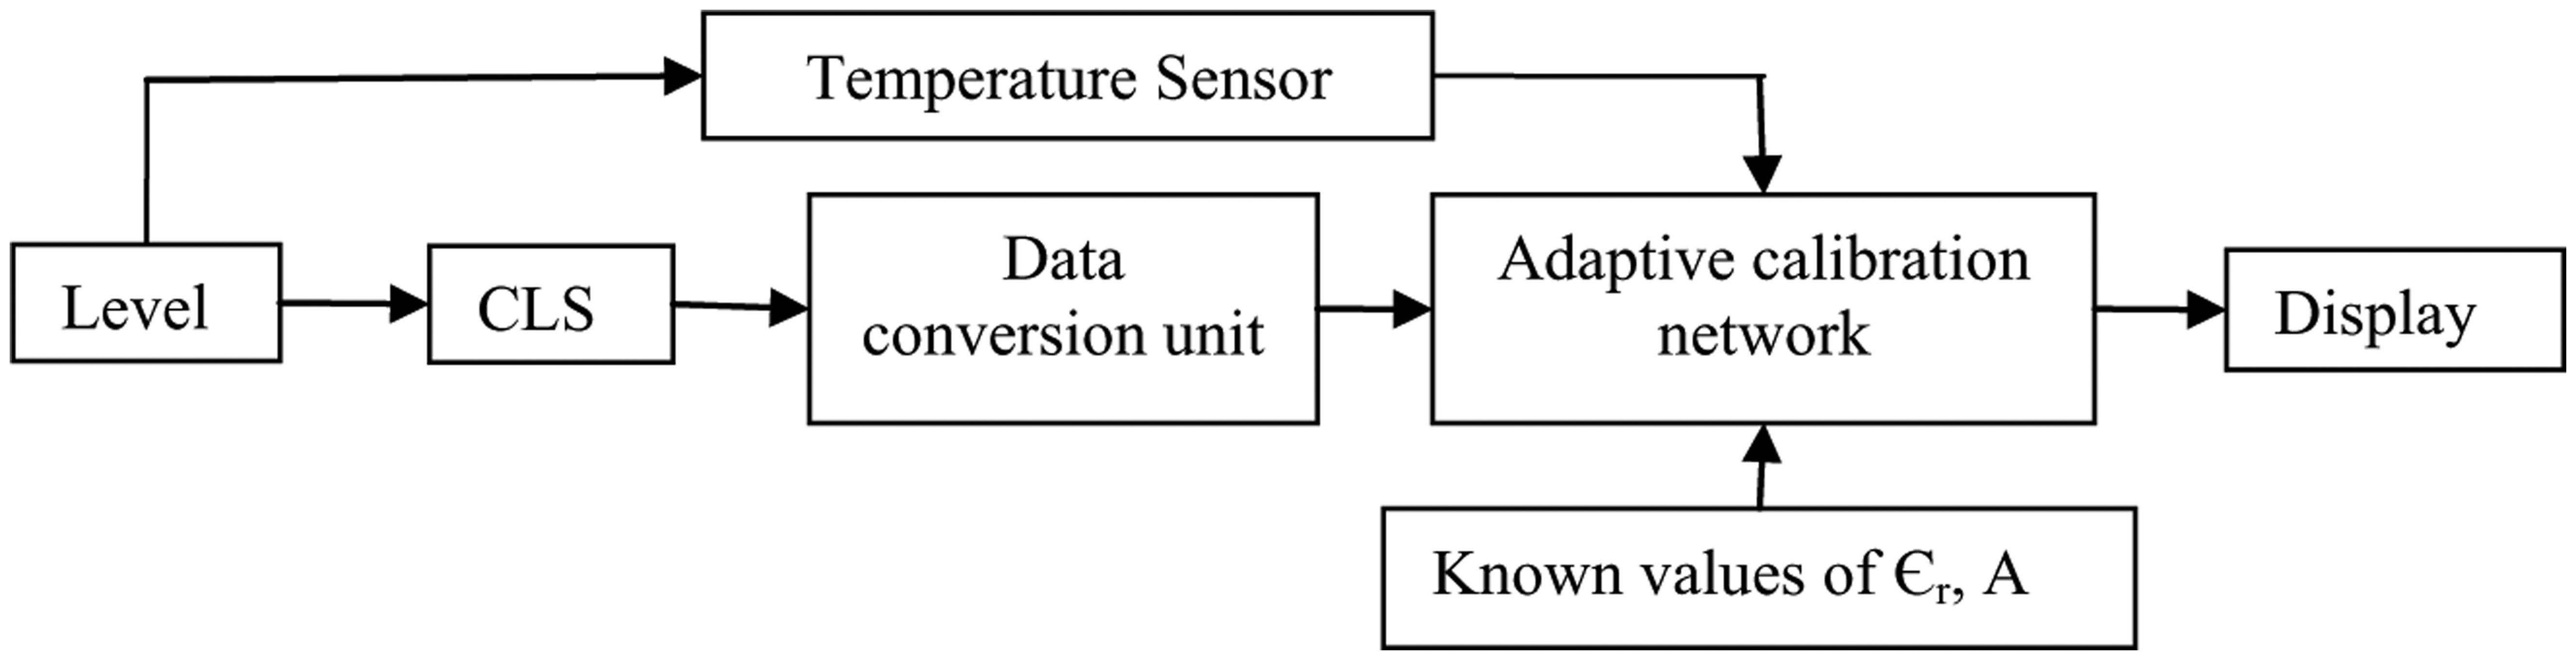
Block diagram of the proposed measuring technique
The drawbacks discussed in the previous section are overcome by adding an optimized ANN (OANN) model in the place of conventional calibration unit. This model is designed using neural network toolbox of MATLAB.
The first step in developing a neural network is to create a database. The output voltage of data conversion unit for a particular value in level, liquid permittivity, storage tank diameter, and liquid temperature is stored as one row of input data matrix. Various such combinations of input level, liquid permittivity, storage tank diameter, liquid temperature, and their corresponding voltages at output of data conversion unit are used to form other rows of input data matrix as shown in Table 1 . The output matrix is the target matrix consisting of data having a linear relation with the input level and adaptive of variations in tank diameter, liquid permittivity, and liquid temperature, as shown in Table 2 .
Input data used for ANN training
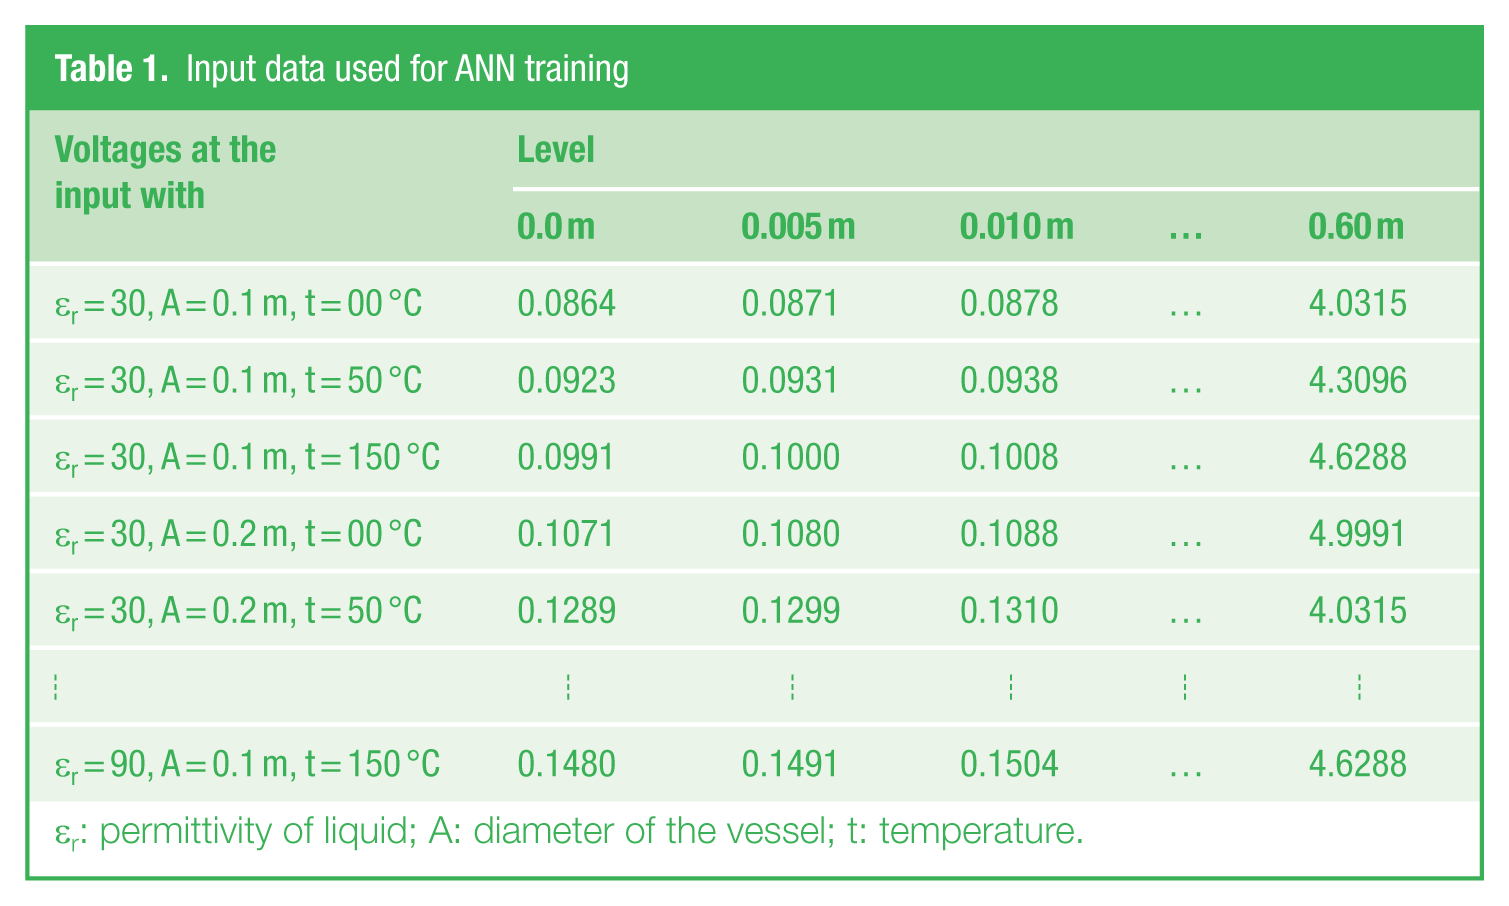
εr: permittivity of liquid; A: diameter of the vessel; t: temperature.
Target data used for ANN training
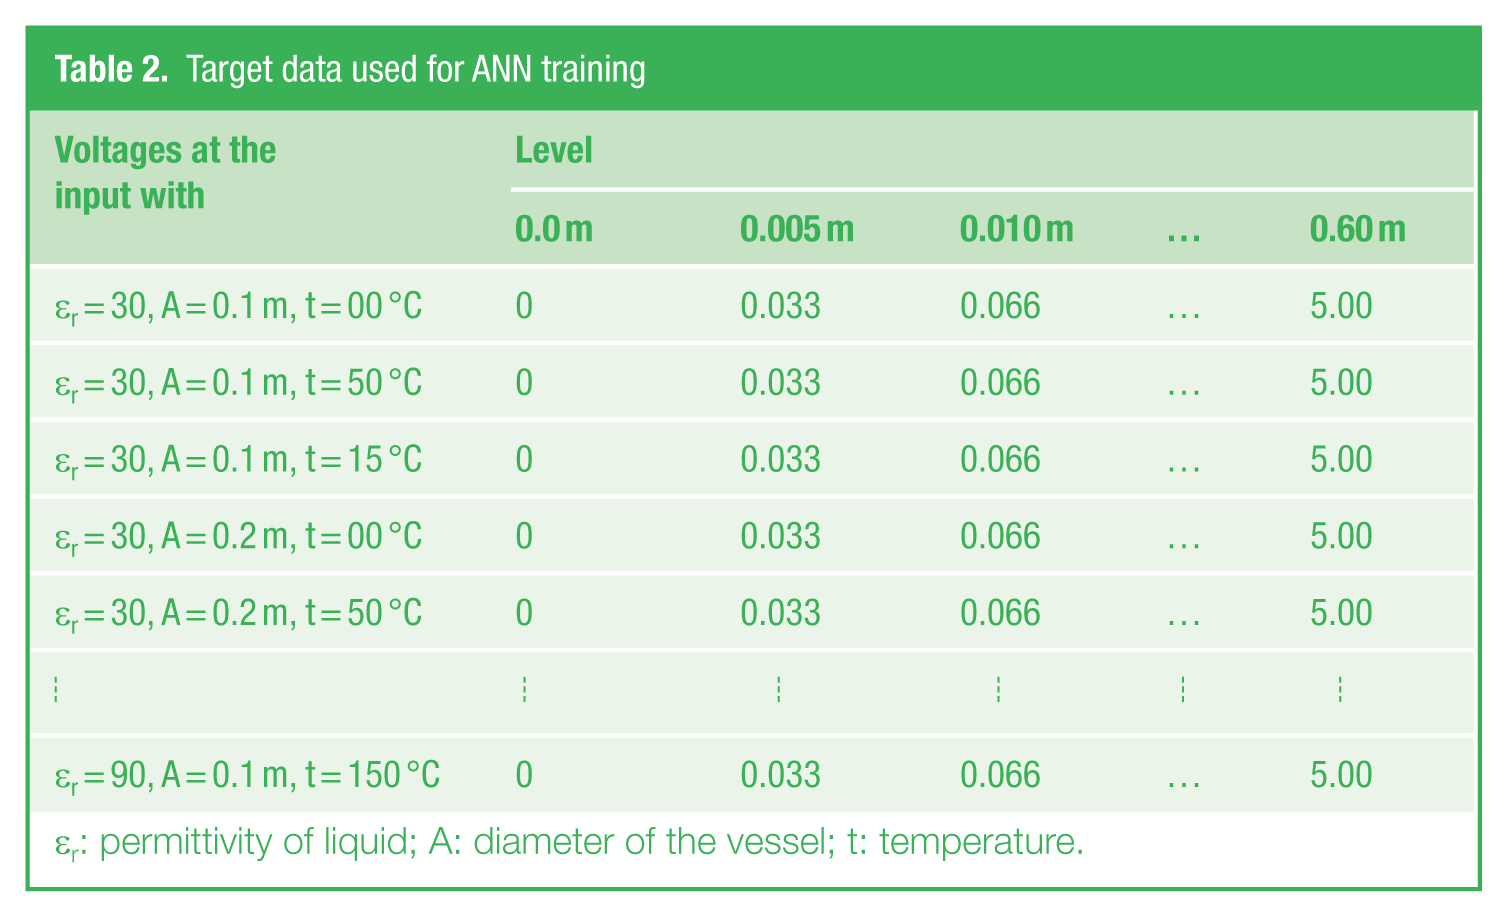
εr: permittivity of liquid; A: diameter of the vessel; t: temperature.
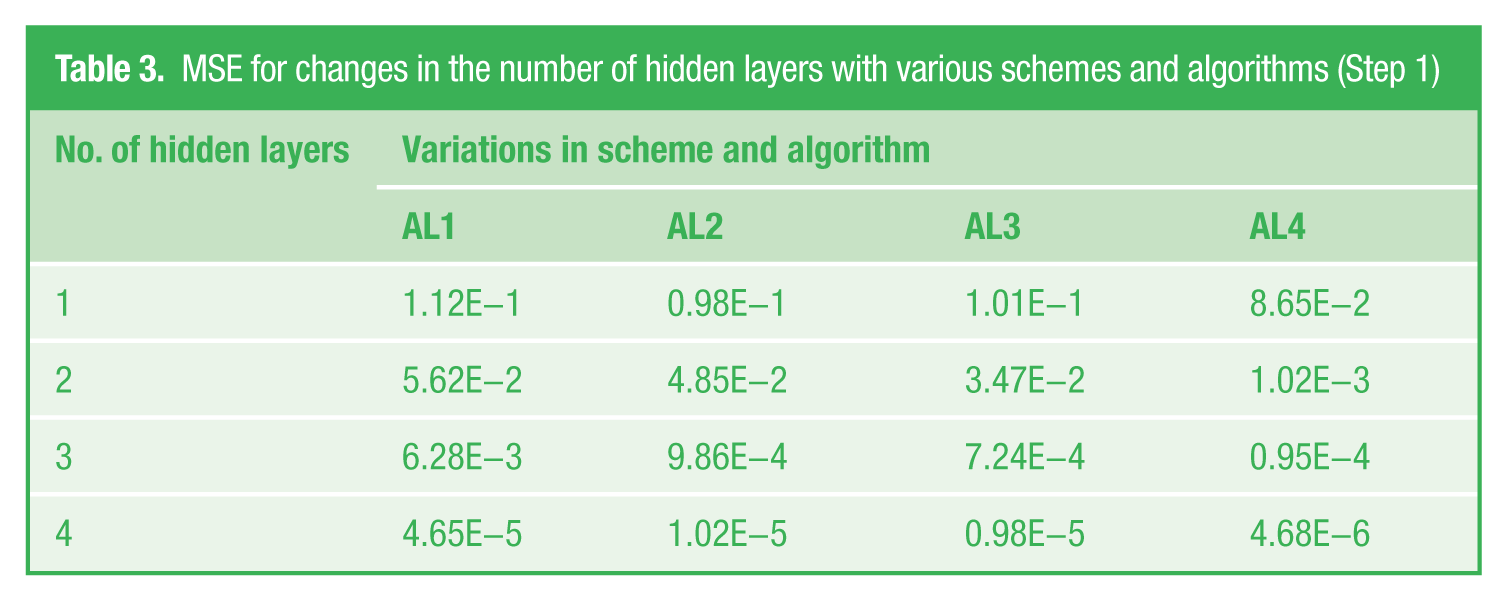
The process of finding the weights to achieve the desired target is called training. An OANN is used to achieve a network structure with minimum number of hidden layers by comparing various schemes, algorithms, and transfer functions of neuron so that the difference between target and output is minimal. This value is measured in terms of mean square error (MSE). The first step of optimization is to find the best scheme.
The optimal number of hidden layers is found corresponding to a scheme and an algorithm. This process is repeated with linear layer trained by the Gauss–Newton algorithm (AL1),24,25 linear layer trained by the Levenberg–Marquardt algorithm (AL2),24,26 linear layer trained by the Artificial Bee Colony algorithm (AL3),27,28 and Back Propagation neural network trained by the Ant Colony Optimization algorithm (AL4).29–31 MSEs are noted in all cases and are given in Table 3 . It is apparent from Table 1 that the back propagation scheme is most suited in here.
MSE for changes in the number of hidden layers with various schemes and algorithms (Step 1)
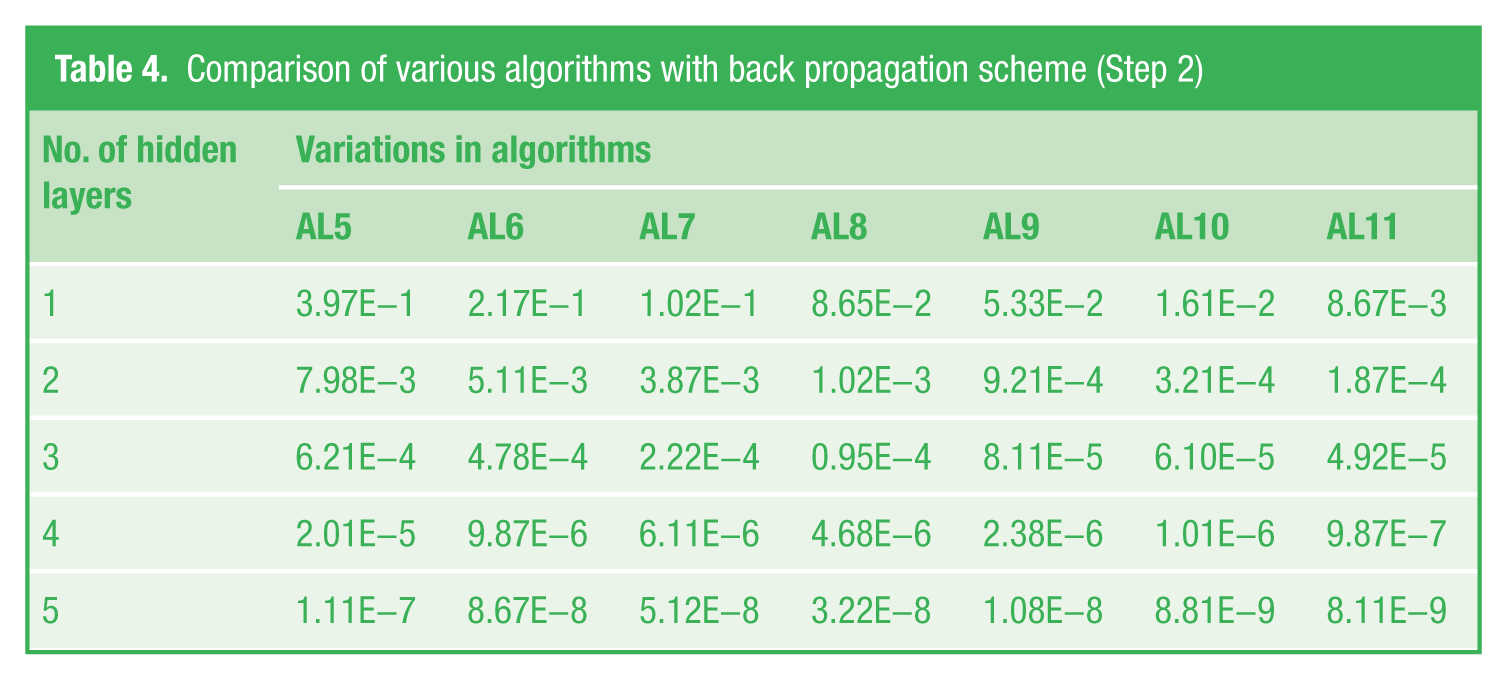
In the second step, seven different algorithms are used with the back propagation scheme to further optimize the ANN. These are Back Propagation trained by Gauss–Newton Algorithm (AL5),24,25,31 Back Propagation trained by Levenberg–Marquardt algorithm (AL6),24,25,31 Artificial Bee Colony (AL7),27,28,31 Ant Colony Optimization (AL8),29–31 Genetic Algorithm (AL9),32–34 Particle Swarm Optimization (AL10),35,36 and Fire fly Algorithm (AL11).37–40 Training of ANN is first done assuming only one hidden layer. MSE values are noted. Hidden layer is increased to two and training is repeated. This process is continued up to five hidden layers. In all cases, MSEs are noted and shown in Table 4 . From Table 4 , it is very clear that back propagation trained by Fire fly algorithm yields most accurate results in step 2.
Comparison of various algorithms with back propagation scheme (Step 2)
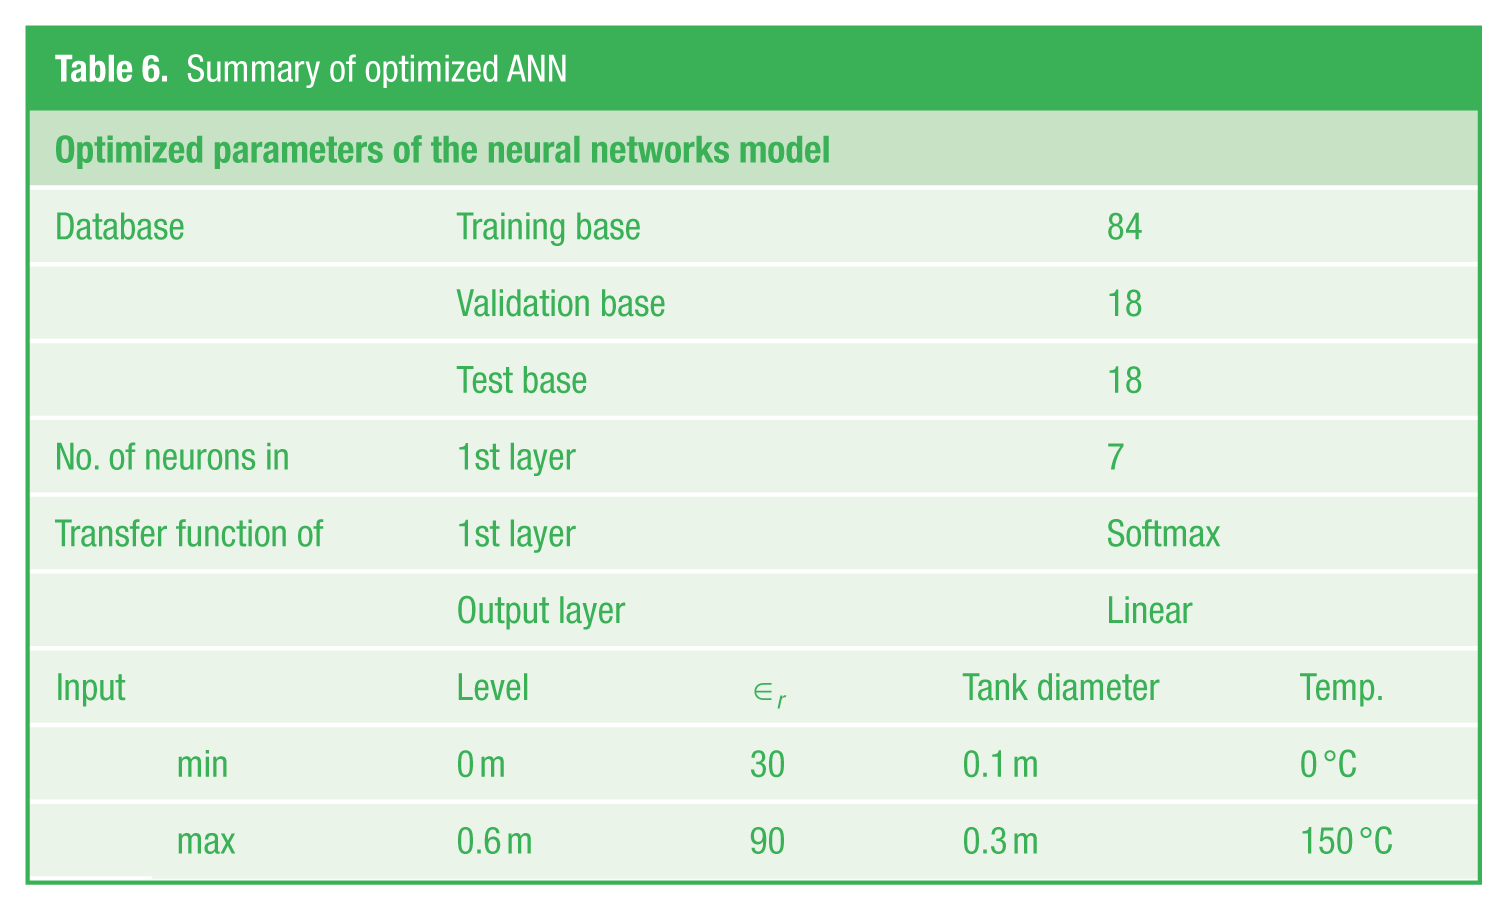
Further optimization is done in Step 3 by varying the transfer function of neuron on the back propagation trained by Fire fly algorithm. Different transfer functions of neuron are used in literature. Training, testing, and validation are repeated with 10 different transfer functions of neuron on the optimized ANN. The effect of neurons transfer function (TF) in terms of MSE are noted and tabulated in Table 3 . Softmax transfer function is finally used in the optimized ANN based on the outcome of Table 5 . Summary of various parameters of the optimized neural network model is shown in Table 6 .
Comparison of different neuron transfer functions

Summary of optimized ANN
V. Results and Analysis
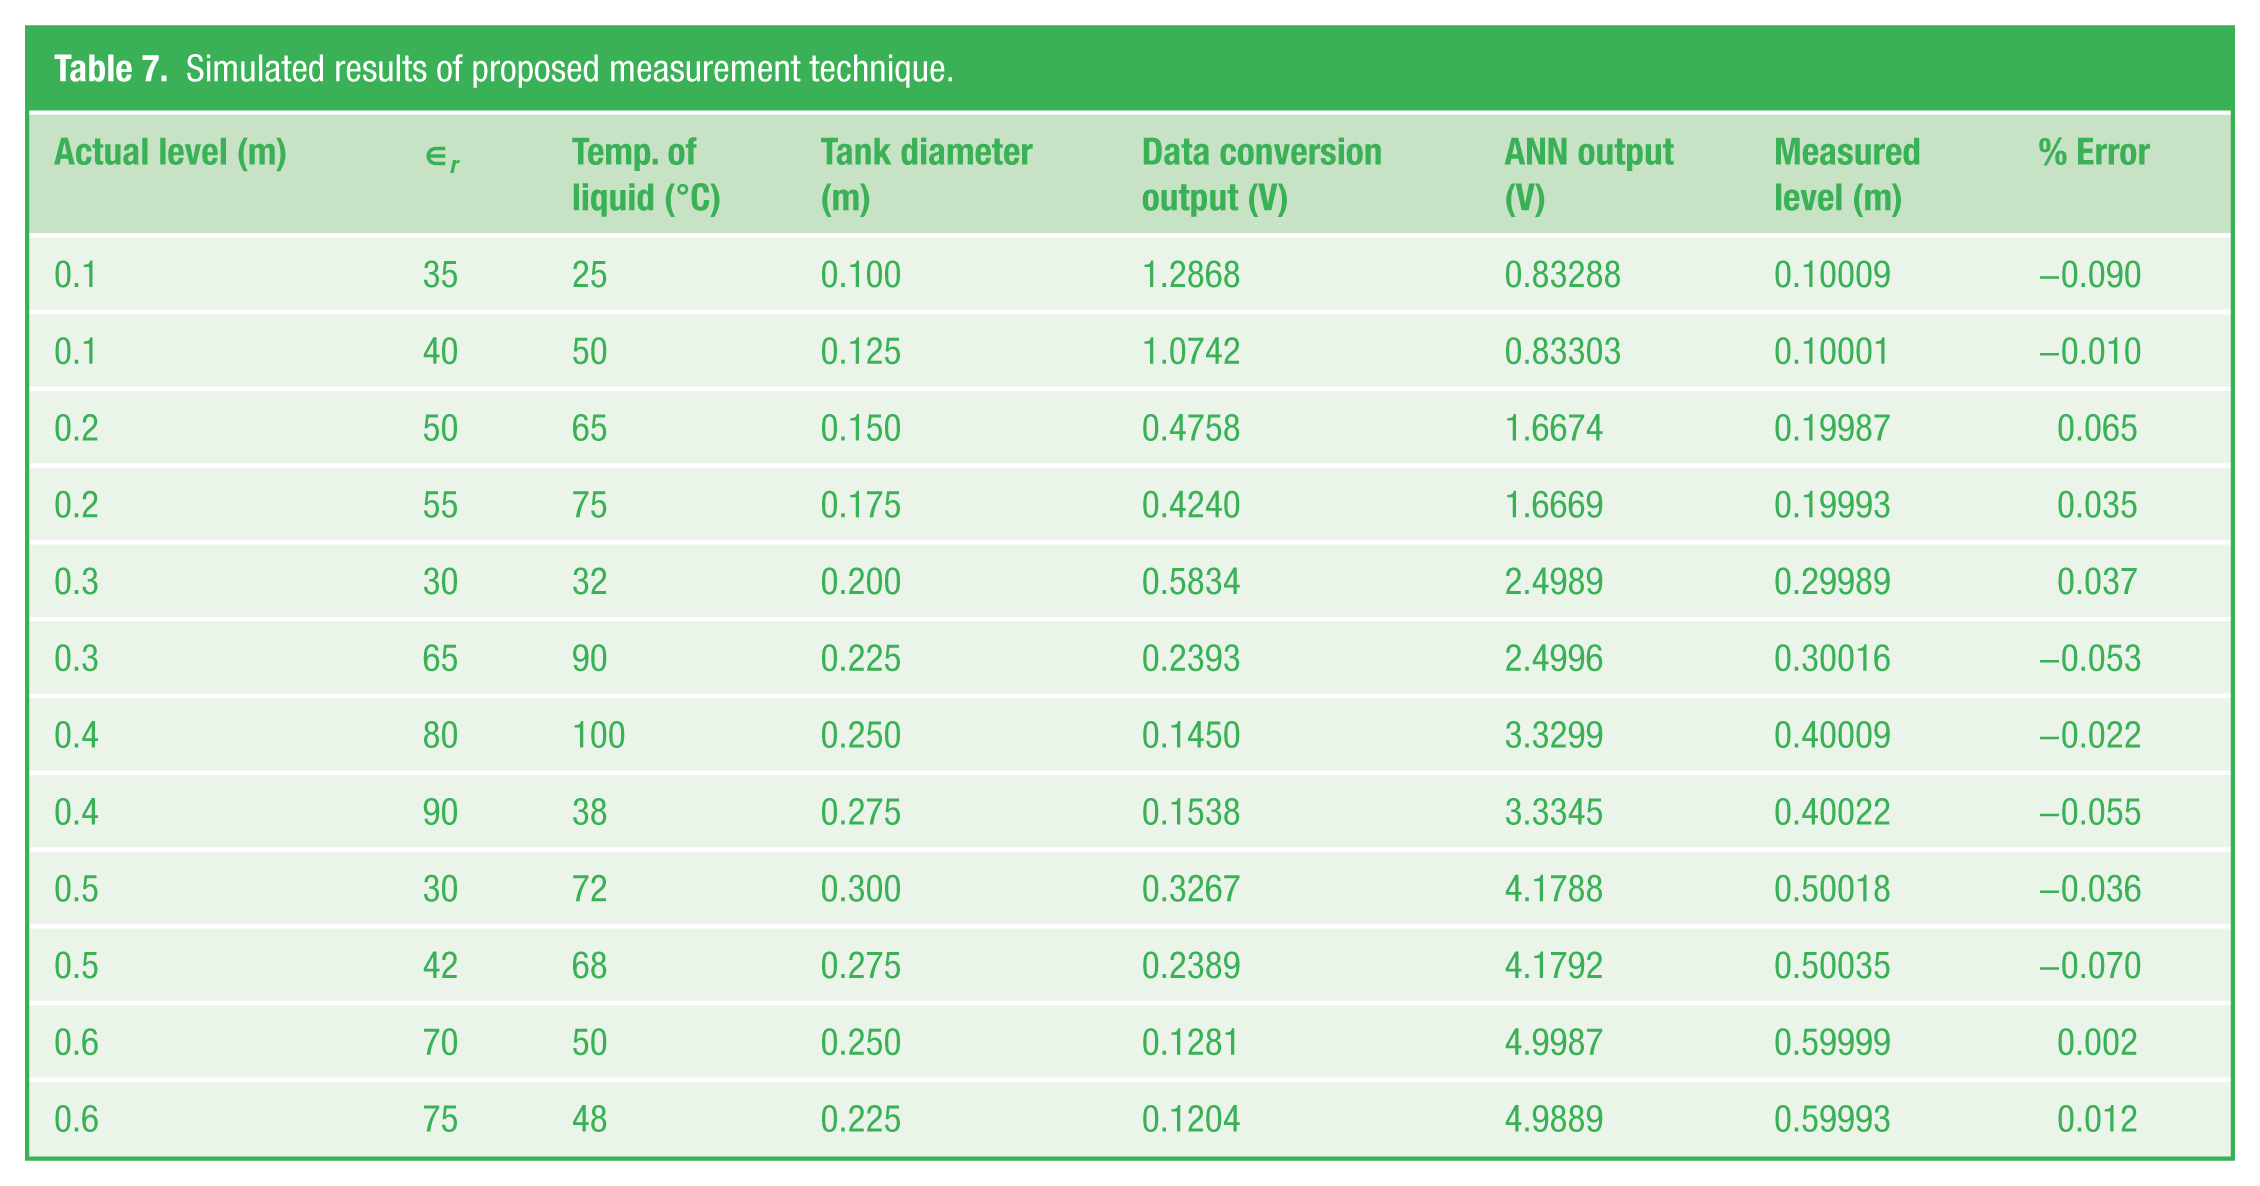
The proposed level measurement technique is subjected to various simulated test inputs corresponding to different values of liquid permittivity, liquid temperatures, and tank diameters, all within the specified ranges. The outputs corresponding to sampled test inputs are listed in Table 7 . It may be noted that the test inputs are different from the training data. Variation of percentage error in level measurement with simulated test inputs is shown in Figure 10 .
Simulated results of proposed measurement technique.
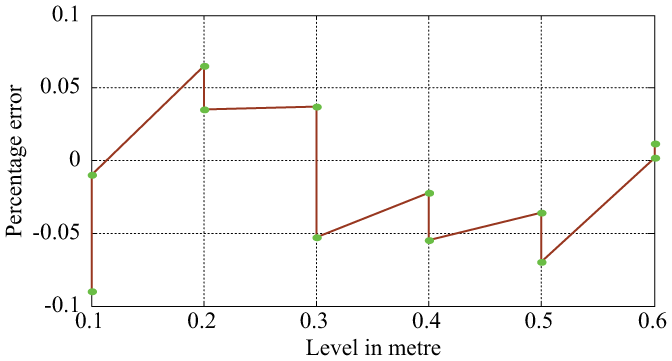
Percentage error in level measurement with simulation data
It is evident from Table 7 and Figure 10 that the proposed measurement technique has gained intelligence in addition to increase in linearity range. The output is made adaptive of variations in liquid permittivity, storage tank diameters, and liquid temperatures. Root mean square of percentage error is 0.0138. Hence, adaptive calibration technique designed using optimized ANN as back propagation scheme trained by Fire fly algorithm with Softmax neuron TF has successfully achieved the objectives.
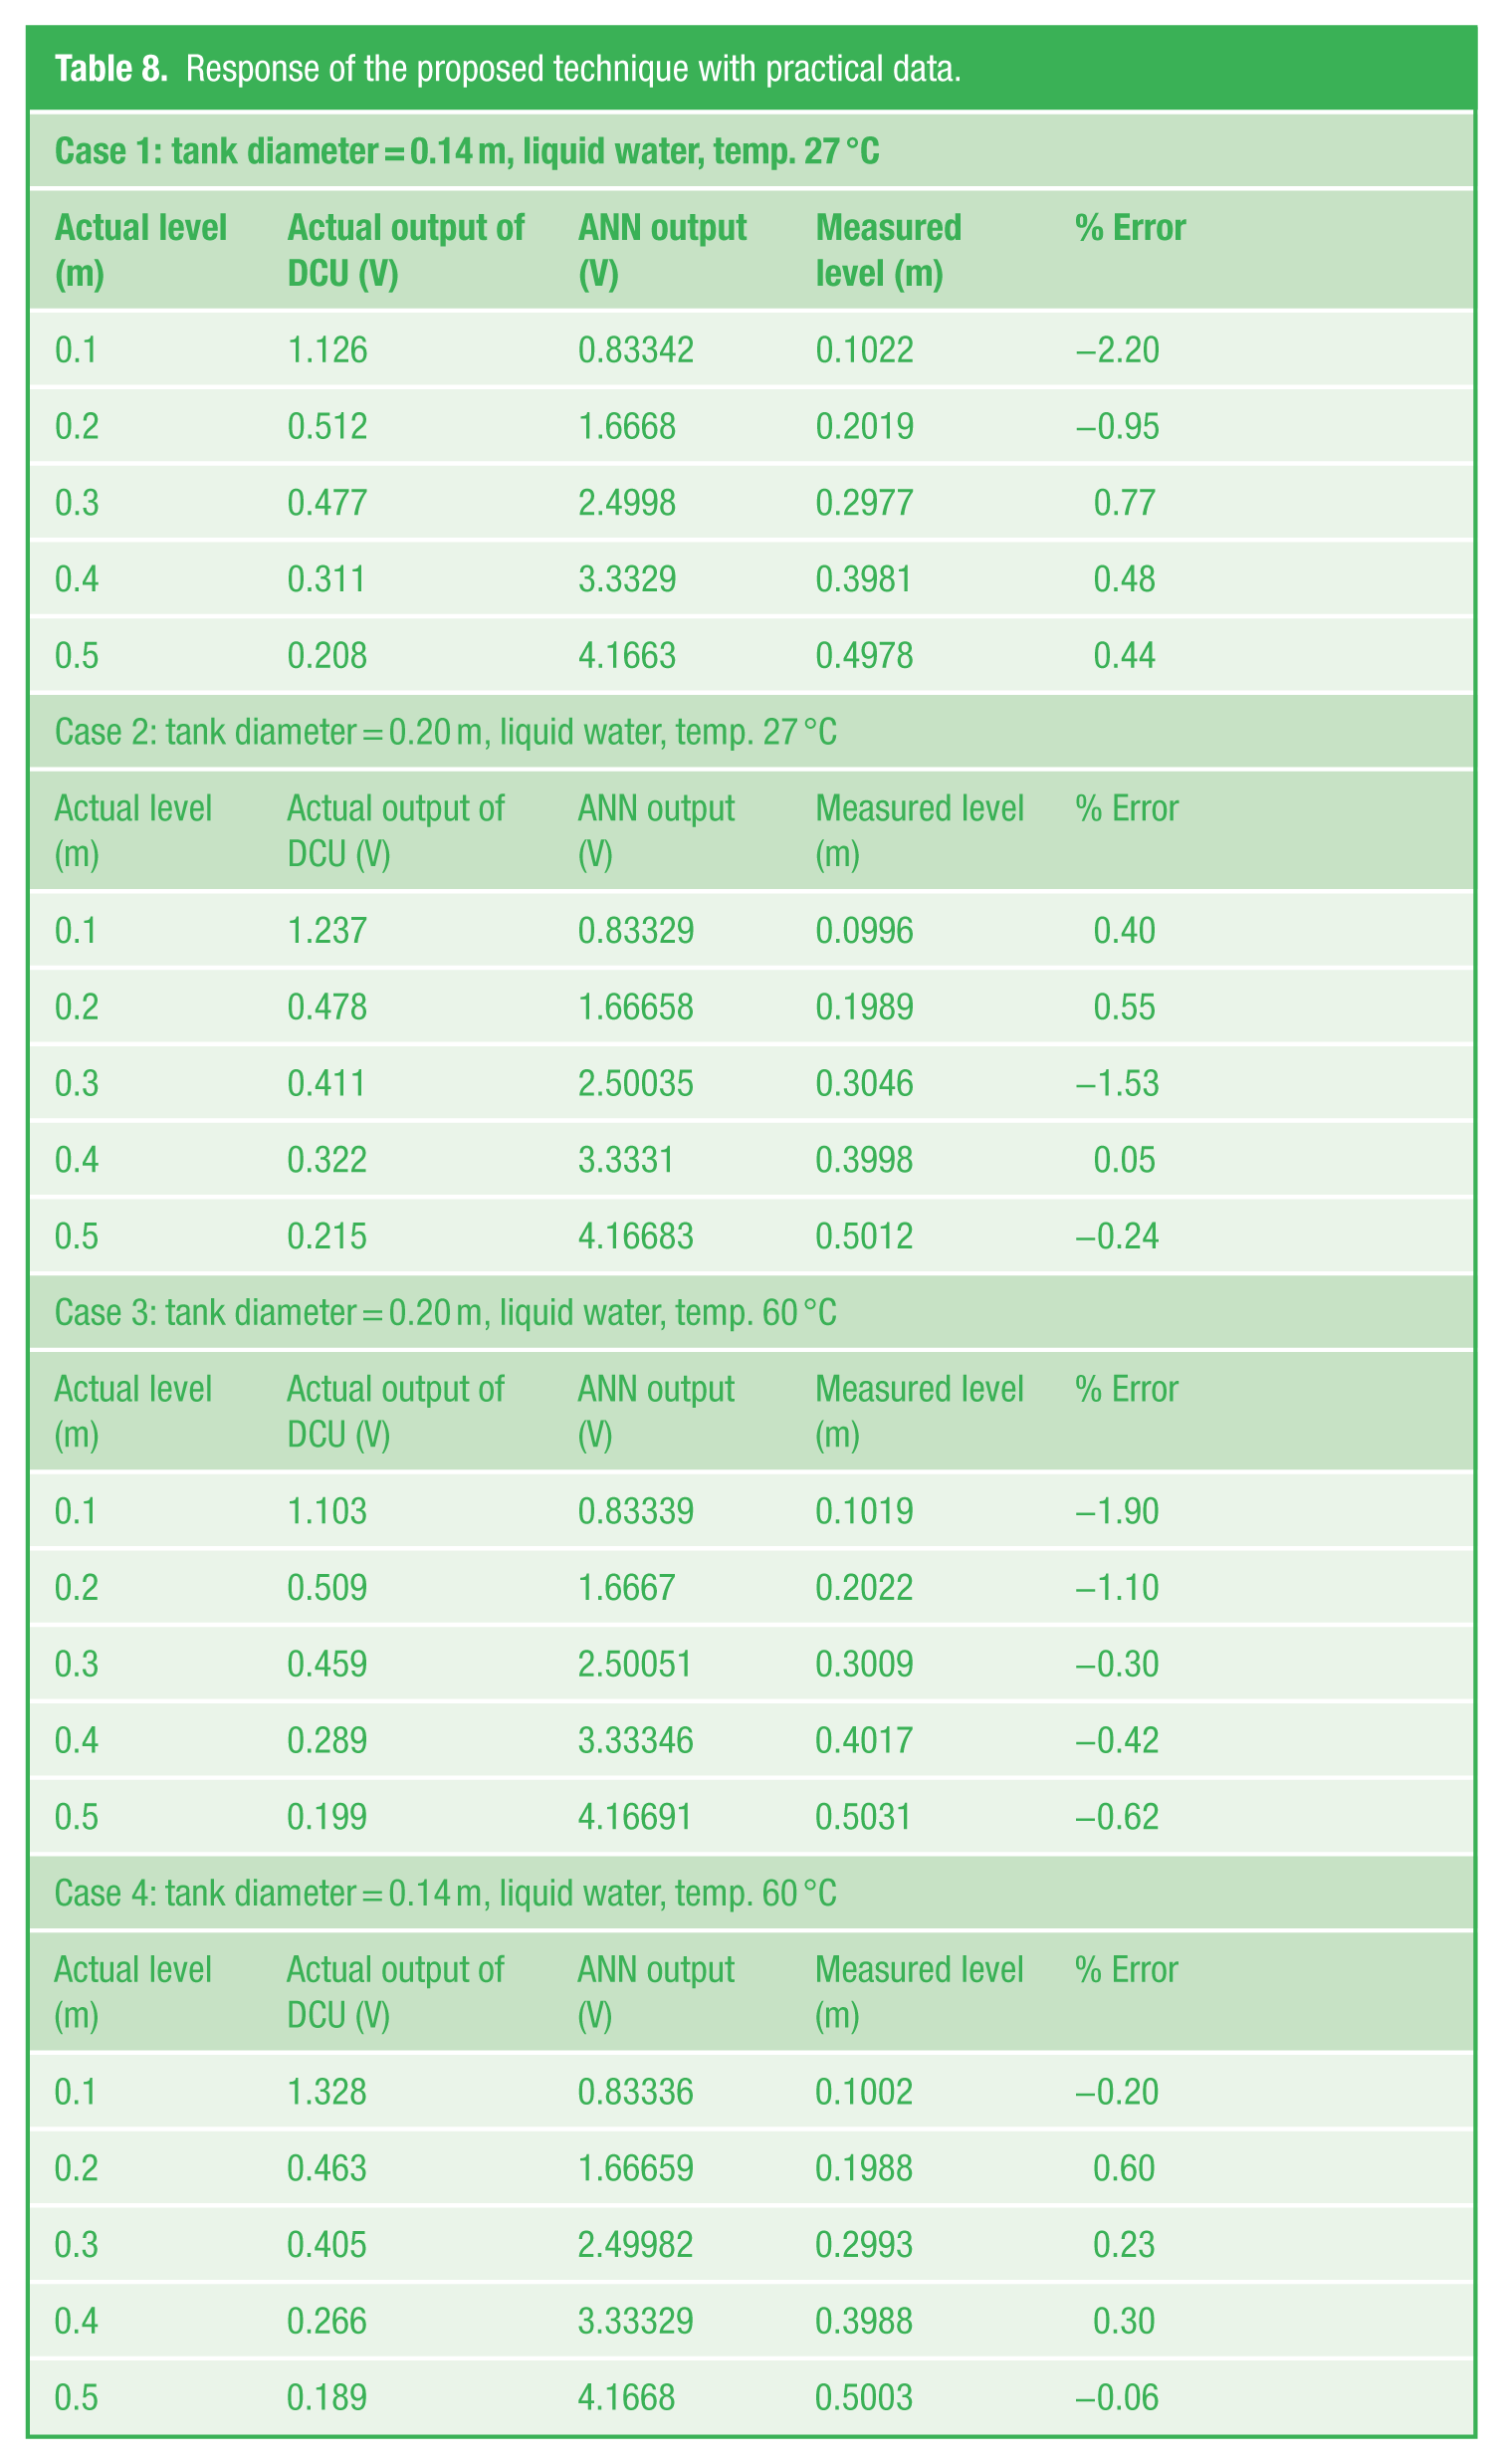
The proposed technique is further validated with practical data. The setup used for this purpose is shown in Figure 11 . For validation, four different cases considering different cases with variations in tank diameter, liquid permittivity, and liquid temperature are passed through existing data conversion unit, and the output of DCC is noted. These are (1) tank diameter = 0.14 m, water temperature = 27 °C; (2) tank diameter = 0.20 m, water temperature = 27 °C; (3) tank diameter = 0.20 m, water temperature = 60 °C; and (4) tank diameter = 0.14 m, water temperature = 60 °C. These data are recorded and used for validating proposed intelligent level measurement technique. These data are listed in Table 8 . Variation in percentage error in level measurement by the proposed technique with practical data is shown in Figure 12 . The corresponding ANN outputs and the level measured by the proposed technique are shown in Table 8 . Results shown in Tables 7 and 8 suggest that the proposed system has measured the level with very good accuracy from the practical data. The root mean square of percentage error is 0.884. It is evident from Tables 7 and 8 that the proposed measurement technique has gained intelligence in addition to increasing the linearity range. The output is now made adaptive of variations in tank diameter, liquid permittivity, and liquid temperature. Thus, the proposed level measurement technique has successfully achieved the objectives.
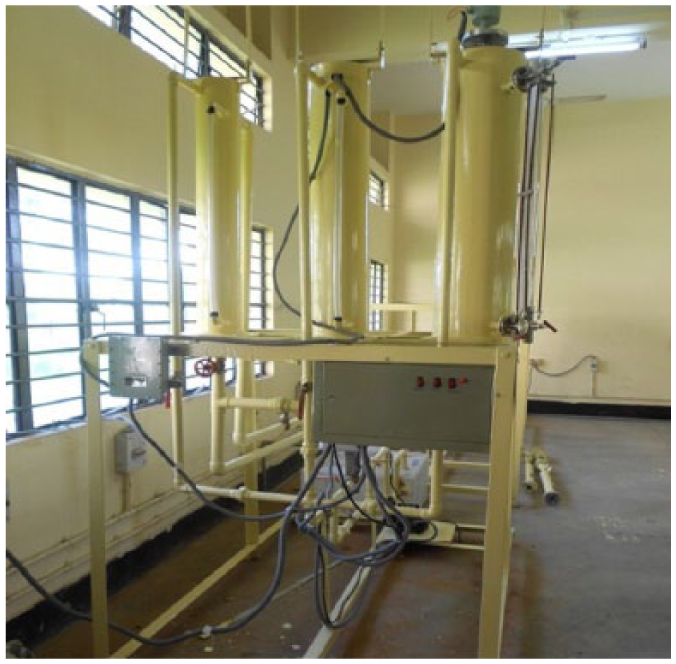
Model used for level measurement
Response of the proposed technique with practical data.
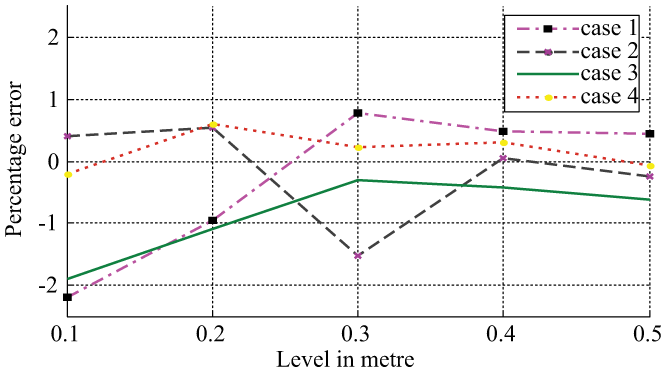
Show the variations of percentage error in level with measurement with practical data
VI. Conclusion
Available reported works have discussed different techniques for calibration of level measurement. But, these are not adaptive of variations in tank diameters, permittivity of liquid, and liquid temperatures. Hence, repeated calibration is required for any change of liquid, liquid temperature, or storage tank diameter. Furthermore, many reported works have not utilized the full scale of measurement. In comparison to these, the proposed measurement technique achieves linear input–output characteristics for full input range and makes the measurement adaptive of variations in storage tank diameter, liquid permittivity, and liquid temperatures. So, the proposed technique avoids repeated calibration whenever there is a change in tank diameters, and/or liquid is replaced, and/or there is a change in the temperature of liquid. An optimized ANN is used by comparing various schemes, algorithms, and neuron transfer functions to achieve the objectives in comparison to an arbitrary ANN in most of the reported works. Before submitting your manuscript, please ensure you carefully read and adhere to all the guidelines and instructions to authors provided below. Manuscripts not conforming to these guidelines may be returned.
Footnotes
Funding
The authors received no financial support for the research, authorship, and/or publication of this article.