
Abstract
Fault detection is an important step in gear production, but the traditional methods are inefficient. In this paper, a novel method for gear parameter measurement is proposed based on computer vision. First, we introduce the hardware composition of a system and the main structure of the software algorithm. Next, we discuss the principles of digital image pre-processing, image segmentation, and image analysis and also analyse the detailed steps, including gear centre positioning, gear tooth root radius calculation, and the addendum circle radius calculation. Finally, we show how the other parameters of the gear can be calculated using formulas, and how possible faults can be detected accordingly. This method is simple and requires neither edge detection nor Hough transformation. Experiments show that the system is stable and fast and that it can meet the needs of gear parameter measurement, replacing manual detection in actual production.
I. Introduction
As a common power transmission device, the gear has played an essential role in the historical development of industry, and gear quality has a direct impact on the performance of mechanical products. Therefore, product quality must be tested and controlled rigorously in the manufacturing process of gears. Because of the geometric shape of the gear itself, the measurement process to find faults, such as grinding gears, missing teeth, and crooked gears, is complex. Moreover, the structure of the regular measuring equipment, such as the three-coordinate measuring machine and the gear integrated error checking instrument, is complex and the process is expensive, requiring a relatively high number of personnel for testing. The development of the modern manufacturing industry also requires a higher rate of fault detection in gear products. Therefore, there is a demand to find a way to rapidly measure and analyse gear parameters during actual production. Computer vision technology, a new non-destructive testing means, has gradually become an effective way to achieve product quality monitoring and fault diagnosis, showing promise in gear measuring technology.1–3 When compared to the traditional means of detection, the visual inspection has the advantages of not making direct contact, having fast speed, and having a strong anti-interference ability at site. These advantages greatly reduce the work intensity required by testing personnel and reduce subjective errors in aiming, reading, and improving the efficiency and accuracy of measurement.
Computer vision-based methods typically need to determine the coordinate of the centre of the gear as a benchmark, so the accuracy of centre detection directly affects the precision of the measurement of gear parameters. Among the traditional methods of image detection, the centre detection algorithm generally requires an edge detection method to determine the edge of the gear, and then uses the gravity method, the median method, and the Hough transform method to determine the centre of the gear. The first two algorithms require more evenly distributed images; otherwise, they will lead to considerable errors. The latter algorithm requires voting point-by-point and requires more time to record, yet the accuracy is not high enough for industrial standards.4,5 To resolve these issues, we propose a programme based on the automatic analysis of gear parameters, using the mathematical morphology method. That is, we input a gear image into the computer and then extract gear features through an image processing algorithm. This isolates the gear from a variety of complex backgrounds, allowing automatic counting and size measurement of the gear teeth. Using this method, we achieve good results in the production application.
II. Composition of Measuring System
The system frame structure can be divided into physical hardware and software for image processing and parameter analysis.
A. Hardware structure
The hardware of the measurement system includes a platform charge-coupled device (CCD) camera, a ring-shaped light-emitting device (LED) light source, an optical system, an image acquisition card, and a computer.6,7 The overall structure of the system is shown in Figure 1 . The gears are placed flat on the platform and are lit from the top by the LED light source so that each gear is substantially and equally illuminated. The optical device below the camera has target zoom and auto-focus functions. The image acquisition card is installed in the Peripheral Component Interconnect (PCI) slot of the computer and is connected to the camera via a communication bus. The software component is installed on the computer, which is running Windows XP. The software includes procedures for image control acquisition and image processing for image analysis.
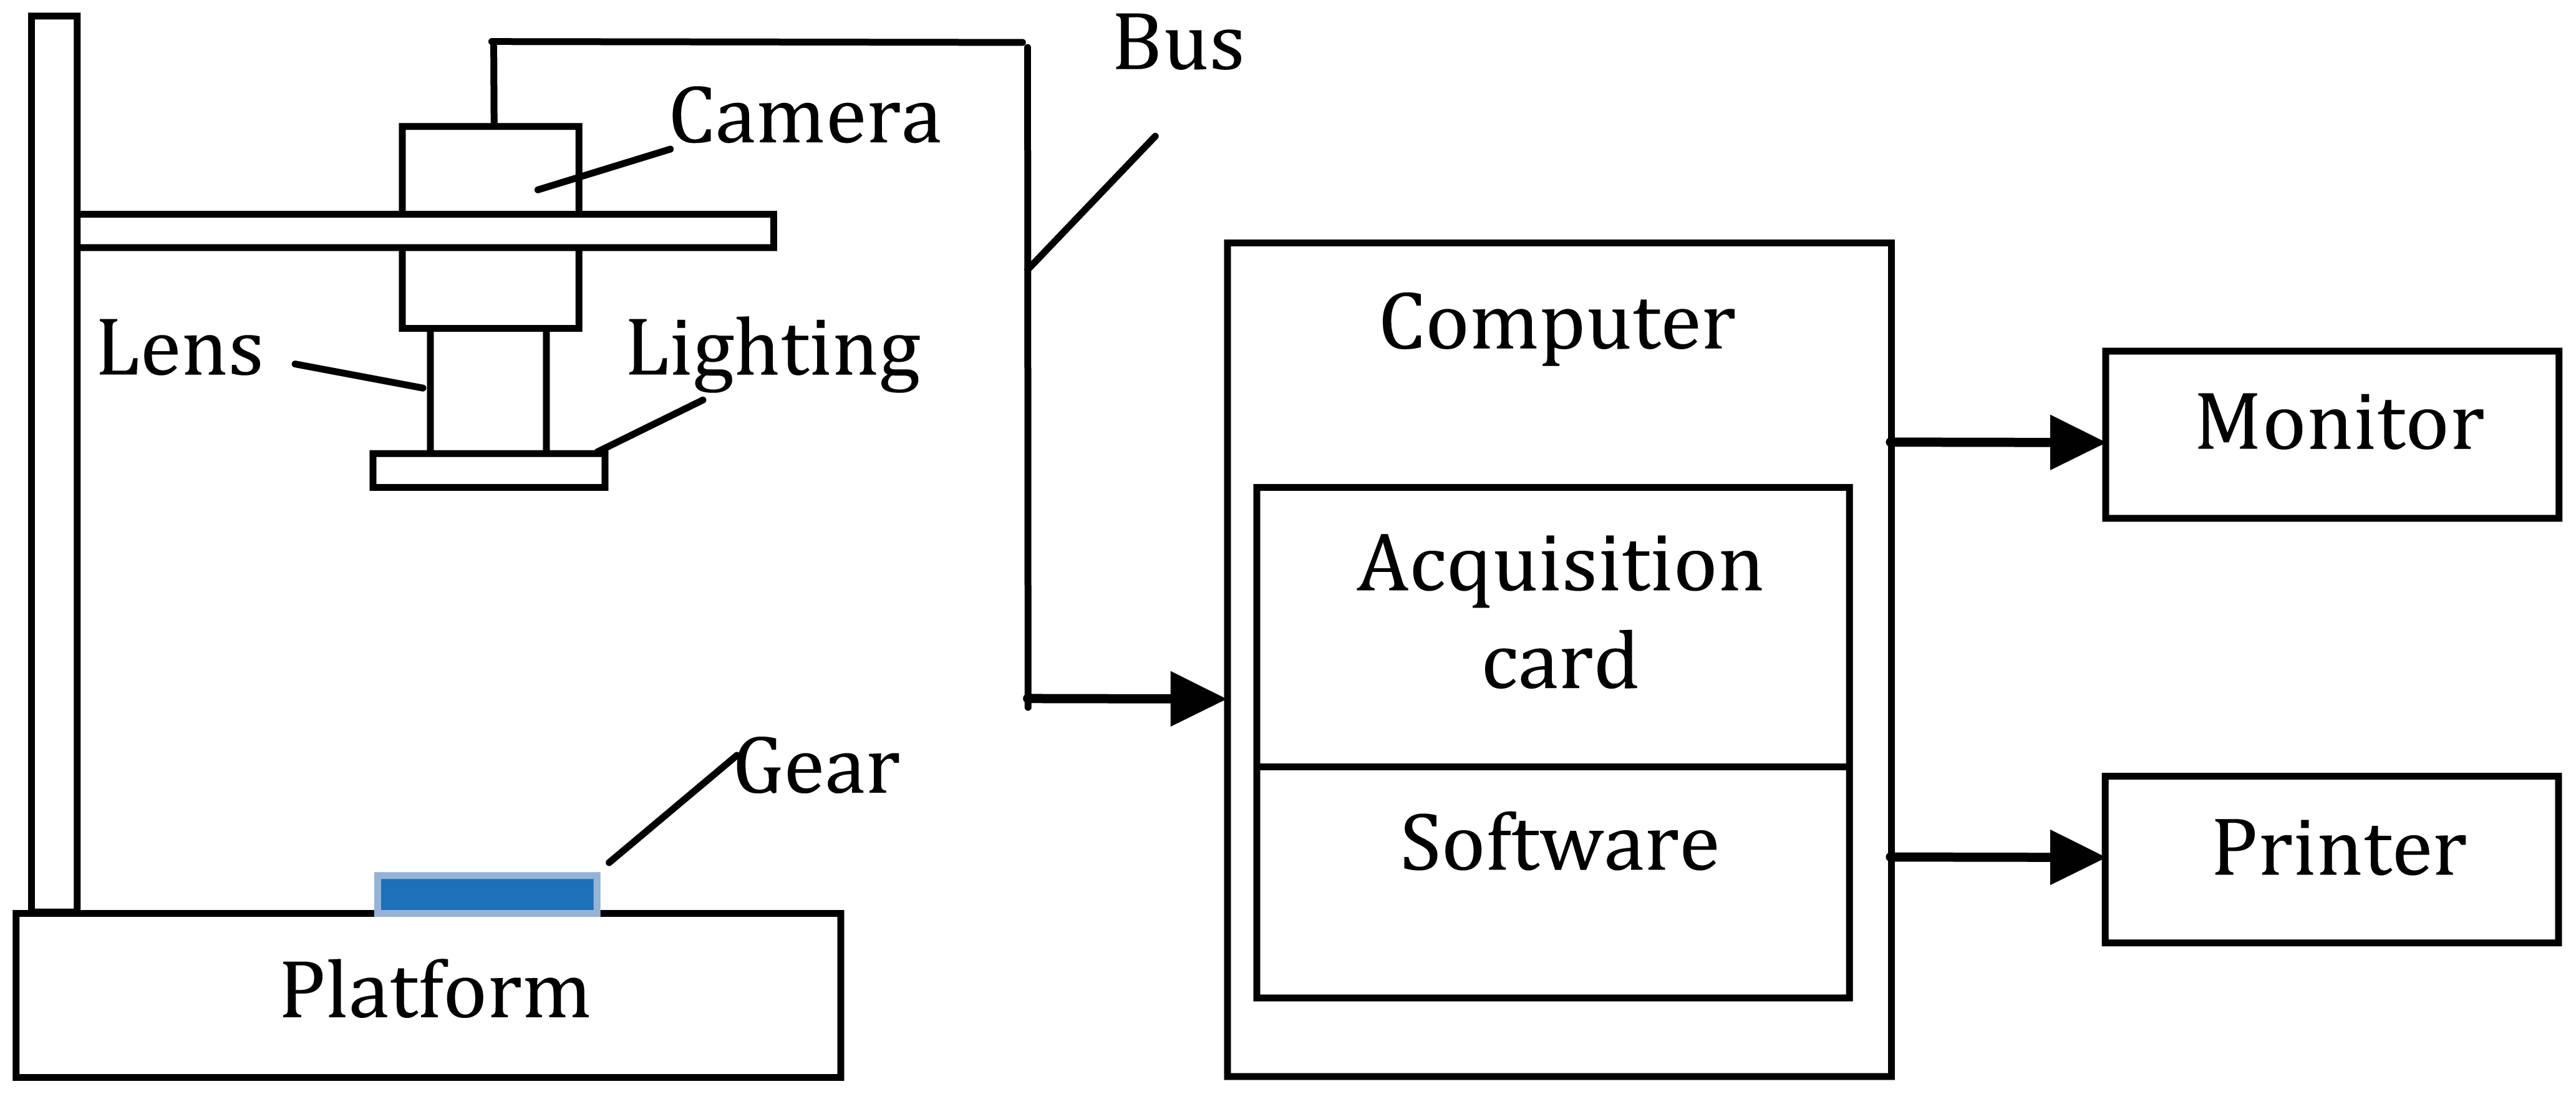
The overall structure of the system
The work flow is as follows: first, the focus and the environmental parameters are regulated in order to appropriately increase the contrast between the gear and the background. Then, the CCD camera takes an image of the gear on its image-sensitive surface, and with the operation of the drive, conducts a high-speed transfer of the entire array of signal charges to the image acquisition card for analogue-to-digital (A/D) conversion. The converted image data are stored on the computer, and computer software uses grey transform, smoothing filter, image segmentation, and other algorithms to facilitate image pre-processing so that gear parameters analysis can be performed via morphological processing.
B. Composition of the system software
The system software can be described in accordance with image processing, mainly including modules for greyscale transformation of the source image, image filtering, image segmentation, morphological processing, parameter analysis and statistics, results information display, and data saving. The 24-bit colour images collected by the CCD camera are converted to 8-bit greyscale images, improving the processing speed. Image filtering is used to filter out noise generated during the image acquisition process and to improve the quality of the image. Image segmentation is used to separate the gear from its background. Morphological processing is used primarily to obtain information regarding the centre of the gear and the number of teeth. The parameter analysis module is used to conduct gear parameter processing, outputting the number of gear teeth with possible faults. The result display portion of the software shows the results using histograms and pie charts. From looking at the overall structure of the measurement system, we can see that the system is mainly composed of the image acquisition module, the image pre-processing module, and the parameter measuring module. The block diagram of the basic system composition is shown in Figure 2 . The gear measuring task can be completed with high efficiency and high precision using the combination of algorithms that perform these functions and features.
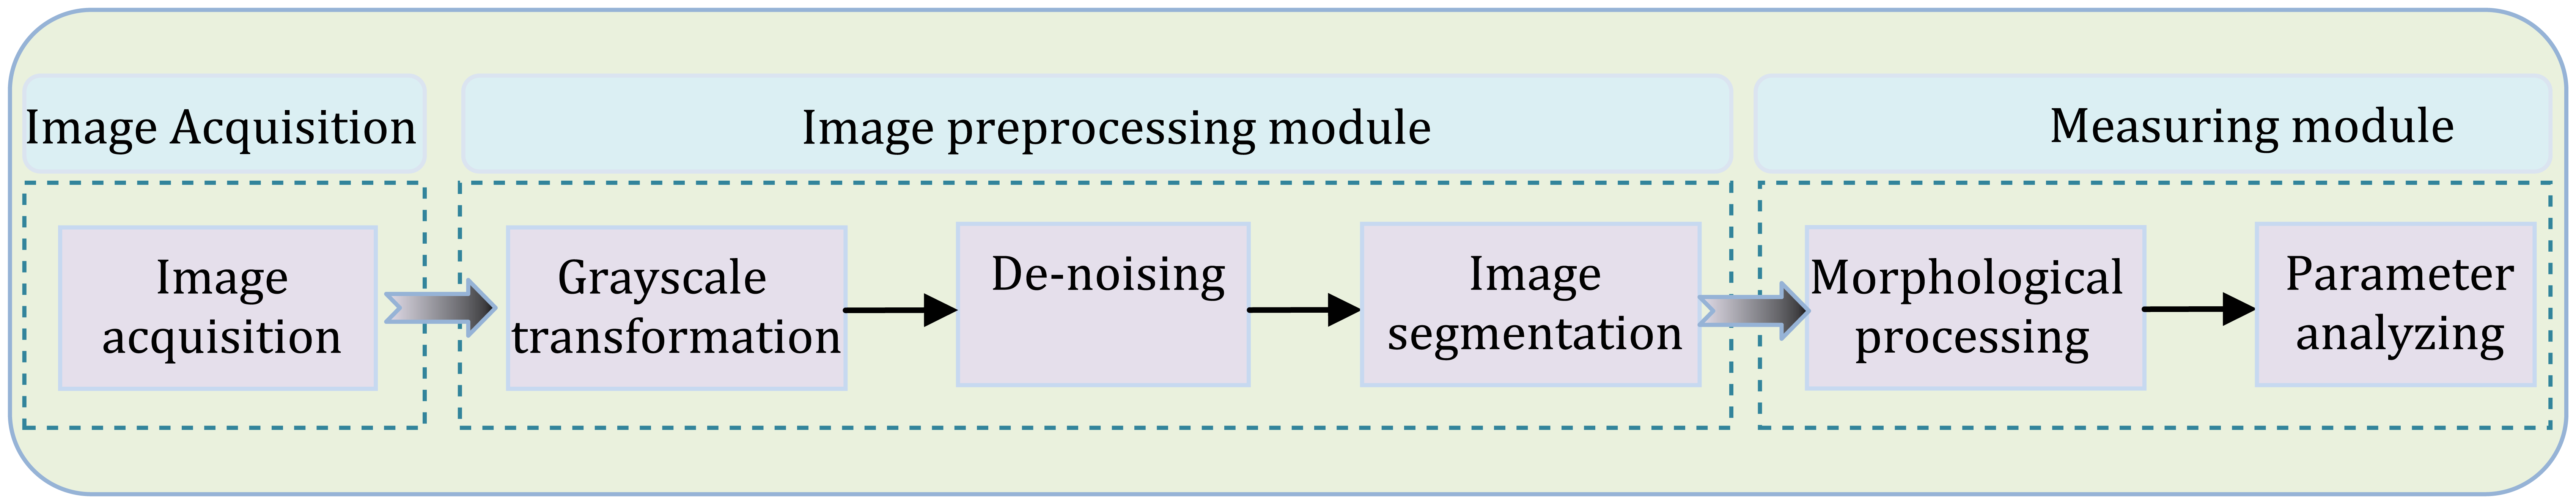
Flowchart showing how gear parameters are measured
III. The Pre-Processing of a Gear Image
A. Grey transformation
Since the image is collected by the camera as a colour image, grey gradation processing should be conducted when the image is digitized in order to improve the calculation speed. Using principles of the sensitivity of the human eye regarding different colours, the weighted average method is used
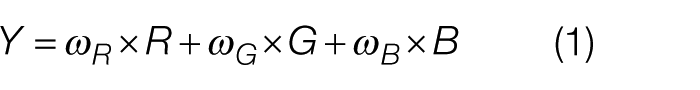
where ωR, ωG, and ωB are weights corresponding to the colour components R, G, and B, respectively, and Y is the pixel value of the corresponding point on the greyscale graph. Since human eyes have the highest sensitivity to green, followed by red, and, lastly, blue, we can obtain a better greyscale image if we make ωG > ωR > ωB. We set ωR = 0.30, ωG = 0.59, and ωB = 0.11, then the greyscale of the image is 256.
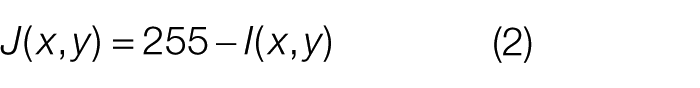
Before the greyscale image is finalized, we take the inverse of the image to use moving forward. The formula used to get the inverse image is
B. De-noising
In order to eliminate any noise generated during image acquisition, we use the median filtering method. It is based on non-linear signal processing technology in ranking statistical theory and can effectively suppress noise. The basic principle is to use a sliding window containing an odd number of pixels, using the median value of the greyscale values of the points contained in the window to replace the greyscale value of the pixel in the centre of the window. This principle is illustrated in Figure 3 .
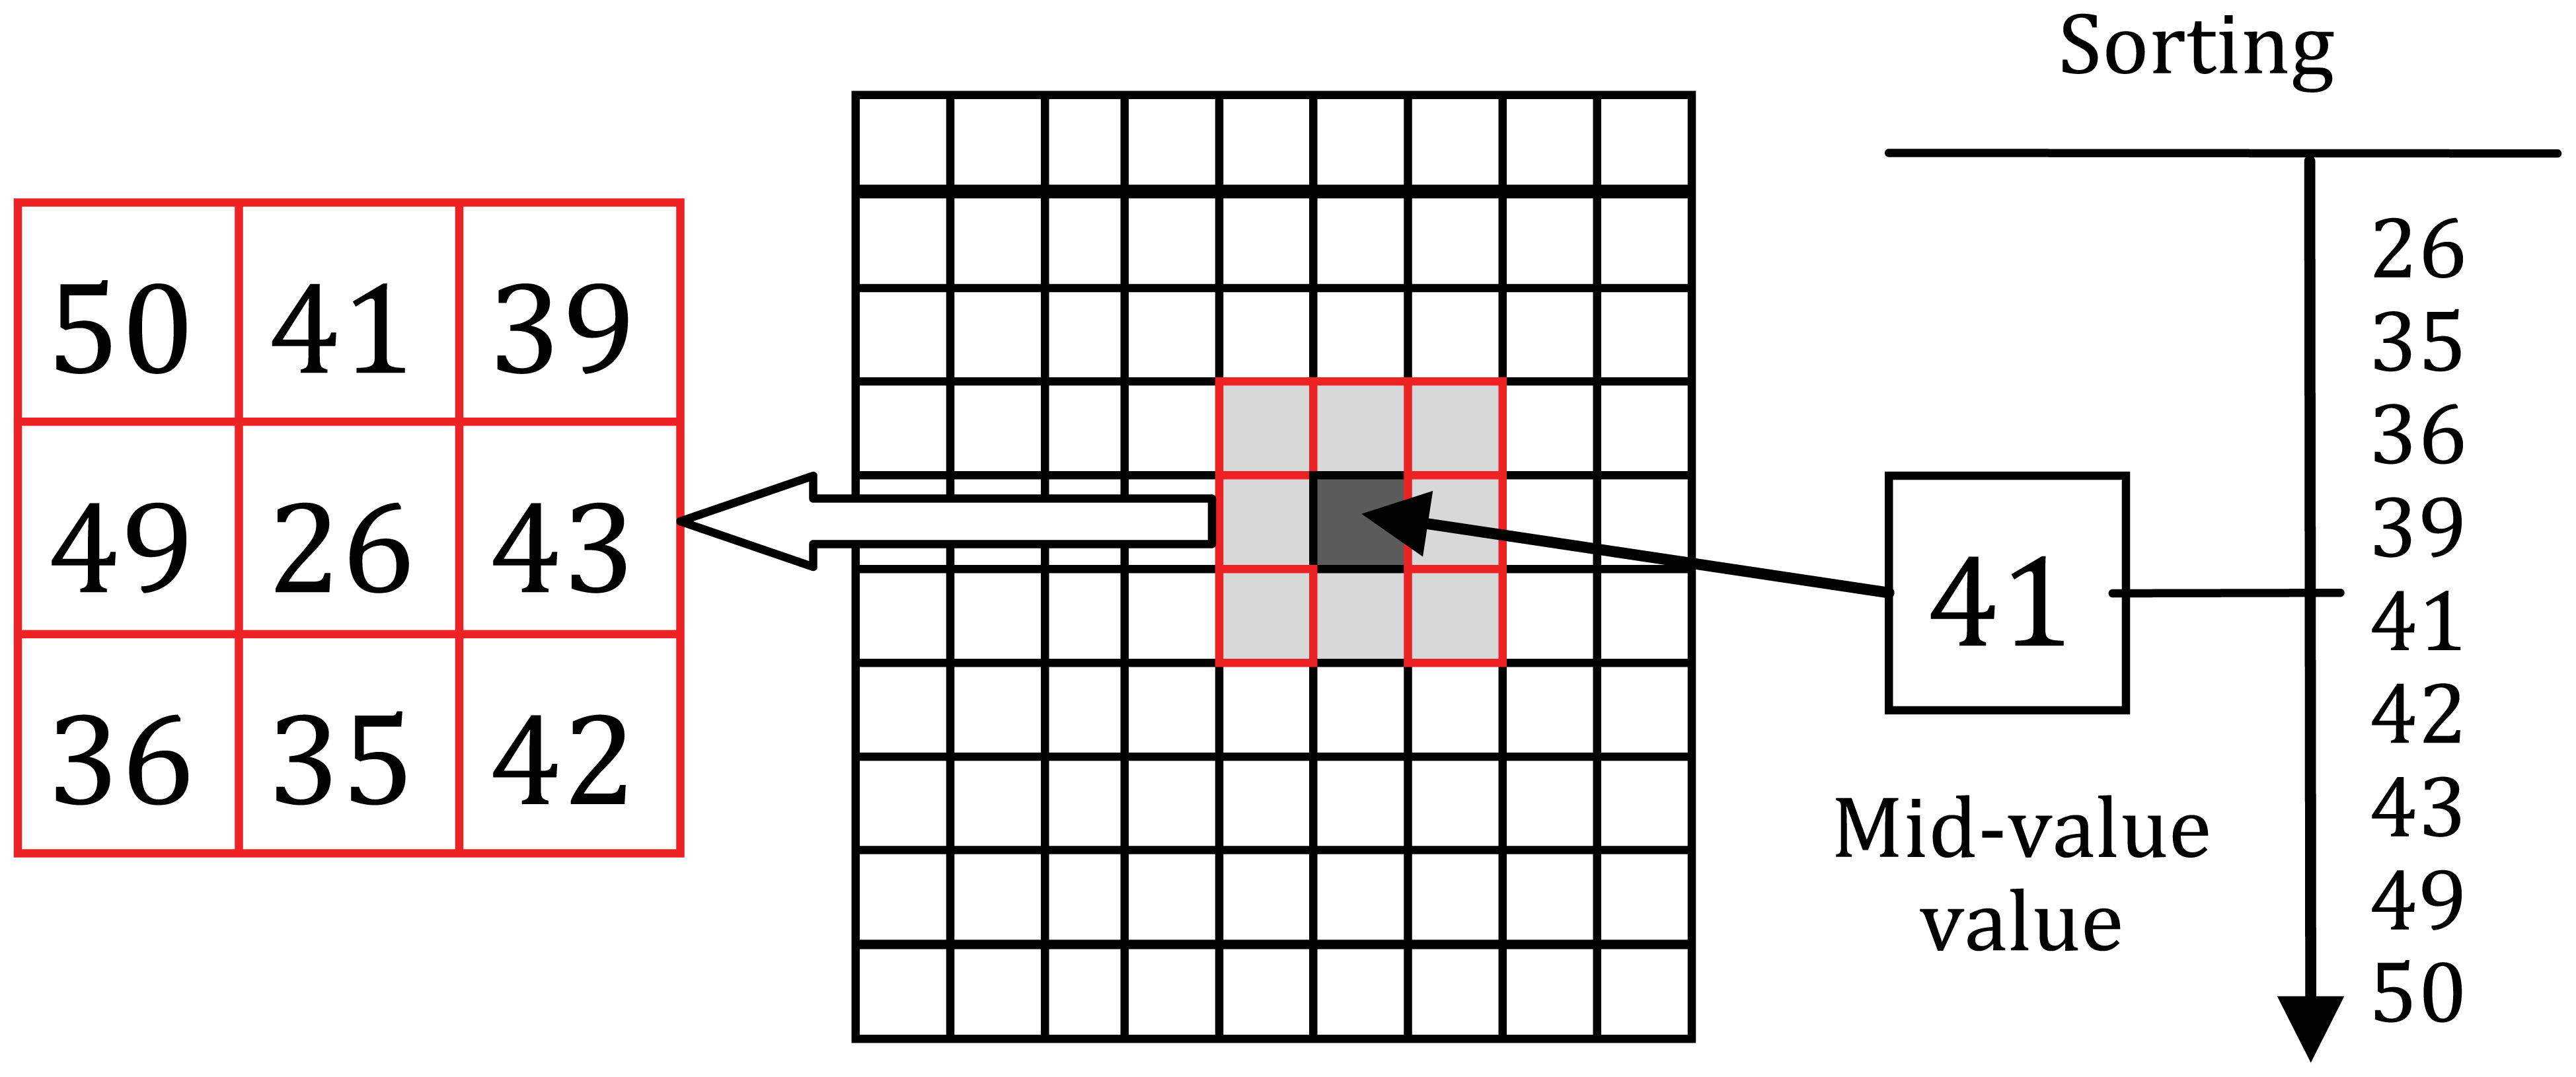
Mid-filtering principle
First, determine an odd pixel window, W and when each of the pixels within the window is ranked according to the size of greyscale, use the greyscale value of the intermediate position to replace the pixel value of the centre of the window.
It can be expressed by the following formula
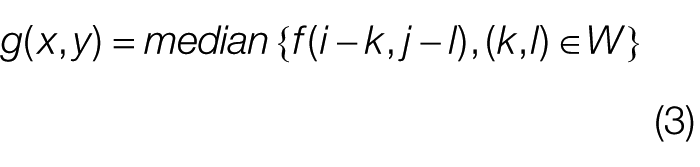
where W is the selected template, or window size, generally chosen to be 3 × 3, 5 × 5, or 7 × 7. In order to express how this works more clearly, we add some noise to a source image. The images before and after processing by the median filtering method are shown in Figure 4 .
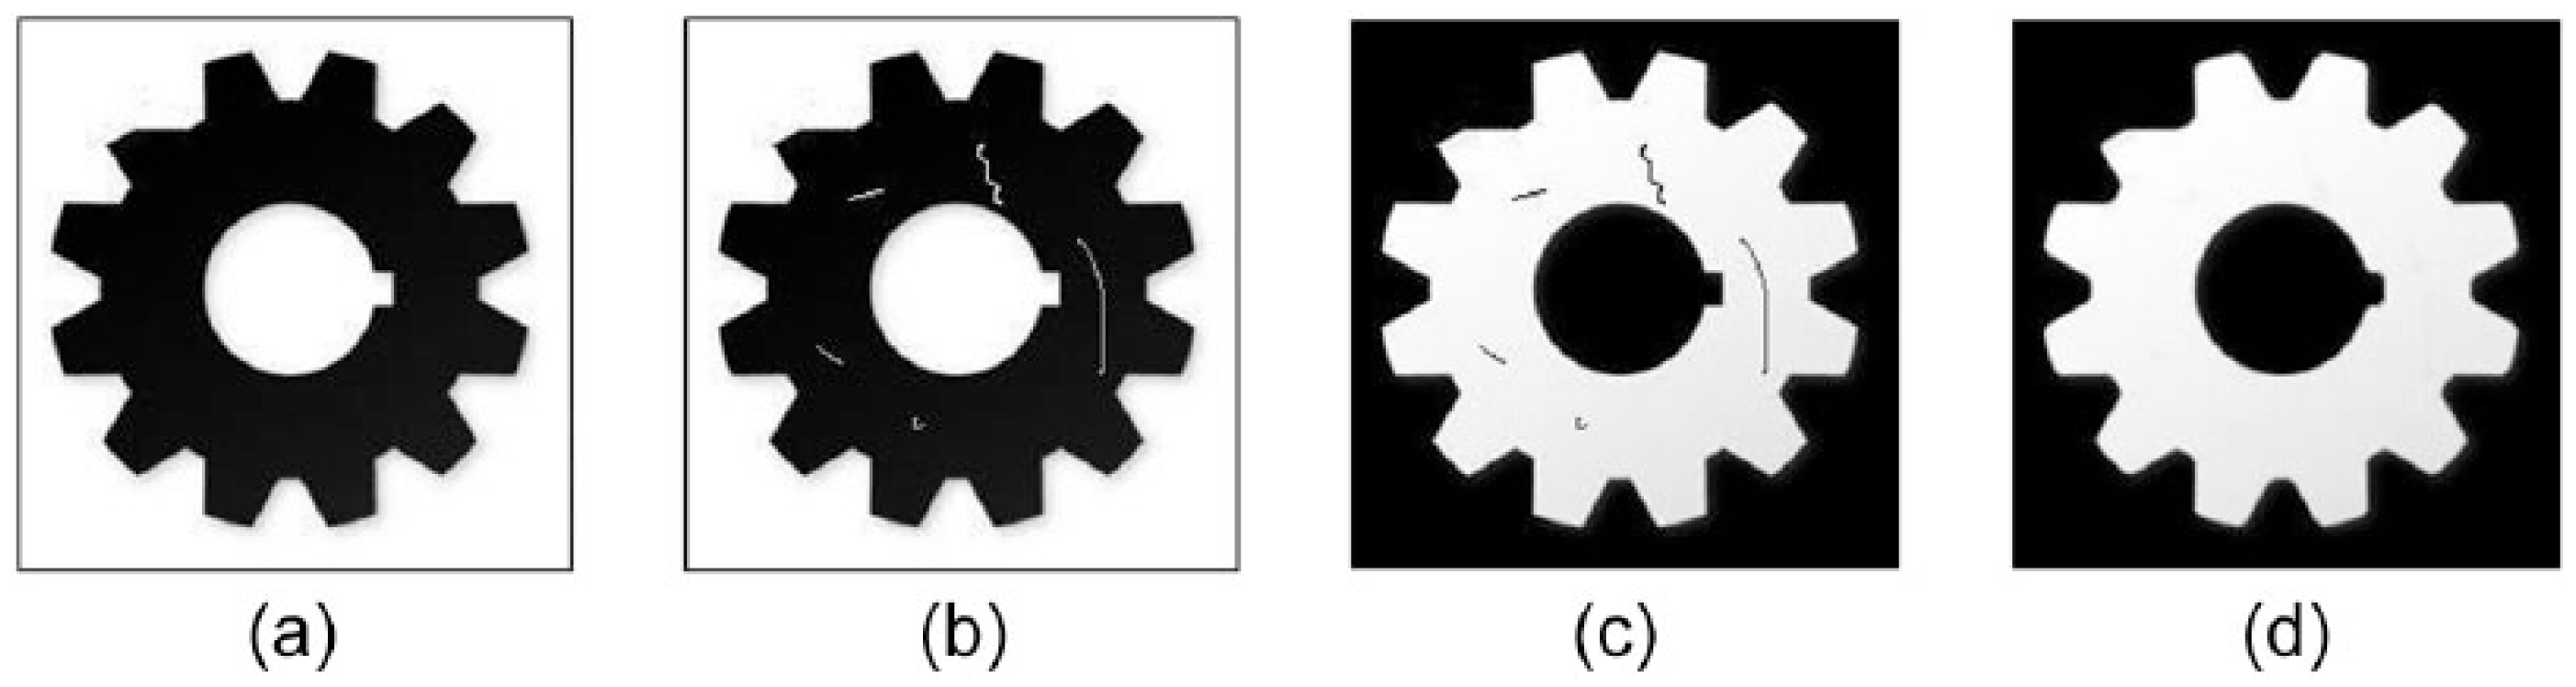
Image pre-processing to reduce noise: (a) source image, (b) noise image, (c) inverse, and (d) filtered image
C. Image binarization
Binarization makes use of the differences in greyscale characteristics between the extracted target image and its background, and regards the image as a combination of two regions that have different greyness levels (target and background). The key to distinguishing the two regions is to choose a reasonable segmentation threshold. When the greyscale value of a pixel exceeds this threshold, then the pixel belongs to the target; otherwise, it belongs to the background. In the gear images that are being processed, there is only one target and one background, and the greyscale of the target and background are more evenly distributed than before. Then, results of image binarization can be presented as a bimodal curve on a histogram, as shown in Figure 5(a) . A threshold value T is chosen between the two peaks, allowing the pixels of the image to be divided into two parts: the group of pixels with greyscale values larger than T (the target) and the group with values lower than T (the background). In order to improve the self-adaptive capacity of the system, we adopt an iterative threshold method. That is, we select an approximate threshold value as an initial estimated value, and then continuously improve this value, using the initial value to generate a sub-picture. Based on characteristics of the sub-picture, we can select a new and better threshold value. Then, this new threshold value is used to divide the image, and the resulting segmentation is better than the result produced using the initial threshold value. Binarization can be shown as
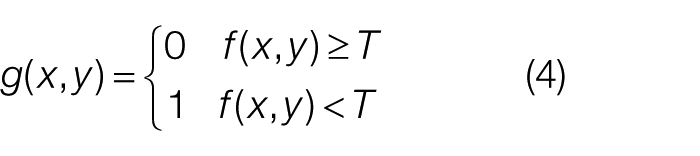
where f (x, y) is the original image, g (x, y) is the binary image, and T is the threshold. The portion of the image that assigned the value of 1 indicates the target gear, and the portion that assigned the value of 0 represents the background. The image generated from binarization is shown in Figure 5(b) .
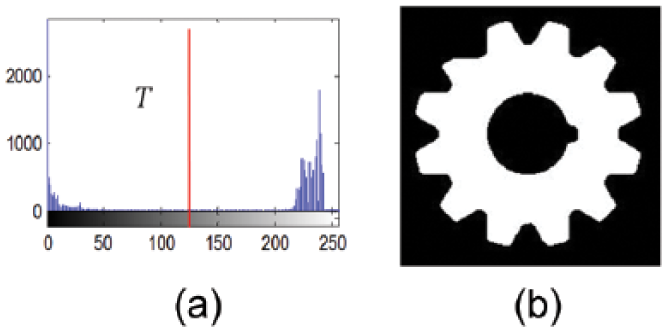
Image binarization: (a) histogram and (b) binarization image
IV. Parametric Analysis
A. Morphological processing
According to the analysis of image samples collected in the field, binary gear images have holes ( Figure 6(a) ) that must be eliminated using a filling algorithm. Such an algorithm is defined in the following paragraph. First, the binary image resulting from the pre-processing stage is input and some parameters are initialized. Starting from a point on the inside of the polygon area, the area is filled with a chosen colour until the border is encountered. The boundary is specified by a single colour, so the seed filling algorithm is used to process pixel-by-pixel until that boundary colour is encountered. The seed filling algorithm commonly uses the four-connected domain and eight-connected domain to perform the fill operation. Starting from any point within the region, all pixels in the region can be reached through the eight adjacent pixels in the upper, lower, left, right, upper left, lower left, upper right, and lower right positions. Using these neighbouring pixels, the entire region is recursively filled. The processed image is shown in Figure 6 .
Morphological processing: (a) binarization image and (b) holes filled image
B. Identifying the centre
As the benchmark of gear parameter measurement, the accurate measurement of the centre of a gear is directly related to measurement accuracy. Below, we describe our method of calculating the centre.
(1) Input the binary image.
(2) Take the gear obtained as the target from the binary image and record the coordinates of all points on the gear.
(3) Search and track the gear’s coordinates to find the edges of the gear.
(4) Identifying the collection of points furthest from the centre of the edge image in order to determine the coordinates of the minimum convex polygon containing the gear.
(5) Sequentially connect these coordinates, drawing the convex polygon in order to display it. The perimeter and area of the convex polygon are calculated.
(6) Use roundness level detection on the convex polygon. The method is described below.
Assume the circumference of the convex polygon is C and its area is A. Then the roundness level of the gear is
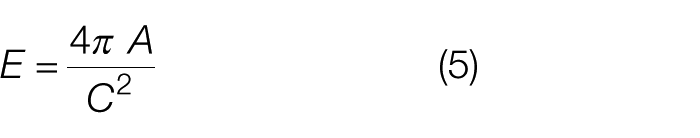
If the roundness level E < 0.9, the gear is regarded as deformed, and none of the following operations will be performed. Otherwise, we will continue through the steps.
(7) Use the above coordinate values and the least square method to perform circular curve fitting.
(8) Using the fitted circle, calculate the centre (x0, y0) and the radius rH of the tooth-top circle.
(9) In the same manner, the points nearest to the centre make up the tooth-bottom circle. The radius of the bottom gear circle rL can be obtained using least square fitting.
(10) After fitting, determine the tooth-up circle and tooth-bottom circle. The formula is as follows
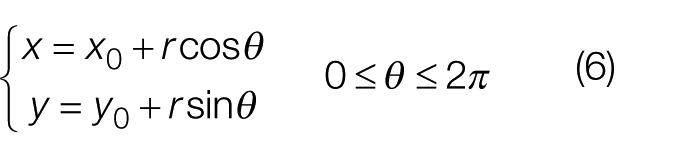
where (x0, y0) is the centre coordinate got from step (8). When r = rL, we can get the tooth-bottom circle, and when r = rH, we can get the tooth-top circle.
As is shown in Figure 7(a) is the smallest polygon which can contain the gear, and the fitted circle formed from the polygon coordinates is shown in Figure 7(b) .
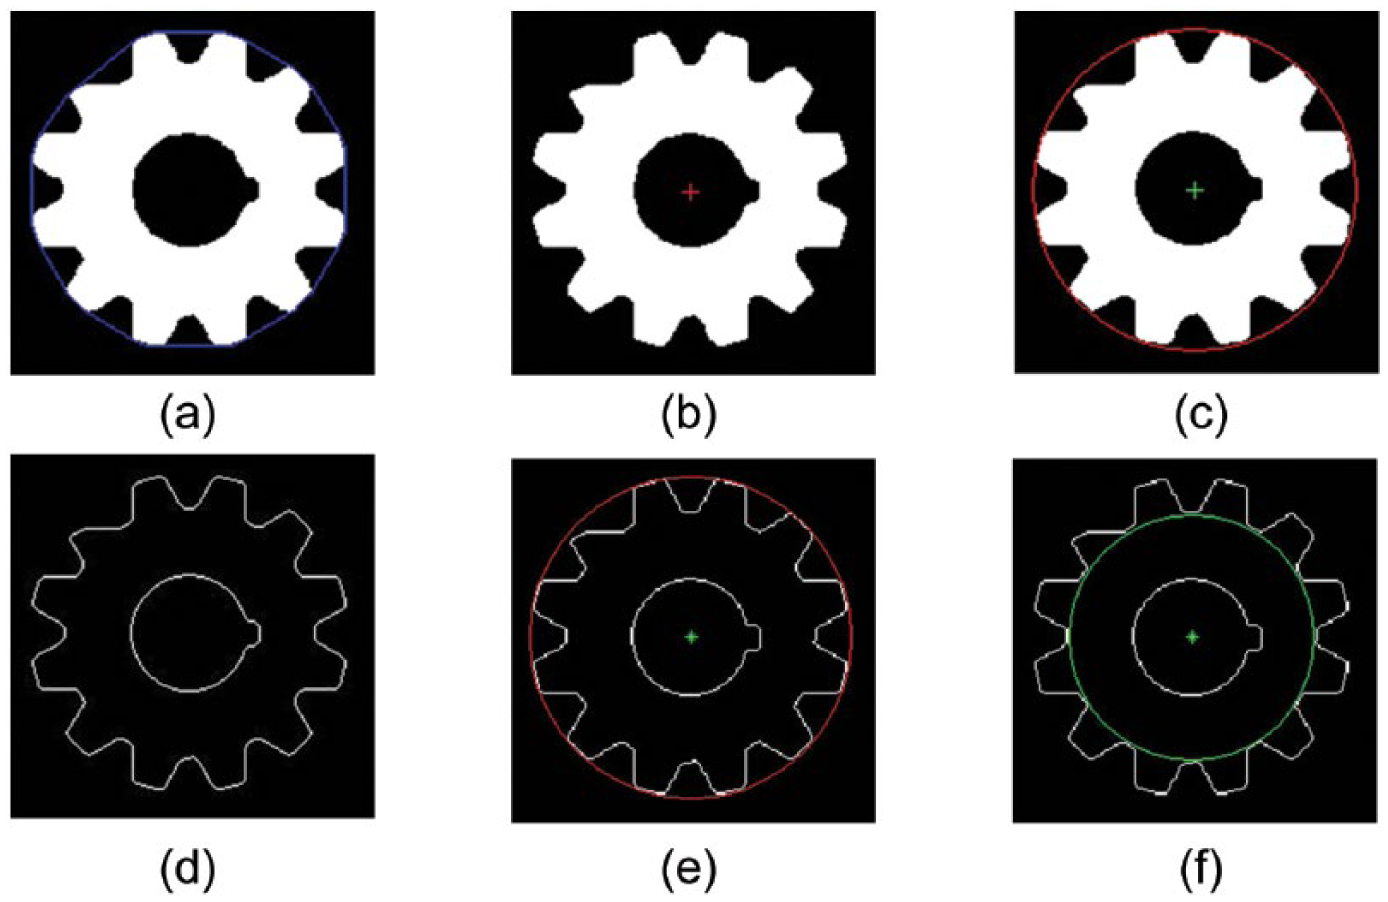
Determination of the gear centre: (a) polygon, (b) region centre, (c) fitted circle, (d) boundary, (e) circle of tooth-top, and (f) circle of tooth-bottom
C. Division of the upper gear and bottom gear
In the above steps, we calculated the centre of the gear, the radius of the upper gear circle, and the radius of the bottom gear circle. Using these data, gear faults can be detected. The detection method for gear fault is described below.
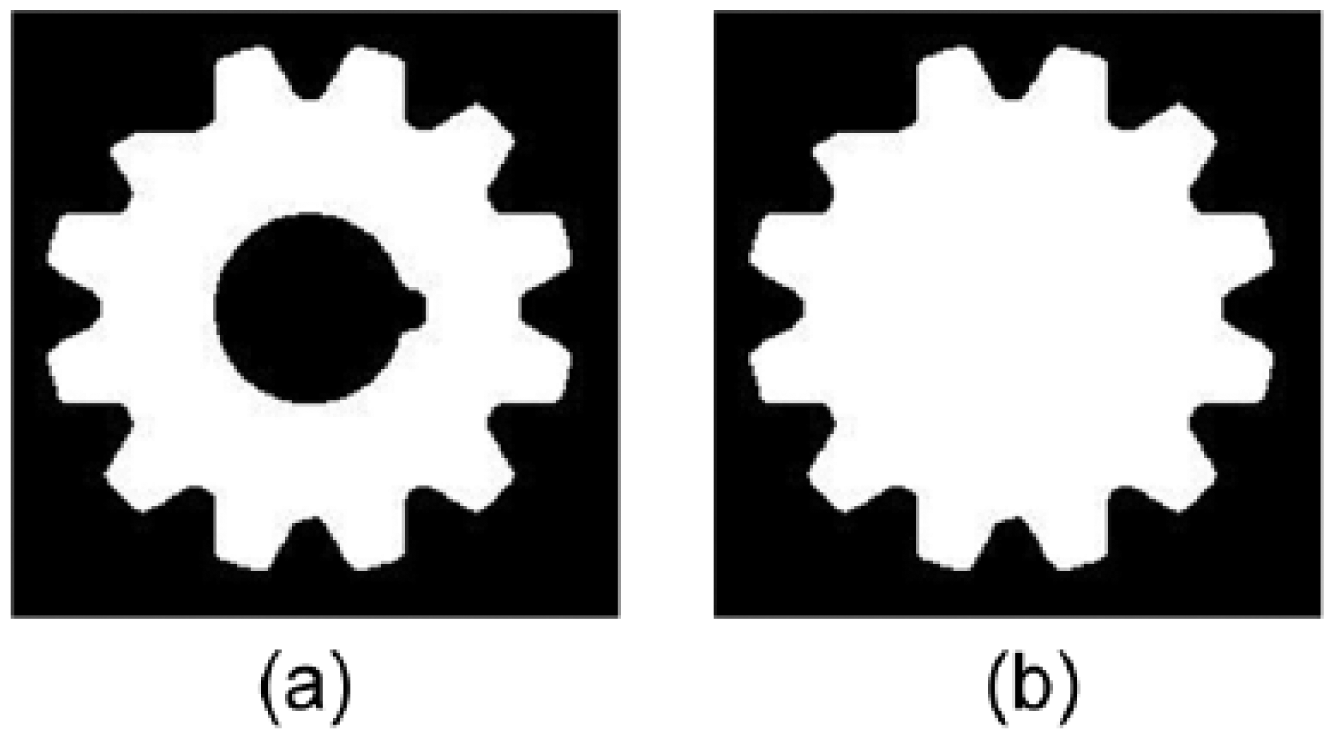
(1) Input the image and initialize the parameters. In order to facilitate calculations, remove the edge region of the target gear and retain the entire gear target image in the source image. Results are shown in Figure 8(a) .
(2) Draw a circle using the gear’s centre hole as the centre and a value between the radius of the lower gear circle and the upper gear circle as the radius. Assume that the radius of the upper gear circle is rH and the radius of the lower gear circle is rL. Then, the radius of the aided circle is
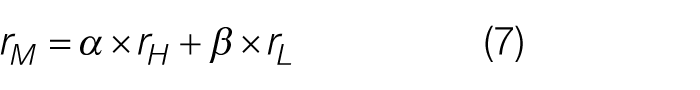
where α and β are coefficients of the upper gear circle and the lower gear circle, respectively, which satisfy the condition: 0 < α < 1, 0 < β < 1, and α + β = 1.
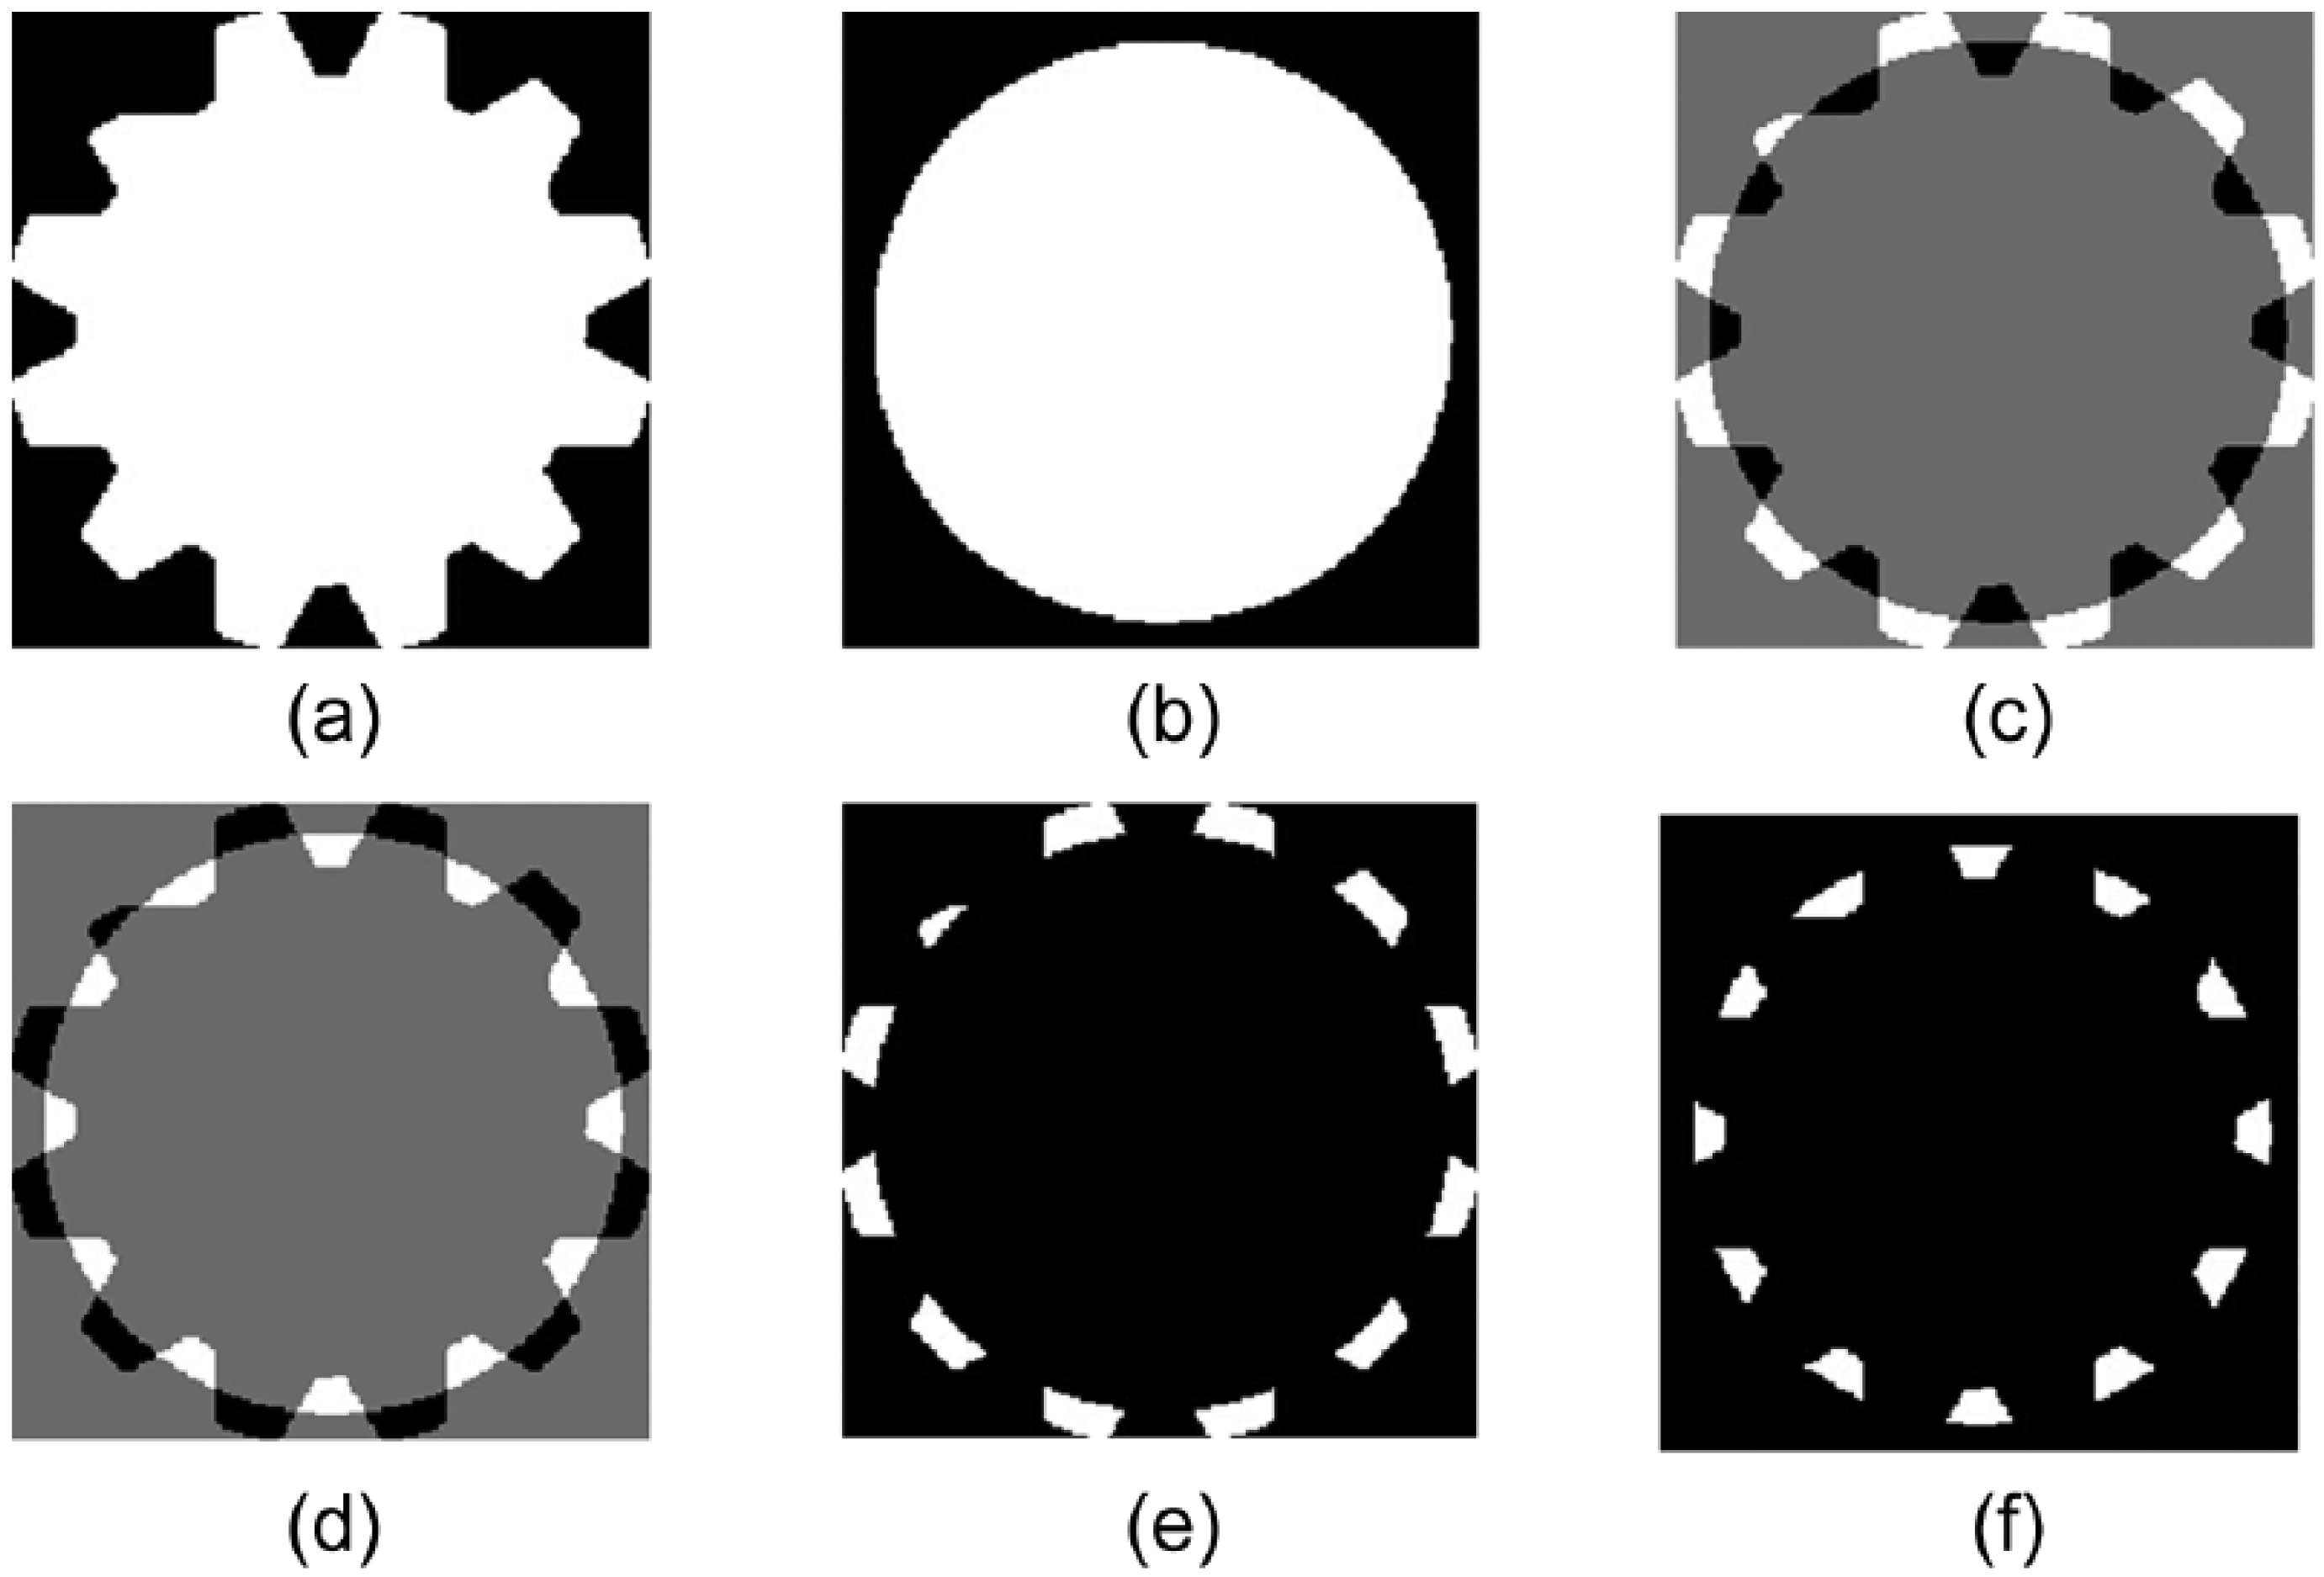
Tooth shape acquisition: (a) gear image Igear, (b) mask image Imask, (c) Igear − Imask, (d) Imask − Igear, (e) tooth-top, and (f) tooth-bottom
(3) Set a blank image of the same size as that of the pure gear image. Take the gear centre point as the centre and rH as the radius of a circular mask. Set the pixel value in the circle to 1 and the pixel value outside the circle to 0. Assume that α = 0.5 and β = 0.5, then the radius of the mask image is rM = (rH + rL)/2. The mask image obtained is shown in Figure 8(b) .
(4) If the gear image subtracts the mask image, then the upper gear image can be obtained. If we call the gear image, Igear, and the mask image, Imask, then the image of the upper gear IH is calculated as
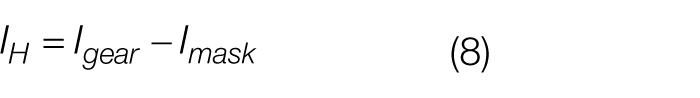
The result of this calculation is shown in Figure 8(c) , where the white area represents the upper gear. Figure 8(e) is a pseudo-colour image formed after the actual calculation.
(5) Similar to step 4, we now subtract the gear image from the mask image in order to obtain the lower gear image IL.
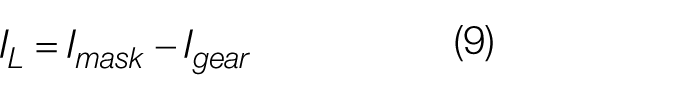
The result of this calculation is shown in Figure 8(d) and Figure 8(f) is a pseudo-colour image formed after the actual calculation.
D. Analysis of gear faults
As for the tooth-bottom gear image and the tooth-top gear image obtained from the above steps, mark the image through the region labelling method, then the actual geometric parameters of the gear can be obtained. The first step to calculating gear parameters is to mark a label for every tooth.
The purpose of a mono-gear label is to attach the same label to connected pixel points. Different connection components of a mono-gear have different labels. A mono-gear area label is an important part of binarization gear image processing. During the processing, the different mono-gear connection regions are separated, and the number of gear teeth in the image can be counted and the geometric parameters of the various regions can be analysed. The specific steps are as follows:
(1) Scan the binary image from the upper left corner of the image. Add a new label when encountering an un-tagged target pixel P (a white pixel).
(2) Add the same tag when encountering pixels connected to P (i.e. the same connected component).
(3) Add the same label to all connected and tagged pixels.
(4) When all of the pixels that are connected together are labelled, add a mono-gear connection region with the same label.
(5) Return to step (1) and re-search for new pixels without any labels added, and repeat the above steps.
(6) Display the labelled upper gear image in pseudo-colour, as shown in Figure 9(b) . Different gear teeth use different colours.
(7) Using the different labels, calculate the amount and area of the tooth-top of gear.
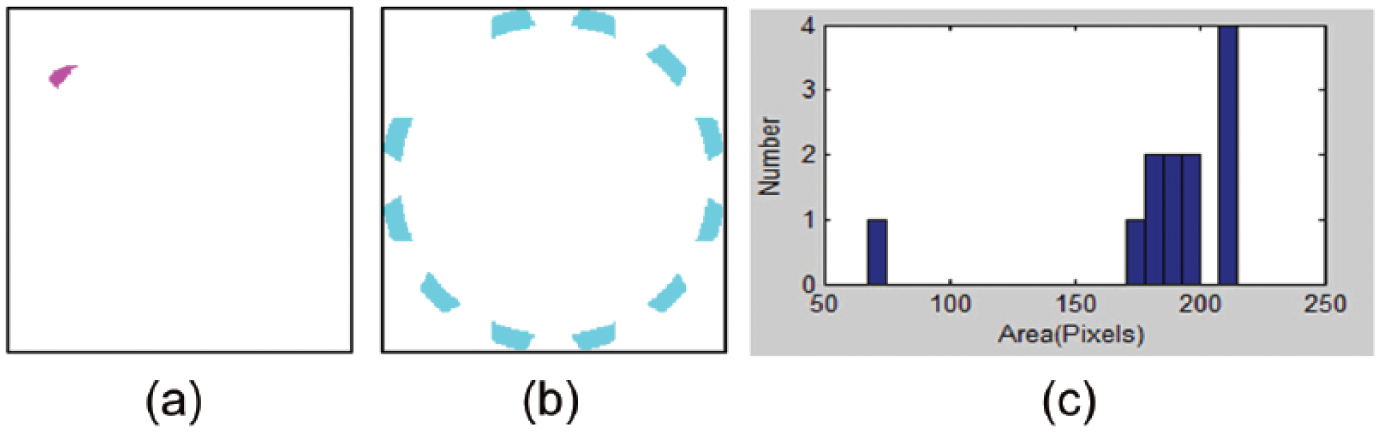
Parameter analysis: (a) fault region, (b) qualified region, and (c) area histogram
If the amount of the upper gear n is the maximum of the labels, and the area of each tooth is the number of pixels in the connected region, then it can be expressed by the formula
(8) Calculate and display the statistics of the area of each upper gear teeth in a histogram, an example of which is shown in Figure 9(c) . As shown in the figure, we can see the amount of gear teeth n is 12.
(9) Obtain the average value of area of the upper gear,
(10) Determine the fault region by setting the threshold value. The rule used to determine whether something is a fault is

(11) Adopt the histogram method to output the analysis results.
Accordingly, the amount of gear teeth can be obtained by this manner, and the fault region can be found out. The fault region and the qualified regions can be seen from Figure 9(a) and (b) , respectively. The geometric parameters of the lower gear area can be obtained using the same method.
E. Determination of the modulus
The modulus of the gear is determined using the radius of the upper gear circle, rH, and the radius of the lower gear circle, rL. It can be calculated in the following way.
(1) To estimate the preliminary modulus value m, we calculate
where n is the number of teeth on the gear.
(2) Select the standard gear modulus relatively close to the gear we are evaluating. Generally, there may be two or three standard modulus, so we regard them as m1, m2, m3, ranked by the size assuming that m1 > m2 > m3.
(3) Compare m with the modulus in the table of standard modulus. The actual modulus of the gear can be obtained.
Using the above steps, the standard modulus m of the gear can be finalized.
V. Experimental Analysis
In order to verify the effectiveness of our proposed method, we performed experiments. The number of CCD pixels used in the system was 1280 × 1040, and the area of the imaging unit was 4.068 × 3.686 mm. The experimental process was comprised of the following steps:
(1) Calibration. Use a standard gauge block, and, without changing the measurement parameters, calibrate the ratio of the measurement system K = L/L0, where L is the size of the computer image of the block, expressed in number of pixels, and L0 is the standard size of the block in millimetres.
(2) Measurement. Test the image of the block through a calibrated measurement system. The image size is L1 pixels. Then the measurement size of the block in millimetres is L2 = KL1.
(3) Decision. Compare the standard size with the measured size and judge whether the measured size of the block is within the allowable range. The measurement results and error are shown in Table 1 .
Measurement results of gear parameters.
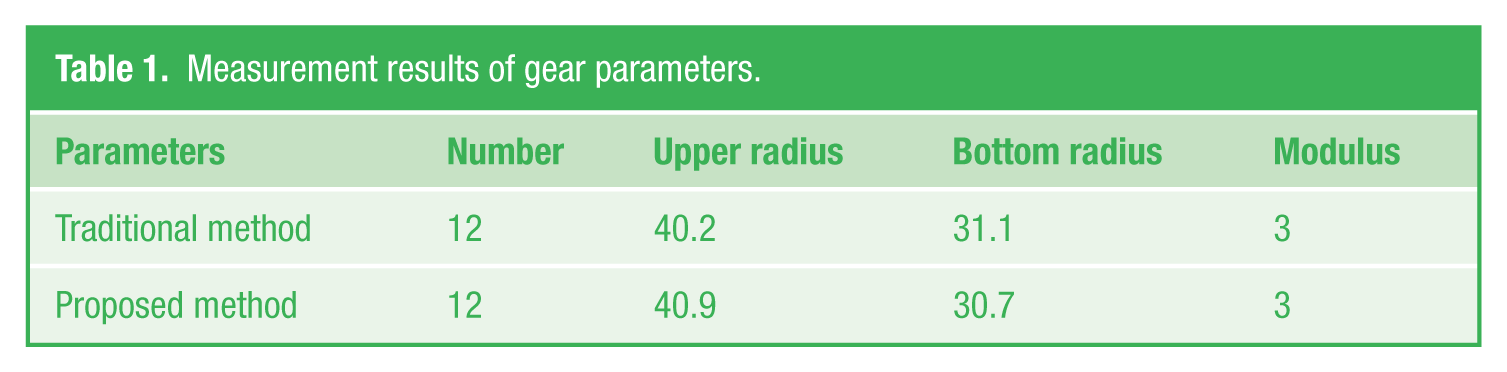
After calibration, we perform the measurement and calculation for a gear and the results are shown in Table 1 . The traditional measurement value means the measurement values obtained using manual mechanical callipers, which measure to an accuracy within 0.1 mm. Table 1 shows the comparison between the measurement value of the gear parameters using the proposed method and the manual measurement values.
By comparing the measured data of the proposed method to the results of manual measurement, we can see that the results are essentially the same, meeting the requirements of the system design. The causes of error are mainly due to the following aspects:
(1) Calibration error. An error during the process of measuring the standard block has a direct impact on the precision of actual measurement. In order to reduce possible errors in the measurement of the test block, the measurement can be repeated several times in order to find the average value.
(2) Optical error. In the actual optical system, the unevenness of light intensity in the field of view and the interference of external light affect the imaging quality of CCD and cause measurement errors during the extraction of edge features. Additionally, the imaging plane of the CCD camera and the surface of the measured part are not completely parallel, so there are small measurement errors due to distortion.
(3) Software algorithm error. In the measuring algorithm, the upper gear circle and the lower gear circle are obtained using the least square fitting method, and this algorithm itself is prone to errors.
VI. Conclusion
The paper designed a measurement system of gear parameters based on machine vision. We collected images with a camera, which were transmitted to the computer via the acquisition card. We achieved non-contact measurement of gear parameters by combining the powerful data processing capability of computer with image processing technology. The experiments showed that hardware structure of the system is simple, stable, and reliable and performs with good speed and high precision. In this way, our approach meets the functional requirements of conventional measurement of gear parameters. Our system also greatly improves production efficiency and the degree of automation of the production process in industrial production of large quantities, meeting the requirements for measurement accuracy in actual production scenarios. The measurement time is only a few seconds, which meets the requirements for measurement speed in industrial measurement and had a large theoretical and practical significance.
Footnotes
Funding
This work has been supported by National Natural Science Foundation of China (No. 61403283), Shandong Provincial Natural Science Foundation (No. ZR2013FQ036), the Spark Program of China (No. 2013XH06034), the Spark Program of Shandong Province (No. 2013XH06034), and Technology Development Plan of Weifang City (No. 201301015).