
Abstract
The splash phenomenon is the first stage of water erosion on the soil. It occurs when the water drops of the rain strike the surface. The impact of the water drop is fast. But if one has a fast enough measuring system, it can be considered as a temporally extended phenomenon. The aim of this paper is to describe a system for the measurement of the dynamic of the changing forces when a water drop interacts with the surface during impact. The constructive assumptions and validation of the measurement system, which has been based on piezoelectric sensors, are also presented. The system allows one to measure the changes of the force with the frequency of 150 kHz. The maximum force is 200 N, which is quite sufficient for all sizes of water drops which occur in nature and their maximum speeds. The results of test measurements, that is, the changes of the force obtained from water drops falling on the sensors, are also shown.
I. Introduction
Soil, which is a natural product of the top layer of Earth’s crust and the foundation for many ecosystems, undergoes continuous degradation induced by a variety of different factors. One of them is the effect exerted by the rain precipitation. Although essential for maintenance of life on Earth, rains can also be destructive for soil, depending on its intensity. The impact of a single water drop contributes to disintegration of soil aggregates, produces transportable sediment, accelerates soil surface incrustation, reduces infiltration, and increases surface runoff, thereby contributing to soil erosion.1,2
The water erosion phenomenon has been widely investigated.3 –6 However, most investigations have focussed on the weight of soil material transported by splashing7,8 or on the determination of soil detachability. 9 Another research area concerns the analysis of precipitation and its effects. The majority of these publications present investigations of natural rainfall in field conditions10 –12 or rainfall simulated by sprinklers in laboratory experiments.13 –15 Relatively little research has focussed on the impact of a single water drop on the soil surface and the effects of this phenomenon. In order to facilitate this type of research, it is necessary to develop a methodology based on appropriate measurement equipment.
Investigations have been carried out to measure the impact of a water drop on a water layer 16 or soil covered with a layer of water. 17 Many researchers have addressed the issue of the velocity of a falling drop.18,19 The relationships between the height of the drop fall and final velocity have been determined for drops with different diameters, and the threshold value of the drop fall height above which the velocity does not increase has also been determined. 20 However, the question of how the water drop impact proceeds on a surface has long been unanswered. Numerical experiments and visual observation do not provide information about the interaction accompanying the impact.
The literature presents several approaches to the impact of a falling drop on the surface and its effects. Probably the most common method is analysis of images recorded using high-speed cameras.21 –23 Authors of some reports have employed other techniques, for example, analysis of images of splashed particle tracks 24 or the 3D photo-reconstruction technique. 25 The water drop impact can also be characterized by the direct measurement of the force.26 –28 However, because the water drop impact always takes place on a given surface, it would be more accurate to state that the measurement of pressure takes place instead of the measurement of force.
There are many commercially available pressure sensors, and new sensors continue to be developed. Therefore, the sensors that would be best suitable for evaluating the studied phenomenon have to be determined. Since the water drop impact is a phenomenon that happens very quickly, the important feature of such sensors is their potential for measuring at as high a frequency as possible.
Dynamic pressure sensors are widely used in different types of the measurement processes. For example, for air-blast pressure measurements, silicon-based Micro Electro Mechanical Systems (MEMS) (piezoresistive) transducers 29 or fibre optic sensors30,31 are often used. PCB sensors have been used for measuring the dynamic collapse of cylindrical shells under impulse pressure loads caused by underwater explosions. 32 In turn, the dynamic air-pressure sensor Body Movement Sensor (BMS 21) has been used in medicine for respiratory monitoring. 33 Dynamic pressure sensors have also been used in the measurement of ocean waves34,35 and may even be used in the investigation of bulk materials such as, for example, rapeseed 36 or products derived from rapeseed, such as biofuels. 37 Relatively few articles (and articles that are not recent) can be found in relation to the use of dynamic pressure sensors for the measurement of water drop impact. In 1981, Imerson et al. 26 described the development and calibration of a device for measuring impact forces based on piezoelectric transducers. It was lead zirconate titanate ceramic (PZT-5H; Vernitron Ltd). Drops ranging from 2.66 to 5.77 mm in diameter falling from heights from 0.5 to 12 m were used for calibration. Imerson et al. concluded that the peak voltage outputs recorded by the instrument could be used to estimate the impact force of falling water drops. Nearing et al. 38 and Nearing and Bradford 39 conducted investigations involving measurements of the impact of a drop falling on a surface and determination of the maximum value of the force for drops with different diameters. The sensor applied in the above-mentioned investigations was relatively small (approx. 6 mm), which could create a problem with hitting its centre by a 4- to 5-mm-diameter drop, thereby affecting the accuracy of the measurement. Hinkle 27 presented the measurements conducted on a piezoelectric force transducer (Kistler model 9712A5) and 3.83-mm-diameter drops falling from 1.5 m with an impact velocity of 5 m/s. Hinkle’s 27 findings reported the limitation of the sensors, that is, a piezoelectric sensor can be used to measure the impulse of falling drops only for relatively slow impact velocities. Measurements of drops that have velocities up to 9–10 m/s require a sensor with greater resonant frequency or a lower oscillating mass. Jayawardena and Rezaur, 28 using a force transducer (Bruel & Kjaer type 8200), aimed to design and fabricate a simple instrument for measuring the drop size distribution and kinetic energy of drops during rainstorms. Drops from 1.5- to 5.25-mm-diameter falling from heights from 0.5 to 14 m were used for calibration. As a result of measurements, it was found that using a linear regression model overestimated the kinetic energy for smaller drops and underestimated it for larger drops, that is, the relation between transducer response versus drop kinetic energy was curvilinear.
Although investigations of the dynamics of changes in the drop’s impact on a surface were actually started in the 1980s, there are still many issues to be addressed to complete the analysis and description of the phenomenon. The development of technology (larger sensors, more accurate measurement cards with more efficient time resolutions) increasingly offers new measurement solutions that were unavailable previously.
The aim of this paper was to describe a system for measurement of dynamic of the force changes when water drop interacts with the surface during the impact. Construction of the system will facilitate further investigations, for instance, of the soil splash phenomenon.
II. Design Assumptions
The measurement range is one of the basic parameters of the designed system. In the context of application of the system, range can have two meanings: the range of measured forces (applies primarily to the sensor itself) and the frequency of analogue–digital processing (applies primarily to the cards connected to the sensor).
Both these values will be influenced by the duration of the drop impact on the surface. Based on literature 38 and experience, the time interval of this phenomenon can be estimated to range from 10 µs to 10 ms. Therefore, the range of the measured forces and sampling frequency have been determined.
A. Range of measured forces
The weight of the water drop is an additional assumption for estimation of the maximum value of the force of the drop striking the surface. The literature reports a relatively high diversity of droplet size. Since our objective is to define the upper measurement range of the designed system, maximum water drop sizes had to be assumed. Based on the literature, the maximum water drop size was assumed to be 7 mm (6-mm drop size in Epema and Riezebos; 20 6.7 mm in Ghadiri; 22 5.8 mm in Mouzai and Bouhadef 40 ). Given the assumption of sphericity, the weight of the droplet is approximately 0.2 g. Adopting the velocity of 9.5 m/s specified by Sharma et al., 41 the maximum drop velocity was estimated at 10 m/s. Hence, the kinetic energy of the impact was calculated to be ca. 10 mJ, and its momentum 0.002 N s.
The impact of a water drop on a surface is a dynamic process. In order to estimate the range of measured forces, certain simplifications should be adopted. Assuming that the impact is a central and plastic phenomenon, its total energy will be absorbed by the surface. The momentum conservation principle and the assumption that the drop will come to a complete stop on impact suggest that the impulse of force should be equal to the momentum. For the calculations, a 10 µs time for the impact and a maximum momentum of 0.002 N s were adopted
where p is the momentum, I is the impulse of force, F is the force and t is the time.
This implies that the maximum force of the impact will equal
These highly simplified calculations show that the proposed device should have a measuring range of up to tens of newtons. An appropriate safety margin should be adopted since we assume a constantly acting force at the time of the impact. This is in fact not true, as the dynamics of the impact are more complex and resilience may appear higher than the calculated force. The analyses do not take into account phenomena associated with surface tension, which generate additional interactions during the drop impact, or the final momentum of the splashed drop and adhesion phenomena at the sensor–water drop interface.
B. Sampling frequency
The proposed system is designed for recording phenomena whose total duration is several milliseconds, hence the need for the accordingly high frequency of measurement and recording of measured data. The upper limit of recording dynamics adopted for further consideration is the time of sound propagation in a water drop. In relation to the velocity of a drop falling on a surface and the velocity of soil particles and droplets detached through splash, the assumed frequency appears to leave a wide margin. The rationale for accepting this assumption is the expected possibility of recording mechanical waves that are propagated in a water drop striking the surface. Assuming a velocity of the mechanical wave of ca. 1500 m/s and a maximum water drop diameter of 7 mm, the period of the standing wave can be estimated at 9.3 µs; therefore, a frequency of 150 kHz has been assumed as a redundancy assumption.
The resonant frequency of the transducer may constitute a certain limitation. The mechanical system of the sensor contains certain resilience and an oscillating mass, hence it is characterized by resonant frequency. The frequency will be visible in the spectrum of the measured signal.
During selection of the transducer, its size has to be considered. An excessive measurement surface leads to the limitation of the measurement frequency bandwidth mentioned above. On the other hand, observation of the phenomenon of the water drop impact performed with the use of high-speed cameras showed drop deformation at the time of the impact (contact between the drop and the sensor surface). Before the drop ruptures, its shape changes and takes a substantially larger area than the drop diameter. Therefore, the surface should be large enough to prevent the wave produced by a landing drop – until the point of crown rupture – from falling beyond the sensor. Observation of images recorded with high-speed cameras revealed that from the point of view of application, the sensor should preferably have the shape of a circle with a radius of at least several millimetres.
C. Choice of the sensor
Tensiometric, accelerometric and piezoceramic sensors were taken into consideration to meet the assumptions adopted for the measurement system.
The tensiometric system, composed of a diaphragm, resistance tensiometer and a conditioning system, required substantial diaphragm deflection. This elastic deflection caused distortions in the observed phenomenon. A portion of energy accumulated in the diaphragm was absorbed by the water drop present on the diaphragm.
After the failure of the tensiometric sensor, we attempted the application of an accelerometric sensor. An appropriate rigid diaphragm was equipped with an accelerometer manufactured using the MEMS technology. The sensitivity of this system was satisfactory; however, the system was difficult to calibrate due to the interactions in the diaphragm–drop system. Additionally, there were some measurement errors associated with the low-frequency range of the sensor. Work on this concept was abandoned, although it has great potential for application.
Subsequent attempts involved the use of a piezoceramic sensor. The measurement diaphragm was covered externally with a layer of piezoelectric material and equipped with a suitable electrode ( Figure 1 ). The constructed sensor was placed on a rigid surface. Due to the high rigidity of the piezoceramic layer, the sensor frame was rigid as well. Measurements of the linear strain rate were performed in the range up to 100 N. The low measurement range introduced a substantial error, but the results of the deflection coefficient allowed estimation of Young’s modulus at the level of E = 30 GPa. Subsequent tests of the sensor revealed significant disadvantages to this solution. Analysis of the force values depending on the point of application of the force on the diaphragm showed considerable scattering of the results obtained. This may have been caused by internal stresses in the diaphragm or internal anisotropic polarization of the piezoceramic layer. The experiments prompted a search for commercially available sensors based on the piezoceramic phenomenon but offering different design solutions.
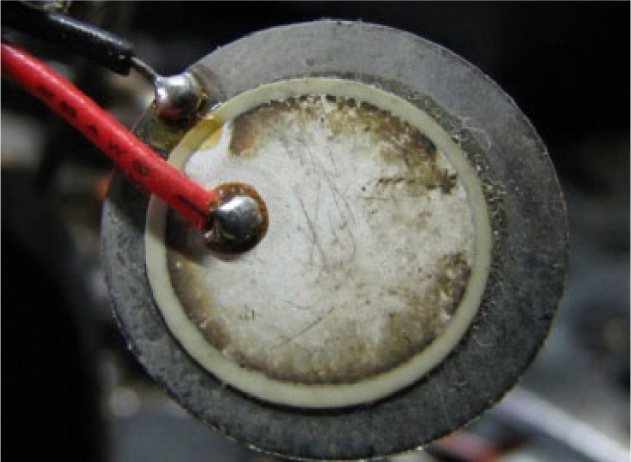
Structure of a piezoelectric sensor. The sensor was not applied primarily due to the dependence of the recorded force value on the site of force application
A sensor that fulfils the design assumptions is the dynamic pressure sensor 106B50 from PCB Piezotronics, Inc., as presented in Figure 2 .
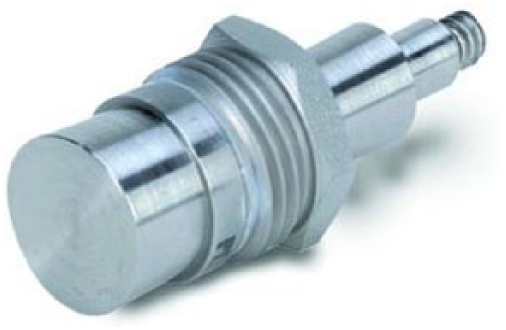
Dynamic pressure sensor 106B50, PCB Piezotronics Inc. (http://www.pcb.com/Products.aspx?m=106B50). The photograph from the catalogue has been published with the owner’s consent
The diameter of the sensor diaphragm is 15.7 mm (surface area: 193.5 mm2); hence pressure at a force of 1 N will be 5.16 kPa. Since the sensitivity of the pressure sensor is 72.5 mV/kPa, a sensitivity of 374.7 mV/N can be achieved when the device is used as a force sensor. This is a very good value device fulfilling the adopted assumptions. Resolution is another important parameter – for 106B50 it is 0.48 Pa (approximately 100 µN when converted into force). The difficulty in achieving this resolution in the designed system was the level of transducer noise; nevertheless, given the designed application of the system in the experiments, the achievable resolution of the whole system at the level of 10 mN was sufficient.
D. Description of the system for recording the dynamics of the falling water drop impact on a surface
A measurement bench was constructed using the 106B50 sensor described above ( Figure 3 ). The dynamic pressure sensor PCB 106B50 was installed in a dedicated enclosure (made of expanded polypropylene) ensuring tightness (the measuring diaphragm separated from the electronic parts). The sensor was coupled with an Integrated Circuit Piezoelectric (ICP®) amplifier. This solution significantly reduced internal noise of the system and yielded high resistance to electromagnetic interference.42,43 A drawback of the solution was the necessity of using an additional power supply.
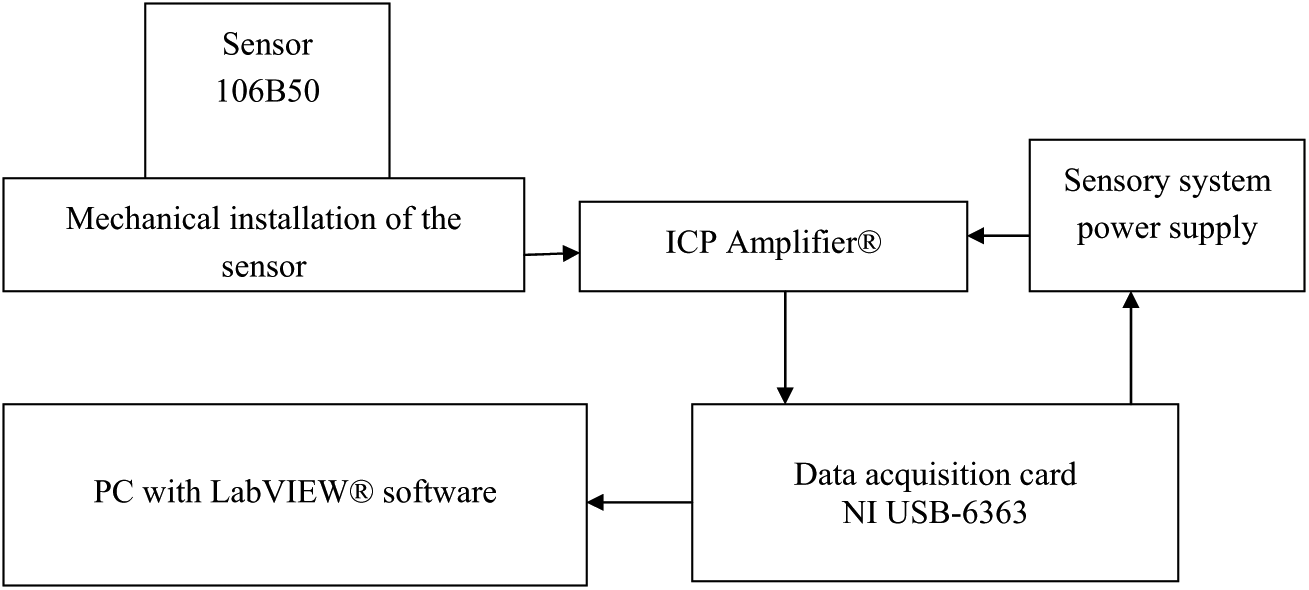
Scheme of the system for recording the dynamics of the falling water drop impact on a surface
The auxiliary power supply was achieved by installation of a direct current (DC)–DC converter using available voltage in the data acquisition card. For sampling frequency and versatility in signal acquisition, a National Instruments NI USB-6363 card was used, which at the use of one of the 32 inputs can be sampled at a frequency of 2 MS/s with a resolution of 16 bits and the input range of ±10 V. It is supported by USB interface and software developed in LabVIEW®. Through adequate synchronization, this solution allows maintenance of temporal dependencies of the observed phenomena.
III. Material and Method
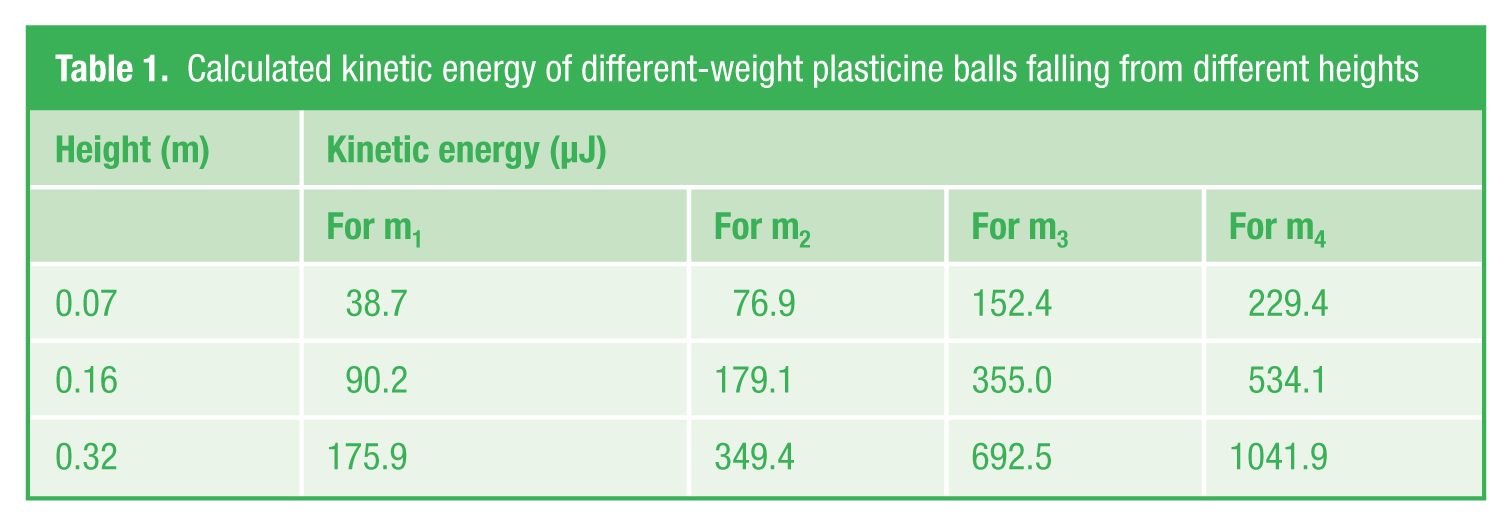
The validation of a measuring system (presented in Figure 3 ) was conducted in two stages. The plastic collisions were measured in the first stage using plasticine balls. The water drops (as the target research material) were used in the second stage. All validation measurements were performed in 10 replications. Plasticine was chosen due to its properties, that is, a low coefficient of adhesion and high plasticity. Therefore, it could be assumed that plastic collisions took place, that is, the total mechanical energy was converted into other non-mechanical forms. After free-fall and impact, this type of ball stopped and made no other movement. Physically, the same ball was used for the replications for the given mass. Since a wide range of kinetic energies present during the validation was necessary, four sizes of the plasticine balls and three heights were used. The following weights of plasticine balls (diameters are presented in parentheses) were prepared: m1 = 0.056 g (4.1 mm), m2 = 0.112 g (5.1 mm), m3 = 0.222 g (6.4 mm) and m4 = 0.334 g (7.4 mm). The balls were dropped onto the sensor diaphragm from a height of 0.070, 0.16 and 0.32 m (at a temperature of 20 ± 1 °C). The calculated values of final energy for the four weights of plasticine balls are summarized in Table 1 .
Calculated kinetic energy of different-weight plasticine balls falling from different heights
The water drops were used to assess whether the measuring system was valid for the investigation’s aims. A water drop with a diameter of 4.2 mm (standard deviation (SD) = 0.002 mm) was freely dropped from the following 18 heights (all heights in metres): 0.735, 0.805, 0.870, 0.935, 1.005, 1.075, 1.145, 1.215, 1.285, 1.355, 1.420, 1.490, 1.560, 1.625, 1.685, 1.755, 1.815 and 1.955. These heights were chosen because the researchers had employed them in many laboratory experiments. 44 Particular attention was paid to the central impact of the water drop on the sensor. However, because we had some doubts whether the central impact had taken place, we removed these doubtful results in a few cases.
IV. Results and Discussion
A. Validation of the measurement system with plasticine balls
The dynamics of the force changes in the time of the plasticine balls’ impact on the surface of the sensor were similar in shape. The example obtained for the ball that weighed 0.222 g and that fell from the 0.16 m height is presented in Figure 4 .
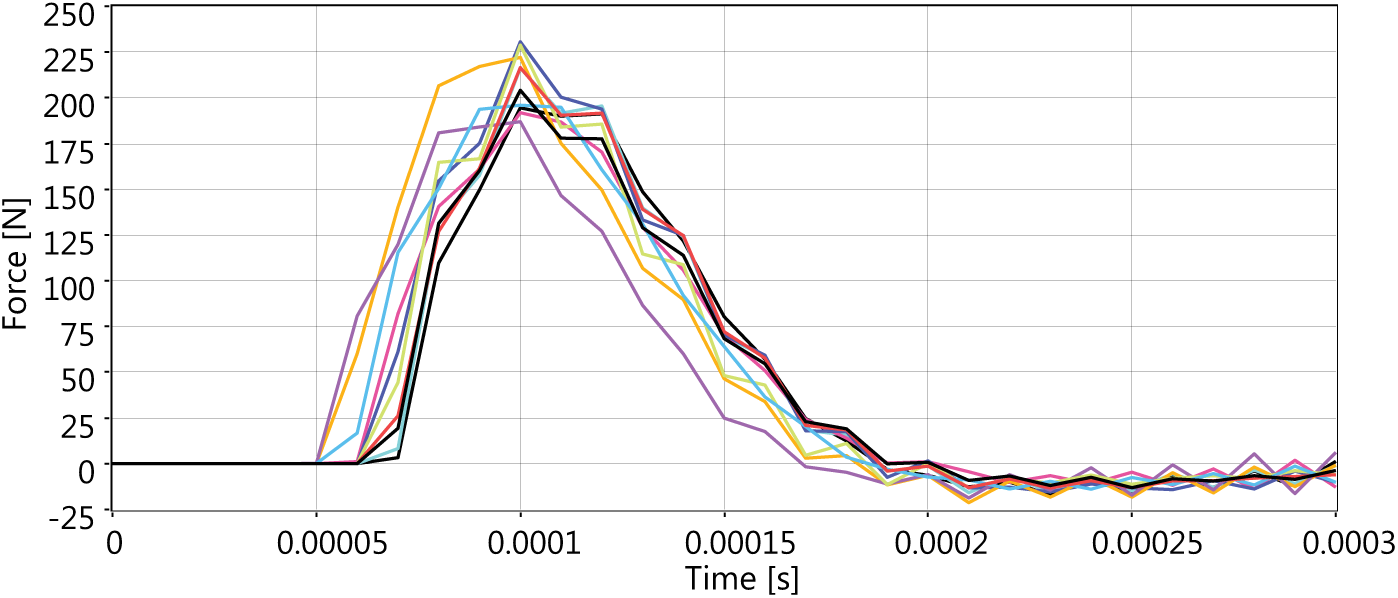
Example of a measurement series consisting of 10 waveforms of recorded forces during the impact of a ball with a weight of 0.222 g released from a height of 160 mm
Analysing Figure 4 , the small negative value when the pulse ended should be noted. This was evidence that the plasticine balls did not impact the surface of the sensor in a perfectly plastic collision. The changes of the force shown in Figure 4 can be characterized by the following parameters: the rate of the pulse rise/decrease and the maximum of the force. Having the full set of data (all ball masses and all heights), the analysis was carried out. The results of this analysis are presented in Table 2 .
The rate of the pulse rise, the rate of the pulse decrease and the maximum force values (with standard deviation (SD) and coefficient of variation (CV) obtained for the impacts of differently weighted Plasticine balls falling from various heights; results from 10 repetitions)
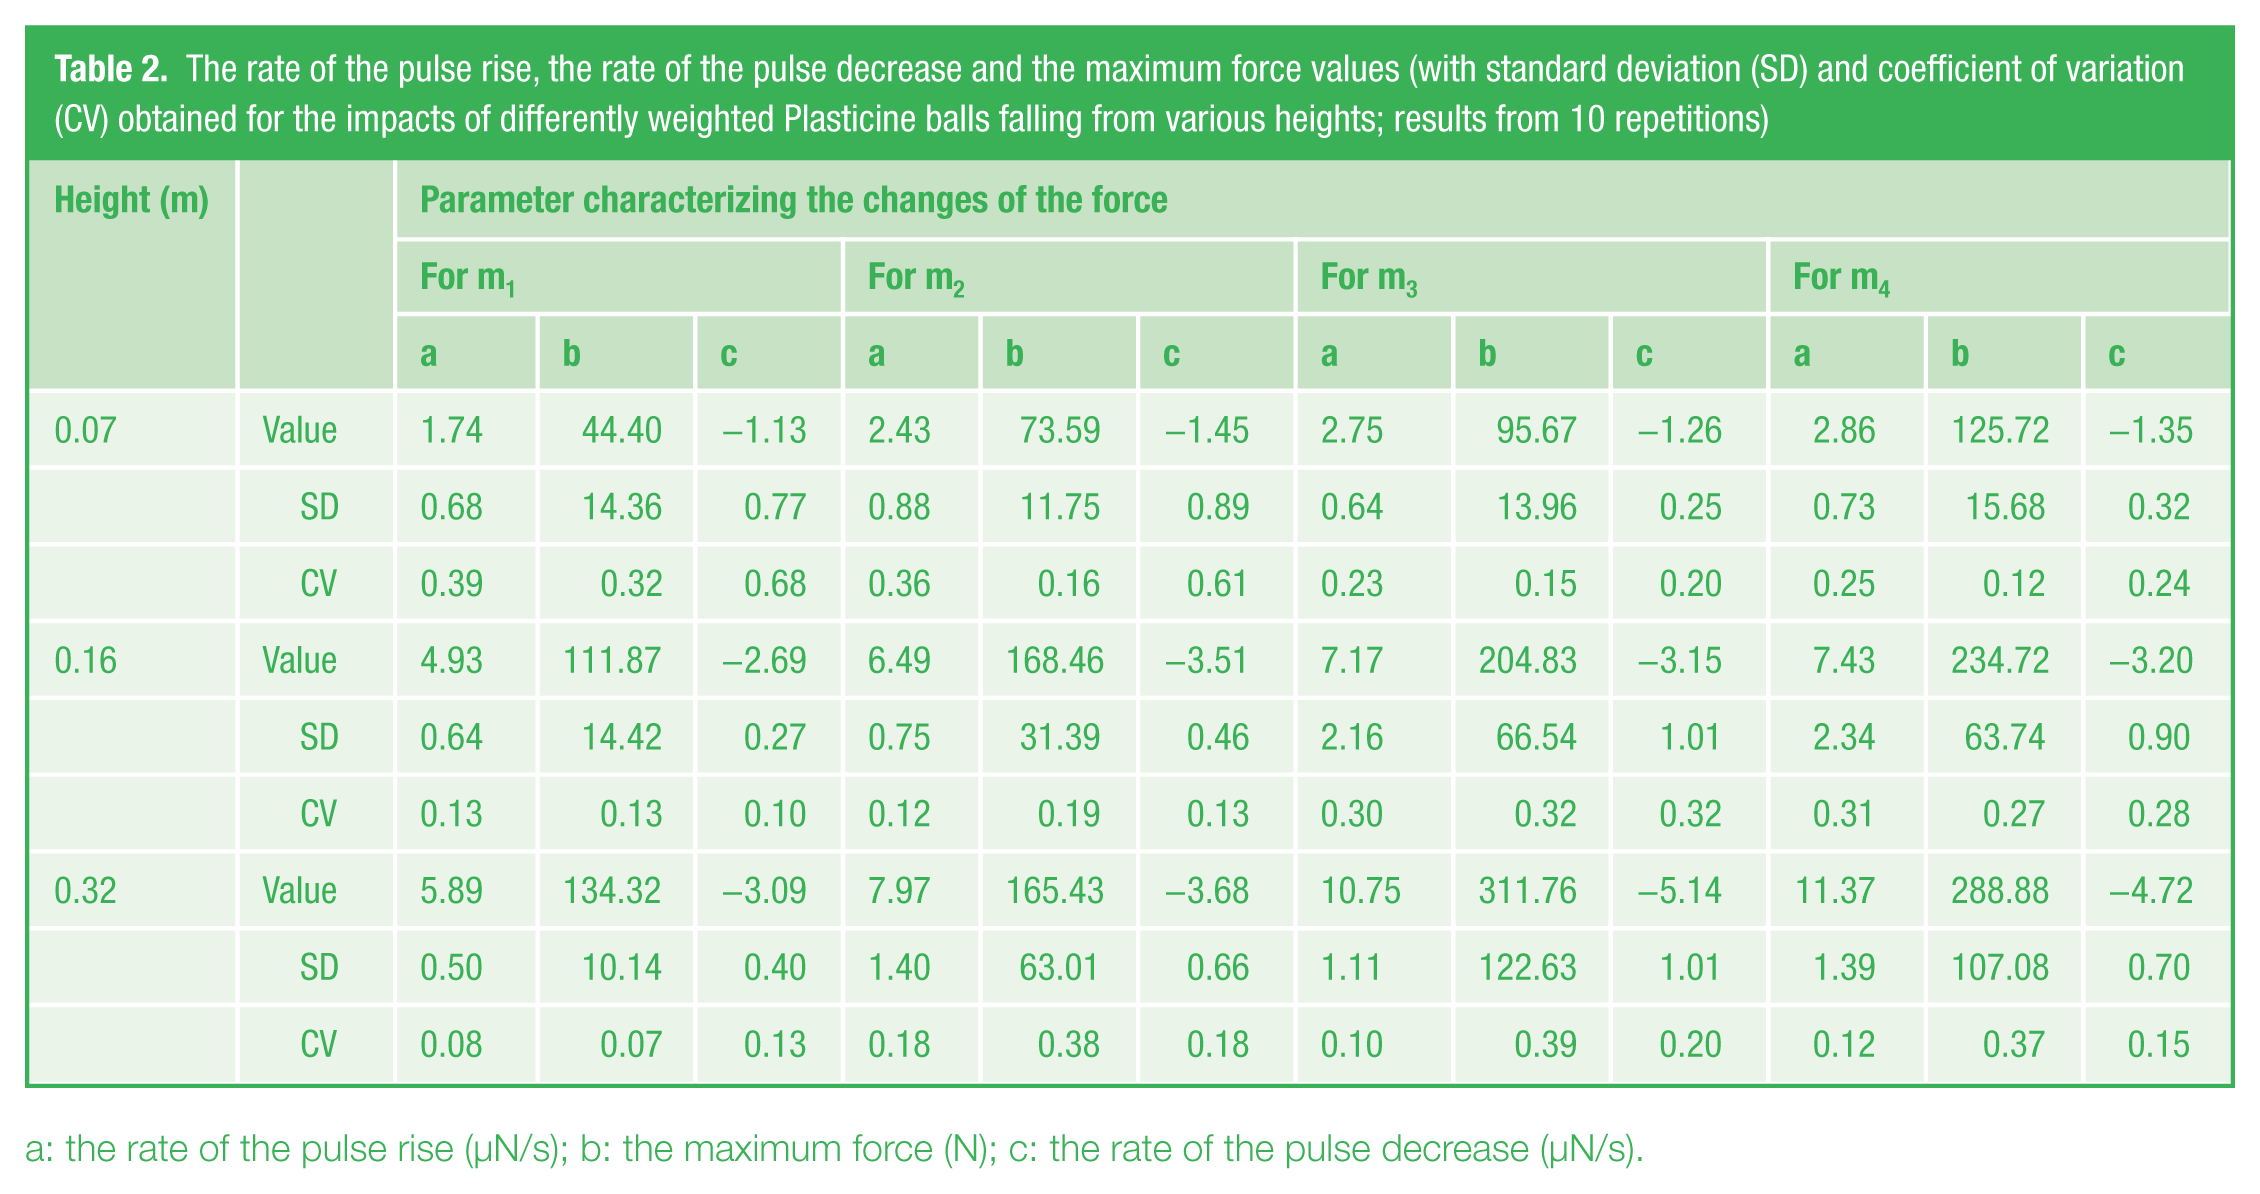
a: the rate of the pulse rise (µN/s); b: the maximum force (N); c: the rate of the pulse decrease (µN/s).
Table 2 shows that for all cases, the bigger the height, the faster the pulse rise rate. A similar trend was found for a decrease of the pulse – the bigger the height, the faster the decrease. The scattering of results, expressed by the coefficient of variation (CV), was at a level from 0.08 to 0.68, with an average value of 0.24. The integration of the force signal in time was the basis for the calculation of the momentum. The comparison of theoretical and calculated values of momentum on the basis of force measurements (hereinafter called experimental momentum) is presented in Figure 5 . The data from Table 1 were used for theoretical calculations.
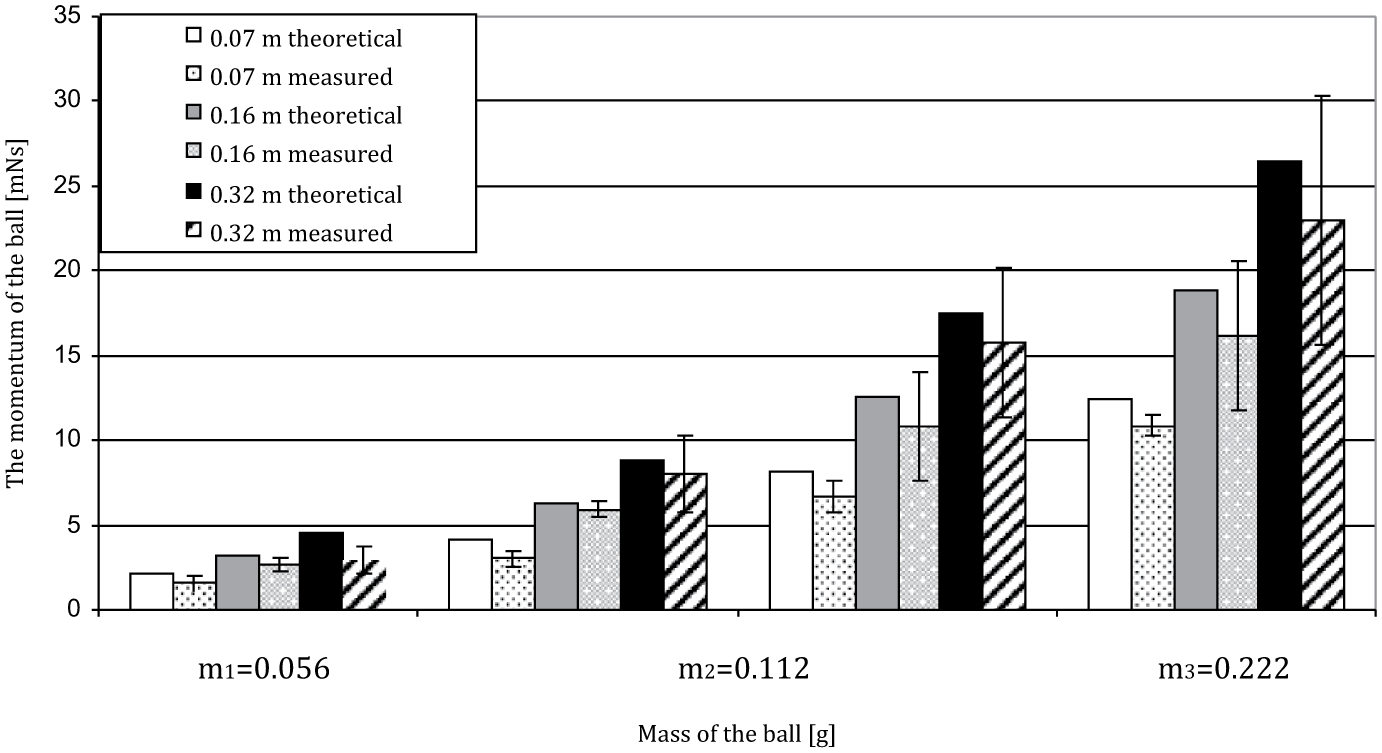
The theoretical (without bars, which express standard deviation (SD)) momentums for plasticine balls falling from different heights and calculated on the basis of measurements (with SD)
Figure 5 shows that in all cases, the theoretical value of momentum was bigger than the experimental value. This lower value of experimental momentum can be explained by the air resistance and turbulences behind the falling particle. The confirmation that these factors played an important role was as a result of the increasing scatter of results when height increased. The bigger the height, the higher the speed of the water drop, and more air resistance and turbulence were found to be present. It can also be expected that, due to the plasticine balls not having perfect spherical shapes, the movements of these balls were different (among others, different rotation could occur). If the movement was different, momentum was also different; this is expressed by the large bars of SD.
B. Validation of the measurement system with water drops
The graph in Figure 6 shows an example of the dynamic of the force changing during the impact of the water drop, which fell from 1.15 m on the surface of the sensor. The synchronization system was set in such a way that the impact began at 0.8 ms following the start of the measurements. To make it easier for the reader to follow, the following discussion will at all times refer to this moment (t0 in Figure 6 ). The maximum averaged value of the force was equal to 6.6 N (SD = 0.9 N) and was a similar order of magnitude as in the measurements of Nearing et al. 38 This maximum (t1 in Figure 6 ) was reached after 0.2 ms (SD = 0.02 ms). After this time, the value of force started to decrease and reached zero value at t2 = 2.9 ms (SD = 0.12 ms); Nearing et al. 38 reported a decrease in the force value to 0.5 N after 0.1 ms, while Hinkle 27 described impulses lasting 2 ms.
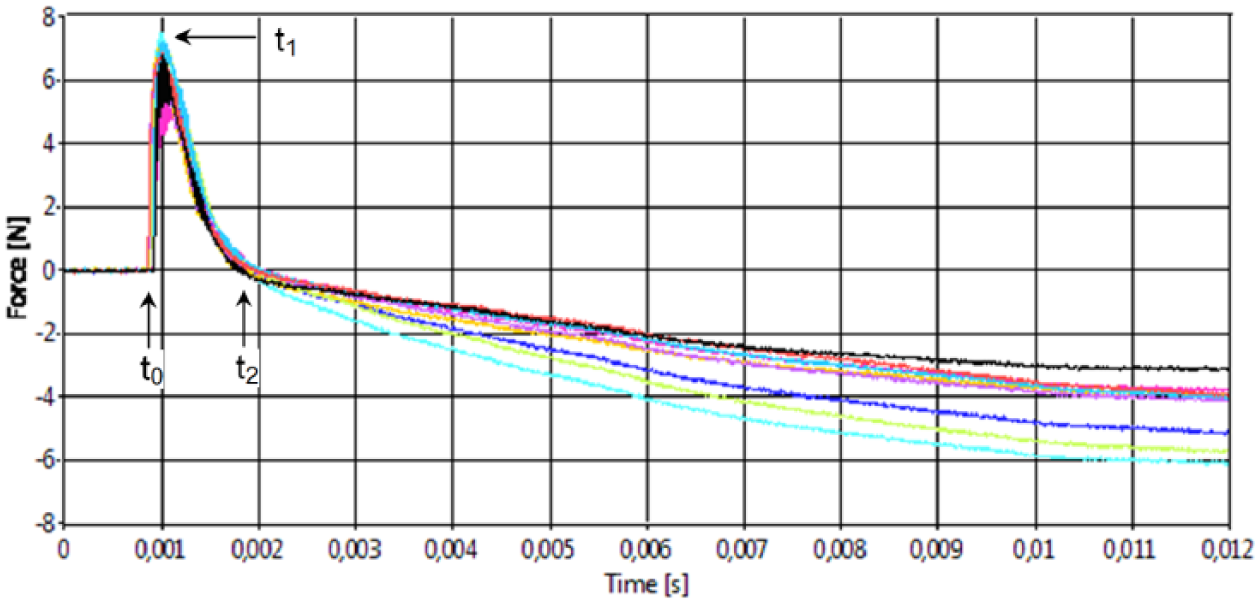
Example of a measurement series consisting of 10 waveforms of recorded forces during the impact of a 4.2-mm-diameter water drop released from a height of 1.15 m
Caution when interpreting SD of the t1 and t2 should be maintained, as these SDs are the measures of scattering (i.e. the measure of the repeatability of the phenomenon). However, this value is dependent on the sampling frequency.
The negative force values after time t2 are associated with the movement of the deformed water drop over the sensor surface. The momentum of a part of the water drop, flattened and moving outwards from the impact site, led to a decline in the pressure inside the emerging circle; this resulted in the negative value of force. After a time of ca. 50 ms (not shown in Figure 6 ), the impact force on the sensor reached zero.
The shapes of the force changes were similar for all heights from which the water drops had fallen. The value of the force differentiated between these measurements. The dependence of the maximum force on the height of the water drop falling is presented in Figure 7 .
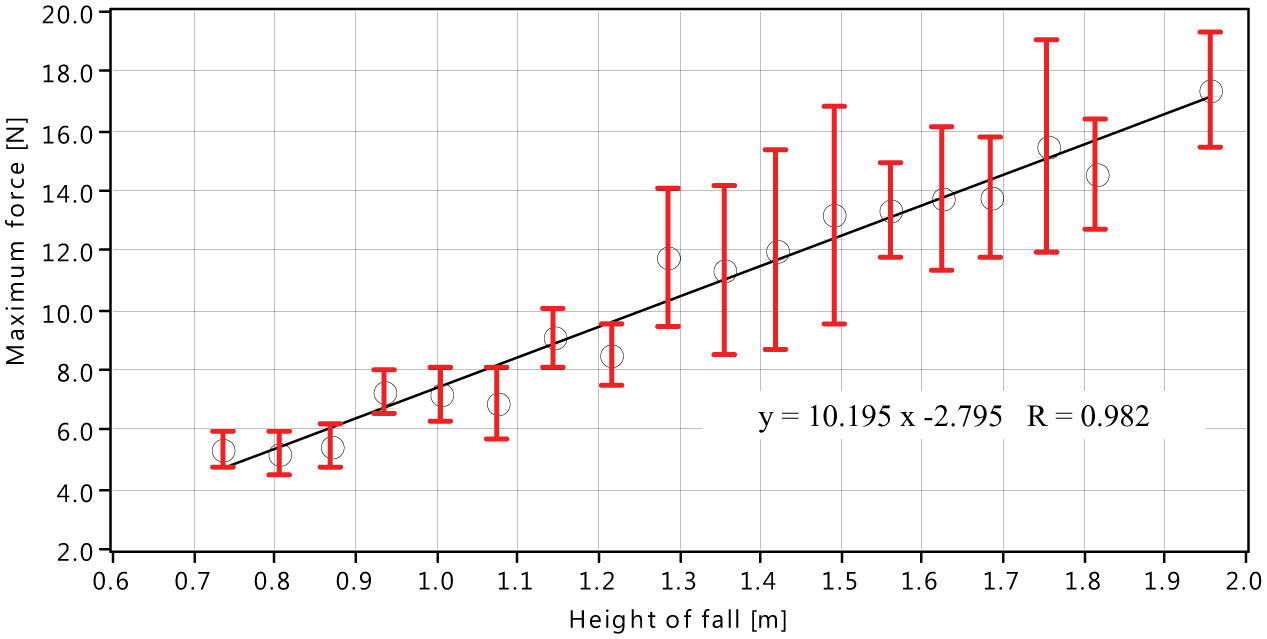
The dependence of the maximum force on the height of the water drop falling. The bars express the standard deviation (SD)
Four models of interpolation data for the maximum force were used: linear, power, exponential and logarithmic. The best of these was the linear model, which is shown in Figure 7 . Similarly, as in the case of plastic collision, the scattering of the results was bigger for the larger heights. For instance, for the third height from the bottom (0.87 m), SD was one of the smallest at 0.716. Contrarily, for the third height from the top (1.76 m), SD was one of the largest at 3.586. The causes of this scattering were similar to those discussed in the case of the plasticine balls. However, one more phenomenon may be important in this situation, which was not important when plasticine balls were falling. The problem of the lack of a repeatable central impact when water drops are used should be taken into account. The ‘Material and Method’ section mentioned that if the impact was clearly non-central, this measurement was removed. However, the scattering in the region where water drops impacted was non-zero; this may have resulted in the scattering of force values.
The dependence of the rate of the pulse rise and decrease on the height of the water drop fall is presented in Figure 8 .
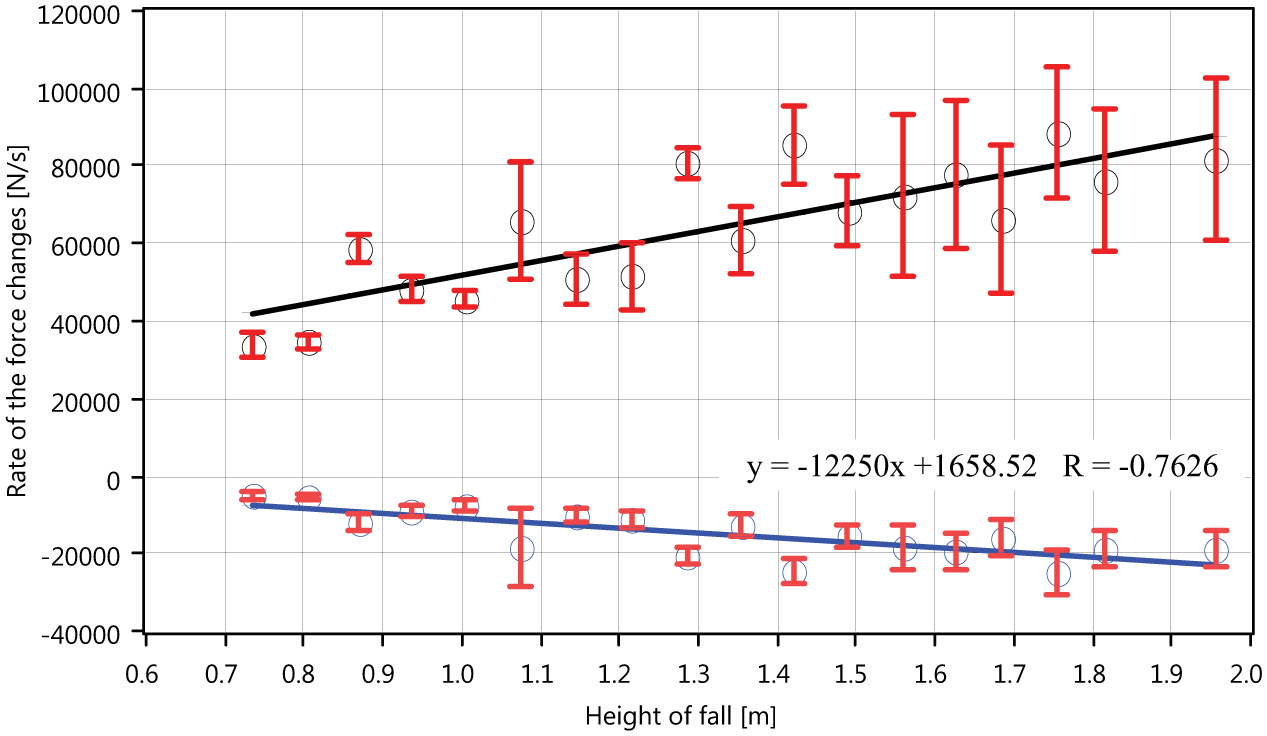
The dependence of the rate of the pulse rise (black circles and black line) and the rate of the pulse decrease (blue circles and blue line) on the height of the water drop fall
Constant trends can be observed in Figure 8 . This shows that the rate of the force and a decrease in the duration of the pulse were dependent on the energy of the drop. The same four models (linear, power, exponential and logarithmic) were tested and the linear model was found to be the best. However, the correlation was not as high in both cases shown in Figure 8 compared to Figure 7 .
In summarizing the above results, it should be stated that the measuring system based on the dynamic pressure sensor 106B50, PCB Piezotronics Inc., can be used for the measurement of the dynamic changes of the force of the water drop in the splash phenomenon. However, we are aware that this particular sensor is not the only one available in the market. There are similar solutions from companies like Kistler, Columbia Research Labs, OMEGA, Kulit and others. The most important parameters that should be taken into account are measurement range, sensitivity, maximum pressure, value resonant frequency, rise time, low-frequency response and surface area.
V. Conclusion/Outlook
The research conducted resulted in the development of an innovative system for measuring the impact of a water drop on a surface. A dynamic pressure sensor was tested for the measurement of mechanical impulse. Validation was carried out using plasticine balls (from the assumptions made due to plastic collisions) and water drops (as this measuring system is dedicated to these types of measurements). The following characteristics were investigated: the rate of the pulse rise/decrease and the maximum of the force of water drop impact. The validation fully confirmed the usefulness of the applied system.
Footnotes
Funding
The study was partially funded from the budget for science in the framework of project number IP2011 047471 (in the years 2012–2014) and by the National Centre for Science in the framework of project number N N310777640 (in the years 2011–2014) and from the National Science Centre (Poland), based on decision number DEC-2012/07/N/ST10/03280 (2013–2015).