
Abstract

I. Scope
This paper describes the definitions, the interpretation and the impact of the process instrument characteristic of ‘Lower Limit of Detection’ (LLoD).
It gives the reader
An overview of the said characteristic in process instrument measurement,
Guidance on how this affects instrument performance.
II. Definitions of Parameters Used in Process Instrument Settings
A. LLoD
This is not a type of measurement error as such, but it does lead to confusion about what is practical as regards the usable measurement range for a process instrument ( Figure 1 ). It is often missed (or ignored) when specifying instruments. LLoD is present in every instrument we use, yet hardly ever included in quoted accuracy figures.
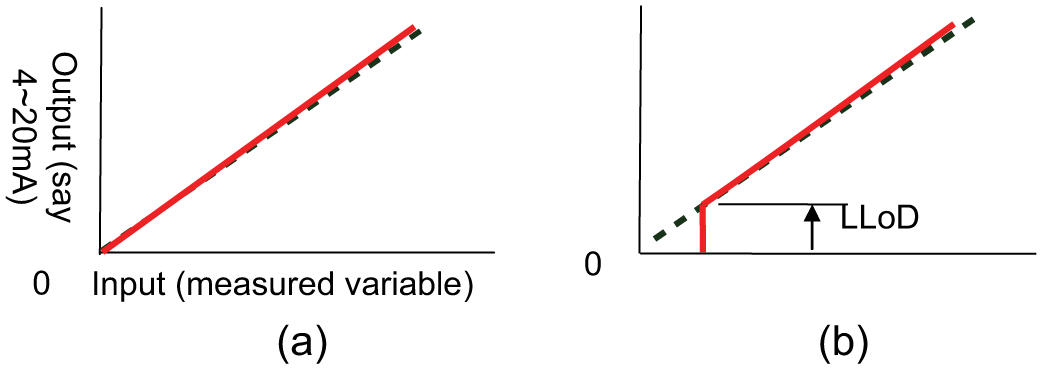
Lower limit of detection: (a) apparent performance and (b) actual performance
LLoD affects all process instruments. It may cause confusion and lead to an ‘unrealistic expectation’ placed on a measurement. LLoD is also known as ‘lift off’, ‘break-out’ or ‘starting point error’ and sometimes wrongly confused with the instrument turndown limit.
LLoD is the smallest value of input the instrument can measure within the manufacturers’ stated accuracy. An example of this phenomenon is the operation of a motor car speedometer. It will still read zero while the vehicle is moving very slowly. This is because the LLoD of the speedometer is typically 10 km/h.
The LLoD may be caused by one or more of the following:
Friction or break-out torque on moving parts. For example, in pressure transmitters and gauges, a diaphragm or Bourdon tube has certain stiffness. This stiffness has to be initially overcome before any reading can be made.
The non-linear nature of some measurements, for example, differential pressure (dP) flow. Transmitters have to take the square-root of the dP in order to give a linear 4–20 mA output. If the dP is very small, the transmitter is effectively trying to take the square-root of a measurement tending to zero, which would cause a firmware error in the signal processor. To overcome this, manufacturers programme in a cut-off whereby the transmitter will not attempt to take the square-root below say 5% of the Upper Range Value (URV). Hence, the LLoD is 5% of full-scale reading.
III. Confusion in Design
Using an imaginary plant as an example. A chemical plant has 20 reaction vessels, which collectively produce an unwanted off-gas, hydrogen. The gas is vented through a fan-driven ventilation system. Each vessel extract duct handles 350 N m3/h of air. The ventilation system is fitted with an extract flow meter comprising of a Pitot tube and a dP transmitter. A gas analyser is used to warn of the presence of explosive quantities of hydrogen.
Typically, the process design information may specify the following:
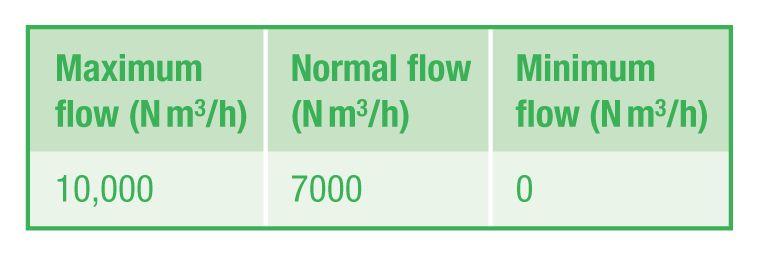
The upper range of the measurand may well allow for future expansion or just provide for a normal reading at a sensible point on a display scale. Minimum flow is usually (and not illogically) assumed to be zero on the same scale.
In specifying the flow transmitter, the designer again not unreasonably will state the measuring range to be 0–10,000 corresponding to whatever the calculated dP measurement is at Maximum flow – say 0–2000 millimetre Water Gauge (mmWG). The calibration sheet obtained with the instrument will demonstrate a linear output at 0%, 20%, 40%, 60%, 80% and 100% proportional to the dP input. This implies the instrument can actually measure zero; however, at zero, there is nothing to measure. The calibration certificate is thus in line with the manufacturer’s specification, which implies an accuracy related to the measurement at any value, without reference to zero.
IV. Manifestation of Typical LLoD Problems
In our example, the instrument chosen is a Pitot tube and dP transmitter (complete with the 5% LLoD cut-off). This is procured and fitted to the plant. Problems start during commissioning and continue throughout the life of the plant as follows:
The first phase of plant operations is using just one reaction vessel, so the gas flow rate is just 350 N m3/h. At 3.5% of span, this is below the 5% cut-off of the dP transmitter and the total flow reading on the control room display is consequently zero.
The problem then seems to ‘vanish’ during the commissioning of the second reaction vessel when the gas flow is now 700 N m3/h. This leads to a belief the problem no longer exists.
The plant is later mothballed and the maintenance ventilation flow is set to 250 N m3/h (i.e. 2.5% of the transmitter span). So, again the control room display reads zero.
The hydrogen gas detector, calibrated at 0–50,000 ppm H2 in air, was installed to detect process excursions and set to alarm at the lower explosive level (LEL) of hydrogen in the ventilation duct (i.e. at around 40,000 ppm H2 in air). During the plant lifetime, operators decide they would also like to trend record the hydrogen concentration in the duct and attempt to data-log readings in excess of 25 ppm (i.e. 1/500th of the URV). The LLoD of such detectors is typically 100 ppm, so any trends are in fact meaningless and may have more to do with ambient temperature drift than H2 concentration. Time, effort and funds are used in investigating a ‘safety-related’ problem.
V. Conclusion
There is no such thing as a measurement of zero – there is nothing to be measured. In certain circumstances, the inherent LLoD of measuring instruments may lead to problems at low measurement conditions.
Footnotes
Funding
This paper received no specific grant from any funding agency in the public, commercial or not-for-profit sectors.