
Abstract
Measuring the micro-nano-force is a hotspot in science and engineering. This paper focuses on a novel theory and method using the vibration amplitude of spherical film to measure the micro-force. The latex spherical film, with the diameter from 48 to 62 mm, is considered as sensing element, and the force or the mass is applied on the top of spherical film which results in the laser beam on the side surface of spherical film forming a bias. The bias measured by position sensitive detector sensor reflects the quantity of the micro-force or the mass. Experiments are designed to analyze the relation among the applied force, the diameter and thickness of spherical film, and vibration amplitude. Additionally, the fitting formula of these four parameters is obtained using the least square algorithm. On the full scale of 1.85–10.84 mN, this system can be used to measure the micro-force in the error range of −2.5% to 2.3%.
I. Introduction
Micro-force is a key parameter in many research fields such as micro-scale assembly systems, micro-gripper of robots, biology, and micro-electromechanical system (MEMS) system. Its range and magnitude vary greatly as a function of the intended application. 1 In the past few years, various types of high-precision micro-force sensors have been developed by using piezoelectric transducer (PZT), MEMS techniques, and thin-film measurement techniques.
Small piezoresistive force sensors of 200,200,640 µm3 have been developed to obtain haptic feedback of the forces acting on a guide wire’s tip during vascular catheterization, the measured force was at the level of micro-Newton. 2 A three-axis micro-force sensor 3 with adjustable force range from ±20 to ±200 µN was designed, and it was a novel micro-fabrication process based on a double silicon-on-insulator (SOI) substrates. A piezoresistive force sensor with slotted-quad-beam structure was proposed. 4 The sensor can measure the micro-force at the range of 10 mN with a sensitivity above 0.5 mV/(V mN), and it was provided to measure the friction in MEMS bearings. A tactile sensing 5 provided critical information, such as force, texture, shape, or temperature, in manipulation tasks. For this force sensor, the resolution was 0.12 N for the component force Fx and Fy and 0.01 N for the tangential force Ft. The sensor has been subjected to loads below 7 N for Fx and Fy and 1 N for Ft.
Some scholars investigated the mechanical properties of thin film and measured the micro-force by using it. Gramlich and Homsy 6 determined stability and perturbation growth rates for a spherical film expanding with time, focusing on the effects of the expansion on stability. According to the strain energy density function for finite deformation of viscoelastic material, the relaxation function of the Maxwell mode, and the deformation gradient tensor of the bubble, a stress equation for finite deformation of a protein bubble was derived. 7 By using the above stress equation and the dynamics equation of the bubble, an equation describing the relation between the relative deformation rate of the inner radius (about 1 mm) and time was developed for finite deformations. Lu et al. 8 developed a micro-force sensor using double–concentric circle fibers to measure the micro-force. A deformation resulted from an applied force on the film causes the change of the voltage ratio of the two receiving fibers. According to the fitting equation, a micro-force in the range of 0–10 mN can be measured in the error range of −1.5% to 2.5%. Furthermore, Johnson et al. 9 developed hot-film sensors for the detection and monitoring of laminar/turbulent flow on a wing. The sensors were constructed using silicon-manufacturing techniques, with the ultimate aim of making them capable of being certified for flight.
Some scholars have investigated the stability and stress characteristics of spherical film. The spherical film has the following advantages: 10 the manufacturing process of spherical film is relatively simple; the product scale of spherical film goes beyond that of MEMS film; and as sensing element, spherical film has the ability of anti-electromagnetic interference. The sensing element is the key component in a measurement system as discussed in the study by Jones. 11 In this paper, the micro-strain feature of latex spherical film (LSF) with the diameter about 55 mm is utilized to measure the micro-force at milli-Newton level. The relations among the LSF vibration amplitude, the diameter and the thickness of the LSF, and the applied micro-force on LSF are explored to realize the micro-force measurement.
II. Measuring Principle of Micro-Force
The LSFs are used as sensing elements, the micro-force or particles with the same level mass are applied on the top of the LSF. A laser beam from the laser device launch on the side surface of LSF and is reflected to the position sensitive detector (PSD) sensor as shown in Figure 1 . A micro-Newton-level force or a particle with the same level mass applied on the top of the LSF will cause a distortion. It can be considered as the vibration amplitude of the LSF after the micro-force or the particle was loaded on the LSF. Simultaneously, the distortion will change the reflected light beam from line AB to line A′B′ as shown in Figure 1 . The line BB′ can be measured as a displacement of the reflected light by the PSD sensor. Actually, the displacement on the PSD sensor reflects the vibration amplitude of the LSF, accordingly, to measure the micro-force applied on the top of LSF. This is the measurement principle of the micro-force sensor based on the LSF and the laser beam.
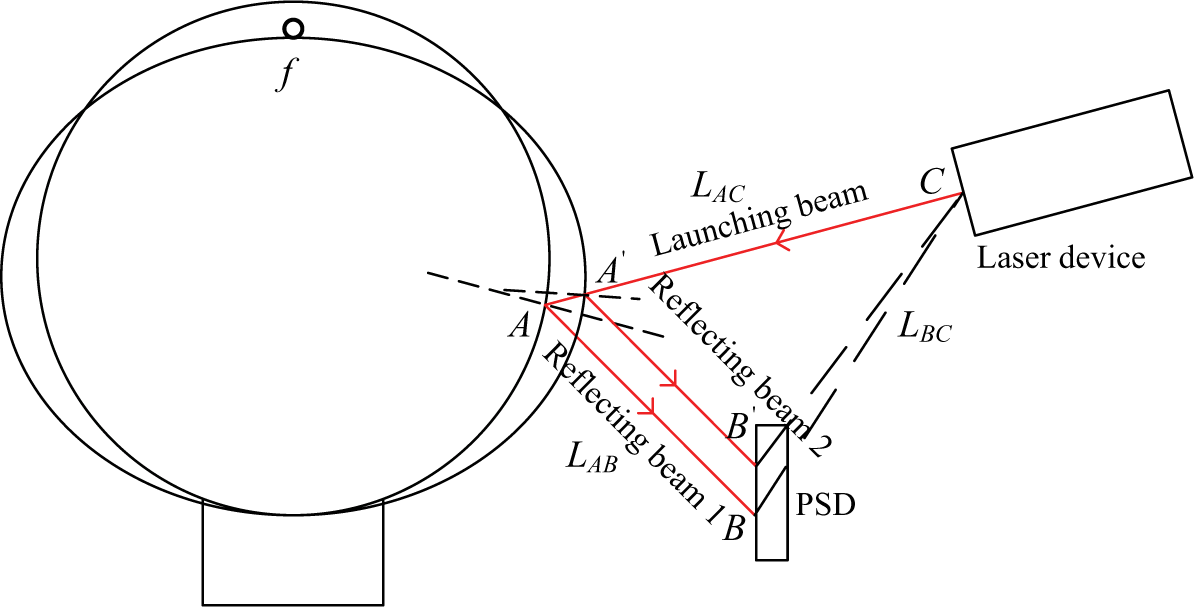
Principle of the LSF micro-force sensor
When the particle or the applied force is loaded on the LSF, the LSF vibration will stop in about 3 s. Then, we obtain the displacement on the PSD sensor and calculate the micro-force. Therefore, this is a static measurement system; the frequency and the process of damped vibration of the LSF need not be considered more for the measurement system.
III. Preparation of the LSF and the Particles
For producing the LSF, we choose the spherical film with high elasticity and good reflection effect on the surface because these two performances are the basic conditions for measuring the micro-force and the vibration amplitude. The chosen latex has the following composition: 30%–40% solid content, 27%–41.3% rubber, 2%–5% water, 2%–5% natural resin, 0.2%–4.5% protein, and the average diameter of the rubber particle is 1.06 µm.
With the diameter varying from 48 to 63 mm, five different types of LSFs are produced. The profiles of the LSFs are not ideal spherical. Thus, an equivalent diameter is used to decide the diameter of the LSF. For each LSF, three different measuring values of the diameter are averaged to obtain the equivalent value which is considered as the experimental parameter. The different equivalent diameter of the LSFs from No. 1 to No. 5 is 62.59, 57.53, 53.95, 50.50, and 48.61 mm, respectively.
The metal Sn (stannum) wire with the diameter of 1 mm is chosen to produce the particles at the micro-Newton force level. The Sn wire is cut into different lengths to form a series of standard weights which are measured on an electronic balance at the precision of 0.1 mg. According to the numerical calculation and experiment requirement, the standard weights vary in the range of 0.6–182.4 mg, and 22 types of the micro-particles are produced as shown in Table 2 .
IV. Calibration of the PSD Transducer
A calibration processing should be made to obtain the linear range of the two-dimensional (2D) PSD sensor before using it. The calibrating equipment is constructed by a laser device, a 2D PSD sensor, PSD manipulating circuits, PSD supporter, a three-dimensional (3D) motion platform, a voltmeter, and some wires.
The laser device is fixed on the 3D motion platform, and the PSD is fixed on the PSD supporter. Then, the laser device is modified to collimate the laser beam on the center of PSD. The distance between the laser device and the PSD is 51.5 mm after modification, and the motion step of the 3D platform is 1 mm. Thus, each voltage output of the PSD sensor is obtained in 1-mm interval. The PSD dimension is 21 mm × 21 mm and the range of linearity is 75%–80% of the full scale. Thus, the range of ±16 mm in either X or Y direction is used as experimental region. The laser beam is moved from −8 to 8 mm on X axis, and the voltage values of the PSD are recorded from −4.66 to +5.16 V. The same steps are applied on Y axis. The fitting formulas of X and Y axes are figured out as follows
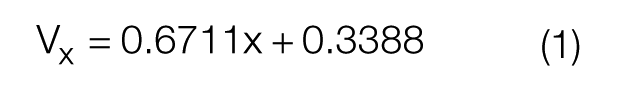
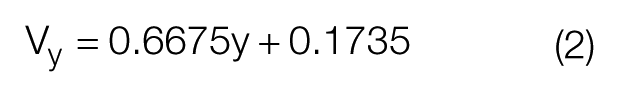
The slope of equation (1) is equal to 0.6711 V/mm which denotes the resolution of the PSD in X axis. The slope of equation (2) is equal to 0.6675 V/mm which denotes the resolution of the PSD in Y axis. The intercept 0.3388 and 0.1735 in equations (1) and (2) shows the bias of the fitting value and the measuring value on the zero position, respectively. In the coming experiments, substituting the voltage values into equations (1) and (2), we can measure the X and Y displacements of laser beam on the PSD.
V. Force Loading Experiments
Different LSFs with different sizes can be used as sensitive elements to measure the different particle. The voltage value of the PSD sensor is recorded to reflect the loading mass of the particle. In our experiments, the Y direction of the PSD sensor is considered as the active direction because the amplitude of LSF generates the PSD displacement in Y direction. The measurement platform is shown in Figure 2 .
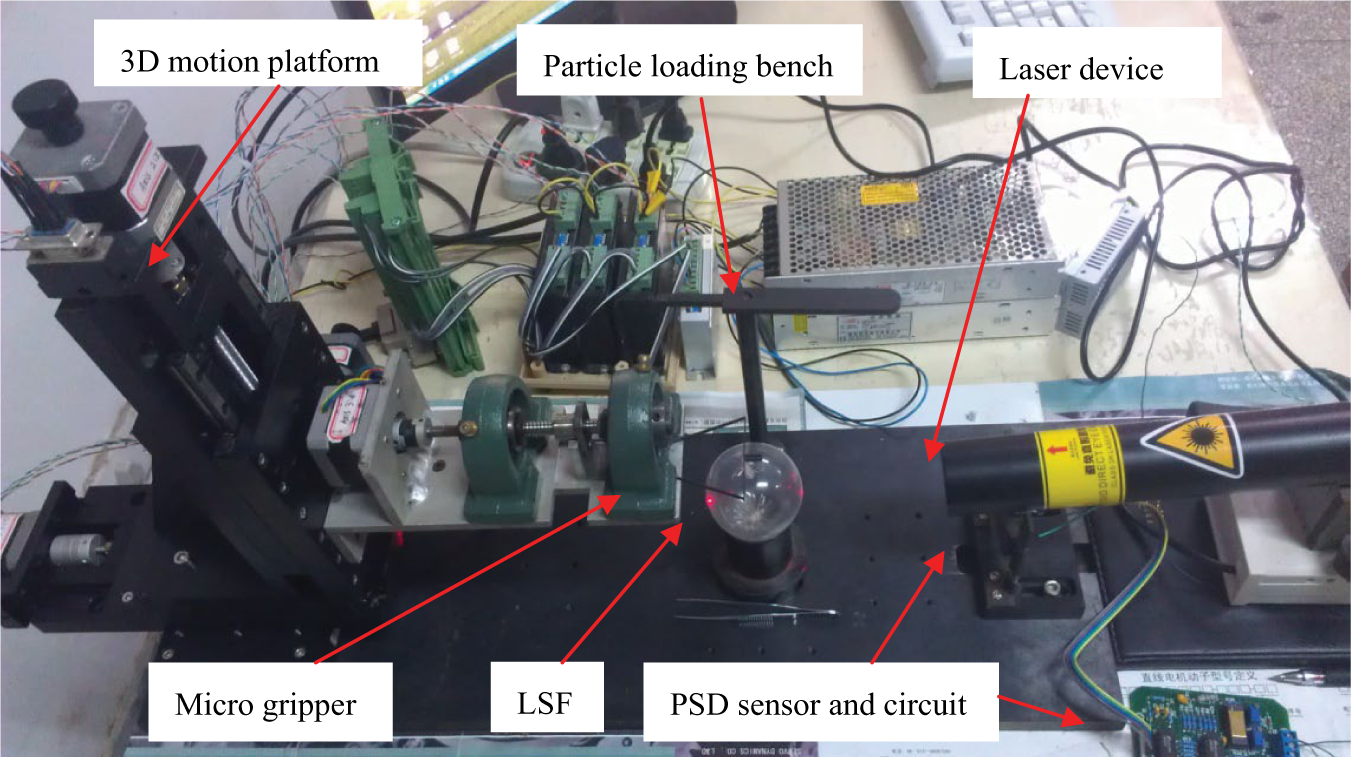
Micro-force measurement platform
The ambient temperature is about 20 ± 5 °C, and the relative humidity is about 70%. In the loading experiments, a LSF is fixed on the supporter; the position of the laser device is modified to make the reflected laser beam locate on the center point of Y axis of the PSD sensor; the particle on the loading bench is taken by micro-gripper which is driven by 3D motion platform and is released on top of the LSF; the amplitude of LSF resulted from loading particle generates a light displacement in Y direction of PSD sensor; and the voltage output of the PSD sensor is acquired by industrial computer, which reflects the quantity of the loading particle.
Obviously, the micro-force or the mass should have relationship with the LSF diameter, the thickness, and the vibration amplitude. So we change the different LSF to repeat the loading experiments. For different LSFs, the position of the laser device should be modified slightly to keep the laser beam reflecting on the center point of the PSD sensor. According to the diameter and the thickness of the LSF, we code the number as shown in Table 1 . Furthermore, the launching beam length LAC, the reflecting beam length LAB, and the distance LBC between the laser device and the PSD sensor defined in Figure 1 are also measured in Table 1 .
The parameter values of different LSF
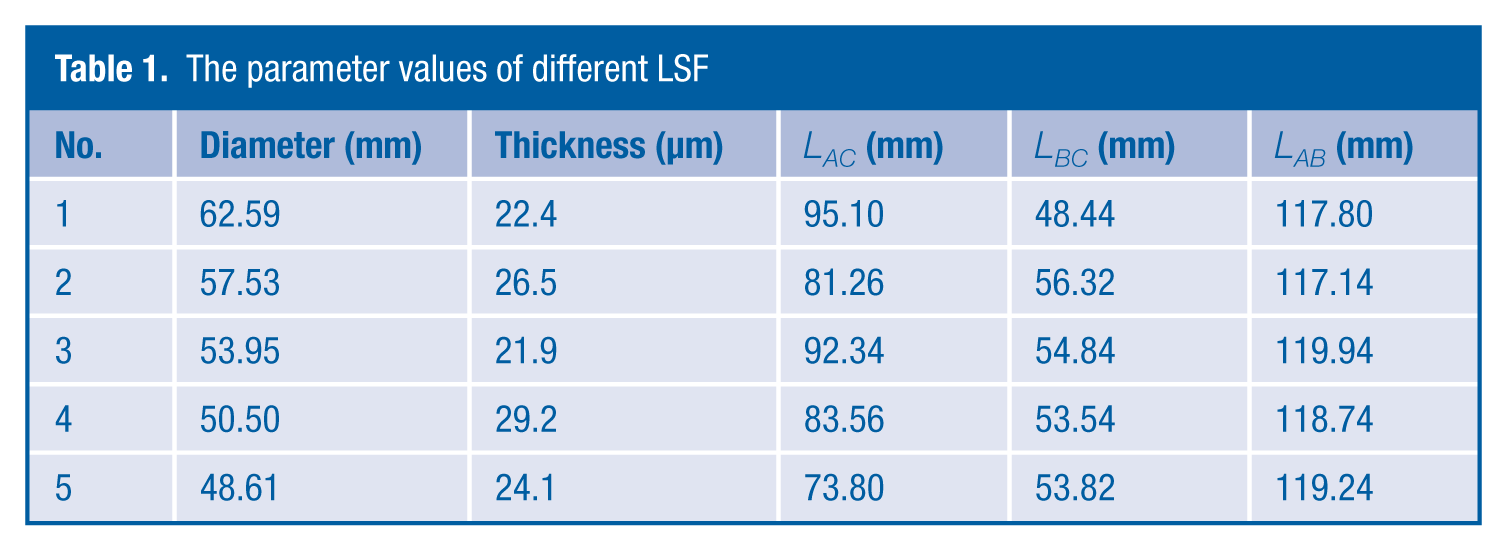
In Table 1 , the reflecting beam length LAB varies in a small range, which means the reflecting beam keeps a good consistence when the LSF is changed.
A series of particles are loaded on the LSF, and the vibration amplitude of the LSF generates the voltage variation on the PSD sensor. The different voltages before and after loading particle are recorded in Table 2 when the LSF is No. 1. Table 2 shows the gravity of particle, the voltage before and after loading, the voltage variation, and the displacement of laser beam on PSD sensor. The different LSFs are changed, and the same loading process is executed according to orthogonal experiment design methods.12,13 The experimental data of five types LSFs are obtained. The other similar data are not listed in this paper.
Experiment data using No. 1 LSF
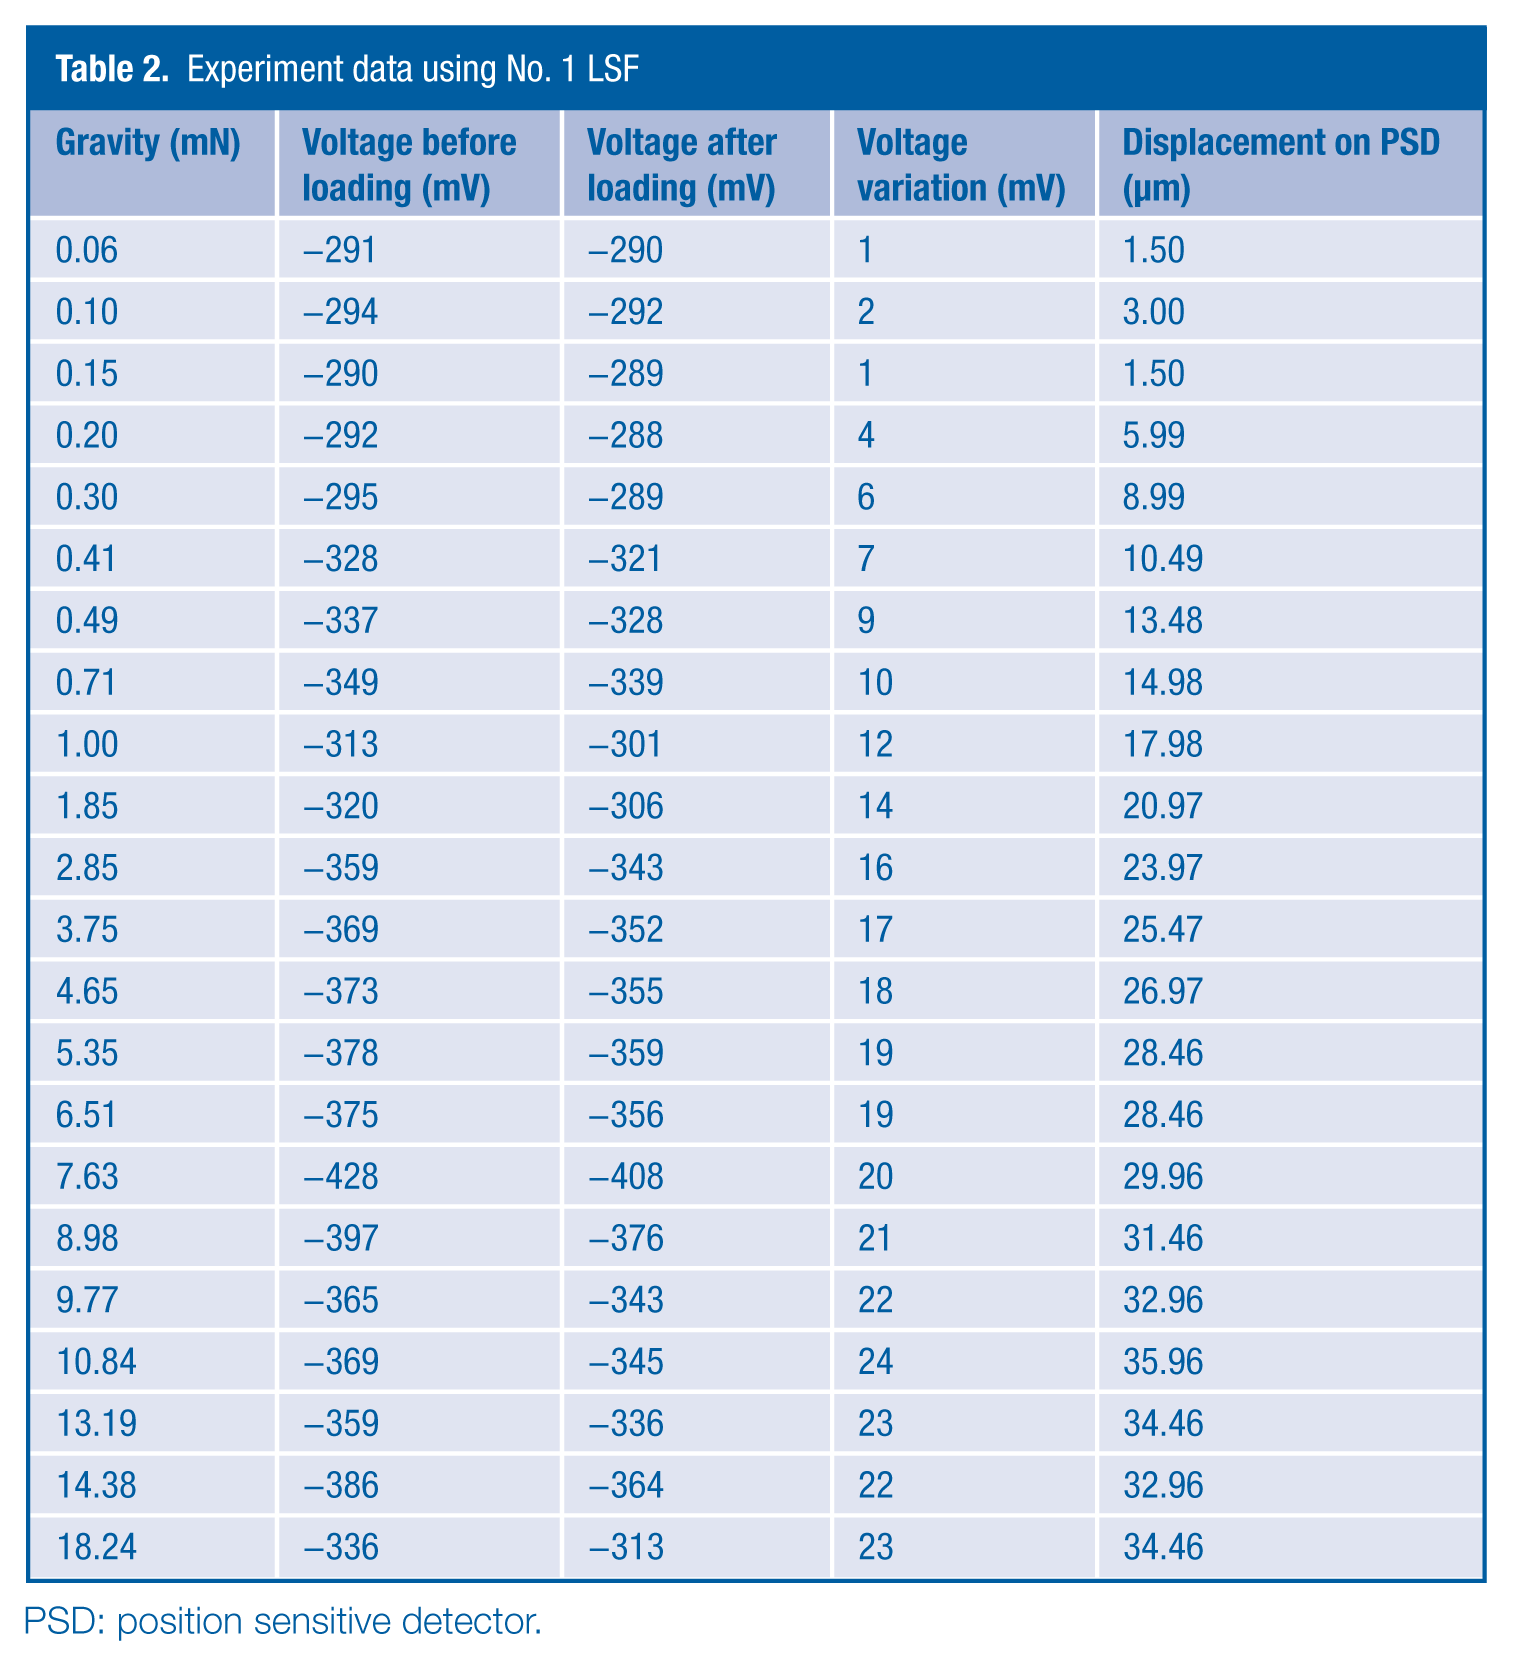
PSD: position sensitive detector.
VI. Formula Fitting and Discussion
According to Table 2 , we plot the curve showing the relation of vibration amplitude and micro-force. In Figure 3 , the vibration amplitude increases very fast as the micro-force increases in the range of 0–1.85 mN. When the micro-force varies from 1.85 to 10.84 mN, an approximately linear relation between the vibration amplitude and the micro-force is obtained. Furthermore, as the micro-force is large than 10.84 mN, the vibration amplitude does not increase, but decreases slowly as shown in Figure 3 . It denotes the LSF, as the sensitive element, has arrived at the upper limit 10.84 mN of the full scale.
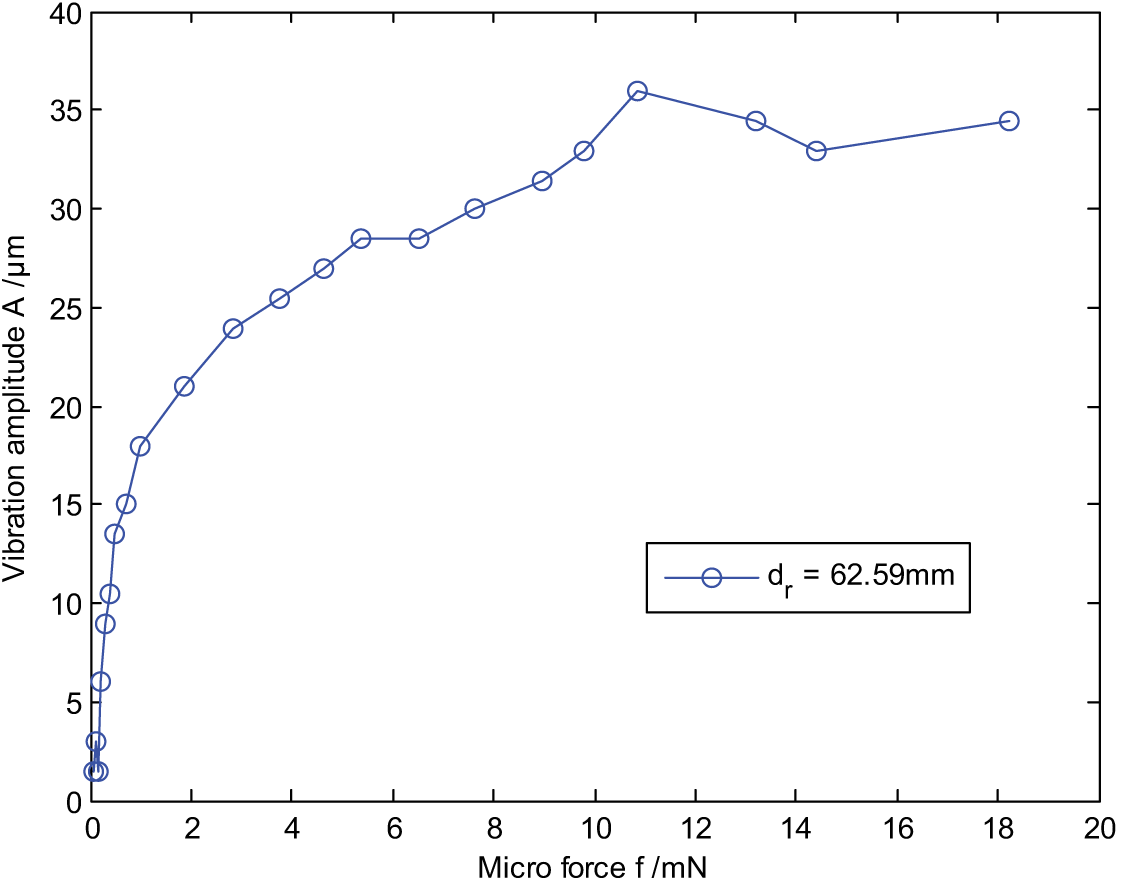
Micro-force loading curve of No. 1 LSF (d = 62.59 mm)
For investigating the relationship between the micro-force and the vibration amplitude more clearly, all experimental data of the five types LSFs are presented in Figure 4 .
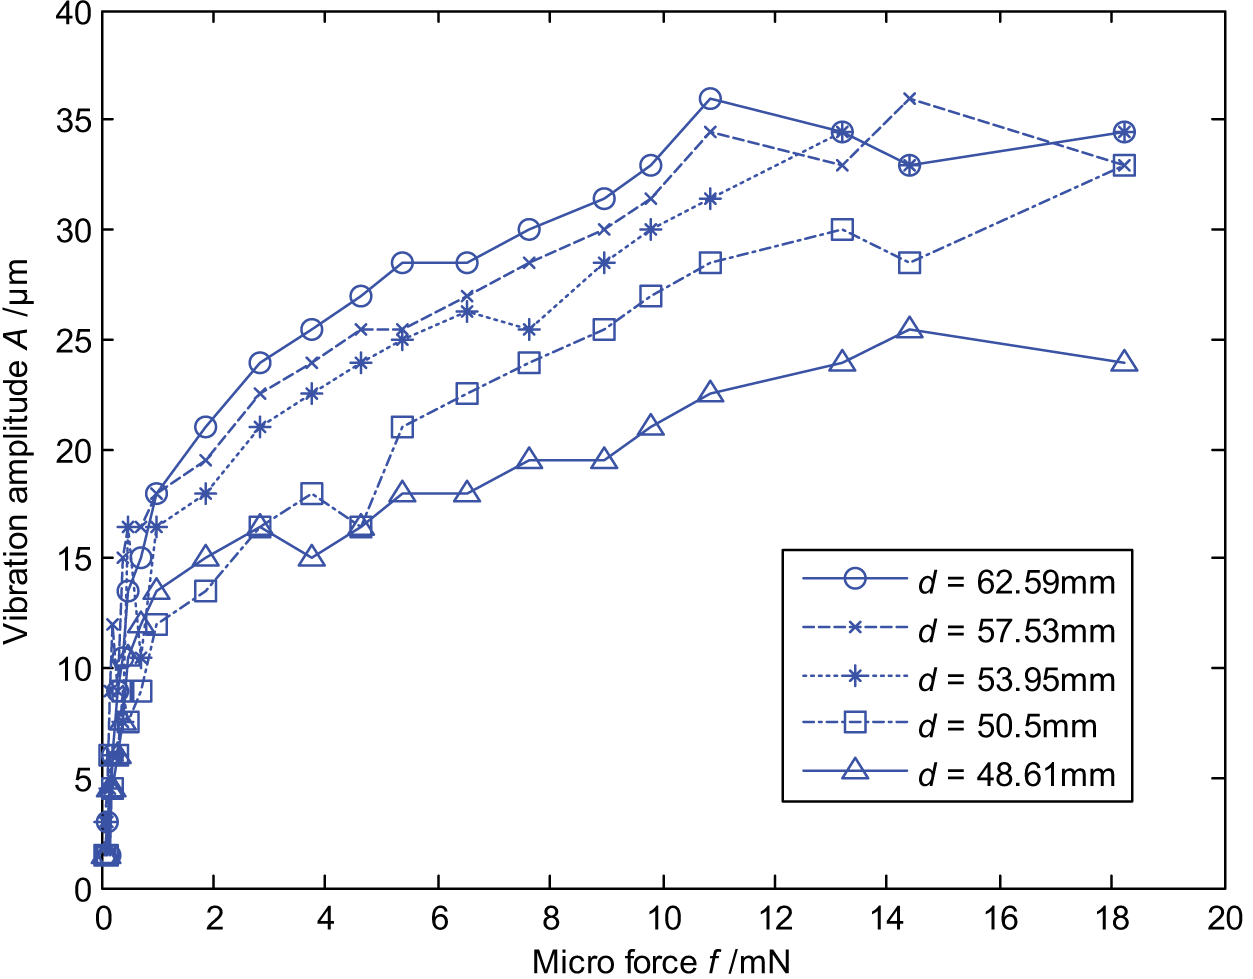
Micro-force loading curve of five different LSFs
Except for several points, the vibration amplitude really has an approximately linear relation with the micro-force in the range of 1.85–10.84 mN. The five curves distribute very close to each other in Figure 4 . The gradient between the adjacent curves decreases as the diameter of LSF increases. Thus, the impact weight of the diameter to the vibration amplitude declines as the diameter of LSF increases.
In the curve family, if the micro-force is fixed, the vibration amplitude increases as the diameter of LSF increases. Additionally, the vibration amplitude decreases as the thickness of LSF increases.
According to Figures 3 and 5 , the best measurement range of the LSFs is from 1.85 to 10.84 mN. In this paper, we just consider this range of the micro-force as the measurement scale and obtain the relation equation by fitting the experimental datum. The least square method based on singular value decomposition14,15 is used to fit the equation relating the vibration amplitude, micro-force, the LSF diameter, and the LSF thickness. The equation is expressed as
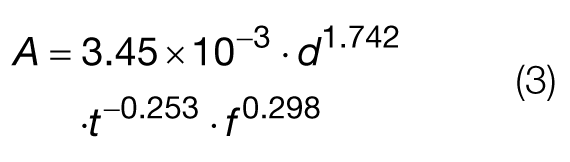
where A is the vibration amplitude (µm), f is the micro-force (µN), d is the LSF diameter (mm), and t is the LSF thickness (µm).
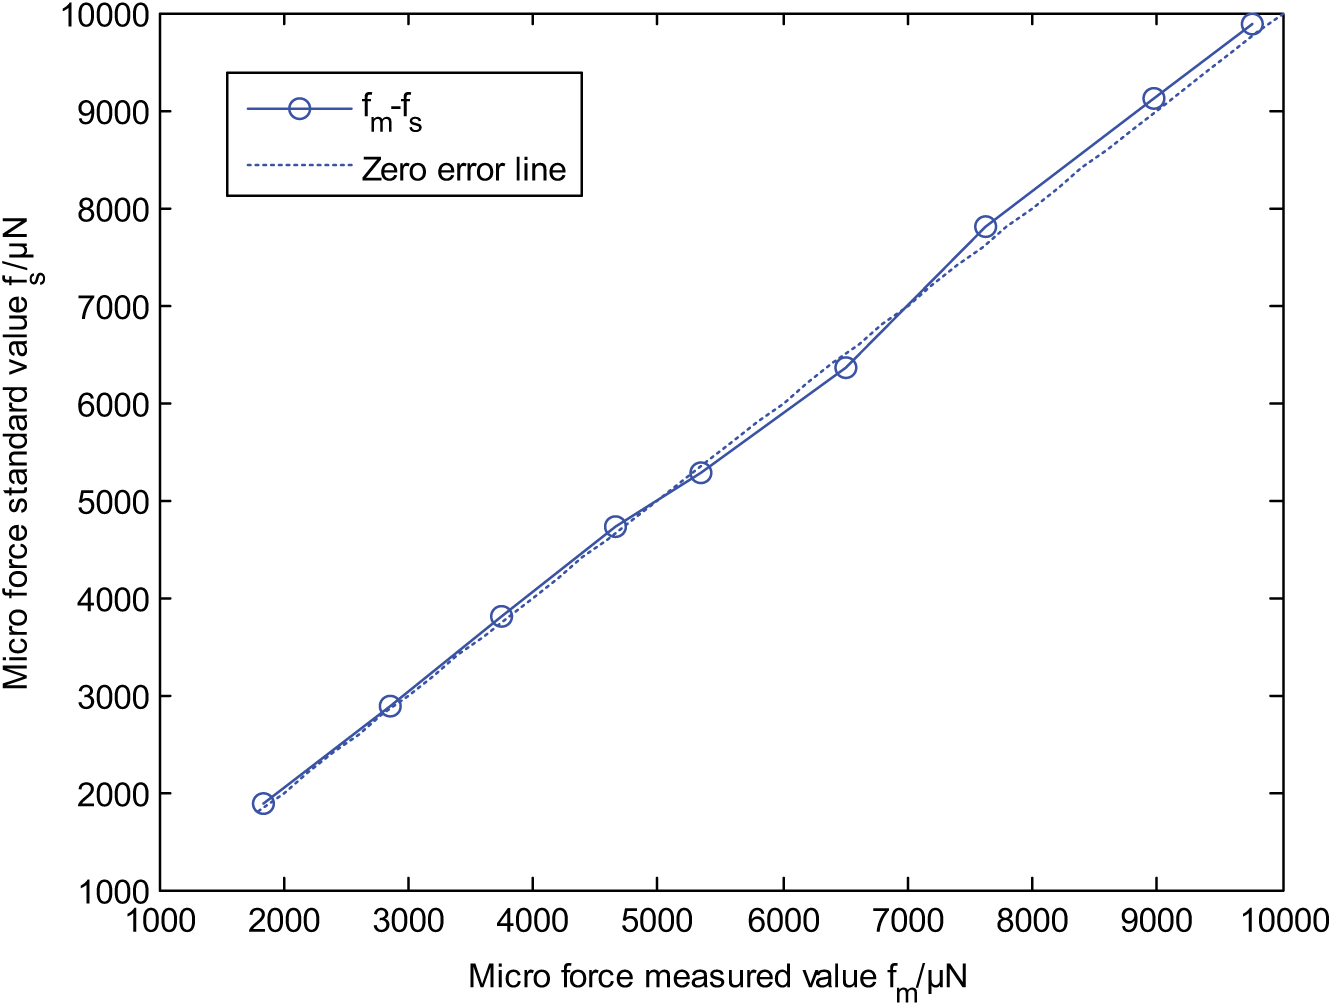
The error curves of LSF measurement system
Analyzing equation (3) shows that the vibration amplitude A has a positive and exponential relation with the micro-force f and the LSF diameter d has a negative and exponential relation with the thickness t. Among these three parameters, the diameter d is the biggest influence factor for the vibration amplitude, and the LSF thickness is the smallest weight factor.
VII. Error Analysis
The force scale of the LSF measurement system is located in the range of micro-Newton–milli-Newton, generally, varying from several hundreds of micro-Newton to several milli-Newton. We calibrate the measurement system using a higher level precision system that the force increment is 10 µN. The calibration values and the errors when the LSF diameter is 53.95 mm and the LSD thickness is 21.9 µm are shown in Table 3 . The standard force is loaded on the measurement system, and the measured value is figured out automatically according to equation (3). The errors reflect the difference between the standard value and the measured value in the form of percentage.
The calibration results and the errors
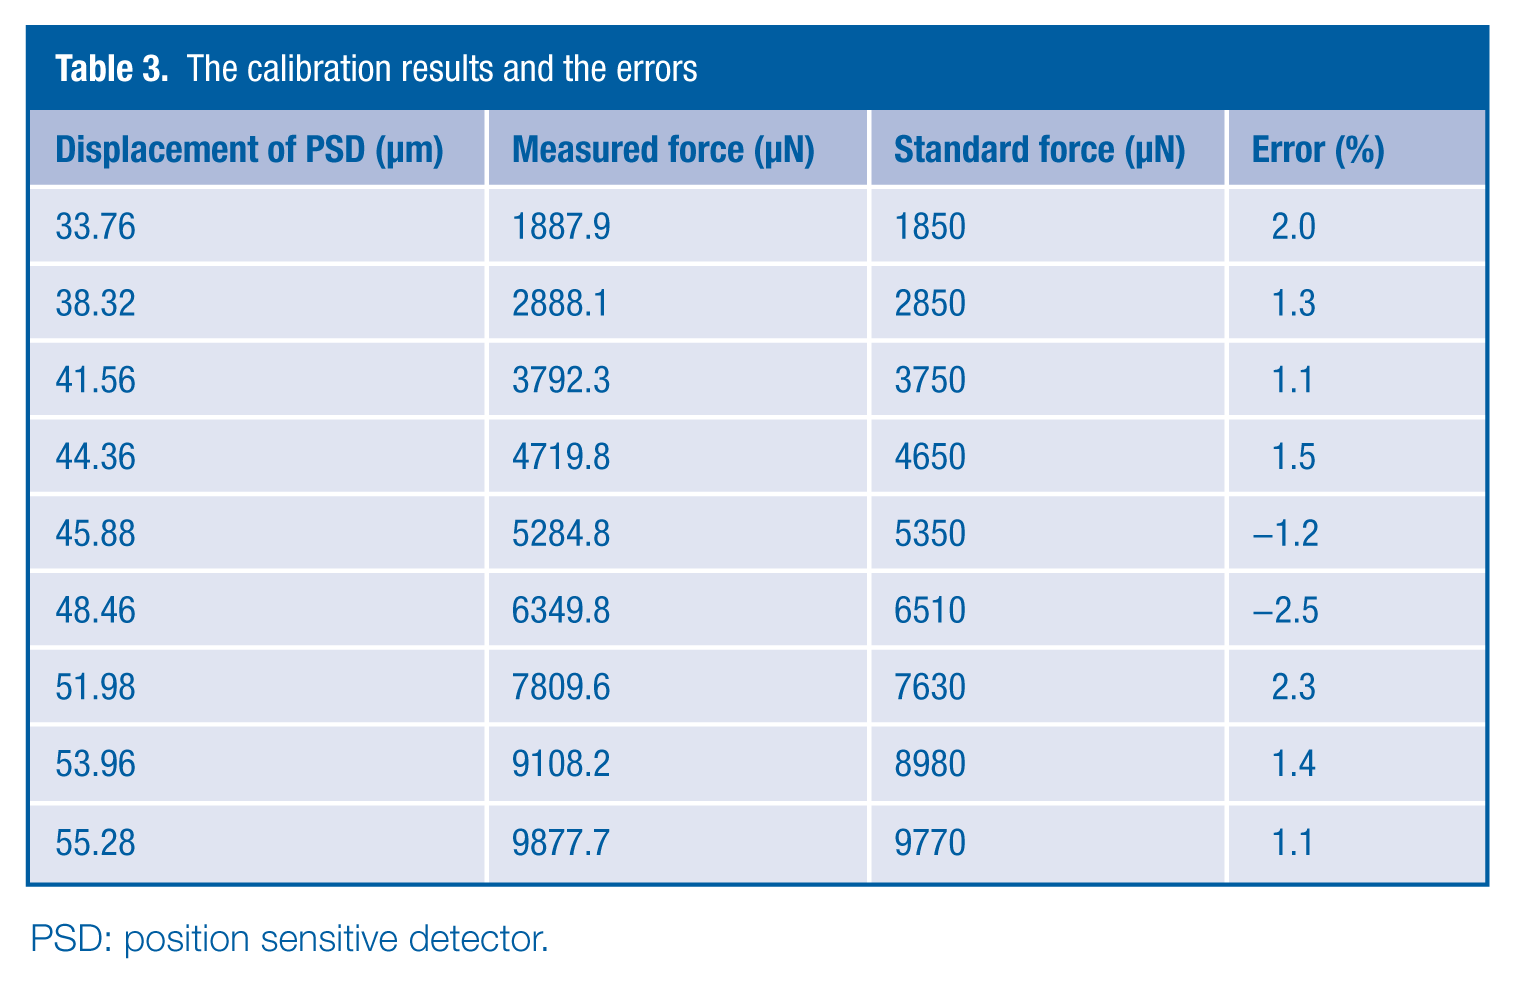
PSD: position sensitive detector.
Analyzing the standard force and the measured force, the forces measured by the LSF measurement system keep a good consistence with the standard values. The largest error is −2.5%, the smallest error is 1.1%, and the error range varies from −2.5% to 2.3%. The error curves are shown in Figure 5 , and these two adjacent curves verify the accuracy of the LSF measurement system.
VIII. Conclusion
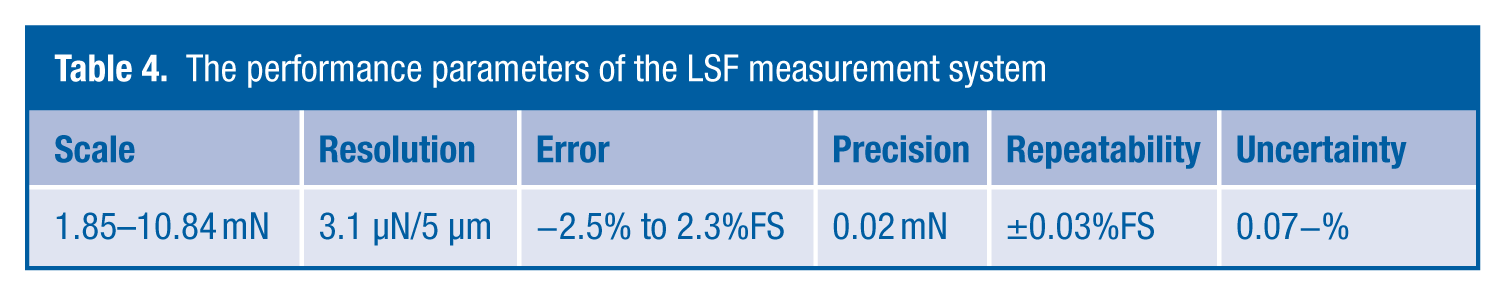
In this paper, the LSFs with different dimensions are used to construct micro-force measuring system, and the laser and the PSD sensors are utilized to reflect the vibration amplitude. After experimental research and calibration, the relation among the applied force, the diameter and thickness of spherical film, and the amplitude is obtained. The performance parameters of the measurement system under 20±5 °C ambient temperature and 70% relative humidity are listed in Table 4 .
The performance parameters of the LSF measurement system
Footnotes
Funding
This work was funded by Early Career Science and Technology Innovation Fund of Nanjing University of Aeronautics and Astronautics (NUAA), the Fund number is 56XAA13043.