
Abstract
This preliminary study aims to record the brainwaves of two experienced archers, while undertaking the process of aiming and shooting arrows at a target. The brainwaves are then analysed for repeatability and dominant characteristics within individual electroencephalograph activity. Images of the archers are also recorded to establish reference points within the shot cycle for correlating the electroencephalograph data sets.
I. Introduction
Archery is a sport, which has increased in popularity since the London 2012 Olympic Games. It is now an Olympic core event and has recently seen its Olympic funding increase from group D for London 2012 to group C for Rio 2016. This highlights the sport’s popularity.
Archery involves the coordination of the muscular and skeletal system to provide a repeatable pattern while under loading during the drawing, aiming and release of the arrow. The hold and aim phase of the shot are of particular importance. At this time, the archer must resist the weight of the bow (both the physical weight of the bow in the hand and the draw weight) while aiming at the target and expanding until the release of the string. Within this critical point of the cycle, the archer is processing visual information with regards to the position of the sight on the target as well as maintaining motion prior to release.
The aiming process and the visual relationship are also noted within basketball; when an experienced player throws a ball to the hoop, the player first fixates on the target but then as the aiming action is performed the vision is suppressed. 1
The brain is very much like a computer system, using brain cells to transmit messages to one another in order for us to function; these signals are well known as brainwaves. The billions of brainwaves we send produce an enormous amount of electrical activity in the brain, and this activity can be detected using sensitive medical equipment such as an electroencephalograph (EEG), to measure the different electricity levels over areas of the scalp. Each brainwave has its own characteristic, and they can be characterised into five groups known as delta, theta, alpha, beta and gamma frequency bands.2–4
Brainwaves are generally categorised according to frequency from the lowest (0.1Hz) to the highest (100Hz) as follows: delta, theta, alpha, beta and gamma. 5
The examination of the cognitive process during rifle and pistol shooting as well as archery has used EEG to measure the brain activity during the process of target shooting.6,7 This has given rise to consistent findings that the brain activity differs between professionals and novices with experts having a greater EEG alpha power during the final few seconds prior to the shot release.
EEG alpha reflects the visual attention where an increase in the alpha power gives a reduction in the visual attention. 8 With pistol shooters, the increase in the alpha power is due to the subjects maintaining an optimal sight picture during the aiming and the trigger pull, and the alpha power providing an index of the amount of aim related information processed within the execution of the shot. 6 Alpha wave involvement is noted to decrease when anticipatory attention tasks are performed, such as recognising a visual target. 9 In addition to the decrease in alpha during attention phases, the beta waves increase during active concentration. 10
This preliminary study aims to record the brainwaves of two experienced archers (all with 10+ years of experience) while shooting arrows and analyse them for repeatability patterns and dominant individual EEG activity characteristics during the process of the shot. Images of the archer are also captured throughout the process for correlating the EEG data across reference points of the shot cycle.
II. Method
Two subjects were used for the study both with 10+ years of archery experience and both having attained scores above the ‘Master Bowmen’ standard as prescribed by Archery GB. A series of 12 shots were recorded with the target placed at a distance of 90 m for the test. Prior to the test, the subjects were allowed to practice at the target wearing the EEG device to become accustomed with the device while shooting. Placement of the device while the archer is shooting is shown in Figure 1 . Both subjects reported that the device was very light and non-intrusive, and after a few minutes familiarisation, they were not aware of any influence that the device was having on their archery performance.
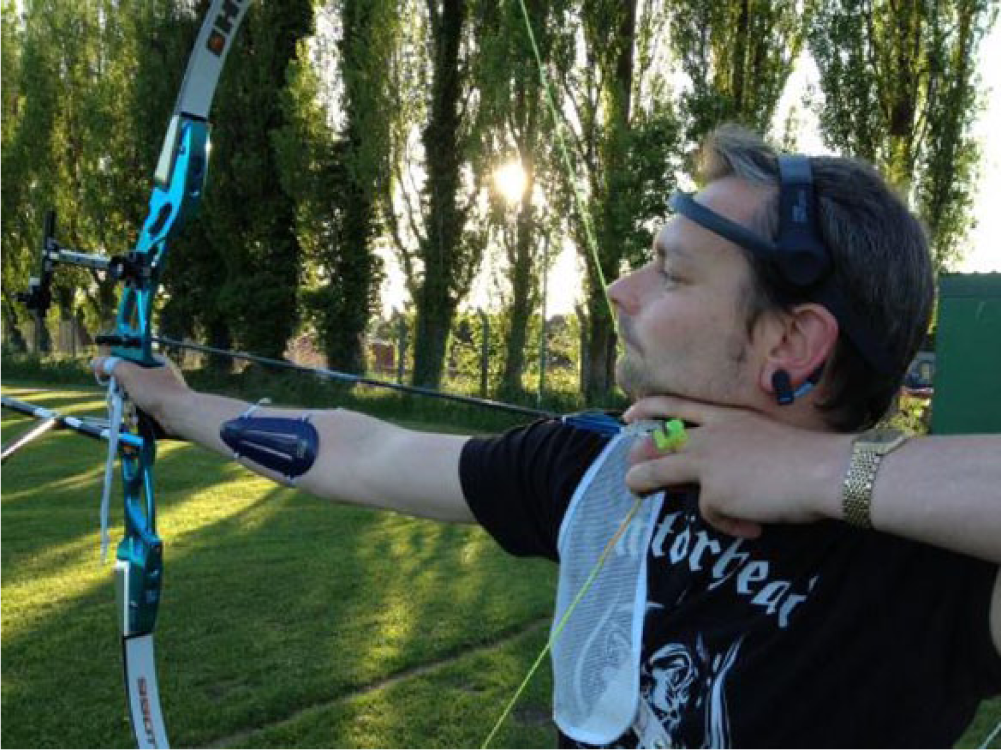
Subject wearing the EEG device while at the aiming phase of the shot
The phases of shooting an arrow are as follows:
Set-up
Draw
Aim
Release
Follow through
Data were collected from the archers using the EEG device during the different phases of the shot along with corresponding images of the archer at a frequency of 30 Hz. Data were captured wirelessly to a laptop in real time and stored for processing. A block diagram of the system is shown in Figure 2 .
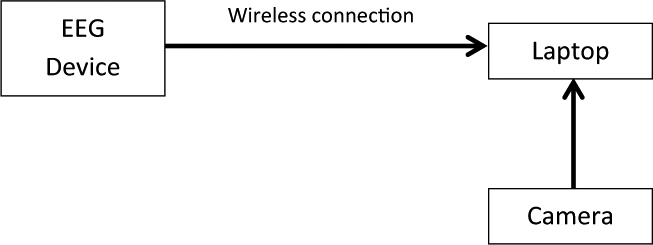
Block diagram of the capture system
Figure 3 shows a brainwave activity map where the magnitude of a particular brainwave band is indicated by the radius from the origin and the frequency of the brainwave is related to the angle around the map. This provides a simple visual indicator of the brain activity at any time.
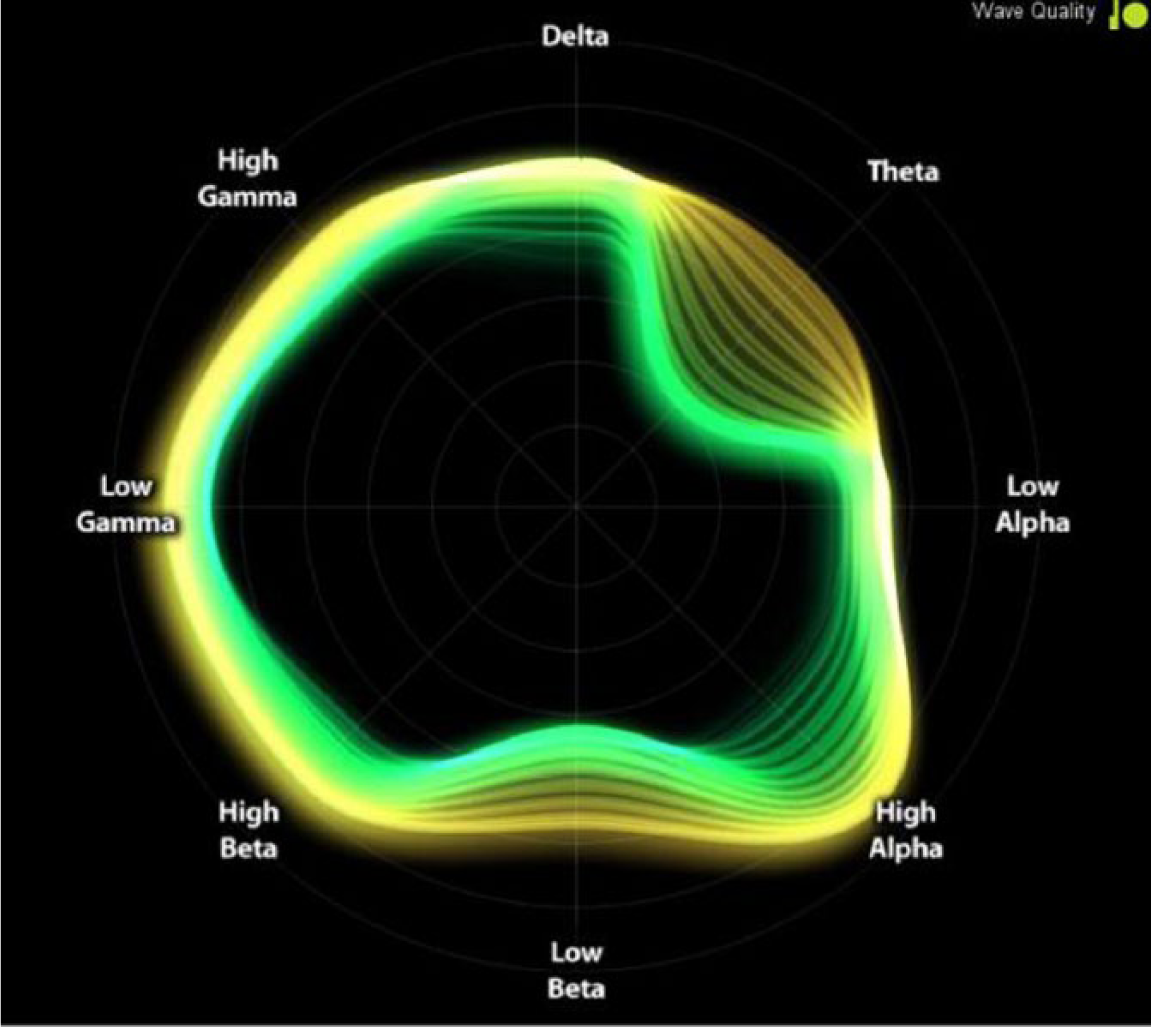
Image of brainwave activity map
Data sets were divided into individual shots for each archer. The data collected from the EEG device were then traced with the captured images for brainwave exploration at landmark points within the shot. Data samples were then analysed for repeatability, and dominant brainwave characteristics of each archer were compared at the landmark points within the shot.
III. Results
The results of the preliminary tests are shown in the line graphs below plotting the percentage levels of attention against samples being taken at 1/10th of a second (10 Hz) from the EEG device. The data in Figures 4 – 7 show the basic proprietary signals of ‘Attention’ and ‘Relaxation’ provided by the NeuroSky headset. The data in Figures 8 – 13 show graphs of individual brainwave bands – alpha, beta and delta.
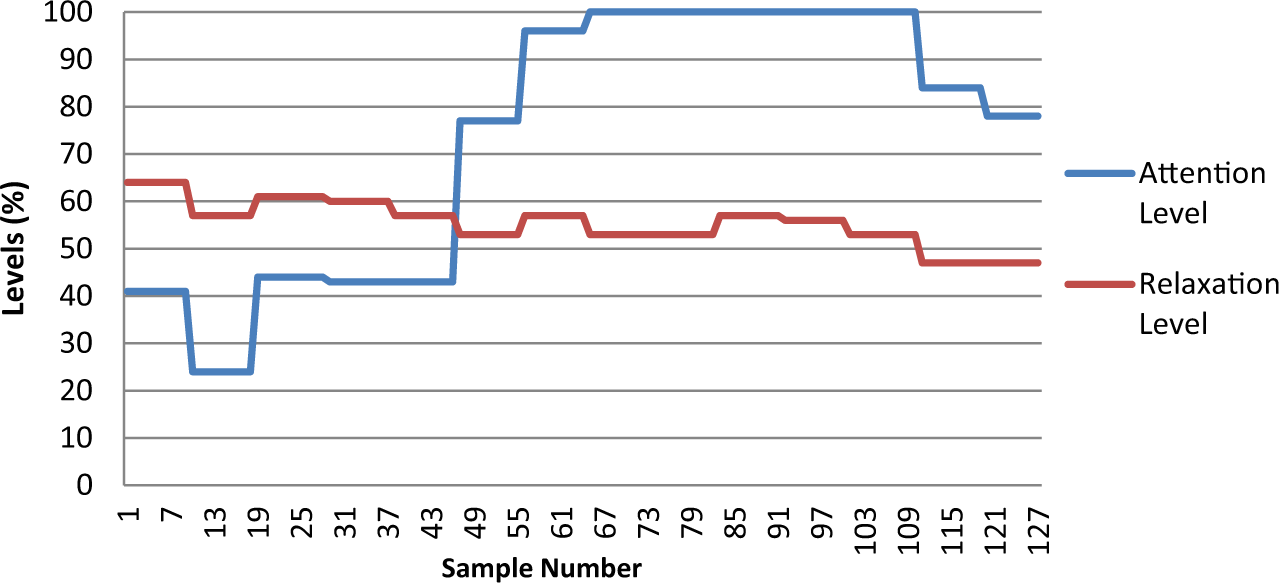
Attention and relaxation levels of subject A, shot 1
Attention and relaxation levels of subject A, shot 2
Attention and relaxation levels for subject B, shot 1
Attention and relaxation levels for subject B, shot 2
Alpha levels for subject A, shot 1
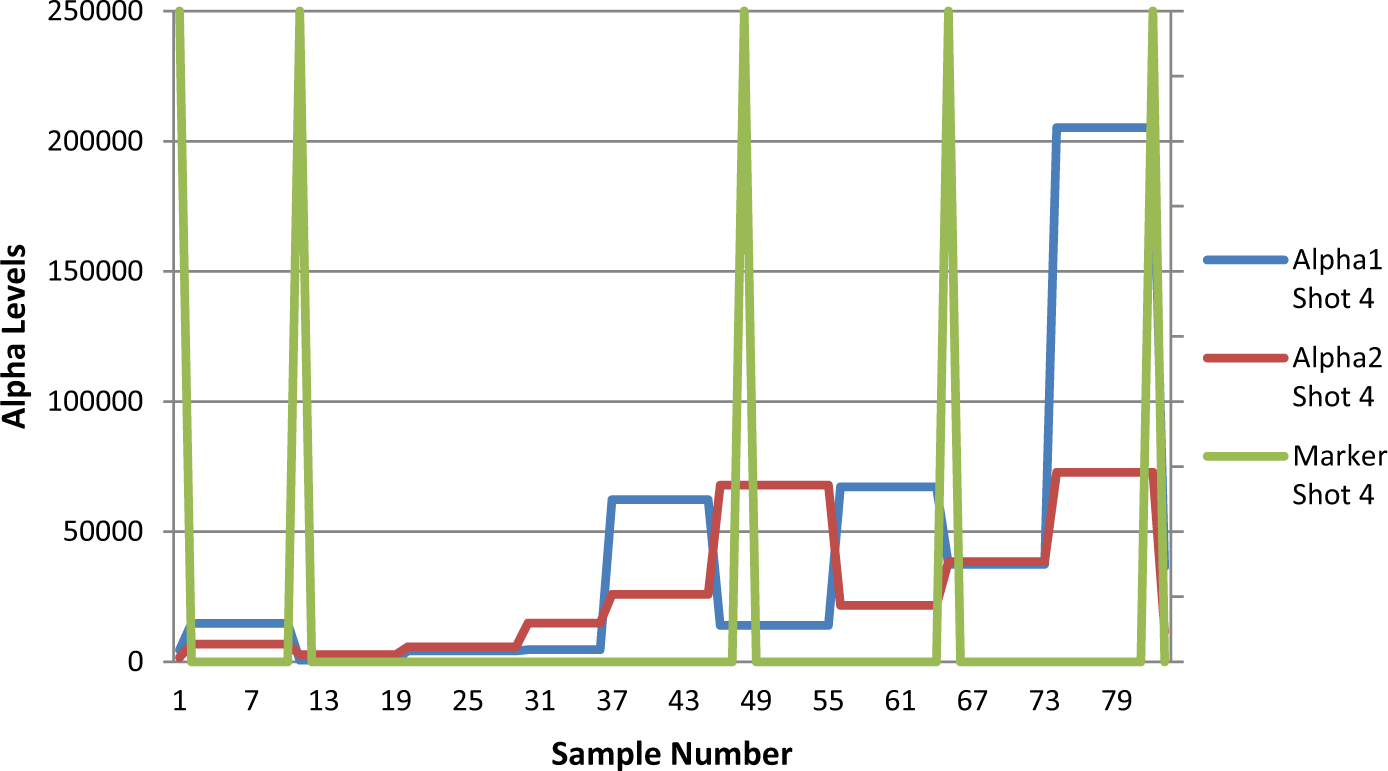
Alpha levels for subject A, shot 4
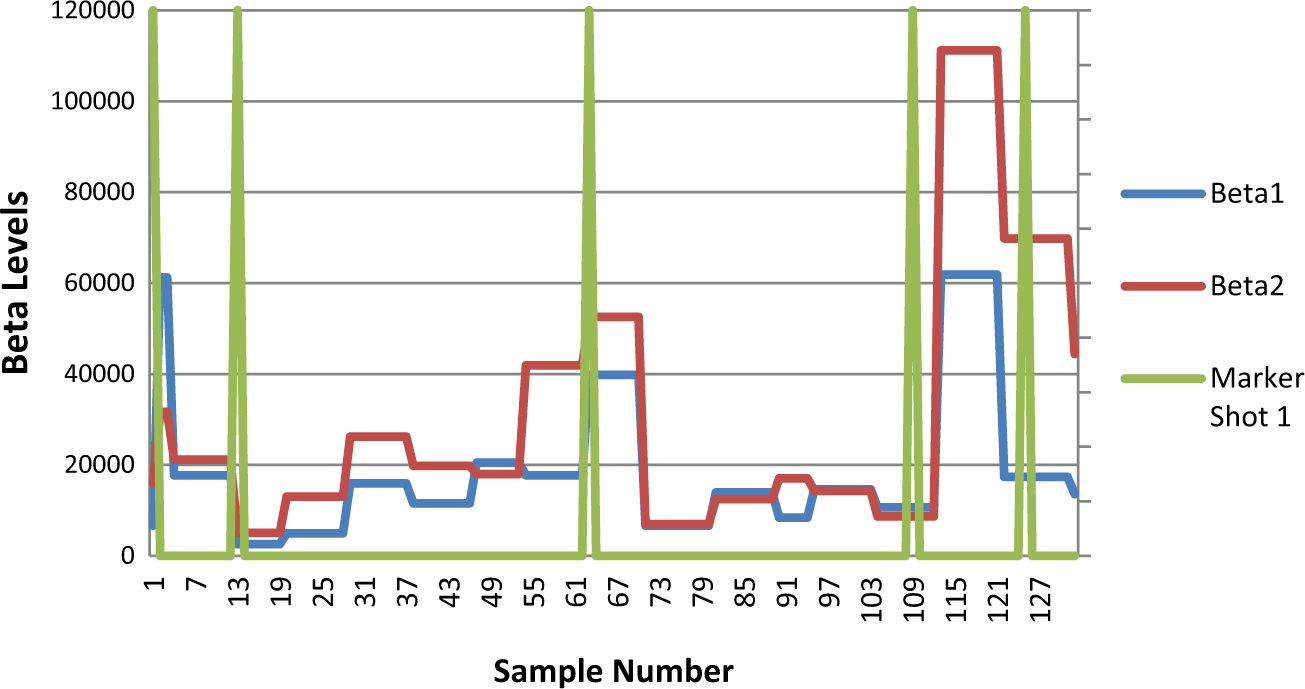
Beta levels for subject A, shot 1
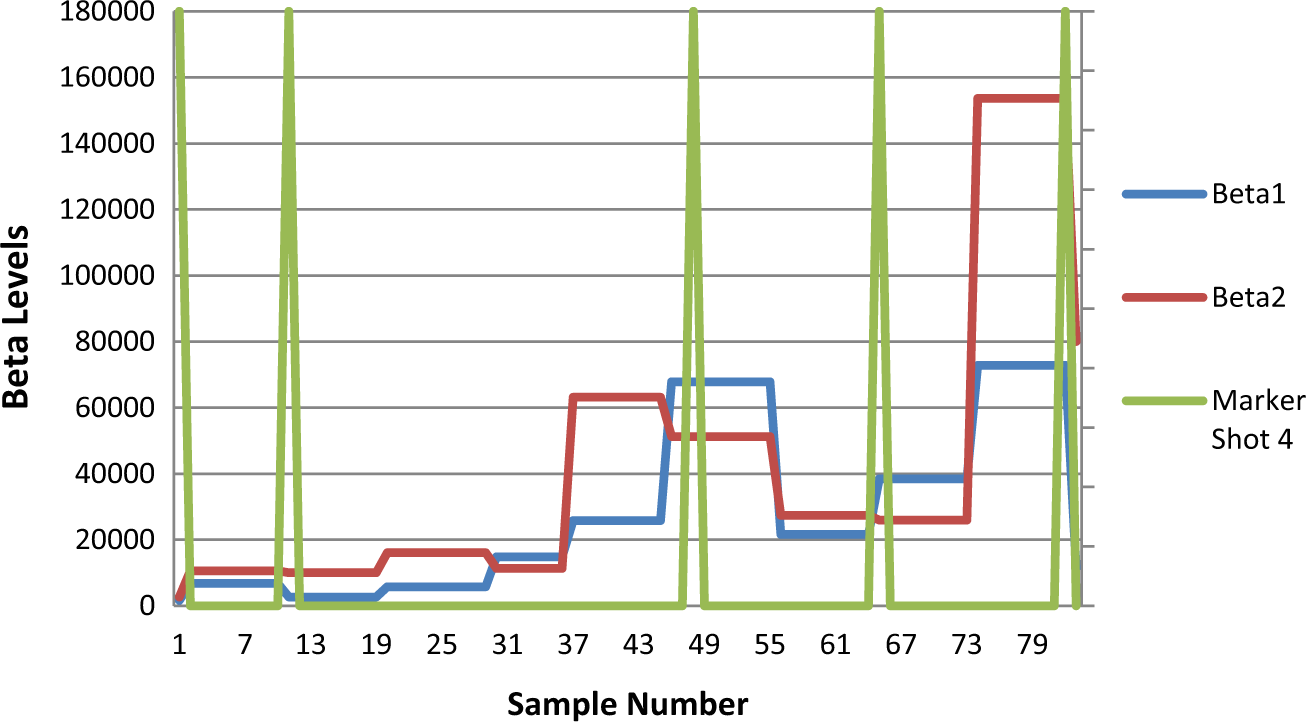
Beta levels for subject A, shot 4
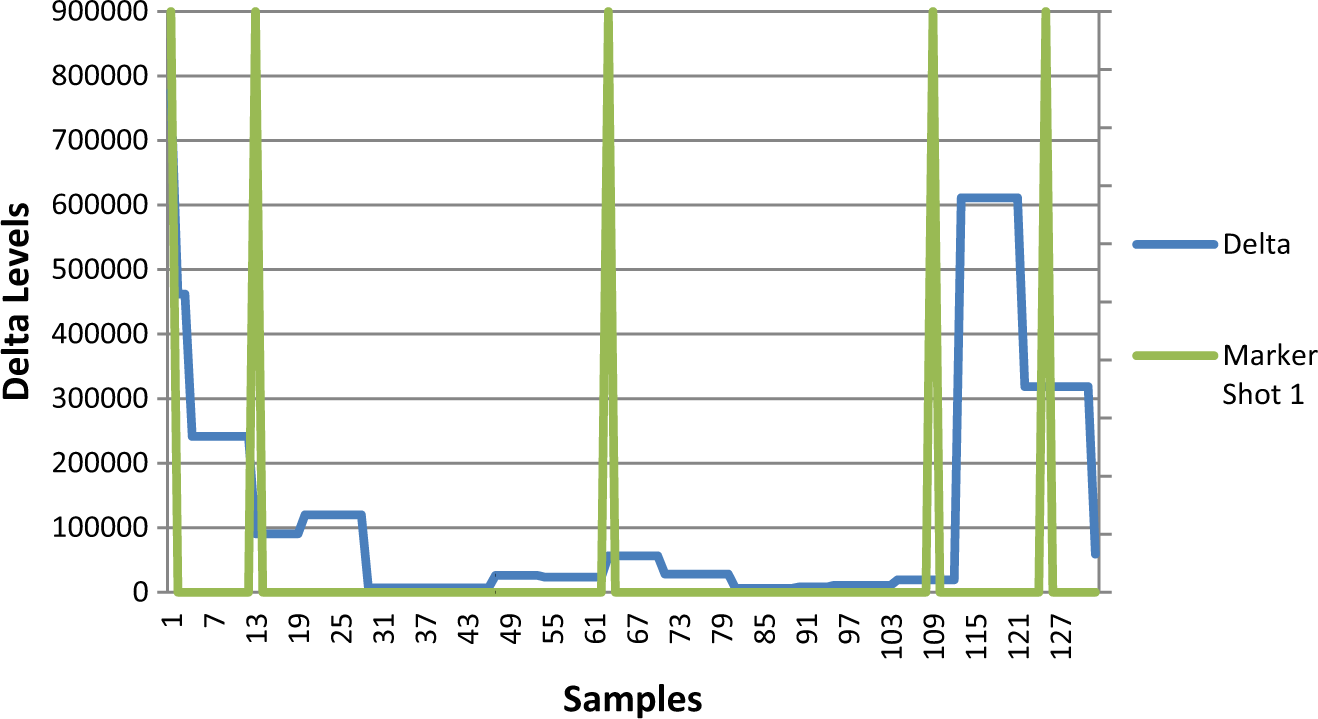
Delta levels for subject A, shot 1
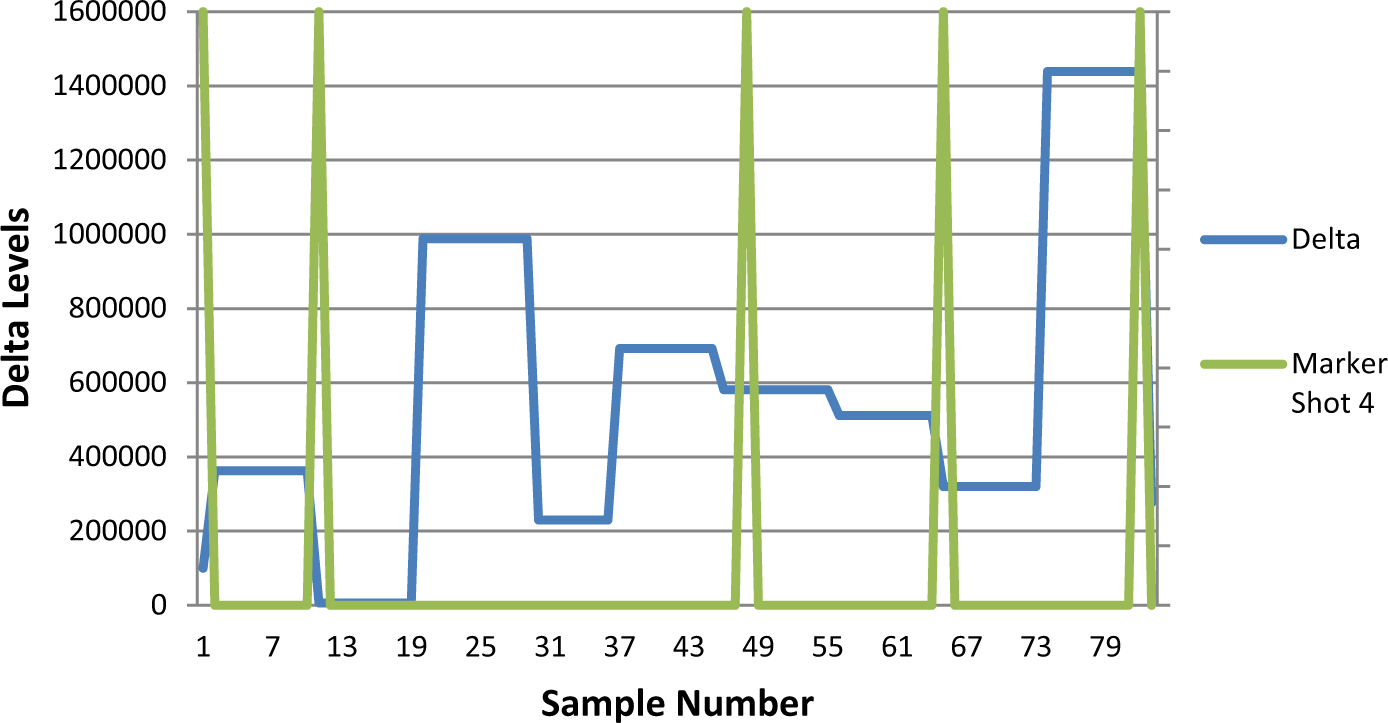
Delta levels for subject A, shot 4
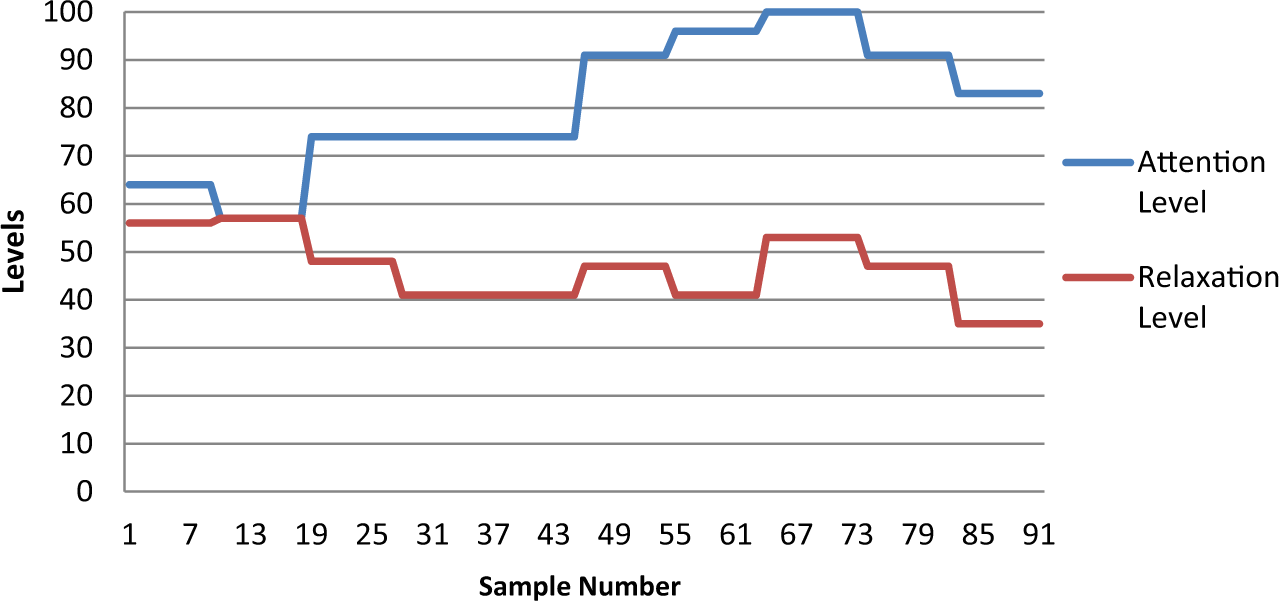
The sample results presented in Figures 4 and 5 show the attention and relaxation levels of subject A for two archery shots; archer A considered that shot represented by the data in Figure 4 was good and shot that produced the data for Figure 5 was not so good. The data are presented from the drawing phase of the shot, into the aiming and the release of the arrow. The results show a similar pattern and levels for both shots for subject A with regards to the attention and relaxation plots. During the shot process, the attention level raises and peaks at 100% from the full draw – samples 65–109 for Figure 4 and samples 46–72 for Figure 5 until the release of the string. The relaxation levels of subject A decrease slightly during the shot but remain within the 35%–65% levels for both shots. The other eight data samples for this archer are remarkably similar, with high repeatability characteristics.
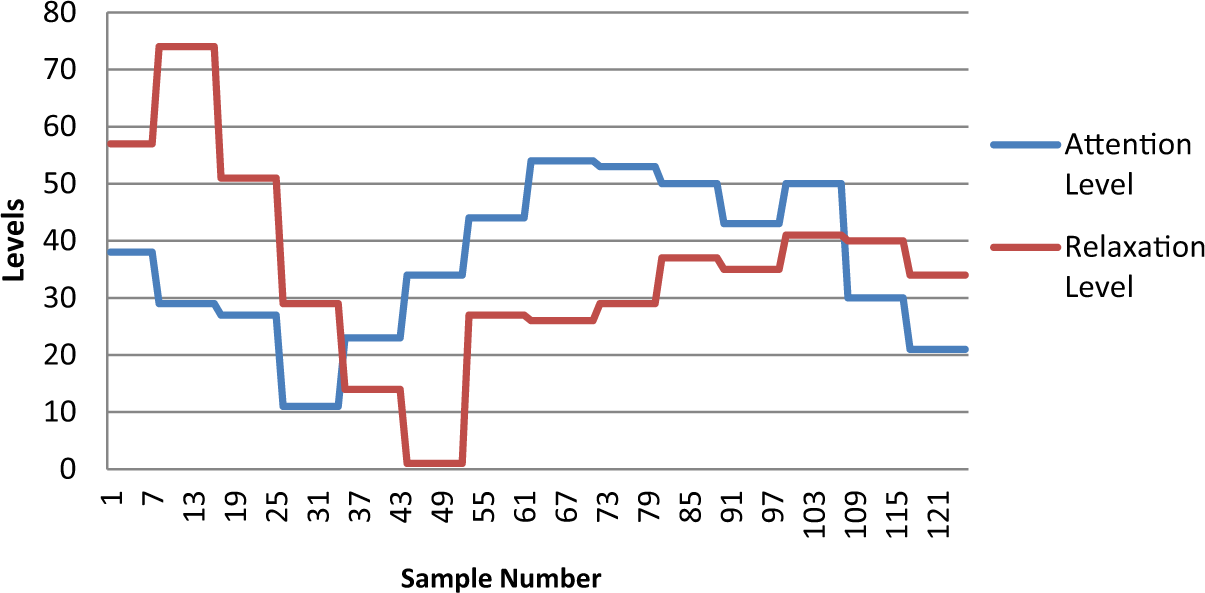
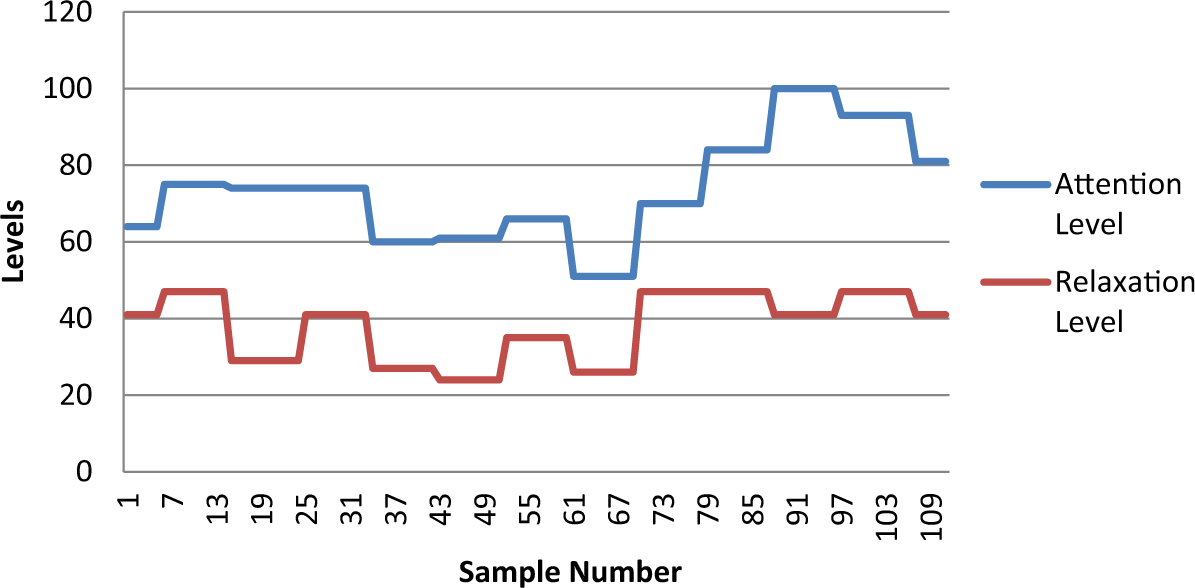
Figures 6 and 7 show the results for subject B over two shots; these two shots were chosen as examples as archer B’s shot for the data in Figure 6 was less than perfect and the shot made represented by the data in Figure 7 was perfect. While the patterns for subject B differ in the overall levels compared to subject A, the data still indicate reasonable repeatability during the shot. The levels for attention increase during the aiming phase of the shot – samples 45–106 for Figure 5 and samples 49–93 for Figure 7 .
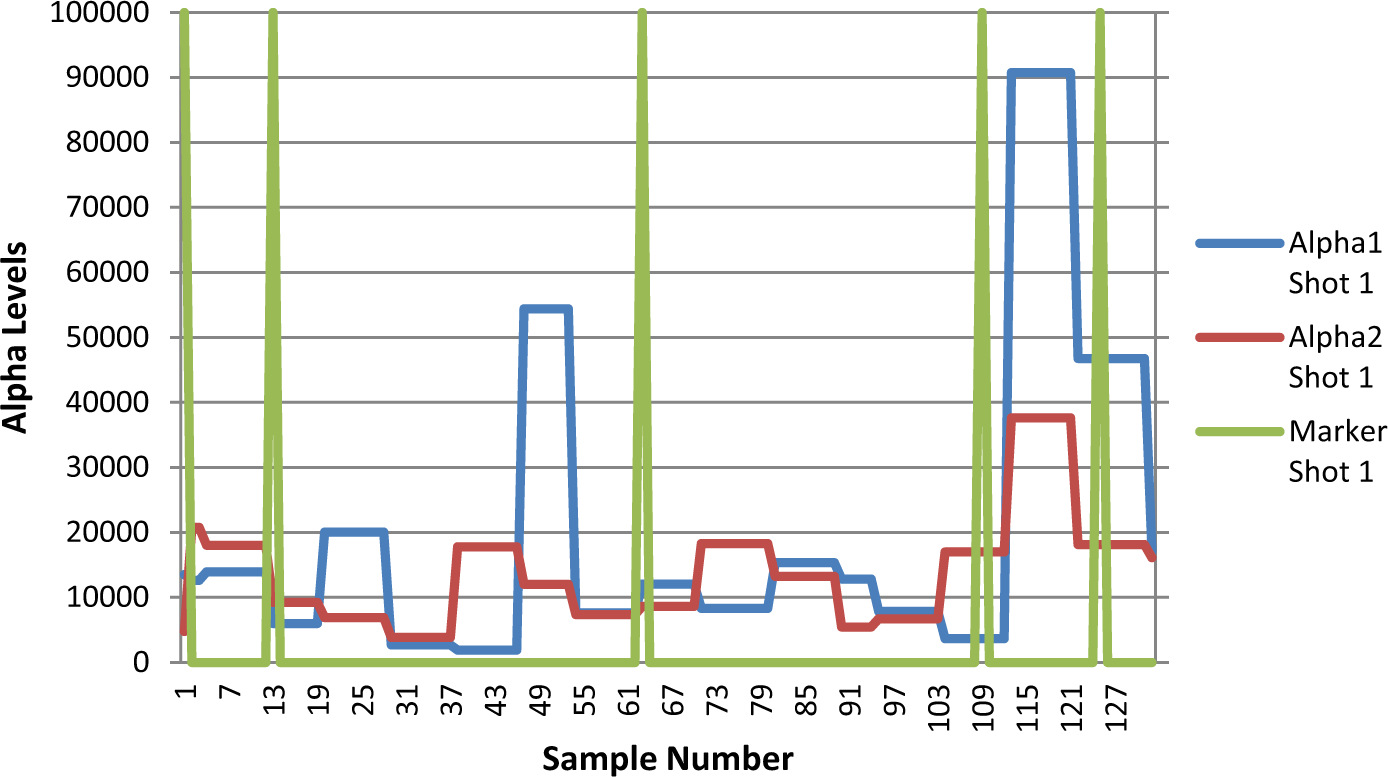
Figures 8 and 9 show the comparison between the alpha frequency bands for shots 1 and 4 for subject A. In addition to the alpha levels measured during the shots, the green trace of the plots shows the distinct phases within the shot starting with the set-up; for Figure 8 , samples 1–13, draw; samples 12–64, aim; samples 61–109, release of the arrow; samples 109 and the follow through of the shot, samples 110–126. The markers are plotted on further graphs to illustrate the brain activity for the distinct phases of the shot cycle.
The graphs show a distinct pattern for both the shots with alpha 1 levels increasing after the release phase and into the follow through.
As with the alpha levels for the selected shots, the beta plots are similar showing lower activity during the pre-release shot phases and increasing after the arrow has been released.
Figures 12 and 13 show the delta activity for subject A for shots 1 and 4, as with the alpha and beta plots the delta activity distinctly increases after the release of the arrow for both shots although within shot 4 there is more delta activity during the draw and aim phase when compared to shot 1.
IV. Discussion
This preliminary study recorded the brainwaves of two experienced archers, while undertaking the process of aiming and shooting arrows at a target. Brainwaves have been analysed for repeatability and dominant characteristics within individual EEG activity. Images of the archers were also recorded to establish reference points within the shot cycle for correlating the EEG data sets. The results have shown that there are repeatable patterns, which emerge in brainwave activity obtained from the EEG device for each subject during the distinct phases of the shot cycle. The patterns also show distinct differences between the two subjects over the shot cycle with subject A attaining higher attention levels during the aiming process than subject B. The results of the alpha and beta activities during the shot cycles for subject A also show a repeatable pattern with an increase in activity at these frequency bands when the arrow is released; this is also evident for the delta waves. The delta wave plots also show a difference between the two shots with more activity in the delta frequencies during the draw and aim phase. It must be noted that within this small, preliminary test, no correlation calculations were carried out between the results of the EEG plots and the resultant scores of the arrow at the target. This may be the notable difference in levels for subject B between the two shots with Figure 6 being a less than perfect shot, noted by the lower attention levels and Figure 7 being a good shot for the subject, again noted by the higher attention levels found within the results. This proposal may also be applied to subject A with Figure 4 attaining a sustained, higher attention level than the plot within Figure 5 and for the difference in delta activity of subject A shown within Figures 12 and 13 . It is envisioned that by monitoring the brainwaves of a subject during a high volume of shots and noting how the subject ‘felt’ the shot went, an ideal pattern would emerge that corresponded to ‘good’ shots. This pattern can then be used for training purposes, allowing the subject to perform a repeatable pattern to maximise performance. The system could also be expanded to include other biometric monitoring to explore the effect of additional pressure on the archer, such as in a head-to-head match, and how this influences brain activity.
Footnotes
Funding
This research received no specific grant from any funding agency in the public, commercial, or not-for-profit sectors.